iowa’s bridge sensor rating curve - asfpm · iowa’s bridge sensor rating curve ... slope &...
TRANSCRIPT

1
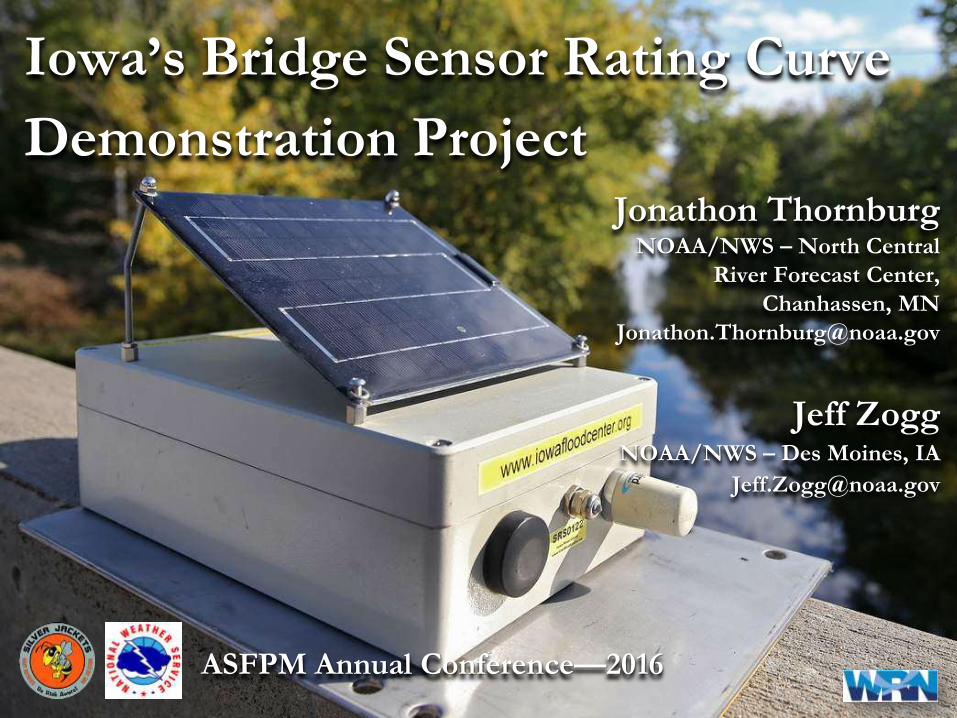
Iowa’s Bridge Sensor Rating Curve
Demonstration ProjectJonathon Thornburg
NOAA/NWS – North Central
River Forecast Center,
Chanhassen, MN
Jeff ZoggNOAA/NWS – Des Moines, IA
ASFPM Annual Conference—2016
2
Outline
History/Motivation
Project & Methodology
Looking Ahead
NWS Des Moines, Iowa office

3
History/Motivation
Flooding is Iowa’s #1 weather-related hazard.
~80% of all Presidential disaster declarations.
Ranks #2 in U.S. for flood-related losses.
Flooding & related impacts occurring more
frequently in Iowa.
Floods in Iowa can be devastating.
2008 – $11 billion/
40,000 people.
1993 – $14 billion/
300,000 people.
Iowa River at Oakville, Iowa (June 2008) –
Courtesy Des Moines Register

4
History/Motivation
Post-2008 Flood: Iowa Flood Center Created
2009 Iowa Legislation, House File 822. Purposes:Develop hydrologic models for physically based flood frequency
estimation & real-time forecasting of floods, including hydraulic
models of flood plain inundation mapping.
Establish community-based programs to improve flood monitoring &
prediction along Iowa's major waterways & to support ongoing flood
research.
Share resources & expertise of Iowa Flood Center.
Assist in development of a workforce in the state, knowledgeable
regarding flood research, prediction & mitigation strategies.
Iowa Flood Center Organizational Structure

5
History/Motivation
Post-2008 Flood: Additional Activities
2013 Iowa Hazard Mitigation Plan: Objective 5.
Mitigation Measure – Establish procedures, installation,
networks, response teams & equipment necessary to issue
warnings, alert officials, emergency personnel & inform the
public & ensure they are in place & operational.
Iowa Governor’s 2014 Long Term Recovery Task Force.
Significant state investment in flood risk communication &
planning tools.
Subsequent Need for Dense Network
of Stage + Discharge Streamgages.
Cedar River at Cedar Rapids, Iowa (June 2008) –
Courtesy Iowa Civil Air Patrol
6
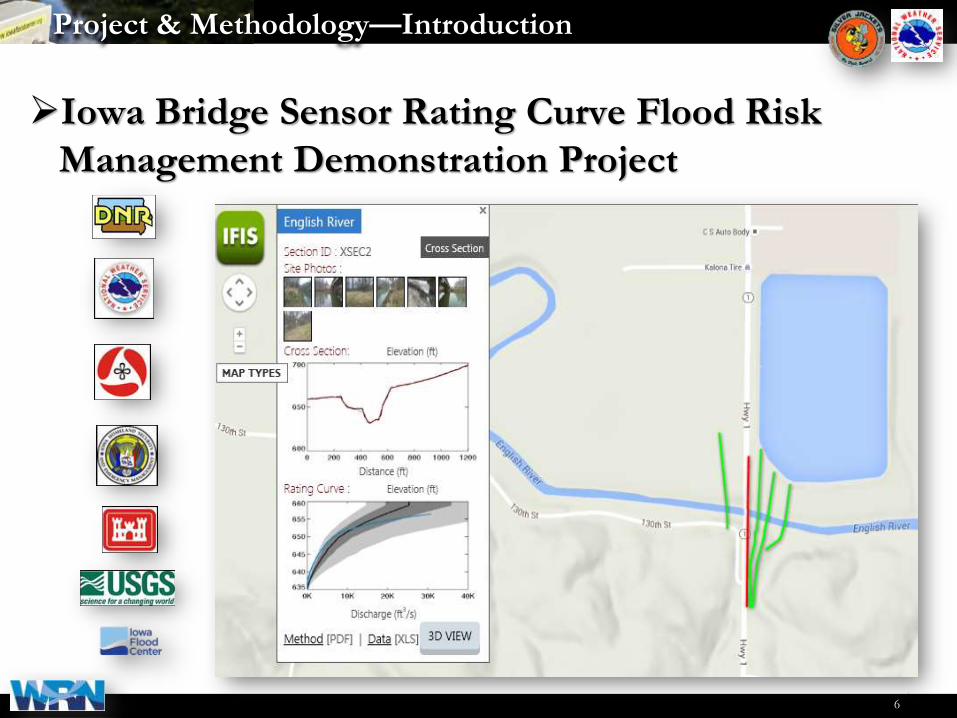
Project & Methodology—Introduction
Iowa Bridge Sensor Rating Curve Flood Risk
Management Demonstration Project

7
Project & Methodology—Project Purpose
This Study Documents:
Field survey data collection methods.
Procedures, hydrology & hydraulic analyses.
Development of bridge sensor rating curve
methodology.
Product strengths & limitations.
Peer review.
Evaluation of rating curve products.
Implementation costs.
Anticipated use of bridge sensor rating
curve methodology.

8
Project & Methodology—Project Purpose
IFC bridge sensor data supplements established
streamgages. It does not replace high-quality
established streamgage data from USGS or other
partners.
Ames/Iowa State University (August 2010) –
Courtesy Des Moines Register

9
Project & Methodology—Project Purpose
Project Partners Roles & Responsibilities
USACE: Bi-monthly team meetings, site channel section
data collection & processing, project documentation &
reporting.
IFC: Web support, rating curve development
methodology & analysis.
USGS: Technical methodology oversight.
Iowa DNR, HSEMD & NWS: Workgroup oversight.
All project partners: Project product &
independent peer review members.
Timeline: March 2015 – October 2016
(Phases I & II).
10
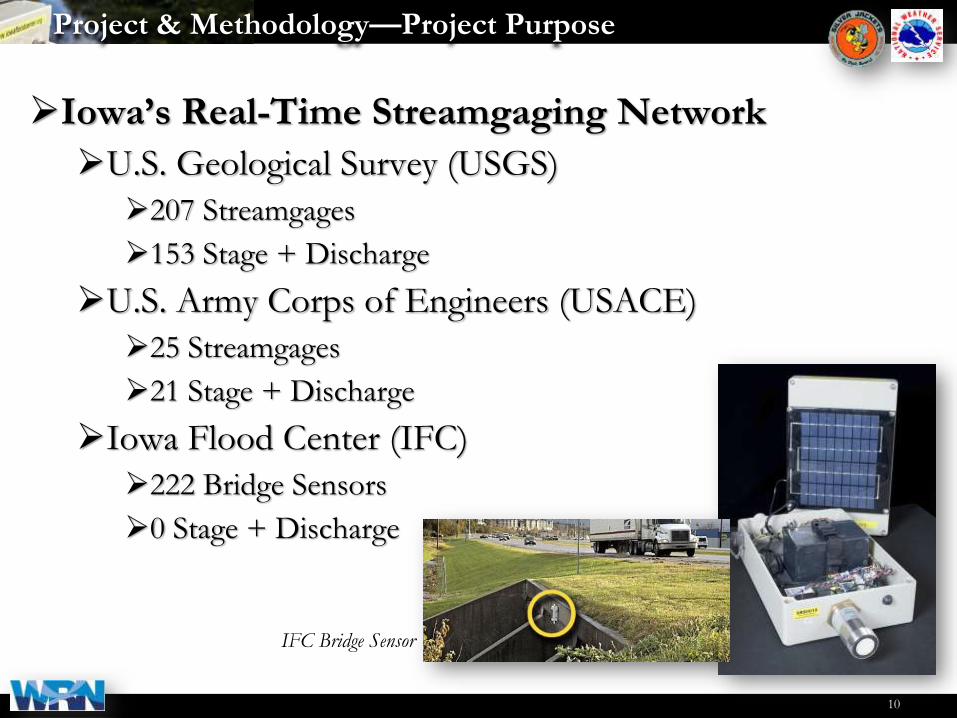
Project & Methodology—Project Purpose
Iowa’s Real-Time Streamgaging Network
U.S. Geological Survey (USGS)
207 Streamgages
153 Stage + Discharge
U.S. Army Corps of Engineers (USACE)
25 Streamgages
21 Stage + Discharge
Iowa Flood Center (IFC)
222 Bridge Sensors
0 Stage + Discharge
IFC Bridge Sensor

11
Real-Time Streamgages in Iowa

12
Project & Methodology—Introduction
IFC bridge sensor site selection criteria
Identification of collocated IFC bridge sensor / USGS
streamgage sites.
Drainage area, stream slope, period of record.
Proximity to minimize survey crew travel time.
Recent existing HEC-RAS model availability.
Iowa River at Marshalltown, Maquoketa River at Manchester,
Fourmile Creek at Des Moines, Indian Creek at Marion.
Additional sites added on ad-hoc
basis based on desirability.
Great Flood of 1993 – Des Moines, Iowa (July 1993) –
Courtesy Des Moines Water Works

13
Project & Methodology—Phase I Locations
MarshalltownAmes
Des Moines
Marion
Kalona

14
Project & Methodology—Phase II Locations
Oxford
Manchester
Stratford
Colfax
Van Meter
15
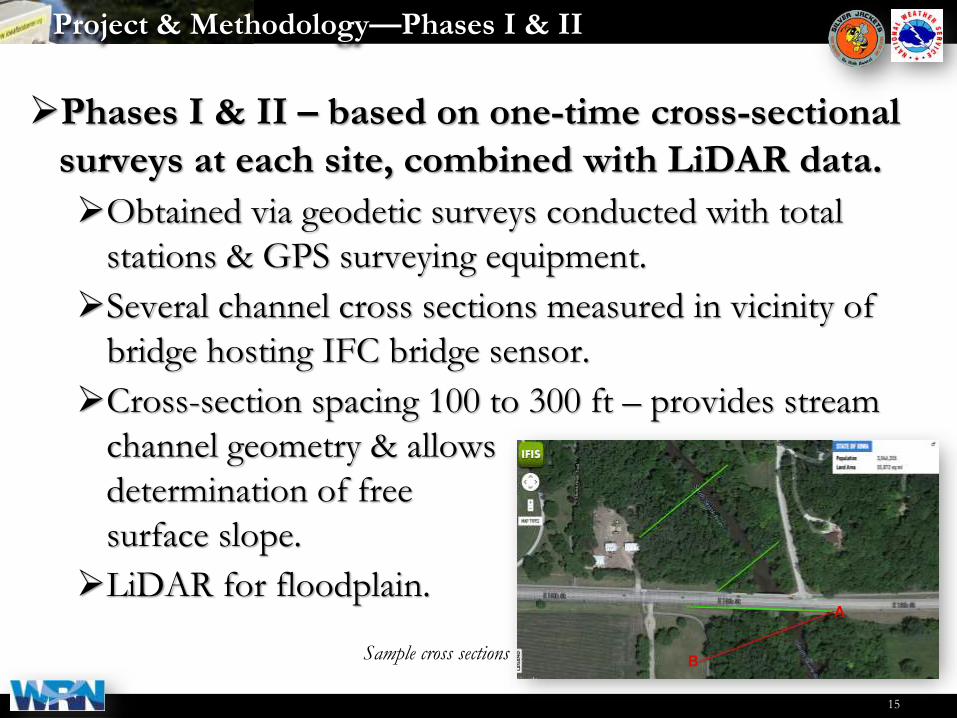
Project & Methodology—Phases I & II
Phases I & II – based on one-time cross-sectional
surveys at each site, combined with LiDAR data.
Obtained via geodetic surveys conducted with total
stations & GPS surveying equipment.
Several channel cross sections measured in vicinity of
bridge hosting IFC bridge sensor.
Cross-section spacing 100 to 300 ft – provides stream
channel geometry & allows
determination of free
surface slope.
LiDAR for floodplain.A
BSample cross sections

16
Project & Methodology—Phase I
Phase I
Uses slope-area method.
Manning's Equation used at one cross section.
Q = discharge (ft3/s)
Hr = hydraulic radius (ft) of cross section
A = area of cross section (ft2)
S = slope of water surface
n = Manning’s coefficient, a measure of
channel roughness
Hr, A & Q depend on direct stage d
Manning’s Equation
2011 Missouri River flood

17
Project & Methodology—Phase I
Phase I (cont’d)
Slope & roughness values for rating curve based on
values found during survey.
Slope values
Water surface slopes along left & right banks measured during
geodetic survey.
Consistency of slope estimation along the reach analyzed by selecting
various cross section combinations for slope calculations (i.e., cross
section 1 & 2, 1 & 3, 1 & 4, etc.).
Most cases: first & last cross sections
used for slope due to good consistency
among different cross section slope
measurements.
Bankline profiles used for free-surface slope estimation

18
Project & Methodology—Phase I
Phase I (cont’d)
Slope & roughness values for rating curve based on
values found during survey.
Roughness values
Channel
Set between 0.03 & 0.045 – based on collective experience of
project partners of Iowa stream characteristics.
Overbank
Fixed values for each bank based on survey photos &
observations, combined with
USGS (1989) classifications.
North Raccoon River near Perry, Iowa (August 2010) –
NWS Des Moines

19
Project & Methodology—Phase I
Phase I (cont’d)
Monte Carlo simulation of varying roughness & slope to
determine range of possible discharges at each elevation.
Random sample of 100 value pairs used from population of
10,000 Monte Carlo simulations for each location.
Random Sample of 100 out of 10,000 values of
Manning’s coefficient & slopes used for Monte
Carlo simulation
20
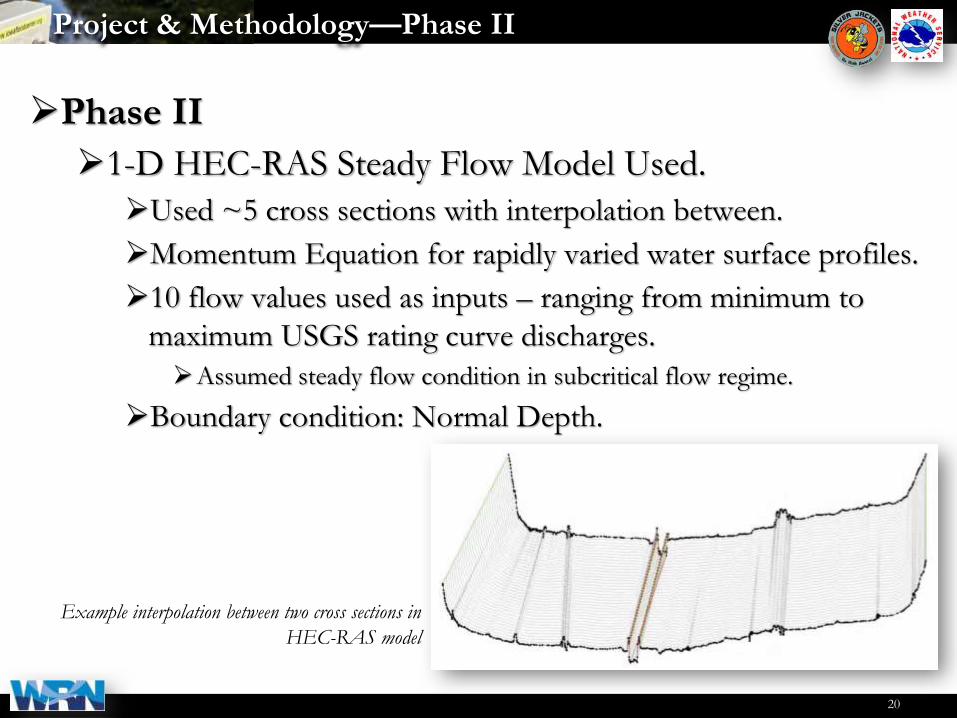
Project & Methodology—Phase II
Phase II
1-D HEC-RAS Steady Flow Model Used.
Used ~5 cross sections with interpolation between.
Momentum Equation for rapidly varied water surface profiles.
10 flow values used as inputs – ranging from minimum to
maximum USGS rating curve discharges.
Assumed steady flow condition in subcritical flow regime.
Boundary condition: Normal Depth.
Example interpolation between two cross sections in
HEC-RAS model

21
Project & Methodology—Phase II
Phase II (cont’d)
Slope values
Similar to process used in Phase I.
Roughness values
Channel
Similar to process used in Phase I – set between 0.03 & 0.045.
Overbank
Fixed values for each bank based
on National Land Cover
Database.
GIS reclassification used, based
on Liu & De Smedt (2004).
Ames/Iowa State University (August 2010) –
Courtesy Des Moines Register

22
Project & Methodology—Phase II
Phase II (cont’d)
Roughness values
Setup of Manning’s coefficients over HEC-RAS cross-section.
Value for channel ranges between 0.03 & 0.045.
Overbank values obtained from National Land Cover
Database & reclassification
Manning’s coefficient derived from National Land Cover
Database map

23
Project & Methodology—Phase II
Phase II (cont’d)
Monte Carlo simulation of varying roughness & slope to
determine range of possible discharges at each elevation.
Similar to process used in Phase I – Random sample of 100
value pairs used from population of 10,000 Monte Carlo
simulations for each location.
Iowa Hwy 92 – Muchakinock Creek near
Oskaloosa, Iowa (August 2010) – NWS Des Moines

24
Project & Methodology—Results
Example Results from Monte Carlo Simulation
Blue Line: USGS Rating Curve
Black Line: Median Experimental Rating Curve
Light Grey: 0 & 100th percentiles
Dark Grey: 25th & 75th percentiles

25
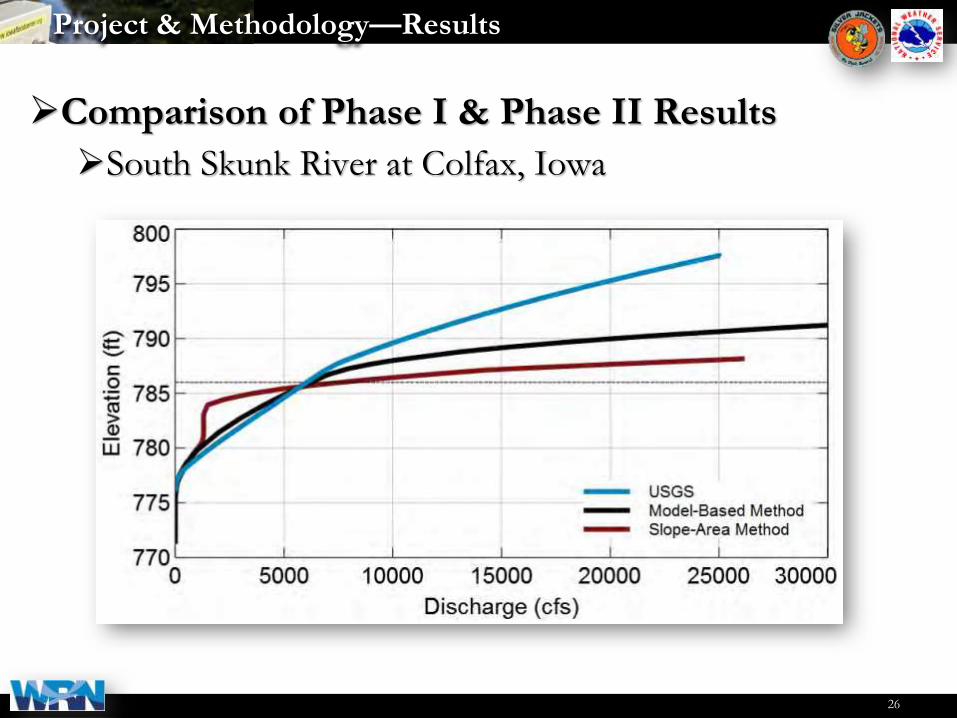
Project & Methodology—Results
Comparison of Phase I & Phase II Results
Clear Creek at Oxford, Iowa
26
Project & Methodology—Results
Comparison of Phase I & Phase II Results
South Skunk River at Colfax, Iowa

27
Project & Methodology—Results
Comparison of Phase I & Phase II Results
Raccoon River at Van Meter, Iowa

28
Project & Methodology—Results
Comparison of Phase I & Phase II Results
Des Moines River at Stratford, Iowa

29
Project & Methodology—Results
Comparison of Phase I & Phase II Results
Maquoketa River at Manchester, Iowa

30
Project & Methodology—Results
Comparison of Phase I & Phase II Results
31
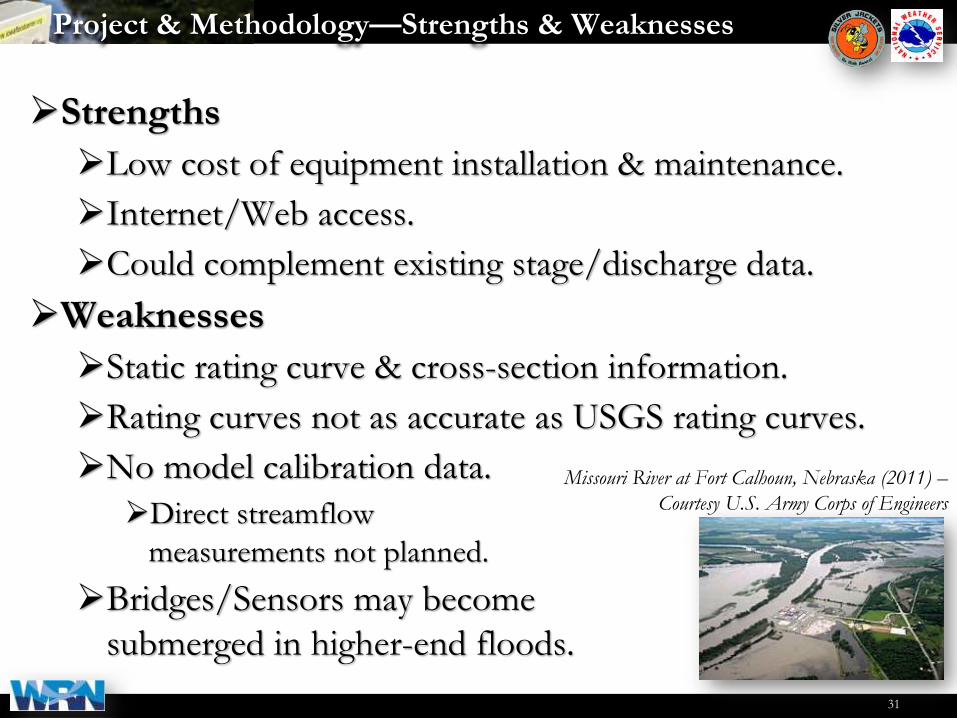
Project & Methodology—Strengths & Weaknesses
Strengths
Low cost of equipment installation & maintenance.
Internet/Web access.
Could complement existing stage/discharge data.
Weaknesses
Static rating curve & cross-section information.
Rating curves not as accurate as USGS rating curves.
No model calibration data.
Direct streamflow
measurements not planned.
Bridges/Sensors may become
submerged in higher-end floods.
Missouri River at Fort Calhoun, Nebraska (2011) –
Courtesy U.S. Army Corps of Engineers

32
Project & Methodology—Costs
Estimated Cost Per IFC Bridge Sensor
Task Responsible
Agency
Cost
IFC Bridge Sensor Deployment IFC $2,500
Field Survey [4 or 5 channel cross-sections] USACE $2,500
HEC-RAS Model Development USACE $1,000
Application of Rating Curve Method / IFIS Posting IFC $1,500
COST PER BRIDGE SENSOR/RATING CURVE $7,500

33
Project & Methodology
Conclusions & Recommendations
Bridge sensor rating curve methodology is a resource of
flow data to supplement established streamgage data.
Methodology & products not intended to replace
established streamgage data.
Products have potential to provide water level & flow
information at locations currently not served by
established streamgages.
Best applied to below bankfull stages.
U.S. Hwy 6 – Cedar River near Atalissa, Iowa (June 2008) –
Courtesy Iowa DOT

34
Project & Methodology—Conclusions/Recommendations
Conclusions & Recommendations (cont’d)
Counties & communities using IFC Iowa Flood
Information System (IFIS) Website accept & understand
limitations to accuracy of information provided by IFIS
& bridge sensor rating curves.
Streamflow measurements & channel cross-section
geometry must be periodically verified.
Iowa River at Wapello, Iowa (July 1993) –
Courtesy Des Moines Register

35
Project & Methodology—Conclusions/Recommendations
Conclusions & Recommendations (cont’d)
Online availability of data, where no other data is
available, allows flood response teams to use their
limited time/resources more efficiently rather than
repetitive, time-consuming field reconnaissance in
anticipation of an impending high water flood event.
Cedar River at Waterloo, Iowa (June 2008) –
Courtesy Waterloo-Cedar Falls Courier

36
Looking Ahead
Raises Flood Risk Awareness
Pending confirmation of rating curve methodology &
peer review, public will also be able to view flow through
IFIS Website (stage is already available).
IFC Bridge Sensor data (measured stage & calculated
flow) can enhance risk communication, evacuation
planning & inform flood response personnel.
Application of rating curve
methodology at non-USGS
collocated locations.
Cedar River at Cedar Rapids, Iowa (June 2008) –
Courtesy Scott Olson/Getty Images

37
For More Information
Websites
Iowa Flood Center
http://iowafloodcenter.org/
Iowa Silver Jackets
http://silverjackets.nfrmp.us/State-Teams/Iowa
Iowa River at Columbus Junction, Iowa (June 2008)

38
For More Information
References Liu, Y.B. and De Smedt, F. 2004. “WetSpa Extension, A GIS-based Hydrologic
Model for Flood Prediction and Watershed Management.” Vrije Unversiteit
Brussel.
USGS, 1989. “Guide for selecting Manning’s Roughness Coefficients for
Natural Channels and Flood Plains.” USGS WSP 2339.
39
Iowa’s Bridge Sensor Rating Curve
Demonstration ProjectJonathon Thornburg
NOAA/NWS – North Central
River Forecast Center,
Chanhassen, MN
Jeff ZoggNOAA/NWS – Des Moines, IA
ASFPM Annual Conference—2016