iowa seat belt use survey 2017 data collection methodology
TRANSCRIPT

1
Iowa Seat Belt Use Survey 2017 Data Collection Methodology Report
August 31, 2017
Prepared by
JM Larson, JR Fox, E Berg Iowa State University
Center for Survey Statistics & Methodology
IOWA STATE UNIVERSITY OF SCIENCE AND TECHNOLOGY
AMES, IOWA
2
Iowa Seat Belt Use Survey 2017 Data Collection Methodology Report
August 31, 2017
Introduction In an effort to achieve greater consistency and comparability in state-wide seat belt use reporting, the National Highway Traffic Safety Administration (NHTSA) issued new requirements in 2011 for observing and reporting future seat belt use. The requirements included the involvement of a qualified statistician in the sampling and weighting portions of the process as well as a variety of operational details. The Iowa Governor’s Traffic Safety Bureau contracted with Iowa State University’s Center for Survey Statistics and Methodology (CSSM) (then Survey & Behavioral Research Services) in 2011 to develop the study design and data collection plan for the State of Iowa’s annual survey that would meet the new requirements of the NHTSA. A seat belt survey plan for Iowa was developed by CSSM with statistical expertise provided by Zhengyuan Zhu, Ph.D., Professor of Statistics at Iowa State University and Director of the Center for Survey Statistics and Methodology. The plan was approved by NHTSA on March 19, 2012 and implemented for five years, in the summers of 2012-2016. As required by NHTSA, the Iowa plan was revised in the fall of 2016. Dr. Emily Berg, Assistant Professor of Statistics at Iowa State University, followed the protocol of the approved plan and redrew the counties and road segments to be used for future data collection. After examining current county data relating to fatalities, vehicle miles traveled, and other relevant factors, she sampled 15 counties (as in 2012) but increased the number of sampled road segments from 75 to 84. Six of the 15 counties used in 2012-2016 were also selected for the new plan; nine counties were different. As in Iowa’s 2012 plan, five road segments were sampled from each county; however the new plan increased the number of sampled road segments from Polk County to 14 because of its significantly higher traffic levels. The revised plan was submitted in December of 2016 and approved in March of 2017.
2017 Data Collection The Iowa GTSB has contracted with CSSM on an annual basis to conduct the seat belt use data collection since 2012. The primary contact at the Iowa GTSB in 2017 is Mick Mulhern, Program Administrator/Compliance Officer. The primary contact at CSSM is Janice Larson, Survey Unit Director. The CSSM Seat Belt Survey Project Manager is Jody Fox. The CSSM statistician for the 2017 Seat Belt Survey is Emily Berg, PhD, Assistant Professor of Statistics at Iowa State University. This report describes the data collection process for obtaining 2017 seat belt use data as stipulated by the approved study design. It also includes tables with overall results showing seat belt use in Iowa.
3
Preparation Preparation for the 2017 seat belt use data collection involved several components: verifying the usability of the sampled sites, revising materials for Data Collectors, and notifying appropriate local personnel prior to data collection.
Site Verification.
The Iowa Seat Belt Survey Plan includes 84 road segments or sites sampled for annual observation, with 5 sites in each of 14 sampled counties and 14 sites in Polk County. The sites are identified by MSLINK numbers. CSSM has worked with staff from InTrans, the Iowa State University Institute of Transportation, to obtain data and photographic resources that allowed staff to examine each site remotely for accessibility, safety, and practicality. Because all 84 sites used in 2017 were newly sampled, CSSM staff examined their location carefully and determined that 10 to 12 of the sites were either definitely or possibly not observable. Staff visited several sites to examine possible observation options. Eventually ten of the sites were replaced with comparable road segments that were deemed to be accessible, safe, and practical to observe. These 84 road segments or sites served as the final sample selected for 2017 data collection.
Materials Preparation.
After the 84 sites were finalized, CSSM staff used online maps and Google Earth to identify observation points that would be safe and still provide the visibility necessary to observe seat belt use. The Project Manager checked road construction schedules and, although construction existed in some places, there were no sites that would require an alternate location for that reason. CSSM staff prepared a series of maps for Data Collectors to use as references when traveling to sites. Department of Transportation maps, Google maps, and city maps all served as effective resources. Equipment was procured for use by the Data Collectors, including vests, hats, warning lights, signs, stop watches, and clickers. Data collection forms were printed. Data Collection schedules were prepared for each Data Collector and administrative procedures were documented.
Notification.
Prior to the data collection process, the GTSB representative notified law enforcement personnel in each of the site areas. CSSM staff notified other appropriate city/county and Department of Transportation personnel. The purpose was to ensure that the appropriate people in each site area would be aware of the project and the days and times that Data Collectors would be at work in their area.
Data Collection Staff Training Iowa utilized five data collectors in 2017, responsible for 3-4 counties each. Two new data collectors were hired for 2017 while the other three were experienced, having worked as data collectors for the project in the past. Quality Control functions were filled by the Project Manager and Survey Unit Director. A two-day training was held at CSSM facilities on June 5 & 6, 2017, with field data collection beginning on June 7, 2017. The training included a combination of lecture, classroom and field exercises. Training sessions covered data collection protocols, including how to find the observation sites, choosing an observation location, how to properly collect data, practice in what counts as seat belt “use,” “nonuse,” and “use unknown,” what to do if data cannot be collected at a site due to road construction, weather, or other circumstances, and the appropriate management and submission of collected data. Roadside safety training
4
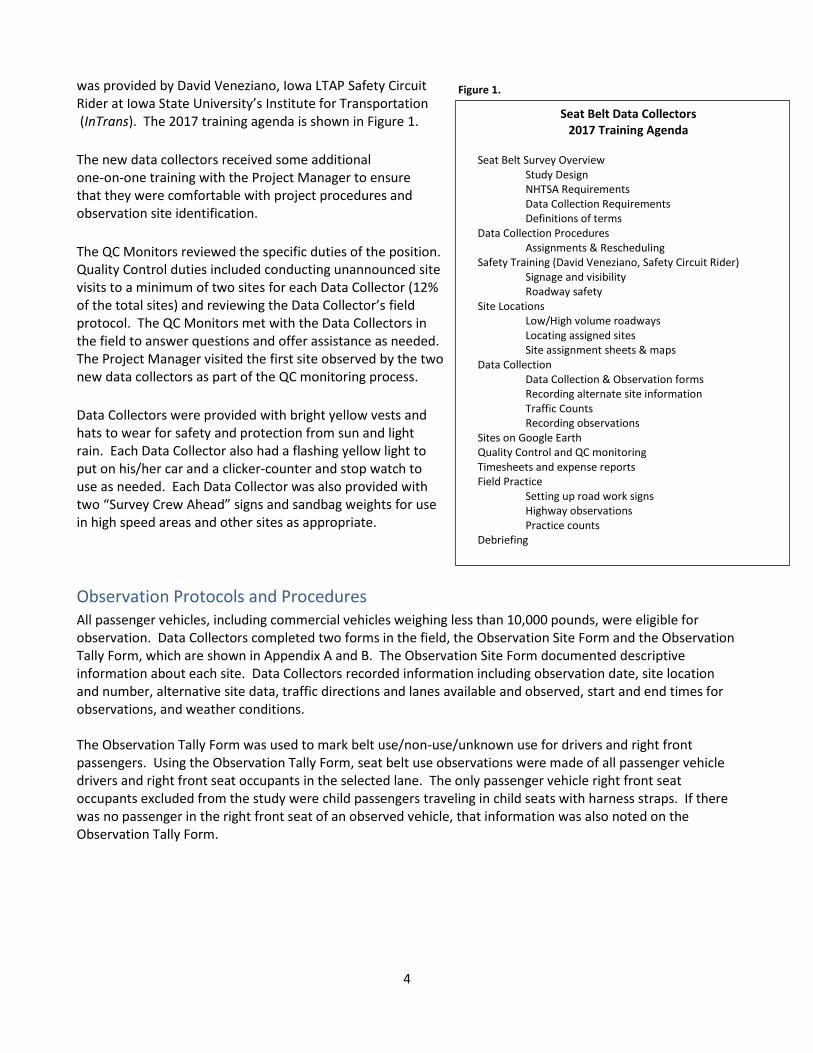
Figure 1. was provided by David Veneziano, Iowa LTAP Safety Circuit Rider at Iowa State University’s Institute for Transportation (InTrans). The 2017 training agenda is shown in Figure 1.
The new data collectors received some additional one-on-one training with the Project Manager to ensure that they were comfortable with project procedures and observation site identification.
The QC Monitors reviewed the specific duties of the position. Quality Control duties included conducting unannounced site visits to a minimum of two sites for each Data Collector (12% of the total sites) and reviewing the Data Collector’s field protocol. The QC Monitors met with the Data Collectors in the field to answer questions and offer assistance as needed. The Project Manager visited the first site observed by the two new data collectors as part of the QC monitoring process.
Data Collectors were provided with bright yellow vests and hats to wear for safety and protection from sun and light rain. Each Data Collector also had a flashing yellow light to put on his/her car and a clicker-counter and stop watch to use as needed. Each Data Collector was also provided with two “Survey Crew Ahead” signs and sandbag weights for use in high speed areas and other sites as appropriate.
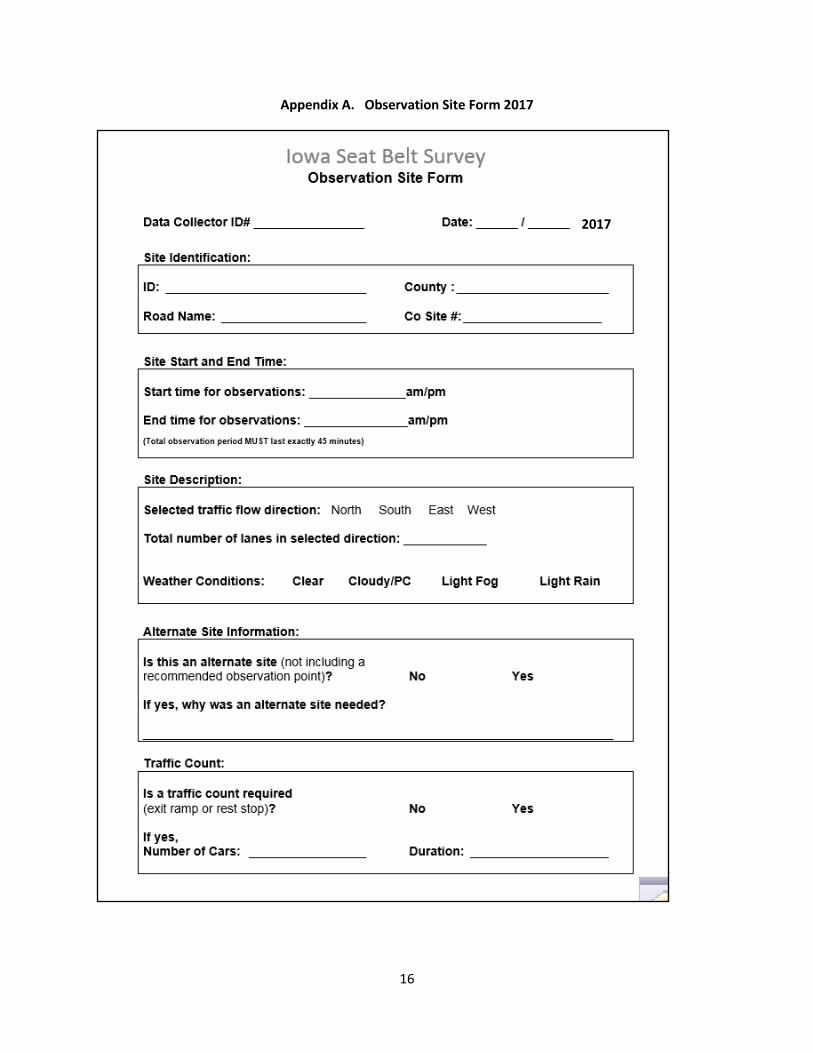
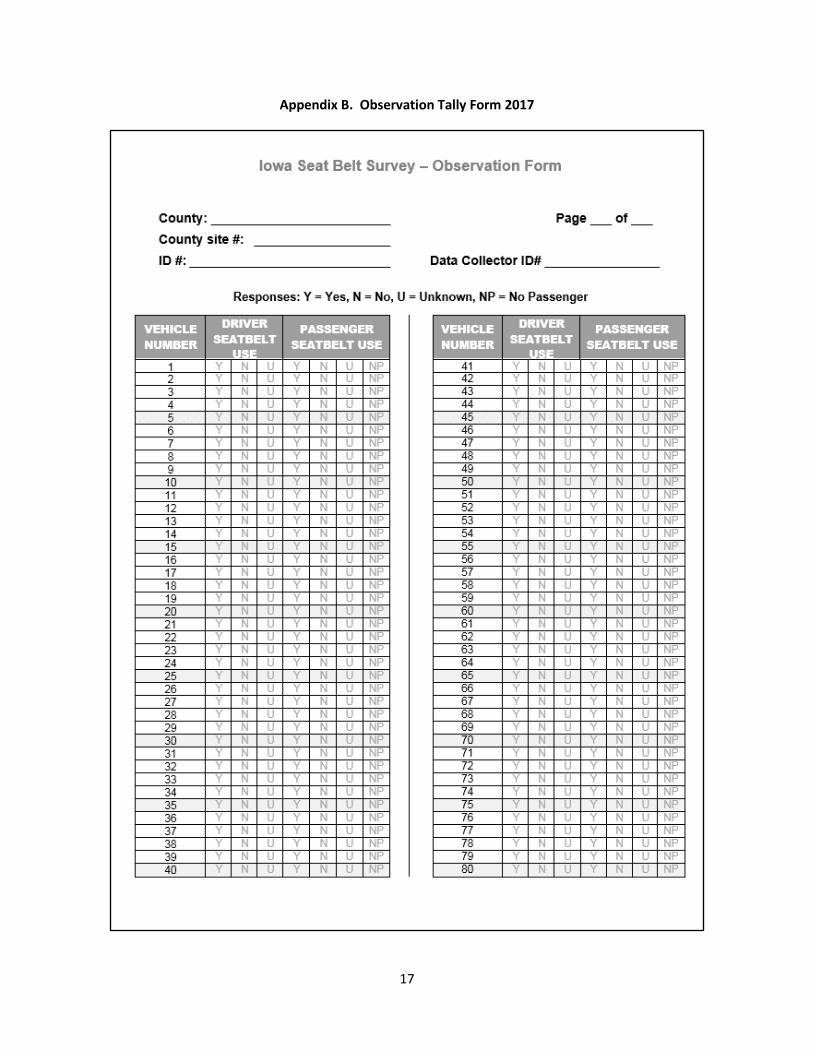
Observation Protocols and Procedures All passenger vehicles, including commercial vehicles weighing less than 10,000 pounds, were eligible for observation. Data Collectors completed two forms in the field, the Observation Site Form and the Observation Tally Form, which are shown in Appendix A and B. The Observation Site Form documented descriptive information about each site. Data Collectors recorded information including observation date, site location and number, alternative site data, traffic directions and lanes available and observed, start and end times for observations, and weather conditions. The Observation Tally Form was used to mark belt use/non-use/unknown use for drivers and right front passengers. Using the Observation Tally Form, seat belt use observations were made of all passenger vehicle drivers and right front seat occupants in the selected lane. The only passenger vehicle right front seat occupants excluded from the study were child passengers traveling in child seats with harness straps. If there was no passenger in the right front seat of an observed vehicle, that information was also noted on the Observation Tally Form.
Seat Belt Data Collectors 2017 Training Agenda
Seat Belt Survey Overview
Study Design NHTSA Requirements Data Collection Requirements Definitions of terms
Data Collection Procedures Assignments & Rescheduling
Safety Training (David Veneziano, Safety Circuit Rider) Signage and visibility Roadway safety
Site Locations Low/High volume roadways Locating assigned sites Site assignment sheets & maps
Data Collection Data Collection & Observation forms Recording alternate site information Traffic Counts Recording observations
Sites on Google Earth Quality Control and QC monitoring Timesheets and expense reports Field Practice
Setting up road work signs Highway observations Practice counts
Debriefing
5
Figure 2.
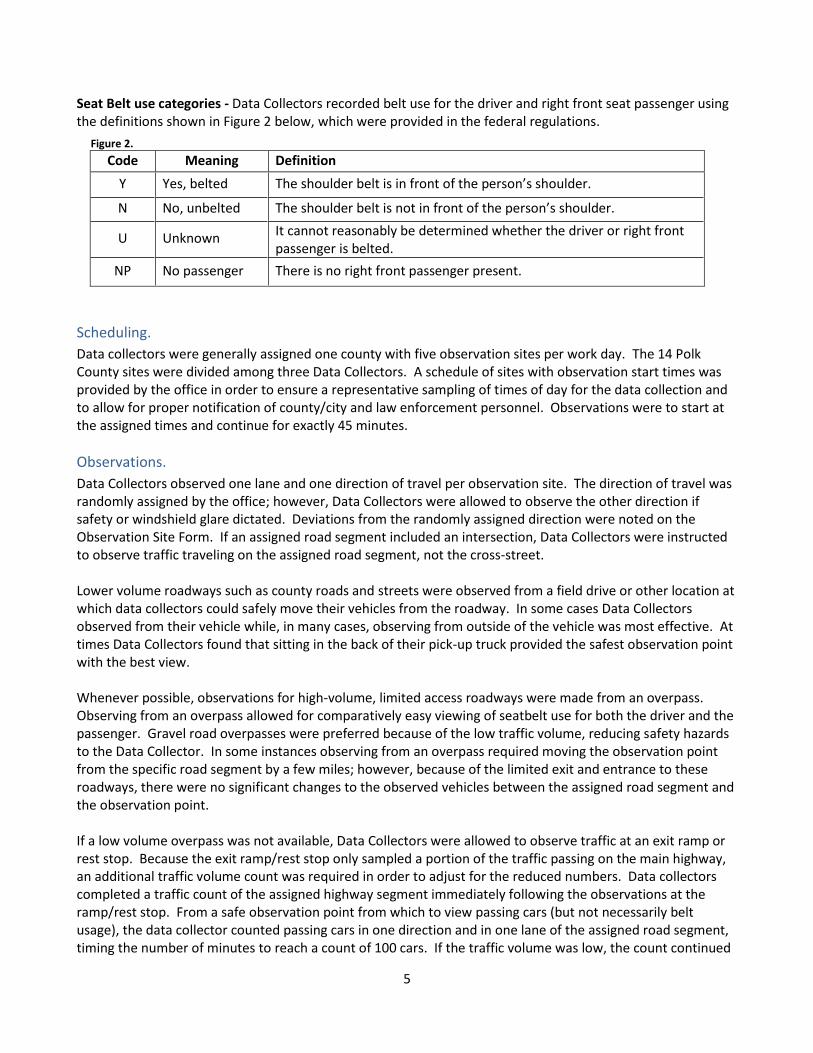
Seat Belt use categories - Data Collectors recorded belt use for the driver and right front seat passenger using the definitions shown in Figure 2 below, which were provided in the federal regulations.
Code Meaning Definition
Y Yes, belted The shoulder belt is in front of the person’s shoulder.
N No, unbelted The shoulder belt is not in front of the person’s shoulder.
U Unknown It cannot reasonably be determined whether the driver or right front passenger is belted.
NP No passenger There is no right front passenger present.
Scheduling.
Data collectors were generally assigned one county with five observation sites per work day. The 14 Polk County sites were divided among three Data Collectors. A schedule of sites with observation start times was provided by the office in order to ensure a representative sampling of times of day for the data collection and to allow for proper notification of county/city and law enforcement personnel. Observations were to start at the assigned times and continue for exactly 45 minutes.
Observations.
Data Collectors observed one lane and one direction of travel per observation site. The direction of travel was randomly assigned by the office; however, Data Collectors were allowed to observe the other direction if safety or windshield glare dictated. Deviations from the randomly assigned direction were noted on the Observation Site Form. If an assigned road segment included an intersection, Data Collectors were instructed to observe traffic traveling on the assigned road segment, not the cross-street. Lower volume roadways such as county roads and streets were observed from a field drive or other location at which data collectors could safely move their vehicles from the roadway. In some cases Data Collectors observed from their vehicle while, in many cases, observing from outside of the vehicle was most effective. At times Data Collectors found that sitting in the back of their pick-up truck provided the safest observation point with the best view. Whenever possible, observations for high-volume, limited access roadways were made from an overpass. Observing from an overpass allowed for comparatively easy viewing of seatbelt use for both the driver and the passenger. Gravel road overpasses were preferred because of the low traffic volume, reducing safety hazards to the Data Collector. In some instances observing from an overpass required moving the observation point from the specific road segment by a few miles; however, because of the limited exit and entrance to these roadways, there were no significant changes to the observed vehicles between the assigned road segment and the observation point. If a low volume overpass was not available, Data Collectors were allowed to observe traffic at an exit ramp or rest stop. Because the exit ramp/rest stop only sampled a portion of the traffic passing on the main highway, an additional traffic volume count was required in order to adjust for the reduced numbers. Data collectors completed a traffic count of the assigned highway segment immediately following the observations at the ramp/rest stop. From a safe observation point from which to view passing cars (but not necessarily belt usage), the data collector counted passing cars in one direction and in one lane of the assigned road segment, timing the number of minutes to reach a count of 100 cars. If the traffic volume was low, the count continued

6
for 15 minutes, at which point the data collector recorded the number of cars observed in a 15 minute time frame. This traffic count information was recorded on the Observation Site Form and was used to adjust the seat belt usage observation data when observations were made away from the selected road segment at a rest stop or exit ramp. Five rest stop sites were used in 2017.
Alternate Sites.
If unexpected construction or difficulty in locating a useable and safe place to observe required the Data collector to deviate farther than 2 miles (or more than one block in city situations) from the selected road segment, he/she was instructed to call the office before proceeding and to note the location as an alternate site on the Observation Site form. For the 2017 data collection, there were no new alternate sites needed unexpectedly.
Rescheduling.
If an assigned road segment was temporarily unavailable due to a traffic accident or inclement weather, data collection was to be rescheduled another week for the same time and day of the week. There was very little rain during the observation week, and no observation periods were cancelled due to weather.
Results Data collection for 2017 occurred from Wed, June 7 through Saturday, June 17, 2017. The 2017 seat belt use data collection resulted in the observation of 14,169 passenger vehicles, with a right front seat passenger in 4,922 of those vehicles, for a total of 19,091 potential observations of belt use. Of these 19,091 potential observations, there were 13,431 drivers and 4,524 right front passengers who were observed to be wearing seat belts (total 17,955 seat belt users). Seat belts were not worn by 568 drivers and 331 right front passengers (total 899 unbelted). Data collectors were unable to observe the seat belt use of 170 drivers and 67 passengers (total 237 unknown use). The unknown use, or “nonresponse rate,” is .0124 or 1.24%. This is well within the range allowed by federal regulations, which require the nonresponse rate to be below 10%. The number of observations in 2017 is more than in previous years due to the increased number of sites observed. The 19,091 total observations this year constitute a 7% increase over the 17,785 observations in 2016. Federal regulations require a minimum of 7500 observations, and the 2017 total of 14,169 passenger vehicles with 19,091 observed occupants far exceeds the minimum. Eleven quality control checks were completed in 2017. Four data collectors were observed by a quality control monitor at two unannounced sites and one data collector was observed at three unannounced sites, to ensure compliance with project protocols. This comprises 13% of the sites (11 out of 84), which exceeds the minimum of 5% required by federal regulations. No problems were identified through these quality control checks Federal regulations require the calculation of seat belt use to be conducted with weighted data as described in the approved survey plan. Data weighting was completed by Dr. Emily Berg, Assistant Professor of Statistics at Iowa State University. Based on the weighted data, Iowa’s overall seat belt use rate for 2017 is 91.4%, with an estimated standard error of 1.08% (± 1%). By comparison, the weighted seat belt use rates for previous years were 93.8% in 2016, 93.0% in 2015, 92.8% in 2014, 91.9% in 2013, and 92.4% in 2012. The decline in state-wide seat belt use could be attributable to the change in sampled site locations for the 2017 data collection. Additionally, the figure below shows that the decline in state-wide seat belt use occurred on local and secondary roads, not on primary roads.

7
Figure 3.
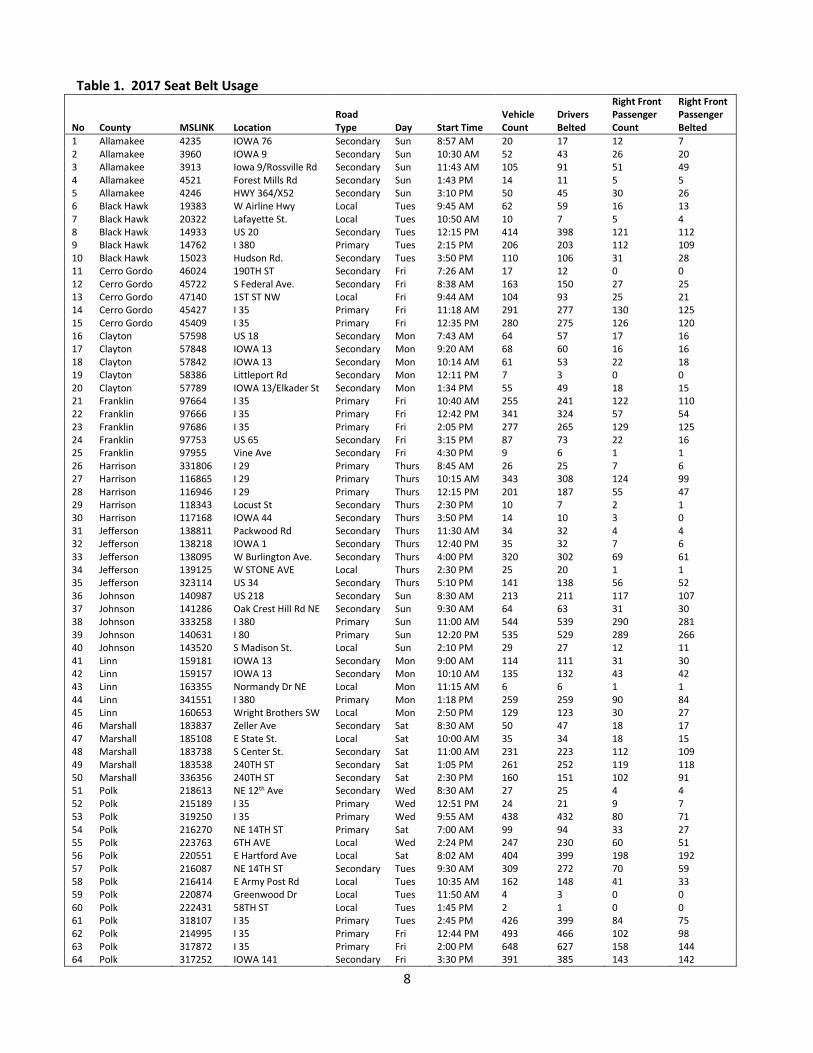
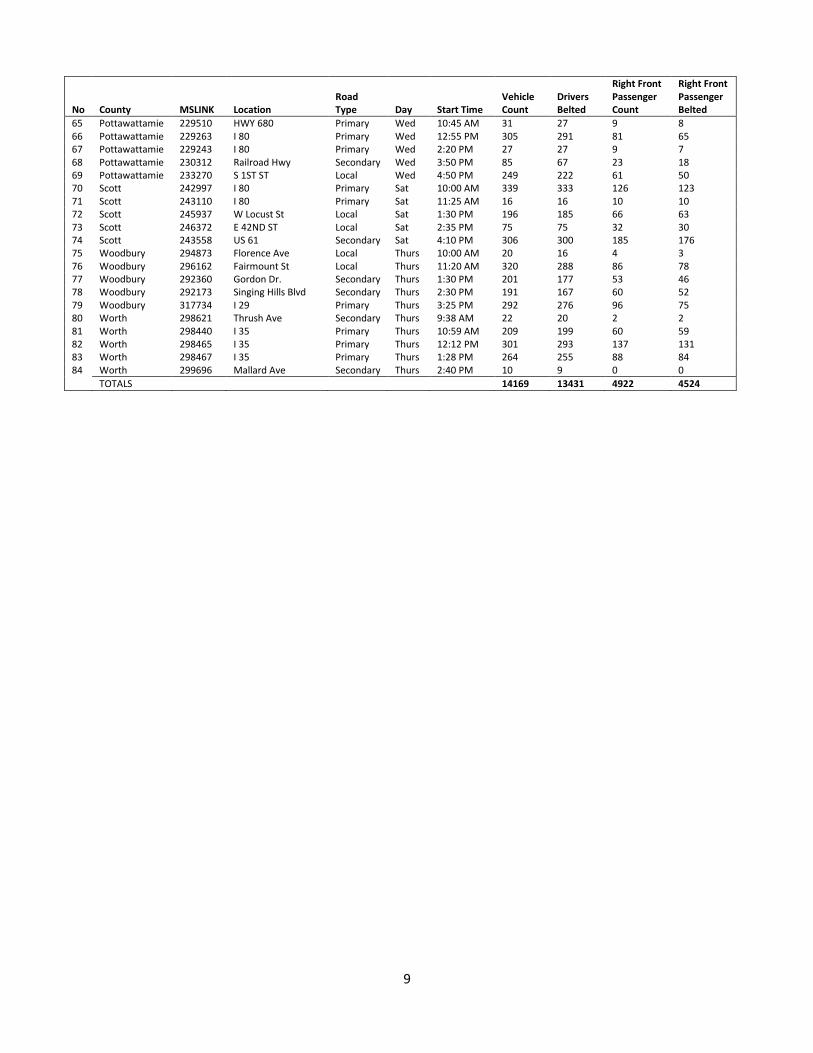
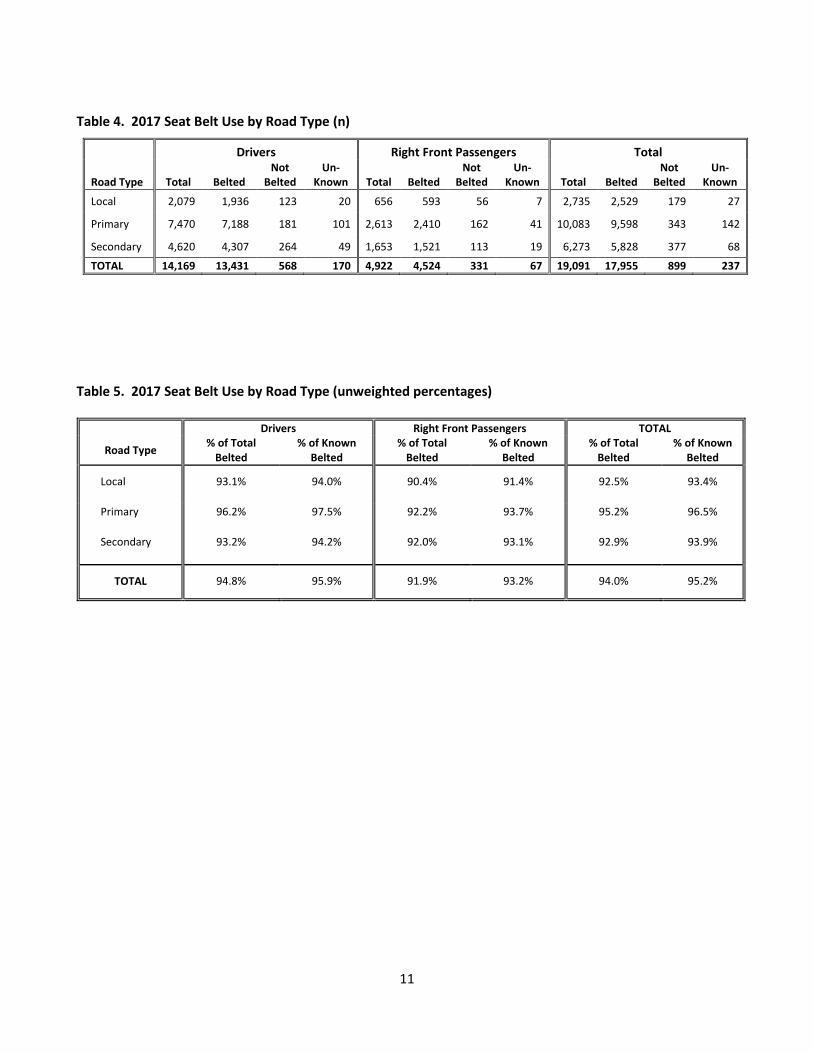
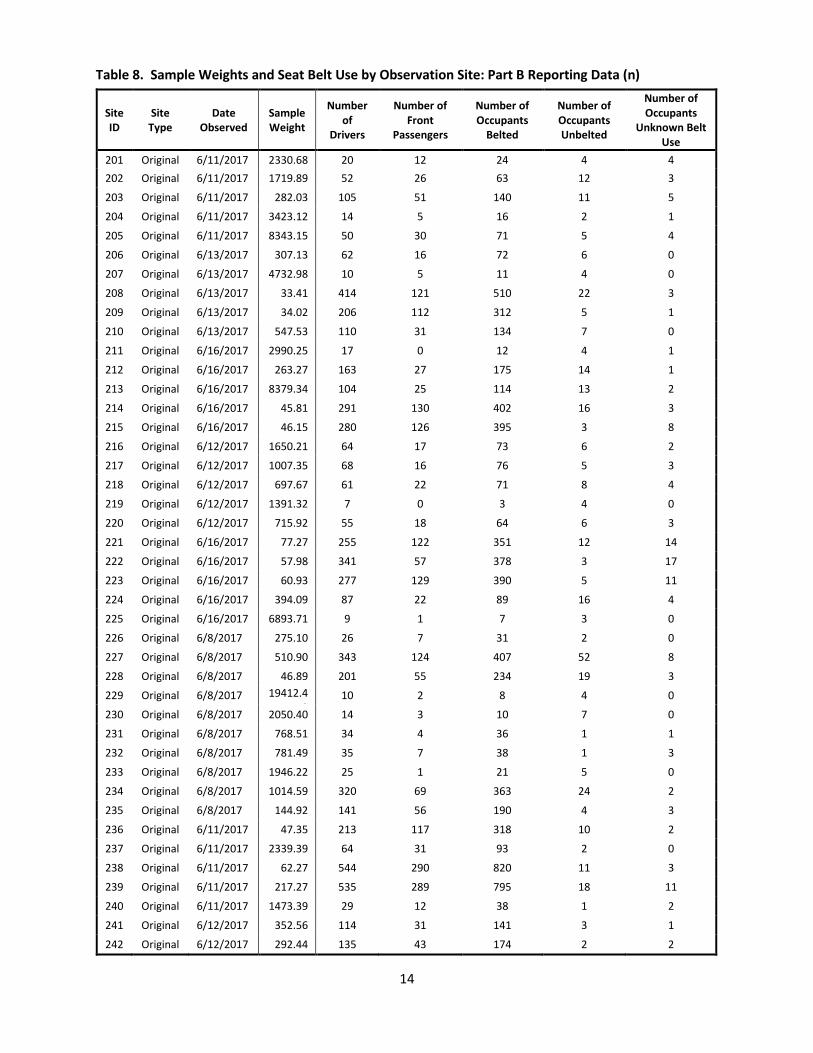
Tables and Appendices Table 1 lists the 84 observation sites with selected characteristics and the number of belted drivers and right front passengers. Tables 2 and 3 show the seat belt use of drivers and passengers by county. Table 2 contains the number or count of each category of belt use by drivers, passengers, and total for each sampled county. Table 3 contains two types of unweighted percentages of belt use for drivers, passengers, and combined total for each county. The “% of Total Belted” is the percent of the total number of persons (both drivers and passengers) who were belted. The “% of Known Belted” removes the persons with unknown belt use from the base number, so it becomes the percent of persons with known seat belt status who were belted. Note that these percentages are unweighted and the state-wide seat belt use percentage is slightly different than the weighted seat belt use percentage required by federal regulations for reporting. Nevertheless the unweighted percentages in Table 3 enable legitimate comparisons between seat belt users/nonusers and between counties. Tables 4 and 5 show the seat belt use of drivers and passengers by road type. Table 4 contains the number in each category and Table 5 contains unweighted percentages. Federal regulations required the new survey plan to classify road types as primary (including interstates), secondary, and local. Table 6 contains seat belt use of drivers and passengers by day of the week and road type. The percentages included in the table are unweighted. Table 7 contains seat belt use of drivers and passengers by time of day and road type. The percentages included in the table are unweighted. Table 8 contains sample weights for each observation site as well as seat belt use for drivers and passengers (number or count). This information is used for Part B reporting purposes. Appendix A. Observation Site Form Appendix B. Observation Tally Form
Road Type 2016 Estimated
Seat Belt Use 2016 Estimated
Standard Error (%) 2017 Estimated
Seat Belt Use 2017 Estimated
Standard Error (%)
Local 93% 1.85 90% 2.62
Secondary 94% 0.68 91% 2.21
Primary 95% 1.39 96% 0.68
State-level 93.8% 0.58 91.4% 1.08
8
Table 1. 2017 Seat Belt Usage
No County MSLINK Location Road Type Day Start Time
Vehicle Count
Drivers Belted
Right Front Passenger Count
Right Front Passenger Belted
1 Allamakee 4235 IOWA 76 Secondary Sun 8:57 AM 20 17 12 7 2 Allamakee 3960 IOWA 9 Secondary Sun 10:30 AM 52 43 26 20 3 Allamakee 3913 Iowa 9/Rossville Rd Secondary Sun 11:43 AM 105 91 51 49 4 Allamakee 4521 Forest Mills Rd Secondary Sun 1:43 PM 14 11 5 5 5 Allamakee 4246 HWY 364/X52 Secondary Sun 3:10 PM 50 45 30 26 6 Black Hawk 19383 W Airline Hwy Local Tues 9:45 AM 62 59 16 13 7 Black Hawk 20322 Lafayette St. Local Tues 10:50 AM 10 7 5 4 8 Black Hawk 14933 US 20 Secondary Tues 12:15 PM 414 398 121 112 9 Black Hawk 14762 I 380 Primary Tues 2:15 PM 206 203 112 109 10 Black Hawk 15023 Hudson Rd. Secondary Tues 3:50 PM 110 106 31 28 11 Cerro Gordo 46024 190TH ST Secondary Fri 7:26 AM 17 12 0 0 12 Cerro Gordo 45722 S Federal Ave. Secondary Fri 8:38 AM 163 150 27 25 13 Cerro Gordo 47140 1ST ST NW Local Fri 9:44 AM 104 93 25 21 14 Cerro Gordo 45427 I 35 Primary Fri 11:18 AM 291 277 130 125 15 Cerro Gordo 45409 I 35 Primary Fri 12:35 PM 280 275 126 120 16 Clayton 57598 US 18 Secondary Mon 7:43 AM 64 57 17 16 17 Clayton 57848 IOWA 13 Secondary Mon 9:20 AM 68 60 16 16 18 Clayton 57842 IOWA 13 Secondary Mon 10:14 AM 61 53 22 18 19 Clayton 58386 Littleport Rd Secondary Mon 12:11 PM 7 3 0 0 20 Clayton 57789 IOWA 13/Elkader St Secondary Mon 1:34 PM 55 49 18 15 21 Franklin 97664 I 35 Primary Fri 10:40 AM 255 241 122 110 22 Franklin 97666 I 35 Primary Fri 12:42 PM 341 324 57 54 23 Franklin 97686 I 35 Primary Fri 2:05 PM 277 265 129 125 24 Franklin 97753 US 65 Secondary Fri 3:15 PM 87 73 22 16 25 Franklin 97955 Vine Ave Secondary Fri 4:30 PM 9 6 1 1 26 Harrison 331806 I 29 Primary Thurs 8:45 AM 26 25 7 6 27 Harrison 116865 I 29 Primary Thurs 10:15 AM 343 308 124 99 28 Harrison 116946 I 29 Primary Thurs 12:15 PM 201 187 55 47 29 Harrison 118343 Locust St Secondary Thurs 2:30 PM 10 7 2 1 30 Harrison 117168 IOWA 44 Secondary Thurs 3:50 PM 14 10 3 0 31 Jefferson 138811 Packwood Rd Secondary Thurs 11:30 AM 34 32 4 4 32 Jefferson 138218 IOWA 1 Secondary Thurs 12:40 PM 35 32 7 6 33 Jefferson 138095 W Burlington Ave. Secondary Thurs 4:00 PM 320 302 69 61 34 Jefferson 139125 W STONE AVE Local Thurs 2:30 PM 25 20 1 1 35 Jefferson 323114 US 34 Secondary Thurs 5:10 PM 141 138 56 52 36 Johnson 140987 US 218 Secondary Sun 8:30 AM 213 211 117 107 37 Johnson 141286 Oak Crest Hill Rd NE Secondary Sun 9:30 AM 64 63 31 30 38 Johnson 333258 I 380 Primary Sun 11:00 AM 544 539 290 281 39 Johnson 140631 I 80 Primary Sun 12:20 PM 535 529 289 266 40 Johnson 143520 S Madison St. Local Sun 2:10 PM 29 27 12 11 41 Linn 159181 IOWA 13 Secondary Mon 9:00 AM 114 111 31 30 42 Linn 159157 IOWA 13 Secondary Mon 10:10 AM 135 132 43 42 43 Linn 163355 Normandy Dr NE Local Mon 11:15 AM 6 6 1 1 44 Linn 341551 I 380 Primary Mon 1:18 PM 259 259 90 84 45 Linn 160653 Wright Brothers SW Local Mon 2:50 PM 129 123 30 27 46 Marshall 183837 Zeller Ave Secondary Sat 8:30 AM 50 47 18 17 47 Marshall 185108 E State St. Local Sat 10:00 AM 35 34 18 15 48 Marshall 183738 S Center St. Secondary Sat 11:00 AM 231 223 112 109 49 Marshall 183538 240TH ST Secondary Sat 1:05 PM 261 252 119 118 50 Marshall 336356 240TH ST Secondary Sat 2:30 PM 160 151 102 91 51 Polk 218613 NE 12th Ave Secondary Wed 8:30 AM 27 25 4 4 52 Polk 215189 I 35 Primary Wed 12:51 PM 24 21 9 7 53 Polk 319250 I 35 Primary Wed 9:55 AM 438 432 80 71 54 Polk 216270 NE 14TH ST Primary Sat 7:00 AM 99 94 33 27 55 Polk 223763 6TH AVE Local Wed 2:24 PM 247 230 60 51 56 Polk 220551 E Hartford Ave Local Sat 8:02 AM 404 399 198 192 57 Polk 216087 NE 14TH ST Secondary Tues 9:30 AM 309 272 70 59 58 Polk 216414 E Army Post Rd Local Tues 10:35 AM 162 148 41 33 59 Polk 220874 Greenwood Dr Local Tues 11:50 AM 4 3 0 0 60 Polk 222431 58TH ST Local Tues 1:45 PM 2 1 0 0 61 Polk 318107 I 35 Primary Tues 2:45 PM 426 399 84 75 62 Polk 214995 I 35 Primary Fri 12:44 PM 493 466 102 98 63 Polk 317872 I 35 Primary Fri 2:00 PM 648 627 158 144 64 Polk 317252 IOWA 141 Secondary Fri 3:30 PM 391 385 143 142
9
No County MSLINK Location Road Type Day Start Time
Vehicle Count
Drivers Belted
Right Front Passenger Count
Right Front Passenger Belted
65 Pottawattamie 229510 HWY 680 Primary Wed 10:45 AM 31 27 9 8 66 Pottawattamie 229263 I 80 Primary Wed 12:55 PM 305 291 81 65 67 Pottawattamie 229243 I 80 Primary Wed 2:20 PM 27 27 9 7 68 Pottawattamie 230312 Railroad Hwy Secondary Wed 3:50 PM 85 67 23 18 69 Pottawattamie 233270 S 1ST ST Local Wed 4:50 PM 249 222 61 50 70 Scott 242997 I 80 Primary Sat 10:00 AM 339 333 126 123 71 Scott 243110 I 80 Primary Sat 11:25 AM 16 16 10 10 72 Scott 245937 W Locust St Local Sat 1:30 PM 196 185 66 63 73 Scott 246372 E 42ND ST Local Sat 2:35 PM 75 75 32 30 74 Scott 243558 US 61 Secondary Sat 4:10 PM 306 300 185 176 75 Woodbury 294873 Florence Ave Local Thurs 10:00 AM 20 16 4 3 76 Woodbury 296162 Fairmount St Local Thurs 11:20 AM 320 288 86 78 77 Woodbury 292360 Gordon Dr. Secondary Thurs 1:30 PM 201 177 53 46 78 Woodbury 292173 Singing Hills Blvd Secondary Thurs 2:30 PM 191 167 60 52 79 Woodbury 317734 I 29 Primary Thurs 3:25 PM 292 276 96 75 80 Worth 298621 Thrush Ave Secondary Thurs 9:38 AM 22 20 2 2 81 Worth 298440 I 35 Primary Thurs 10:59 AM 209 199 60 59 82 Worth 298465 I 35 Primary Thurs 12:12 PM 301 293 137 131 83 Worth 298467 I 35 Primary Thurs 1:28 PM 264 255 88 84 84 Worth 299696 Mallard Ave Secondary Thurs 2:40 PM 10 9 0 0
TOTALS
14169 13431 4922 4524

10
Table 2. 2017 Driver and Passenger Seat Belt Use by County (n)
Drivers Right Front Passengers TOTAL
County Total Belted Not
Belted Un-
known Total Belted
Not Belted
Un-known
Total Belted Not
Belted Un-
known
Allamakee 241 207 24 10 124 107 10 7 365 314 34 17
Black Hawk 802 773 27 2 285 266 17 2 1,087 1,039 44 4
Cerro Gordo 855 807 40 8 308 291 10 7 1,163 1,098 50 15
Clayton 255 222 24 9 73 65 5 3 328 287 29 12
Franklin 969 909 25 35 331 306 14 11 1,300 1,215 39 46
Harrison 594 537 47 10 191 153 37 1 785 690 84 11
Jefferson 555 524 24 7 137 124 11 2 692 648 35 9
Johnson 1,385 1,369 10 6 739 695 32 12 2,124 2,064 42 18
Linn 643 631 9 3 195 184 4 7 838 815 13 10
Marshall 737 707 28 2 369 350 19 0 1,106 1,057 47 2
Polk 3,674 3,502 145 27 982 903 76 3 4,656 4,405 221 30
Pottawattamie 697 634 51 12 183 148 34 1 880 782 85 13
Scott 932 909 16 7 419 402 14 3 1,351 1,311 30 10
Woodbury 1,024 924 86 14 299 254 44 1 1,323 1,178 130 15
Worth 806 776 12 18 287 276 4 7 1,093 1,052 16 25
Total 14,169 13,431 568 170 4,922 4,524 331 67 19,091 17,955 899 237
Table 3. 2017 Driver and Passenger Seat Belt Use by County (unweighted percentages)
Drivers Right Front Passengers TOTAL
County % of Total
Belted % of Known
Belted % of Total
Belted % of Known Belted
% of Total Belted
% of Known Belted
Allamakee 85.9% 89.6% 86.3% 91.5% 86.0% 90.2%
Black Hawk 96.4% 96.6% 93.3% 94.0% 95.6% 95.9%
Cerro Gordo 94.4% 95.3% 94.5% 96.7% 94.4% 95.6%
Clayton 87.1% 90.2% 89.0% 92.9% 87.5% 90.8%
Franklin 93.8% 97.3% 92.4% 95.6% 93.5% 96.9%
Harrison 90.4% 92.0% 80.1% 80.5% 87.9% 89.1%
Jefferson 94.4% 95.6% 90.5% 91.9% 93.6% 94.9%
Johnson 98.8% 99.3% 94.0% 95.6% 97.2% 98.0%
Linn 98.1% 98.6% 94.4% 97.9% 97.3% 98.4%
Marshall 95.9% 96.2% 94.9% 94.9% 95.6% 95.7%
Polk 95.3% 96.0% 92.0% 92.2% 94.6% 95.2%
Pottawattamie 91.0% 92.6% 80.9% 81.3% 88.9% 90.2%
Scott 97.5% 98.3% 95.9% 96.6% 97.0% 97.8%
Woodbury 90.2% 91.5% 84.9% 85.2% 89.0% 90.1%
Worth 96.3% 98.5% 96.2% 98.6% 96.2% 98.5%
Total 94.8% 95.9% 91.9% 93.2% 94.0% 95.2%
11
Table 4. 2017 Seat Belt Use by Road Type (n)
Drivers Right Front Passengers Total
Road Type Total Belted Not
Belted Un-
Known Total Belted Not
Belted Un-
Known Total Belted Not
Belted Un-
Known
Local 2,079 1,936 123 20 656 593 56 7 2,735 2,529 179 27
Primary 7,470 7,188 181 101 2,613 2,410 162 41 10,083 9,598 343 142
Secondary 4,620 4,307 264 49 1,653 1,521 113 19 6,273 5,828 377 68
TOTAL 14,169 13,431 568 170 4,922 4,524 331 67 19,091 17,955 899 237
Table 5. 2017 Seat Belt Use by Road Type (unweighted percentages)
Drivers Right Front Passengers TOTAL
Road Type % of Total
Belted % of Known
Belted % of Total
Belted % of Known
Belted % of Total
Belted % of Known
Belted
Local 93.1% 94.0% 90.4% 91.4% 92.5% 93.4%
Primary 96.2% 97.5% 92.2% 93.7% 95.2% 96.5%
Secondary 93.2% 94.2% 92.0% 93.1% 92.9% 93.9%
TOTAL 94.8% 95.9% 91.9% 93.2% 94.0% 95.2%

12
Table 6. 2017 Driver and Passenger Seat Belt Use by Day of Week and Road Type (n & unweighted %)
Drivers Belted
Total Drivers
Passengers Belted
Total Passengers
% Drivers Belted
% Passengers Belted
Sunday 1576 1626 802 863 96.9% 92.9%
Local 27 29 11 12 93.1% 91.7%
Primary 1068 1079 547 579 99.0% 94.5%
Secondary 481 518 244 272 92.9% 89.7%
Monday 853 898 249 268 95.0% 92.9%
Local 129 135 28 31 95.6% 90.3%
Primary 259 259 84 90 100.0% 93.3%
Secondary 465 504 137 147 92.3% 93.2%
Tuesday 1596 1705 433 480 93.6% 90.2%
Local 218 240 50 62 90.8% 80.6%
Primary 602 632 184 196 95.3% 93.9%
Secondary 776 833 199 222 93.2% 89.6%
Wednesday 1342 1433 281 336 93.6% 83.6%
Local 452 496 101 121 91.1% 83.5%
Primary 798 825 158 188 96.7% 84.0%
Secondary 92 112 22 27 82.2% 81.5%
Thursday 2761 2979 807 914 92.7% 88.3%
Local 324 365 82 91 88.8% 90.1%
Primary 1543 1636 501 567 94.3% 88.4%
Secondary 894 978 224 256 91.4% 87.5%
Friday 3194 3356 981 1042 95.2% 94.1%
Local 93 104 21 25 89.4% 84.0%
Primary 2475 2585 776 824 95.7% 94.2%
Secondary 626 667 184 193 93.9% 95.3%
Saturday 2109 2172 971 1019 97.1% 95.3%
Local 693 710 300 314 97.6% 95.5%
Primary 443 454 160 169 97.6% 94.7%
Secondary 973 1008 511 536 96.5% 95.3%
Total 13431 14169 4524 4922 94.8% 91.9%

13
Table 7. Driver and Passenger Seat Belt Use by Time of Day and Road Type (n & unweighted %)
Drivers Belted
Total Drivers
Passengers Belted
Total Passengers
% Drivers Belted
% Passengers
Belted
7AM to 759AM 120 131 32 38 91.6% 84.2%
Primary 94 99 27 33 94.9% 81.8%
Secondary 26 32 5 5 81.3% 100.0%
8AM to 859AM 729 755 309 329 96.6% 93.9%
Local 399 404 192 198 98.8% 97.0%
Primary 8 9 2 2 88.9% 100.0%
Secondary 322 342 115 129 94.2% 89.1%
9AM to 959AM 683 735 184 202 92.9% 91.1%
Local 50 55 11 13 90.9% 84.6%
Primary 60 61 11 13 98.4% 84.6%
Secondary 573 619 162 176 92.6% 92.0%
10AM to 1059AM 1724 1832 507 575 94.1% 88.2%
Local 228 250 58 71 91.2% 81.7%
Primary 1159 1214 344 386 95.5% 89.1%
Secondary 337 368 105 118 91.6% 89.0%
11AM to 1159AM 1815 1911 767 806 95.0% 95.2%
Local 345 383 91 103 90.1% 88.3%
Primary 1166 1204 533 554 96.8% 96.2%
Secondary 304 324 143 149 93.8% 96.0%
12PM to 1259PM 1980 2062 708 763 96.0% 92.8%
Local 31 35 8 9 88.6% 88.9%
Primary 1475 1525 559 603 96.7% 92.7%
Secondary 474 502 141 151 94.4% 93.4%
1PM to 159PM 1882 1971 574 617 95.5% 93.0%
Local 122 130 42 43 93.8% 97.7%
Primary 1342 1392 370 404 96.4% 91.6%
Secondary 418 449 162 170 93.1% 95.3%
2PM to 259PM 2000 2110 654 709 94.8% 92.2%
Local 356 381 96 107 93.4% 89.7%
Primary 1338 1386 438 465 96.5% 94.2%
Secondary 306 343 120 137 89.2% 87.6%
3PM to 359PM 1179 1259 345 391 93.6% 88.2%
Local 183 192 46 51 95.3% 90.2%
Primary 463 492 103 124 94.1% 83.1%
Secondary 533 575 196 216 92.7% 90.7%
4PM to 459PM 1013 1072 355 390 94.5% 91.0%
Local 56 62 12 15 90.3% 80.0%
Primary 83 88 23 29 94.3% 79.3%
Secondary 874 922 320 346 94.8% 92.5%
5PM to 559PM 306 331 89 102 92.4% 87.3%
Local 166 187 37 46 88.8% 80.4%
Secondary 140 144 52 56 97.2% 92.9%
Total 13431 14169 4524 4922 94.8% 91.9%
14
Table 8. Sample Weights and Seat Belt Use by Observation Site: Part B Reporting Data (n)
Site ID
Site Type
Date Observed
Sample Weight
Number of
Drivers
Number of Front
Passengers
Number of Occupants
Belted
Number of Occupants Unbelted
Number of Occupants
Unknown Belt Use
201 Original 6/11/2017 2330.68 20 12 24 4 4
202 Original 6/11/2017 1719.89 52 26 63 12 3
203 Original 6/11/2017 282.03 105 51 140 11 5
204 Original 6/11/2017 3423.12 14 5 16 2 1
205 Original 6/11/2017 8343.15 50 30 71 5 4
206 Original 6/13/2017 307.13 62 16 72 6 0
207 Original 6/13/2017 4732.98 10 5 11 4 0
208 Original 6/13/2017 33.41 414 121 510 22 3
209 Original 6/13/2017 34.02 206 112 312 5 1
210 Original 6/13/2017 547.53 110 31 134 7 0
211 Original 6/16/2017 2990.25 17 0 12 4 1
212 Original 6/16/2017 263.27 163 27 175 14 1
213 Original 6/16/2017 8379.34 104 25 114 13 2
214 Original 6/16/2017 45.81 291 130 402 16 3
215 Original 6/16/2017 46.15 280 126 395 3 8
216 Original 6/12/2017 1650.21 64 17 73 6 2
217 Original 6/12/2017 1007.35 68 16 76 5 3
218 Original 6/12/2017 697.67 61 22 71 8 4
219 Original 6/12/2017 1391.32 7 0 3 4 0
220 Original 6/12/2017 715.92 55 18 64 6 3
221 Original 6/16/2017 77.27 255 122 351 12 14
222 Original 6/16/2017 57.98 341 57 378 3 17
223 Original 6/16/2017 60.93 277 129 390 5 11
224 Original 6/16/2017 394.09 87 22 89 16 4
225 Original 6/16/2017 6893.71 9 1 7 3 0
226 Original 6/8/2017 275.10 26 7 31 2 0
227 Original 6/8/2017 510.90 343 124 407 52 8
228 Original 6/8/2017 46.89 201 55 234 19 3
229 Original 6/8/2017 19412.42
10 2 8 4 0
230 Original 6/8/2017 2050.40 14 3 10 7 0
231 Original 6/8/2017 768.51 34 4 36 1 1
232 Original 6/8/2017 781.49 35 7 38 1 3
233 Original 6/8/2017 1946.22 25 1 21 5 0
234 Original 6/8/2017 1014.59 320 69 363 24 2
235 Original 6/8/2017 144.92 141 56 190 4 3
236 Original 6/11/2017 47.35 213 117 318 10 2
237 Original 6/11/2017 2339.39 64 31 93 2 0
238 Original 6/11/2017 62.27 544 290 820 11 3
239 Original 6/11/2017 217.27 535 289 795 18 11
240 Original 6/11/2017 1473.39 29 12 38 1 2
241 Original 6/12/2017 352.56 114 31 141 3 1
242 Original 6/12/2017 292.44 135 43 174 2 2

15
Site ID
Site Type
Date Observed
Sample Weight
Number of
Drivers
Number of Front
Passengers
Number of Occupants
Belted
Number of Occupants Unbelted
Number of Occupants
Unknown Belt Use
243 Original 6/12/2017 3411.28 6 1 7 0 0
244 Original 6/12/2017 185.60 259 90 343 2 4
245 Original 6/12/2017 391.09 129 30 150 6 3
246 Original 6/10/2017 1223.51 50 18 64 4 0
247 Original 6/10/2017 2265.63 35 18 49 4 0
248 Original 6/10/2017 1101.32 231 112 332 10 1
249 Original 6/10/2017 395.13 261 119 370 9 1
250 Original 6/10/2017 166.31 160 102 242 20 0
251 Original 6/7/2017 4252.12 27 4 29 2 0
252 Original 6/14/2017 23.19 24 9 28 4 1
253 Original 6/7/2017 94.06 438 80 503 15 0
254 Original 6/17/2017 2014.13 99 33 121 9 2
255 Original 6/14/2017 118.61 247 60 281 18 8
256 Original 6/17/2017 309.42 404 198 591 10 1
257 Original 6/13/2017 965.18 309 70 331 47 1
258 Original 6/13/2017 1121.58 162 41 181 21 1
259 Original 6/13/2017 3940.02 4 0 3 1 0
260 Original 6/13/2017 3037.10 2 0 1 1 0
261 Original 6/13/2017 164.94 426 84 474 26 10
262 Original 6/9/2017 97.69 493 102 564 28 3
263 Original 6/9/2017 18.43 648 158 771 34 1
264 Original 6/9/2017 533.84 391 143 527 5 2
265 Original 6/7/2017 437.53 31 9 35 3 2
266 Original 6/7/2017 141.92 305 81 356 20 10
267 Original 6/7/2017 485.35 27 9 34 2 0
268 Original 6/7/2017 1212.31 85 23 85 22 1
269 Original 6/7/2017 200.35 249 61 272 38 0
270 Original 6/10/2017 28.17 339 126 456 5 4
271 Original 6/10/2017 241.30 16 10 26 0 0
272 Original 6/10/2017 149.50 196 66 248 13 1
273 Original 6/10/2017 4563.28 75 32 105 1 1
274 Original 6/10/2017 79.69 306 185 476 11 4
275 Original 6/15/2017 3041.10 20 4 19 5 0
276 Original 6/15/2017 1403.80 320 86 366 32 8
277 Original 6/15/2017 1305.55 201 53 223 29 2
278 Original 6/15/2017 439.23 191 60 219 29 3
279 Original 6/15/2017 311.79 292 96 351 35 2
280 Original 6/15/2017 996.36 22 2 22 1 1
281 Original 6/15/2017 235.00 209 60 258 6 5
282 Original 6/15/2017 103.50 301 137 424 7 7
283 Original 6/15/2017 114.38 264 88 339 1 12
284 Original 6/15/2017 3718.52 10 0 9 1 0
TOTALS 14,169 4,922 17,955 899 237
16
Appendix A. Observation Site Form 2017
2017
17
Appendix B. Observation Tally Form 2017