iowa nutrition network’s building and strengthening … grant program...building and strengthening...
TRANSCRIPT

Supplemental Nutrition Assistance Program Education and Evaluation Study (Wave II)
Iowa Nutrition Network’s Building and Strengthening Iowa Community Support
(BASICS) for Nutrition and Physical Activity Program
Volume II: Appendices
Nutrition Assistance Program Report December 2013 Food and Nutrition Service Office of Policy Support

Non-Discrimination Policy The U.S. Department of Agriculture (USDA) prohibits discrimination in all of its programs and activities on the basis of race, color, national origin, age, disability, and where applicable, sex (including gender identity and expression), marital status, familial status, parental status, religion, sexual orientation, political beliefs, genetic information, reprisal, or because all or part of an individual's income is derived from any public assistance program. (Not all prohibited bases apply to all programs.) Persons with disabilities who require alternative means for communication of program information (Braille, large print, audiotape, etc.) should contact USDA's TARGET Center at (202) 720-2600 (voice and TDD). To file a complaint of discrimination, write to USDA, Assistant Secretary for Civil Rights, Office of the Assistant Secretary for Civil Rights, 1400 Independence Avenue, S.W., Stop 9410, Washington, DC 20250-9410; or call toll-free at (866) 632-9992 (English) or (800) 877-8339 (TDD) or (866) 377-8642 (English Federal-relay) or (800) 845-6136 (Spanish Federal-relay). USDA is an equal opportunity provider and employer.

Supplemental Nutrition Assistance Program Education and Evaluation Study (Wave II)
Iowa Nutrition Network’s Building and Strengthening Iowa Community Support (BASICS) for Nutrition and Physical Activity Program
Volume II: Appendix Authors: Valerie Long Sheryl Cates Jonathan Biltstein Julie Fantacone Katherine Kosa Loren Bell James Hersey Submitted by: Altarum Institute 2000 M Street N.W. Suite 400 Washington, DC 20036 Project Director: Loren Bell Project Manager: Valerie Long
Submitted to: Office of Policy Support Food and Nutrition Service 3101 Park Center Drive Alexandria, VA 22302-1500 Project Officer: Anita Singh
This study was conducted under Contract number AG-3198-D-0096 with the Food and Nutrition Service, United States Department of Agriculture.
This report is available on the Food and Nutrition website: http://www.fns.usda.gov/research-and-analysis Suggested Citation: Long, V., Cates, S., Blitstein, J., Fantacone, J., Kosa, K., Bell, L. and Hersey, J. Supplemental Nutrition Assistance Program Education and Evaluation Study (Wave II): Iowa Nutrition Network’s Building and Strengthening Iowa Community Support (BASICS) for Nutrition and Physical Activity Program. Volume II: Appendices. Prepared by Altarum Institute and RTI International for the U.S. Department of Agriculture, Food and Nutrition Service, December 2013
Food and Nutrition Service, Office of Policy Support 2013


Appendix A
Process Evaluation Data Collection Instruments


BASICS Nutrition and Physical Activity Program INN ● Program Evaluation
List of Contents
A.1. Building and Strengthening Iowa Community Support Nutrition and Physical Activity Program Data Abstraction Form
A.2. Discussion Guide for Building and Strengthening Iowa Community Support Nutrition and Physical Activity Program Implementing Agency Principal Investigator [pre-implementation]
A.3. Discussion Guide for Building and Strengthening Iowa Community Support Nutrition and Physical Activity Program Implementing Agency Principal Investigator [post-implementation]
A.4. Discussion Guide for Building and Strengthening Iowa Community Support Nutrition and Physical Activity Program Implementing Agency Social Marketing Manager [pre-implementation]
A.5. Discussion Guide for Building and Strengthening Iowa Community Support Nutrition and Physical Activity Program Implementing Agency Social Marketing Manager [post-implementation]
A.6. Discussion Guide for Building and Strengthening Iowa Community Support Nutrition and Physical Activity Program Project Director [pre-implementation]
A.7. Discussion Guide for Building and Strengthening Iowa Community Support Nutrition and Physical Activity Program Project Director [post-implementation]
A.8. Discussion Guide for Building and Strengthening Iowa Community Support Nutrition and Physical Activity Program Direct Nutrition Educators [pre-implementation]
A.9. Discussion Guide for Building and Strengthening Iowa Community Support Nutrition and Physical Activity Program direct nutrition educators [post-implementation]
A.10. Discussion Guide for Retail Store Managers or Registered Dieticians [post-implementation]
A.11. Discussion Guide for Demonstrators at Retail Outlets (Dietetic Students) [post-implementation]
A.12. Discussion Guide for Building and Strengthening Iowa Community Support Nutrition and Physical Activity Program Classroom Teachers [post-implementation]
A.13. Discussion Guide for Building and Strengthening Iowa Community Support Nutrition and Physical Activity Program school principals [post-implementation]
A.14. Focus Group Guide for parents of students participating in the Building and Strengthening Iowa Community Support Nutrition and Physical Activity Program [post implementation]
A.15. Building and Strengthening Iowa Community Support Nutrition and Physical Activity Program Lesson Observation Form
A.16. Web Questionnaire for Building and Strengthening Iowa Community Support Nutrition and Physical Activity Program classroom teachers [pre-implementation]
A.17. Web Questionnaire for Building and Strengthening Iowa Community Support Nutrition and Physical Activity Program Classroom Teachers [post-implementation]
A.18. Building and Strengthening Iowa Community Support Nutrition and Physical Activity Program Classroom Teacher Monthly Supplemental Activity Log Forms
A.19. Building and Strengthening Iowa Community Support Nutrition and Physical Activity Program Nutrition Educator Monthly Supplemental Activity Log Forms

BASICS Nutrition and Physical Activity Program INN ● Program Evaluation
A.1. Building and Strengthening Iowa Community Support Nutrition and Physical Activity Program Data Abstraction Form

Data Abstraction Form for IA Application to FNS and 2010 SNAP-Ed Plans
[PRE-IMPLEMENTATION]
IA:
State:
Program name:
Data abstractor:
Date of abstraction:
Resources used:

TOPIC AREA 1: Formative Research and Intervention Design
1-1. Target audience(s)
1-2. Reach or intended size of intervention
1-3. Description of nutrition education intervention
a. Overall intervention goal(s)
b. The key education methods being used in the nutrition education intervention, including how this may vary for different target audiences (e.g., children versus their caregivers)
c. Description of each nutrition education lesson in detail using the following format:
Short title:
Detailed description of education message:
Specific objectives:
Intended impact/change
Materials supporting lesson
1-4. Anticipated dose and intensity of each nutrition education intervention method
a. Direct education
Dosage (# of contacts with each participant)
Intensity (# of contacts X length of contact)
b. Indirect education
Dose (# of contacts with each participant)
Intensity (# of contacts X length of contact)
c. Social marketing [Pick a better snack]
Dose (# of contacts with each participant)
Intensity (# of contacts X length of contact)
d. Other
Dose (# of contacts with each participant)
Intensity (# of contacts X length of contact)

1-5. Nutrition education materials (Title, source, how to locate source)
a. Materials developed by FNS
If modified FNS materials, how and why?
b. Materials developed by other State SNAP-Ed programs
If modified these existing materials, how and why?
c. Materials developed by other public nutrition educations programs
If modified these existing materials, how and why?
d. Materials developed by private agencies
If modified these existing materials, how and why?
e. Materials developed by project
f. Other
1-6. Theoretical underpinnings for nutrition education
1-7. Evidence that suggest the intervention will be successful (e.g., pilot project results, previously tested instruments)
1-8. Key players in the design of the intervention
a. Who were the key players from the implementing agency?
b. Were there any partnerships with other public or private organizations that were key to the design and implementation plan of the intervention?
c. If so, how were these partnerships formed?
d. Other key players?
TOPIC AREA 2: Operational Steps Involved in Intervention Implementation
2-1. Management and oversight structure
a. Who are the program administrators and coordinators?
b. Who is responsible for quality control and monitoring the nutrition education delivery?
2-2. Qualifications of nutrition educator trainer(s)
a. Level of education
b. On-the-job training
c. Years of experience
2-3. Qualifications of nutrition education provider(s)
a. Level of education
b. Specialized training
c. Years of experience delivering nutrition education
2-4. Plans for training of nutrition education providers (e.g., frequency and duration of training, training agenda and method)
2-5. Recruitment of intervention sites/participants
a. How were individual intervention sites selected to participate in the intervention (specifically for this FNS evaluation component)?
b. How will individual classrooms be selected to participate in the intervention?
c. How will the adult participants be recruited to participate in the intervention?
2-6. Efforts planned to retain participants in order to receive the desired maximum dose of the intervention

BASICS Nutrition and Physical Activity Program INN ● Program Evaluation
A.2. Discussion Guide for Building and Strengthening Iowa Community Support Nutrition and Physical Activity Program Implementing Agency Principal Investigator [pre-implementation]

SNAP-Ed Wave II: Discussion Guide for Implementing Agency Program Administrator [PRE-IMPLEMENTATION]
State:
Respondent/Title/Organization:
Address:
Phone:
Fax:
E-mail:
Interviewer:
Date of Interview:
Time of Interview:
Thank you for taking the time for this interview. The U.S. Department of Agriculture’s Food and Nutrition Service has contracted with Altarum Institute to conduct a study of [NAME OF PROGRAM] that is offering information to older adults/children and their families about healthy foods to eat and the importance of being active. Altarum is a health and nutrition policy research and consulting institute, and our work focuses on helping improve the health and nutrition status of children, families, and adults. The purpose of the study is to evaluate several Supplemental Nutrition Assistance Program-Education (SNAP-Ed) models around the country and to provide recommendations for how these interventions could be improved to better serve the older adults/children and families in your community. We also will evaluate how the intervention might be replicated in other communities. Although there are only a select number of programs participating in this evaluation, we will do our best to aggregate data wherever possible in order to avoid information being tied back to a particular respondent. Nothing that is said today will be attached to you, and nothing that you say will affect your job or be shared with your employers. Today we will specifically discuss the planning process and your expectations for the intervention. Once it has been implemented, we will follow up with you to find out whether the intervention met your expectations and how it might be improved. I expect that this interview will take about 45 minutes. Thank you for taking the time to speak with me. Before I begin, do you have any questions?
Office of Management and Budget (OMB) No. 0584-0554 Expiration Date: 06/30/2014
The public reporting burden for this collection of information is estimated to average 40 minutes per response,
including the time for reviewing instructions, searching existing data sources, gathering and maintaining the
data needed, and completing and reviewing the collection of information. An agency may not conduct or
sponsor, and a person is not required to respond to, a collection of information unless it displays a currently
valid OMB control number. Send comments regarding this burden estimate or any other aspect of this
collection of information, including suggestions for reducing this burden, to the following address: U.S.
Department of Agriculture, Food and Nutrition Services, Office of Research and Analysis, Room 1014,
Alexandria, VA 22302, ATTN: PRA (0584-0554). Do not return the completed form to this address.

1. Can you please describe your role as program administrator?
2. Do you also play a role in the budget management for the project? If not, who is responsible for the project budget?
3. Can you please describe your role in the program design/evaluation?
4. What challenges, if any, have you faced during the design and planning phases of this nutrition education program?
5. What factors do you feel have contributed most to a successful design and planning phase (e.g., using education materials that were already developed, good communication between contributors, knowledgeable staff, establishment of strong partnerships)?
6. What lessons have you learned during this key phase of program development?
(a) What would you do differently? Why? (b) What would you do the same? Why?
Now I would like to shift our focus to the upcoming implementation of your SNAP-Ed project.
7. Now that you are ready to transition from the planning and design phase of your project to the implementation phase, what challenges, if any, are you anticipating? Why? How do you think you will address these challenges?
8. Do you feel that the environment in which the intervention will take place will be able to support the intended change in behavior, knowledge, and/or attitudes? For example, do you have any sense of the teachers and schools buy-in and/or enthusiasm about the intervention and what impact this might have on the children?
9. Does the school/senior center offer the children/older adults healthy food options, or are healthy foods otherwise available?
10. What, if any, other nutrition education messages are the older adults/children in the intervention sites being exposed to (that you are aware of)? Did the program have any difficulty recruiting adequate staff for the nutrition education delivery? If so, what were the recruitment challenges/problems?
11. Please describe the training the nutrition educators have received or will receive (e.g., frequency and duration of training, training agenda and objectives).
(a) Who will do the direct training? (b) When will these trainings be provided? (c) What topics will be covered in the training? (d) What is the training outline/agenda? (e) In what format will the training be conducted? (f) Qualifications of trainer(s):
Level of education
Specialized education
Years of experience in nutrition or health education
Experience working with this target population
12. Do the educators have flexibility in how they deliver the program, or are they directed to follow the curriculum strictly as written? How will that be assessed?
13. Please describe any quality control and monitoring efforts that will take place during implementation (e.g., of nutrition education delivery, of nutrition education data collection).
14. What specific guidance and materials are planned to be provided to direct educators to work with the sites to recruit the adult participants for the intervention?

15. How will the demonstration project be tracking the number of children/adults enrolled in each class at each intervention site?
16. Will the demonstration project be tracking dosage at the individual level (e.g., which lessons participants take part in)? How will this be tracked?
Social Marketing
17. Can you please describe your role in the program and evaluation design of the social marketing campaign?
18. Could you describe the steps you have taken to design the social marketing campaign?
PROBE: With whom did you work to design the campaign? What media are used in the social marketing campaign, and how are they used? How are the media used (e.g., what specific messages are used with which media)?
19. Describe the process of selecting the retail grocery stores for the social marketing campaign.
20. Describe the social marketing activities that you have planned for the grocery stores.
PROBE: How often will these activities take place? Who will implement these activities? How will these staff interact with the grocery stores? What role will the produce manager have in the social marketing activities?
21. What challenges, if any, have you faced during the design and planning phases of the social marketing campaign?
22. What factors do you feel have contributed most to a successful design and planning phase (e.g., building on the previous Pick a better snack social marketing plans/designs, good communication between contributors, knowledgeable staff, establishment of strong partnerships)?
23. What lessons have you learned during this key phase of program development?
(c) What would you do differently? Why? (d) What would you do the same? Why?
24. Now that you are ready to transition from the planning and design phase of the social marketing campaign to the implementation phase, what challenges, if any, are you anticipating? Why?
PROBES: Identify the challenges. How do you think you will address these challenges? Now I’d like to focus on partnerships you have developed to assist with the implementation of your project.
25. I brought the Key Program Staff and Partnering Agencies form that you completed for the April kickoff meeting in Alexandria and wanted to check for any updates to this form. If there are any, ask to revise the form.
26. How do these partnerships enhance your intervention?
27. Have there been any challenges in developing these partnerships?
28. Would you recommend these partners to other States who might replicate your project?
That ends my formal interview questions. Do you have any comments or recommendations that you would like to add? Thank you very much for your time and input on this very important project. As I mentioned, we will follow up and talk with you after the intervention and evaluation period are over.

BASICS Nutrition and Physical Activity Program INN ● Program Evaluation
A.3. Discussion Guide for Building and Strengthening Iowa Community Support Nutrition and Physical Activity Program Implementing Agency Principal Investigator [post-implementation]

SNAP-Ed Wave II: Discussion Guide for Demonstration Project Program Administrator [POST-IMPLEMENTATION]
State:
Respondent/Title/Organization:
Address:
Phone:
Fax:
E-mail:
Interviewer:
Date of Interview:
Time of Interview:
Thank you for taking the time for this interview. As I told you during our last meeting, the U.S. Department of Agriculture’s Food and Nutrition Service (FNS) has contracted with Altarum Institute to conduct a study of the [NAME OF INTERVENTION] that is offering information to children and their families about healthy foods to eat and the importance of being active. Altarum is a health and nutrition policy research and consulting institute, and our work focuses on helping improve the health and nutrition status of children, families, and adults. As mentioned during our last meeting, nothing that is said today will be attached to you, and nothing that you say will affect your job or be shared with your employers. Today we will specifically discuss how the implementation of the program differed from your expectations. We also will discuss lessons learned and your feedback on how the program might be improved. I expect that this discussion will take about 40 minutes. I appreciate you taking the time to speak with me today. Before I begin, do you have any questions?
Office of Management and Budget (OMB) No. 0584-0554 Expiration Date: 06/30/2014
The public reporting burden for this collection of information is estimated to average 40 minutes per response,
including the time for reviewing instructions, searching existing data sources, gathering and maintaining the
data needed, and completing and reviewing the collection of information. An agency may not conduct or
sponsor, and a person is not required to respond to, a collection of information unless it displays a currently
valid OMB control number. Send comments regarding this burden estimate or any other aspect of this
collection of information, including suggestions for reducing this burden, to the following address: U.S.
Department of Agriculture, Food and Nutrition Services, Office of Research and Analysis, Room 1014,
Alexandria, VA 22302, ATTN: PRA (0584-0554). Do not return the completed form to this address.
Formative Research and Program Design
I’d like to briefly discuss how, if at all, the implementation of your nutrition education intervention differed from what was originally planned. There are several aspects of implementation that I would like to cover.
1. Were the nutrition education messages for the intervention modified at any point during implementation? If so, how and why were they modified?
2. Did the target audience differ from what was originally planned? If so, how and why did they differ?
3. Were the methods of delivery (e.g., direct education, indirect education) modified during implementation for any reason? If so, how and why were they changed?
4. Did the dose of nutrition education vary from what was originally planned (e.g., the number of lessons, the length of each lesson)? If so, how and why did this vary from what was planned?
5. Were you able to implement the intervention at the originally proposed number of sites and do you feel that you reached the intended number of participants? Were there any factors that affected your ability to achieve the full, intended reach?
6. Were the nutrition education materials modified at any point during implementation? If so, how were the materials modified, and why?
7. To what extent were the original implementation timelines met? What are the reasons for and implications of any departures from the original timelines?
Operational Steps Involved in Program Implementation
8. Did you find the level of staff, in terms of both qualifications and the total number of staff (and types of staff), adequate for optimally delivering your nutrition education intervention?
9. What changes, if any, were made to planned key staff involvement, and why?
10. Were any quality control and monitoring processes employed to maximize the fidelity/quality of the intervention delivery?
11. How effective were staff in delivering the intended nutrition education messages?
(a) Why do you think these staff were effective/ineffective? (b) What could they have done differently to improve their effectiveness?
12. Please describe the nutrition education training provided for the implementation of this intervention and how it was different from what you had planned.
13. Do you think the nutrition educator training was sufficient?
(a) What worked well? (b) What could have been improved?
14. Were planned recruitment (of older adult participants/parents) efforts modified during implementation? If so, how were recruitment efforts modified and for what reasons?
15. What recruitment methods did you find to be most effective/least effective?
16. In your opinion, how well was the direct program able to track participation in the direct education?
17. Did previously identified partners remain engaged throughout the intervention?
18. Were these partnerships successful?
[IF YES] (a) How were they successful? (b) What would you say contributed to their success?
[IF NO] (a) Why not?
Social Marketing Campaign [INN ONLY]
19. Was the social marketing campaign modified at any point during the intervention?
PROBE: Modification could include methods used to implement the social marketing campaign, nutrition messages used in the campaign, retail stores identified for the implementation of the campaign, types and frequency of food demonstrations conducted in the retail stores, and more.
PROBE: If the campaign was modified from the original plan, why was the modification necessary? [Describe any barriers to implementation of the original plan.]
Resources Devoted to Intervention
20. What were the actual time commitments for key staff (full-time employees) if different than planned? Why did they differ?
21. How closely did the actual program cost components reflect the budgeted costs? If there was a difference between budgeted and actual, what factors might have contributed to this?
22. Were the necessary type and quantity of materials, technology, etc. available to carry out the implementation as planned? If not, what else was needed?
Lessons Learned for Improvement and Replicability
Next I’d like to talk about lessons learned during implementation of the study.
23. Overall, what factors were key to the success of this nutrition education program?
24. What factors hindered or limited the success of this nutrition education program?
25. Looking back over the past [NUMBER OF MONTHS] months, what lessons have you learned? What would be most valuable for another State or implementing agency to know if they were considering using this model?
26. In your opinion, are there any aspects of this Supplemental Nutrition Assistance Program-Education program that would make it difficult to implement on a larger scale?
27. How did the FNS requirements for this demonstration project influence the design of your intervention project in ways that you had not anticipated when you applied to become a demonstration project?
That ends my formal interview questions. Do you have any comments or recommendations that you would like to add? Thank you very much for your time and input on this very important project.

BASICS Nutrition and Physical Activity Program INN ● Program Evaluation
A.4. Discussion Guide for Building and Strengthening Iowa Community Support Nutrition and Physical Activity Program Implementing Agency Social Marketing Manager [pre-implementation]

SNAP-Ed Wave II: Discussion Guide for Implementing Agency Social Marketing Manager [PRE-IMPLEMENTATION]
State:
Respondent/Title/Organization:
Address:
Phone:
Fax:
E-mail:
Interviewer:
Date of Interview:
Time of Interview:
Thank you for taking the time for this interview. The U.S. Department of Agriculture’s Food and Nutrition Service has contracted with Altarum Institute to conduct a study of the Iowa Nutrition Network (INN) Building and Strengthening Iowa Community Support for Nutrition and Physical Activity program that is offering information to older adults/children and their families about healthy foods to eat and the importance of being active. Altarum is a health and nutrition policy research and consulting institute, and our work focuses on helping improve the health and nutrition status of children, families, and adults. The purpose of the study is to evaluate several Supplemental Nutrition Assistance Program-Education models around the country and to provide recommendations for how these interventions could be improved to better serve the older adults/children and families in your community. We also will evaluate how the intervention might be replicated in other communities.
Although there are only a select number of programs participating in this evaluation, we will do our best to aggregate data wherever possible in order to avoid information being tied back to a particular respondent. Nothing that is said today will be attached to you, and nothing that you say will affect your job or be shared with your employers.
Today we will specifically be discussing the planning process and your expectations for the social marketing intervention. Once it has been implemented, we will follow up with you to find out whether the intervention met your expectations and how it might be improved. I expect that this interview will take about 45 minutes. Thank you for taking the time to speak with me.
Before I begin, do you have any questions?
Office of Management and Budget (OMB) No. 0584-0554 Expiration Date: 06/30/14
The public reporting burden for this collection of information is estimated to average 40 minutes per response,
including the time for reviewing instructions, searching existing data sources, gathering and maintaining the
data needed, and completing and reviewing the collection of information. An agency may not conduct or
sponsor, and a person is not required to respond to, a collection of information unless it displays a currently
valid OMB control number. Send comments regarding this burden estimate or any other aspect of this
collection of information, including suggestions for reducing this burden, to the following address: U.S.
Department of Agriculture, Food and Nutrition Services, Office of Research and Analysis, Room 1014,
Alexandria, VA 22302, ATTN: PRA (0584-0554). Do not return the completed form to this address.

1. Can you please describe your role as the social marketing manager?
2. Do you also play a role in the budget management for this project? If not, who is responsible for the social marketing campaign budget?
3. Can you please describe your role in the program design/evaluation of the social marketing campaign?
4. PROBE: Since the Pick a better snack campaign has been in existence for many years, could you describe the evolution of the campaign?
5. What formative research has been conducted on the campaign?
6. What are the theoretical underpinnings of the social marketing campaign?
7. Could you describe the steps you have taken to design this social marketing campaign for this study?
8. Were the new components of this campaign added to the existing campaign components, or did you start from scratch, design a new campaign and add some of the existing components?
9. With whom did you work to design the campaign, and could you describe their role?
10. What process was used to select this marketing company?
11. Would it have been possible for the INN to develop this campaign on your own without a marketing contractor?
12. What media are used in the social marketing campaign, and how are they used?
13. What are the core social marketing messages?
14. Can you provide us with a diagram or illustration of the planned social marketing channels, anticipated reach, anticipated numbers of materials you plan to distribute, and media messages aired by type (e.g., radio, TV)—in other words, a visual of your social marketing plan?
15. Describe the process of selecting the retail grocery stores for the social marketing campaign. [Review the GIS maps Christine Hradek developed for the INN project.]
16. Describe the social marketing activities that you have planned for the grocery stores.
17. How often will these activities take place?
18. Who will implement these activities?
19. How will these staff interact with the grocery stores?
20. What role will the produce manager have in the social marketing activities?
21. What role will the dairy manager have in the social marketing activities?
22. What challenges, if any, have you faced during the design and planning phases of this social marketing campaign?
23. What factors do you feel have contributed most to a successful design and planning phase (e.g., using education materials that were already developed, good communication between contributors, knowledgeable staff, establishment of strong partnerships)?
24. What lessons have you learned during this key phase of program development?
25. What would you do differently? Why?
26. What would you do the same? Why?
Now I would like to shift our focus to the upcoming implementation of the social marketing campaign.
27. Now that you are ready to transition from the planning and design phase of your project to the implementation phase, what challenges, if any, are you anticipating?

28. Why?
29. How do you think you will address these challenges?
30. Do you have any sense of the buy-in and/or enthusiasm about the social marketing campaign from retail stores and media?
31. How do you feel the buy-in (or lack of buy-in) will have on changing the behavior of the students and their parents?
32. What, if any, other social marketing nutrition education messages are children and their families exposed to at this time in Iowa (that you are aware of)?
33. Please describe any training the dietetic program students received or will receive to prepare them for demonstrations in retail outlets (e.g., frequency and duration of training, training agenda and objectives).
(a) Who will do the direct training?
(b) When will these trainings be provided?
(c) What topics will be covered in the training
(d) What is the training outline/agenda?
(e) What format will the training be conducted
(f) Qualifications of trainer(s):
Level of education
Specialized education
Years of experience in nutrition or health education
Experience working with this target population
34. What specific guidance and materials are planned for the students to use at the demonstration booths?
35. Do the students have flexibility in how they deliver the program, or are they directed to follow a prescribed script?
36. How will the demonstration be assessed, e.g. will there be quality control measures implemented for the demonstrations?
37. What lessons have you learned during this key phase of the social marketing campaign program development?
38. What would you do differently? Why?
39. What would you do the same? Why?
40. Now I’d like to focus on partnerships you have developed to assist with the implementation of your project.
41. Who are your partners in the social marketing campaign?
42. How do these partnerships enhance your intervention?
43. Have there been any challenges in developing these partnerships?
44. Would you recommend these partners to other States who might replicate your social marketing model?
45. That ends my formal interview questions. Do you have any comments or recommendations that you would like to add?
46. Thank you very much for your time and input on this very important project. As I mentioned, we will follow up and talk with you after the intervention and evaluation period are over.

BASICS Nutrition and Physical Activity Program INN ● Program Evaluation
A.5. Discussion Guide for Building and Strengthening Iowa Community Support Nutrition and Physical Activity Program Implementing Agency Social Marketing Manager [post-implementation]

SNAP-Ed Wave II: Discussion Guide for BASICS Social Marketing Manager [POST-IMPLEMENTATION]
State: Iowa
Respondent/Title/Organization:
Address:
Phone:
Fax:
E-mail:
Interviewer:
Date of Interview:
Time of Interview:
Thank you for taking the time for this interview. As I told you during our last meeting, the U.S. Department of
Agriculture’s Food and Nutrition Service (FNS) has contracted with Altarum Institute to conduct a study of the
Building and Strengthening Iowa Community Support for Nutrition and Physical Activity program that is offering
information to children and their families about healthy foods to eat and the importance of being active. Altarum
is a health and nutrition policy research and consulting institute, and our work focuses on helping improve the
health and nutrition status of children, families, and adults.
As mentioned during our last meeting, nothing that is said today will be attached to you, and nothing that you say
will affect your job or be shared with others.
Today we will specifically discuss how the implementation of the program differed from your expectations. We
also will discuss lessons learned and your feedback on how the program might be improved. I expect that this
discussion will take about 40 minutes. I appreciate you taking the time to speak with me today.
Before I begin, do you have any questions?
Office of Management and Budget (OMB) No. 0584-0554 Expiration Date: 06/30/14
The public reporting burden for this collection of information is estimated to average 40 minutes per response,
including the time for reviewing instructions, searching existing data sources, gathering and maintaining the
data needed, and completing and reviewing the collection of information. An agency may not conduct or
sponsor, and a person is not required to respond to, a collection of information unless it displays a currently
valid OMB control number. Send comments regarding this burden estimate or any other aspect of this
collection of information, including suggestions for reducing this burden, to the following address: U.S.
Department of Agriculture, Food and Nutrition Services, Office of Research and Analysis, Room 1014,
Alexandria, VA 22302, ATTN: PRA (0584-0554). Do not return the completed form to this address.

Formative Research and Program Design
I’d like to briefly discuss how, if at all, the implementation of the social marketing campaign differed from what was
originally planned. There are several aspects of implementation that I would like to cover.
1. Was the social marketing campaign modified at any point during the intervention?
PROBE: Modification could include methods used to implement the social marketing campaign design, nutrition messages used in the campaign, retail stores identified for the implementation of the campaign, content and frequency of food demonstrations conducted in the retail stores, and more.
PROBE: If the campaign was modified from the original plan, why was the modification necessary? [Describe any barriers to implementation of the original plan.]
2. Did the target audience differ from what was originally planned? If so, how and why did they differ? [For example, did the racial/ethnic mix change?]
3. Were the methods of delivery (e.g., posters, materials, TV, radio) modified during implementation for any reason? If so, how and why were they changed?
4. Did the dose of the social marketing campaign vary from what was originally planned (e.g., the number of posters distributed, number of other materials distributed, length of messages in media, number of times the messages ran, number of outlets that aired the messages)? If so, how and why did this vary from what was planned?
5. Were the social marketing materials (e.g., banners, posters) placed as planned and stay up for the period intended? If not, what happened and how was this resolved?
6. If you were able to implement the social marketing campaign as originally planned, do you feel that you reached the intended number of individuals and families in the target audience? Were there any factors that affected your ability to achieve the full, intended reach?
7. Were the social marketing materials modified at any point during implementation? If so, how were the materials modified, and why?
8. To what extent were the original implementation timelines met? What are the reasons for and implications of any departures from the original timelines?
Operational Steps Involved in Program Implementation
9. Did you find the marketing contractor qualifications and skills adequate for development of the campaign?
10. Did you find the media outlets cooperative in airing the messages for the social marketing campaign? Did you get free air time? If so, can you document it?
11. Did you find the student demonstrator qualifications and skills adequate for delivering the social marketing messages?
12. What changes, if any, were made to your planned work with the marketing consultant, and why?
13. Were any quality control and monitoring processes employed to maximize the fidelity/quality of the delivery?
14. How effective the media outlets and demonstrations in delivering the intended nutrition messages?
(a) Why do you think they were effective/ineffective? (b) What could they have done differently to improve their effectiveness?
15. Please describe the nutrition education training provided for the implementation of this social marketing campaign and how it was different from what you had planned.

16. Do you think the training for student demonstrators was sufficient?
17. What worked well?
18. What could have been improved?
19. Probe: Could you provide us with the training materials, scripts, guidance, and other aids used by the students?
20. In your opinion, how well was the social marketing campaign able to track reach [documentation from media outlets; numbers of people who stopped by the demonstration booth at the supermarket; increase in sales of fruits, vegetables, and low-fat milk at retail stores]?
21. Did previously identified partners remain engaged throughout the intervention?
22. Were these partnerships successful?
[IF YES] (a) How were they successful? (b) What would you say contributed to their success?
[IF NO] (a) Why not?
Resources Devoted to Intervention
23. What were the actual time commitments for key staff (full-time employees) if different than planned? Why did they differ?
24. How closely did the actual program cost components reflect the budgeted costs? If there was a difference between budgeted and actual, what factors might have contributed to this?
25. Were the necessary type and quantity of materials, technology, etc. available to carry out the implementation as planned? If not, what else was needed?
Lessons Learned for Improvement and Replicability
Next I’d like to talk about lessons learned during implementation of the study.
26. Overall, what factors were key to the success of this social marketing campaign?
27. What factors hindered or limited the success of this social marketing campaign?
28. Looking back over the past 7 months, what lessons have you learned? What would be most valuable for another State or implementing agency to know if they were considering using this model?
29. In your opinion, are there any aspects of this program that would make it difficult to implement on a larger scale?
30. How did the FNS requirements for this demonstration project influence the design of your intervention project in ways that you had not anticipated when you applied to become a demonstration project?
That ends my formal interview questions. Do you have any comments or recommendations that you would like to add?
Thank you very much for your time and input on this very important project.

BASICS Nutrition and Physical Activity Program INN ● Program Evaluation
A.6. Discussion Guide for Building and Strengthening Iowa Community Support Nutrition and Physical Activity Program Project Director [pre-implementation]

SNAP-Ed Wave II: Discussion Guide for BASICS Project Directors [PRE-IMPLEMENTATION]
State:
Respondent/Title/Organization:
Address:
Phone:
Fax:
E-mail:
Interviewer:
Date of Interview:
Time of Interview:
Thank you for taking the time for this interview. The U.S. Department of Agriculture’s Food and Nutrition Service (FNS) has contracted with Altarum Institute to conduct a study of the Iowa Nutrition Network (INN) Building and Strengthening Iowa Community Support for Nutrition and Physical Activity (BASICS) program that is offering information to children and their families about healthy foods to eat and the importance of being active. Altarum is a health and nutrition policy research and consulting Institute and our work focuses on helping to improve the health and nutrition status of children, families, and adults. The purpose of the study is to evaluate several SNAP-Ed models around the country and to provide recommendations for how these interventions could be improved to better serve the children and families in your community. We also will evaluate how the intervention might be replicated in other communities. We will be using first names only today. Everything that you say will be kept private. After we conduct several of these interviews, we will write a report for the FNS. Your name will not appear anywhere in the report. Nothing that is said today will be attached to your name at any point. Nothing that you say will affect your job or be shared with your employers. Today we will specifically be discussing your background and other qualifications as an educator for this education program, the planning process that has already begun with the intervention sites, and your expectations for the reach and design of the program. Once you have completed teaching the eight BASICS lessons (and the classroom teacher has taught her four lessons), we will follow up with you for one more interview to find out how things may
Office of Management and Budget (OMB) No. 0584-0554 Expiration Date: 06/30/2014
The public reporting burden for this collection of information is estimated to average 30 minutes per response,
including the time for reviewing instructions, searching existing data sources, gathering and maintaining the
data needed, and completing and reviewing the collection of information. An agency may not conduct or
sponsor, and a person is not required to respond to, a collection of information unless it displays a currently
valid OMB control number. Send comments regarding this burden estimate or any other aspect of this
collection of information, including suggestions for reducing this burden, to the following address: U.S.
Department of Agriculture, Food and Nutrition Services, Office of Research and Analysis, Room 1014,
Alexandria, VA 22302, ATTN: PRA (0584-0554). Do not return the completed form to this address.

have changed from what you planned to do and to obtain your experiences and views on what worked well or not and why, and what you might change to improve the program. I expect that our discussion today will take about 30 minutes. Before I begin, do you have any questions?
Director’s Job Title, Qualifications, and Capabilities
First I would like to ask you a few questions about your position and your background for this type of work.
1. What is your job title for the INN BASICS program?
2. Do you also provide project direction for any other programs?
[IF YES] (a) Please tell me a little bit about your other related work. (b) How long have you been a project director?
3. What percent time are you working as a project director for the BASICS program? (are you full-time or part-time)
4. Could you describe your role as project director?
5. What are some of the challenges that you or others like you might face in being a good project director for the BASICS program?
Training Provided by the Demonstration Project
6. Did the Iowa Nutrition Network provide training for you to oversee the implementation of this curriculum? If so, please describe the training you received (who provided, number of hours, where the training was held, what materials were used).
7. Do you think that the training provided you with the skills and materials to effectively provide oversight for this project? Pease describe why you think this.
8. What recommendations, if any, do you have for how the training could be improved?
Recruitment and Implementation Plans
Next I would like to discuss the recruit of schools for the BASICS program and how many school and classes your educator will work with.
9. Do you know which schools your nutrition educator will be teaching the BASICS classes?
[IF NO, SKIP TO QUESTION 19] [IF YES]
(a) Could you please confirm the schools? (b) When does your nutrition educator plan to start the lessons at the schools with which you will
work?
10. Do you know how these schools were recruited?
(a) How were the schools recruited? (b) Who did the site recruiting, and how did they reach out to enroll the sites? (c) Are these schools that the BASICS curriculum has been taught at in the past? (d) Do you think this was an effective way to select the sites? Why or why not? (e) Were there any challenges in recruiting the targeted schools?
11. Has your nutrition educator visited or otherwise been in contact with the schools yet to talk about your plans for the BASICS lessons?
12. Do you know how the classrooms were recruited?
13. Do you know the teachers in the recruited schools who will be teaching four of the BASICS lessons?

(a) What are their roles? (b) Do you have any sense of their buy-in and/or enthusiasm about the intervention and what
impact this might have on participation? (c) Did you participate in the training INN provided to the teachers who will be teaching the four
BASICS lessons?
14. What physical resources will your nutrition educator need at the sites to implement the intervention (e.g., space, audiovisual equipment, and computers)?
Scheduling
In order to plan our site visits, we need to know specific information about the scheduling of your classes.
15. How many classrooms or groups of children will your nutrition educator teach at each of these schools?
(a) Will there be any joint classes combining classrooms or teach each classroom of children separately? How often (days per week/month) will your nutrition educator be going out to the schools to teach these students? How long will each class or activity be? What time of day will they be providing the education?
(b) How many children do you expect will be involved in each class?
(c) Will you be assisting your nutrition educator during any of the lessons?
(d) Do you have a written schedule yet of the dates and times for all the classes? If so, could you provide a copy of this schedule to us?
(e) How can we best stay in touch with you to confirm the schedule for teaching at the selected schools (e.g., phone, e-mail)?
16. Is there anything unique about the schools where your nutrition educator will be teaching the BASICS program or the population of children at these schools that you think will require your nutrition educator to tailor the program to better meet the needs of children and their parents these schools? If so, how will the program be tailored to address these needs?
Perceived Facilitators and Challenges to Intervention Success
17. Based on what you know about the curriculum, materials, and other aspects of the BASICS program, what components of this curriculum do you think will be most effective with the students your nutrition educator will be teaching?
18. Do you feel that it will be effective to have the classroom teachers teach four of the lessons, instead of having your nutrition educator teach all 12?
19. Before we close, I would like to ask you whether you foresee any challenges in the implementation of this curriculum as planned. If so, might those be potential challenges, and how might they be overcome?
That ends my formal interview questions. Do you have any comments or recommendations that you would like to add?
Thank you very much for your time and input on this important project. My colleagues and I at Altarum will get back in touch with you to schedule a follow-up interview after you finish teaching the BASICS program. I look forward to talking with you then.

BASICS Nutrition and Physical Activity Program INN ● Program Evaluation
A.7. Discussion Guide for Building and Strengthening Iowa Community Support Nutrition and Physical Activity Program Project Director [post-implementation]

SNAP-Ed Wave II: Discussion Guide for BASICS Project Directors [POST-IMPLEMENTATION]
State:
Respondent/Title/Organization:
Address:
Phone:
Fax:
E-mail:
Interviewer:
Date of Interview:
Time of Interview:
Thank you for taking the time for this interview. The U.S. Department of Agriculture’s Food and Nutrition Service (FNS) has contracted with Altarum Institute to conduct a study of the Iowa Nutrition Network (INN) Building and Strengthening Iowa Community Support for Nutrition and Physical Activity (BASICS) program that is offering information to older adults/children and their families about healthy foods to eat and the importance of being active. Altarum is a health and nutrition policy research and consulting institute, and our work focuses on helping to improve the health and nutrition status of children, families, and adults. The purpose of the study is to evaluate several Supplemental Nutrition Assistance Program-Education models around the country and to provide recommendations for how these interventions could be improved to better serve the children and families in your community. We also will be evaluating how the intervention might be replicated in other communities. We will be using first names only today. Everything that you say will be kept private except as otherwise required by law. After we conduct several of these interviews, we will write a report for the FNS. Your name will not appear anywhere in the report. Nothing that is said today will be attached to your name at any point. Nothing that you say will affect your job or be shared with your employers. Today we will discuss how the BASICS program was implemented and what might have changed from the original plan. I expect that our discussion today will take about 30 minutes. Before I begin, do you have any questions?
Office of Management and Budget (OMB) No. 0584-0554 Expiration Date: 06/30/14
The public reporting burden for this collection of information is estimated to average 30 minutes per response,
including the time for reviewing instructions, searching existing data sources, gathering and maintaining the
data needed, and completing and reviewing the collection of information. An agency may not conduct or
sponsor, and a person is not required to respond to, a collection of information unless it displays a currently
valid OMB control number. Send comments regarding this burden estimate or any other aspect of this
collection of information, including suggestions for reducing this burden, to the following address: U.S.
Department of Agriculture, Food and Nutrition Services, Office of Research and Analysis, Room 1014,
Alexandria, VA 22302, ATTN: PRA (0584-0554). Do not return the completed form to this address.

Training Provided by the Demonstration Project (INN)
We are interested in how the BASICS training prepared your nutrition educator and the classroom teacher to teach the curriculum in the classroom. This first set of questions focuses on this topic area.
1. Now that your nutrition educator has taught the BASICS curriculum, do you feel the training provided by the INN provided her with the skills to effectively implement this curriculum? If so, please describe how the training helped her implement the BASICS curriculum. [If not, why not?] What recommendations, if any, do you have for how the training could be improved for your nutrition educator and for the classroom teachers?
2. In teaching the BASICS curriculum, was your nutrition educator able to follow the curriculum as it was designed, or did she supplement the materials given to her at the training?
3. Did the classroom teachers follow the curriculum as designed, or did they supplement the materials given to them at training?
4. Were there take-home materials for the students to complete with their parents? If so, do you know if parents completed them (how do you know if parents completed them)?
5. What are your feelings (and the feelings of your nutrition educator) about the ease of teaching the BASICS curriculum? E.g., was it easy to teach with clear instructions and had a focused approach?
Recruitment and Implementation
Next I would like to discuss planned recruitment of sites and participants for the intervention, versus what actually happened.
6. Looking back at the recruitment of the schools for the BASICS intervention, do you feel that you might have done anything different in your (your nutrition educator’s) recruitment methods?
7. In thinking about the implementation of the BASICS curriculum, how effective do you feel the model of having the nutrition educator teach eight lessons and the classroom teacher teach four lessons was? Were there any challenges in this delivery model?
8. Were the classroom teachers engaged and enthusiastic about teaching the BASICS curriculum?
9. Were the classroom teachers in the room when your nutrition educator taught her eight lessons? (Was this tracked? If so, do you have a record of this?)
10. If a teacher was not engaged and enthusiastic, what impact do you think it had on the intervention?
11. What physical resources did you end up needing at the sites to implement the intervention (e.g., space, audiovisual equipment, computers)? Was this as planned?
12. Were there any other nutrition education activities going on at the school while the BASICS curriculum was implemented? If so, what were they? [Could you describe these programs?]
13. Do you think these other nutrition education activities enhanced or took away from the BASICS curriculum?
Scheduling and Unique Features
We’d like to know more about how your schedule of classes went and any unique features that required tailoring of your classes.
14. How many classrooms did you teach in at each of these sites?
(a) Can you give me a written schedule of the dates and times for all the classes you taught? (b) Did your nutrition educator have any joint classes combining classrooms or teach each classroom
of children separately? How often (days per week/month) did you go out to the sites teach these groups? Were you able to track how long each class was?
(c) Were you able to track the number of children in each class?

15. Looking back, was as there anything unique about the schools where your nutrition educator taught the BASICS curriculum or the population of children at these sites that required you to tailor the curriculum in any way?
16. Did your nutrition educator miss any of the scheduled BASICS classes due to sickness, snow or some other reason?
17. Was she able to teach all of the lessons in all of the classrooms in her schools?
Perceived Facilitators and Challenges to Intervention Success
18. Now that your nutrition educator has taught the curriculum, used the materials, and performed other aspects of the BASICS program, what components of this curriculum do you think were most effective with students in the classroom?
19. What were some of the barriers to achieving the goals of the curriculum?
20. What do you think were some of the barriers for the classroom teachers to achieving the goals of the curriculum?
[If barriers were stated, how did you overcome them?]
General Impressions
21. How do you feel the students received the curriculum? Do you think they enjoyed it? Do you think they learned new information? Do you think they changed some of their nutrition behaviors?
22. Do you have any recommendations for the improvement of the BASICS curriculum?
That ends my formal interview questions. Do you have any comments or recommendations that you would like to add?
Thank you very much for your time and input on this important project. My colleagues and I at Altarum appreciate your taking the time to be interviewed for this project.

BASICS Nutrition and Physical Activity Program INN ● Program Evaluation
A.8. Discussion Guide for Building and Strengthening Iowa Community Support Nutrition and Physical Activity Program Direct Nutrition Educators [pre-implementation]

SNAP-Ed Wave II: Discussion Guide for Onsite Nutrition Educators [PRE-IMPLEMENTATION]
State:
Respondent/Title/Organization:
Address:
Phone:
Fax:
E-mail:
Interviewer:
Date of Interview:
Time of Interview:
Thank you for taking the time for this interview. The U.S. Department of Agriculture’s Food and Nutrition Service (FNS) has contracted with Altarum Institute to conduct a study of the Iowa Nutrition Network (INN) Building and Strengthening Iowa Community Support for Nutrition and Physical Activity (BASICS) program that is offering information to children and their families about healthy foods to eat and the importance of being active. Altarum is a health and nutrition policy research and consulting Institute and our work focuses on helping to improve the health and nutrition status of children, families, and adults. The purpose of the study is to evaluate several SNAP-Ed models around the country and to provide recommendations for how these interventions could be improved to better serve the children and families in your community. We also will be evaluating how the intervention might be replicated in other communities. We will be using first names only today. Everything that you say will be kept private. After we conduct several of these interviews, we will write a report for the FNS. Your name will not appear anywhere in the report. Nothing that is said today will be attached to your name at any point. Nothing that you say will affect your job or be shared with your employers. Today we will specifically discuss your background and other qualifications as an educator for this education program, the planning process that has already begun with the intervention sites, and your expectations for the reach and design of the program. Once you have completed teaching the eight BASICS lessons (and the classroom teacher has taught her four lessons), we will follow up with you for one more interview to find out how things may
Office of Management and Budget (OMB) No. 0584-0554 Expiration Date: 06/30/2014
The public reporting burden for this collection of information is estimated to average 30 minutes per response,
including the time for reviewing instructions, searching existing data sources, gathering and maintaining the
data needed, and completing and reviewing the collection of information. An agency may not conduct or
sponsor, and a person is not required to respond to, a collection of information unless it displays a currently
valid OMB control number. Send comments regarding this burden estimate or any other aspect of this
collection of information, including suggestions for reducing this burden, to the following address: U.S.
Department of Agriculture, Food and Nutrition Services, Office of Research and Analysis, Room 1014,
Alexandria, VA 22302, ATTN: PRA (0584-0554). Do not return the completed form to this address.

have changed from what you planned to do and to obtain your experiences and views on what worked well or not and why, and what you might change to improve the program. I expect that our discussion today will take about 30 minutes. Before I begin, do you have any questions?
Educator’s Job Title, Qualifications, and Capabilities
First I would like to ask you a few questions about your position and your background for this type of work.
1. What is your job title in this role as nutrition educator for the INN BASICS program?
2. Do you also provide nutrition education or community education for any other programs?
[IF YES] (a) Please tell me a little bit about your other related work. (b) How long have you been a nutrition educator?
3. What percent time are you working as a nutrition educator for the BASICS program? (are you full-time or part-time)
4. Prior to this role as a nutrition educator for the BASICS program, have you had any other job or volunteer experience in nutrition or health education for older adults/children and families?
[IF YES] (a) Please describe these job or volunteer experiences? (b) How many total years of experience in nutrition or health education for children and families did
you have before you came to be a nutritio0n educator in the BASICS program?
5. What is the highest level of education that you have completed to date? If you have a college or graduate school degree, in what subject was your major or degree?
6. Outside of any formal education, have you had any specialized training or certification either in nutrition education or health education? If so, please describe this training for me.
7. What else from your life experience do you think makes you a good educator for the BASICS program?
8. What are some of the challenges that you or others like you might face in being a good nutrition educator for the BASICS program?
Training Provided by the Demonstration Project
9. Did the Iowa Nutrition Network provide training for you to implement this curriculum? If so, please describe the training you received (e.g., who provided, number of hours, where the training was held, what materials were used).
10. Do you think that the training provided you with the skills and materials to effectively implement the curriculum? Please describe why you think this.
11. What recommendations, if any, do you have for how the training could be improved?
Recruitment and Implementation Plans
Next I would like to discuss the recruit of schools for the BASICS program and how many schools, classes and students you plan to be working with.
12. Do you know yet which sites you will be teaching the BASICS classes?
[IF NO, SKIP TO QUESTION 19] [IF YES]
(a) Please name schools. (b) When do you plan to start the lessons at the schools with which you will work?

13. Do you know how these schools were recruited?
(a) Who did the site recruiting, and how did they reach out to enroll the sites? (b) Do you think this was an effective way to select the sites? Why or why not?
14. Have you visited or otherwise been in contact with the schools yet to talk about your plans for the BASICS lessons?
15. Do you know how the classrooms were recruited?
16. Do you know the teachers in the recruited schools who will be teaching four of the BASICS lessons?
(a) What are their roles? (b) Do you have any sense of their buy-in and/or enthusiasm about the intervention and what
impact this might have on participation?
17. What physical resources will you need at the sites to implement the intervention (e.g., space, audiovisual equipment, and computers)?
Scheduling
In order to plan our site visits, we need to know specific information about the scheduling of your classes.
18. How many classrooms or groups of children will you be teaching at each of these sites?
(a) Will you have any joint classes combining classrooms or teach each classroom of children separately? How often (days per week/month) will you be going out to the schools to teach these students? How long will each class or activity be? What time of day will you be providing the education? Is that a good time for the target population?
(c) How many children/adults do you expect will be involved in each class? (d) Do you have a written schedule yet of the dates and times for all the classes? If so, could you provide
a copy of this schedule to us? (e) How can we best stay in touch with you to firm up your schedule for teaching at your sites (e.g.,
phone, e-mail)?
19. Are you planning on doing any training of the teachers or at the schools?
20. Is there anything unique about the sites where you will be teaching the BASICS program or the population of children at these sites that you think will require you to tailor the program to better meet the needs of children and their parents these schools? If so, how are you planning to tailor the program to address these needs?
Quality Control
21. How did you control for the quality of your nutrition educator in teaching the BASICS curriculum?
22. How did you control for fidelity when your nutrition educator was teaching the BASICS curriculum?
23. Did INN control for quality and fidelity?
Perceived Facilitators and Challenges to Intervention Success
24. Based on what you know about the curriculum, materials, and other aspects of the BASICS program, what components of this curriculum do you think will be most effective with the students you will be reaching?
25. Before we close, I would like to ask you whether you foresee any challenges in teaching this curriculum as planned. If so, might be those potential challenges and how might they be overcome?
That ends my formal interview questions. Do you have any comments or recommendations that you would like to add?
Thank you very much for your time and input on this important project. My colleagues and I at Altarum will get back in touch with you to schedule a follow-up interview after you finish teaching the BASICS program. I look forward to talking with you then.

BASICS Nutrition and Physical Activity Program INN ● Program Evaluation
A.9. Discussion Guide for Building and Strengthening Iowa Community Support Nutrition and Physical Activity Program direct nutrition educators [post-implementation]

SNAP-Ed Wave II: Discussion Guide for Onsite Nutrition Educators [POST-IMPLEMENTATION]
State:
Respondent/Title/Organization:
Address:
Phone:
Fax:
E-mail:
Interviewer:
Date of Interview:
Time of Interview:
Thank you for taking the time for this interview. The U.S. Department of Agriculture’s Food and Nutrition Service (FNS) has contracted with Altarum Institute to conduct a study of the Iowa Nutrition Network (INN) Building and Strengthening Iowa Community Support for Nutrition and Physical Activity (BASICS) program that is offering information to older adults/children and their families about healthy foods to eat and the importance of being active. Altarum is a health and nutrition policy research and consulting institute, and our work focuses on helping to improve the health and nutrition status of children, families, and adults. The purpose of the study is to evaluate several Supplemental Nutrition Assistance Program-Education models around the country and to provide recommendations for how these interventions could be improved to better serve the children and families in your community. We also will be evaluating how the intervention might be replicated in other communities. We will be using first names only today. Everything that you say will be kept private except as otherwise required by law. After we conduct several of these interviews, we will write a report for the FNS. Your name will not appear anywhere in the report. Nothing that is said today will be attached to your name at any point. Nothing that you say will affect your job or be shared with your employers. Today we will discuss how the BASICS program was implemented and what might have changed from the original plan. I expect that our discussion today will take about 30 minutes. Before I begin, do you have any questions?
Office of Management and Budget (OMB) No. 0584-0554 Expiration Date: 06/30/14
The public reporting burden for this collection of information is estimated to average 30 minutes per
response, including the time for reviewing instructions, searching existing data sources, gathering and
maintaining the data needed, and completing and reviewing the collection of information. An agency may not
conduct or sponsor, and a person is not required to respond to, a collection of information unless it displays
a currently valid OMB control number. Send comments regarding this burden estimate or any other aspect of
this collection of information, including suggestions for reducing this burden, to the following address: U.S.
Department of Agriculture, Food and Nutrition Services, Office of Research and Analysis, Room 1014,
Alexandria, VA 22302, ATTN: PRA (0584-0554). Do not return the completed form to this address.

Training Provided by the Demonstration Project
We are interested in how the BASICS training prepared you and the classroom teacher to teach the curriculum in the classroom. This first set of questions focuses on this topic area.
1. Now that you have taught the BASICS curriculum, do you feel the training provided by the INN provided you with the skills to effectively implement this curriculum? If so, please describe how the training helped you with implementing the BASICS curriculum. [If not, why not?] What recommendations, if any, do you have for how the training could be improved for yourself and for the classroom teachers?
2. In teaching the BASICS curriculum, were you able to follow the curriculum as it was designed, or did you supplement the materials given to you at the training?
3. Did the classroom teachers follow the curriculum as designed, or did they supplement the materials given to them at training?
4. Were there take-home materials for the students to complete with their parents? If so, do you know if they were completed?
5. What are your feelings about the ease of teaching the BASICS curriculum? E.g., was it easy to teach with clear instructions and had a focused approach?
Recruitment and Implementation
Next I would like to discuss what is being planned to recruit sites and participants for the intervention and how many sites, classes and students you plan to be working with.
6. Who did the site recruiting, and how did they reach out to enroll the schools?
7. Do you think this was an effective way to select the sites? Why or why not?
8. Were these schools that you had ever taught in before?
9. Looking back at the implementation of the BASICS curriculum, how effective do you feel the model of nutrition educator teaching 8 lessons, and the classroom teacher teaching 4 lessons was? Were there any challenges in this curriculum model?
10. Were the classroom teachers engaged and enthusiastic about teaching the BASICS curriculum?
11. If a teacher was not engaged and enthusiastic, what impact do you think it had on the intervention?
12. What physical resources did you end up needing at the sites to implement the intervention (e.g., space, audiovisual equipment, computers)? Was this as planned?
13. Were there any other nutrition education activities going on at the school while you were implementing the BASICS curriculum? If so, what were they?
Scheduling and Unique Features
We’d like to know more about how your schedule of classes went and any unique features that required tailoring of your classes.
14. How many classrooms did you teach in at each of these sites?
(a) Did you have any joint classes combining classrooms or teach each classroom of children separately? How often (days per week/month) did you go out to the sites teach these groups? Were you able to track how long each class was?
(b) Were you able to track the number of children in each class? (c) Can you give me a written schedule of the dates and times for all the classes you taught?
15. Was there anything unique about the sites where you taught the BASICS curriculum or the population of children at these sites that required you to tailor the curriculum in any way?
16. Did you miss any of the scheduled BASICS classes due to sickness, snow or some other reason?

Perceived Facilitators and Challenges to Intervention Success
17. Now that you have taught the curriculum, used the materials, and other aspects of the BASICS program, what components of this curriculum do you think were most effective with students in the classroom?
18. What were some of the barriers to achieving the goals of the curriculum?
19. What do you think were some of the barriers for the classroom teachers to achieving the goals of the curriculum?
20. If you [and they] were able to overcome these barriers, how did you overcome them?
General Impressions
21. How do you feel the students received the curriculum? Do you think they enjoyed it? Do you think they learned new information? Do you think they changed some of their nutrition behaviors?
22. Do you have any recommendations for the improvement of the BASICS curriculum?
That ends my formal interview questions. Do you have any comments or recommendations that you would like to add?
Thank you very much for your time and input on this important project. My colleagues and I at Altarum appreciate your taking the time to be interviewed for this project.

BASICS Nutrition and Physical Activity Program INN ● Program Evaluation
A.10. Discussion Guide for Retail Store Managers or Registered Dieticians [post-implementation]

SNAP-Ed Wave II Discussion Guide for INN Retail Stores: Produce Managers (Dairy Managers if Appropriate) [POST-IMPLEMENTATION]
State:
Respondent/Title/Organization:
Address:
Phone:
Fax:
E-mail:
Interviewer:
Date of Interview:
Time of Interview:
Thank you for taking the time to participate in this interview. The U.S. Department of Agriculture’s Food and Nutrition Service has contracted with Altarum Institute to conduct a study of the Iowa Nutrition Network (INN) Building and Strengthening Iowa Community Support for Nutrition and Physical Activity (BASICS) program that is offering information to children and their families about healthy foods to eat and the importance of being active. The BASICS program includes two social marketing initiatives conducted in grocery stores called, Pick a better snack and 1% or Less, Yes! Altarum is a health and nutrition policy research and consulting institute and our work focuses on helping to improve the health and nutrition status of children, families, and adults. This study will provide information on how the BASICS program works from the perspective of the people who planned the program, the program teachers, you and school district food service directors and some of the parents whose children participated. We also will use what you tell us today to provide recommendations for how BASICS can be improved to better work with stores like yours and the children and families you serve. Any answers you provide for this study will be kept private and your name will not be identified with any answers you provide. The estimated amount of time required to complete this interview is 15 minutes. I want to thank you for taking the time today to speak with me. Note to interviewer: Before interviewing the produce manager, contact the store manager to obtain permission and set up an interview time when the store staff is not busy. It is recommended that the Store Manager
Office of Management and Budget (OMB) No. 0584-0554 Expiration Date: 06/30/14
The public reporting burden for this collection of information is estimated to average 30 minutes per response,
including the time for reviewing instructions, searching existing data sources, gathering and maintaining the
data needed, and completing and reviewing the collection of information. An agency may not conduct or
sponsor, and a person is not required to respond to, a collection of information unless it displays a currently
valid OMB control number. Send comments regarding this burden estimate or any other aspect of this
collection of information, including suggestions for reducing this burden, to the following address: U.S.
Department of Agriculture, Food and Nutrition Services, Office of Research and Analysis, Room 1014,
Alexandria, VA 22302, ATTN: PRA (058-0554). Do not return the completed form to this address.

participate in the interview in addition to the Produce Manager (if the 1% or Less, Yes! campaign has been conducted in the store, include the dairy manager as well). Before I begin, do you have any questions? Let’s begin with some general information about your store and customers:
1. How long have you been the produce manager (dairy manager) of this store?
PROBE: Were you the produce manager (dairy manager) during the time of the Pick a better snack campaign taking place November through May of this year? [If the 1% or Less, Yes! campaign was held at the store, ask the same question.]
2. How would you describe your store in terms of size? Small, medium or large?
3. Would you be able to roughly break down your customers’ race and ethnicity in percentages? (Designate a percentage for each racial/ethnic category below.)
(a) American Indian or Alaska Native (b) Asian (c) Black or African American (d) Hispanic or Latino (e) Native Hawaiian or other Pacific Islander (f) White
4. Approximately what percentage of your customers uses Food Assistance EBT (Iowa EBT) at your store?
Next, I’d like to ask you some questions about the Pick a better snack [1% or Less, Yes!] campaign:
5. Does your store participate in the Pick a better snack [1% or Less, Yes!] campaign?
PROBES: (a) How did you find out about the Pick a better snack [1% or Less, Yes!] campaign? (b) Why is your store involved in the Pick a better snack [1% or Less, Yes!] campaign? (c) Have you seen any of the Pick a better snack [1% or Less, Yes!] campaign materials used in the
social marketing campaign? PROBES:
(a) Bingo cards (b) Recipes (c) Posters (d) ShelfTalker
6. If you have seen the above materials, what did you think about them? (Probes: Effective? Ineffective?)
(a) Has your store held fruit and vegetable [milk] snack demonstrations as part of the Pick a better snack [1% or Less, Yes!] campaign?
(b) How many demonstrations has your store held [per month and which months]? (c) Approximately how many people “attend” each demonstration?
7. What would you say are the most useful aspects of the Pick a better snack [1% or Less, Yes!] campaign and demonstrations overall for the age groups of children and parents it is targeting?
8. Did your store conduct demonstrations for the Pick a better snack campaign? If so, do you think the demonstrations effectively complement the social marketing campaign materials?
9. Did you provide additional support to the demonstrations at your store by providing food for the demonstrations?

10. What challenges or issues were faced in implementing the Pick a better snack [1% or Less, Yes!] campaign and demonstrations in your store?
How did you address these?
11. Did you need to communicate with the INN/Iowa Department of Health staff to address any of these issues? If so, what did you need to communicate to them about and how were those issues addressed?
12. What could be done to make the Pick a better snack [1% or Less, Yes!] campaign more appealing to retail stores like yours?
13. Have you made any changes to your inventory or made any other changes to your store since starting with the Pick a better snack [1% or Less, Yes!] campaign? If so, what types of changes have you made? [Probe: the campaign started November 2011]
And finally, I have a few follow-up questions about the Pick a better snack [1% or Less, Yes!] campaign:
14. Have you increased or decreased the amount of fruits and vegetables [1% or less milk products] you carry?
15. Have you seen a change (avoid leading question) in sales of sampled products on the days when the Pick a better snack [1% or Less, Yes!] demonstrations took place?
16. How much of a role do you think that you should play in increasing the availability of healthy foods in your community? Why?
17. Do you have any suggestions for ways the Pick a better snack [1% or Less, Yes!] campaign could be improved?
18. Would you be interested in continuing the Pick a better snack [1% or Less, Yes!] campaign in your retail store (without the presence of INN)? Note: the materials are free of cost to consumers online.
19. How feasible would it be to incorporate the activities in your retail store on an ongoing basis?
20. Would you want additional help from the INN/Iowa Department of Health if it were available?
21. Finally, would you want the Pick a better snack [1% or Less, Yes!] campaign in your retail store next year? Why or why not?
That ends my formal interview questions. Do you have any comments or recommendations that you would like to add?
Thank you very much for your time and input on this very important project. We have a gift card to thank you for your time
BASICS Nutrition and Physical Activity Program INN ● Program Evaluation
A.11. Discussion Guide for Demonstrators at Retail Outlets (Dietetic Students) [post-implementation]

Discussion Guide for Demonstrators at Retail Outlets [POST-IMPLEMENTATION]
Date of Discussion:
Location:
Study ID #:
Facilitator:
Note Taker:
Number of Participants:
Start Time:
End Time:
Hello, my name is _____, and I work for Altarum Institute. Thank you for taking the time for this group discussion. The U.S. Department of Agriculture’s Food and Nutrition Service (FNS) has contracted with Altarum Institute to conduct a study of the Iowa Nutrition Network (INN) Building and Strengthening Iowa Community Support for Nutrition and Physical Activity (BASICS) program that is offering information to children and their families about healthy foods to eat and the importance of being active. Altarum is a health and nutrition policy research consulting institute, and our work focuses on helping improve the health and nutrition status of children, families, and adults. This study will provide information on how the program in which your children participated works from the perspective of the people who planned the program, the teachers, you, and your child. The purpose of today’s group is to hear from you about your own and your child’s experiences and satisfaction with this program that recently took place at your child’s day care/school. We also will use what you tell us today provide recommendations for how BASICS program can be improved to better serve the children and families in your community and those in other communities like yours. We will be using first names only today. Everything that you say will be kept private. After we conduct several of these group discussions, we will write a report for the FNS. Your name will not appear anywhere in the report. Nothing that is said today will be attached to your name at any point. Nothing that you say will affect the services you receive through any of the programs we talk about today.
Office of Management and Budget (OMB) No. 0584-0554 Expiration Date: 06/30/2014
The public reporting burden for this collection of information is estimated to average 2 hours per response,
including the time for reviewing instructions, searching existing data sources, gathering and maintaining the
data needed, and completing and reviewing the collection of information. An agency may not conduct or
sponsor, and a person is not required to respond to, a collection of information unless it displays a currently
valid OMB control number. Send comments regarding this burden estimate or any other aspect of this
collection of information, including suggestions for reducing this burden, to the following address: U.S.
Department of Agriculture, Food and Nutrition Services, Office of Research and Analysis, Room 1014,
Alexandria, VA 22302, ATTN: PRA (0584-0554). Do not return the completed form to this address.

Before we begin, I would like to review a few details about our discussion:
First, your participation in today’s discussion is voluntary. You are free to leave at any time.
There are no right or wrong answers. Remember that we do not work for the schools or with the educators, so please feel free to say whatever you think.
Also, it is okay to have ideas or opinions that are different from each other. We want to hear everyone’s point of view.
We are tape-recording this session so that we do not miss anything important. It will be helpful to have only one person talking at a time. If two people talk at once, we cannot understand what anyone is saying. We may remind you of this during the group discussion.
Finally, we just want to emphasize what we said earlier: Everything that you say is private. What you say today will not be attached to your name at any point.
For this session, I will read a question and then listen to your responses. I also may ask follow-up questions to get some more detail. Let’s get started! I’m looking forward to hearing more about your experiences with the BASICS marketing campaign. Do you have any questions before we start?
Description of Role: Retail Outlet Demonstrators
We would like to know more about your role as a retail outlet demonstrator.
1. First, could you describe your background and experience related to conducting nutrition demonstrations?
2. Please describe your role as an in-store demonstrator for the INN. [What does this role entail?]
Training of Retail Outlet Demonstrators
We would like to learn more about the training you received to be a retail outlet demonstrator.
3. Could you describe the training you received from the INN?
4. Do you feel the training prepared you for your job as an in-store demonstrator?
(a) If not, why not?
Demonstrations for Shoppers
We are interested in knowing more about the actual demonstrations you conducted at retail outlets.
5. How many demonstrations (in what stores) did you conduct?
6. How long did you spend at the store each time you conducted demonstrations?
7. What date did you start the in-store demonstrations, and what date did you stop the demonstrations?
8. Approximately how many shoppers (on average) did you talk with each time you conducted an in-store demonstration?
Perception of Shoppers Related to the Demonstrations
We are interested in knowing more about the perceptions of shoppers who engaged in the demonstrations at retail outlets.
9. Could you determine the interest of store shoppers in your nutrition messaging?
10. Did shoppers routinely stop, talk with you and taste one of the food items at your display?

11. Did shoppers display an interest in making changes in their eating habits based on the information that you provided at your demonstration booth?
Feedback from Shoppers Related to the Demonstrations
We would like to know more about feedback you received from shoppers at your in-store demonstrations.
12. What feedback did shoppers give you about the nutrition messages you were providing at your booth?
13. Did any shoppers describe challenges they might have to incorporating fruits, vegetables (and/or) low-fat milk into their diets?
(a) If there were challenges, what challenges did they cite?
Effectiveness of Demonstrations in Retail Outlets
We are interested in knowing more about how effective you think the in-store demonstrations were.
14. Do you think the in-store demonstrations were effective in promoting behavior change?
15. If yes, how do you think the demonstrations achieve this? [What was the main factor that might have promoted behavior change?]
16. If not, why do you think the demonstrations were not effective?
Other Comments or Final Thoughts
We would like to know what final thoughts you have about the in-store demonstrations.
Thank you for taking the time to be interviewed. We appreciate your feedback for this component of the project.

BASICS Nutrition and Physical Activity Program INN ● Program Evaluation
A.12. Discussion Guide for Building and Strengthening Iowa Community Support Nutrition and Physical Activity Program Classroom Teachers [post-implementation]

Questionnaire for BASICS Nutrition and Physical Activity Program Classroom Teachers [POST-IMPLEMENTATION]
State:
Interviewer:
Respondent:
Date of Interview:
Title:
School Name:
Address:
Phone:
Fax:
E-mail:
Thank you for taking the time for this interview. The U.S. Department of Agriculture’s Food and Nutrition Service (FNS) has contracted with Altarum Institute to conduct a study of the Iowa Nutrition Network (INN) Building and Strengthening Iowa Community Support for Nutrition and Physical Activity (BASICS) program that is offering information to children and their families about healthy foods to eat and the importance of being active. Altarum Institute is a health and nutrition policy research and consulting institute, and our work focuses on helping to improve the health and nutrition status of children, families, and adults. This study will include not only outcome evaluation information but also process information on how it is being implemented and how you are evaluating the intervention. All of this will be useful to both FNS and to other Supplemental Nutrition Assistance Program-Education (SNAP-Ed)-implementing agencies that are planning to evaluate their own SNAP-Ed interventions. We will be using first names only today. Everything that you say will be kept private. After we conduct several of these interviews, we will write a report for the FNS. Your name will not appear anywhere in the report. Nothing that is said today will be attached to your name at any point. Nothing that you say will affect your job or be shared with your employers. The purpose of my interview today is primarily to ask you about your experiences and perceptions of the BASICS program at your school. I will use what you tell us today to provide recommendations for how the BASICS program could be improved to better serve the children and families in your community and those in other communities like yours.
Office of Management and Budget (OMB) No. 0584-0554 Expiration Date: 06/30/2014
The public reporting burden for this collection of information is estimated to average 30 minutes per response,
including the time for reviewing instructions, searching existing data sources, gathering and maintaining the
data needed, and completing and reviewing the collection of information. An agency may not conduct or
sponsor, and a person is not required to respond to, a collection of information unless it displays a currently
valid OMB control number. Send comments regarding this burden estimate or any other aspect of this
collection of information, including suggestions for reducing this burden, to the following address: U.S.
Department of Agriculture, Food and Nutrition Services, Office of Research and Analysis, Room 1014,
Alexandria, VA 22302, ATTN: PRA (0584-0554).
If you have any questions, please feel free to contact Valerie Long at: 207-319-6997.

I expect that our discussion today will take about 30 minutes. Before I begin, do you have any questions?
Perceptions and Preferences about Fruits, Vegetables and Low-Fat Milk
First I’d like to ask you some general questions about fruits, vegetables and low-fat milk products.
1. On a scale of 0–5, where 0 is Not Important and 5 is Extremely Important, how important do you think eating more fruits, vegetables and consuming more low-fat milk products are for you?
2. On a scale of 0–5, where 0 is Not Important and 5 is Extremely Important, how important do you think eating more fruits, vegetables is for your students and their families?
3. On a scale of 0–5, where 0 is Not Important and 5 is Extremely Important, how important do you think consuming more milk products is for your students and their families?
4. As a result of teaching this program, are there any new fruits, vegetables, and/or low-fat milk products that you now consume?
BASICS for Nutrition and Physical Activity Curriculum and Training
This next set of questions focuses on the BASICS curriculum and your training to teach the curriculum. I’d like to hear your feedback about both the curriculum and training.
5. Do you feel that the training you received for BASICS provided you with enough knowledge and skills to effectively teach your lessons?
6. If you didn’t feel that the training was adequate, how would you have improved it?
7. Now that you have taught this curriculum, would you make any changes to the materials?
8. How many of the BASICS lessons taught by the nutritionist were you able to observe in the classroom?
9. Outside of the four lessons you taught, did you incorporate any nutrition messages, sample activities, or tools from BASICS in the classroom?
10. How did you incorporate these messages and materials into your classroom activities?
11. How often would you estimate you used the new information you received from the BASICS in your classroom?
□ A couple of times □ Once every week □ A few times a week □ More than a few times a week
(a) What aspects of the BASICS content or design of the messages, sample activities or tools made it easier for you to incorporate these into your classroom activities (e.g., ease of use in the classroom setting, cultural sensitivity, age appropriateness of the materials for the target audience)?
(b) What aspects prevented you from using these tools in your classroom (e.g., lack of time, lack of money for supplies, lack of confidence)?
12. What do you think are the strengths of the curriculum now that you have seen it taught, and taught four lessons yourself? [open-ended]
13. What do you think are the weaknesses of the curriculum now that you have seen it taught, and taught four lessons yourself? [open-ended]

Exposure and Feedback on Parent/Family Messages and Events
The parent/family messages and events were an integral part of this intervention. I’d like to hear your feedback on these supplemental components of the program.
14. How effective do you think these materials were in the promotion of fruits, vegetables and low-fat milk with parents?
15. How many of the BASICS parent/family activities that were held at your school were you able to attend?
16. How effective do you think these events were in the promotion of fruits, vegetables and low-fat milk with parents?
17. If not effective, what changes or improvements would you suggest to make them more effective?
18. Were you aware of the social marketing campaign that was a supplemental component of the BASICS curriculum?
19. If you saw or heard any of the social marketing campaign ads or store demonstrations, what did you see, and do you think that it was an effective complement to the curriculum?
Working with Outside Nutrition Educator
Next, we’d like to have your feedback about working with the outside nutrition educator and the shared responsibility of this intervention.
20. How effective do you think the outside nutrition educator was in teaching eight lessons of the curriculum?
21. Having co-taught the curriculum together, how do you feel about sharing the responsibility of teaching the curriculum with an outside nutrition educator?
Overall Opinion
Finally, we would like your general opinion about this intervention.
22. Overall, what is your feeling about BASICS curriculum, as you finish this intervention?
23. What changes or improvements would you suggest to better reach parents with the BASICS program messages?
24. Do you have any recommendations or suggestions for ways the BASICS curriculum can be improved overall?
25. That ends my formal interview questions. Do you have any comments or recommendations that you would like to add?
Thank you very much for your time and input on this very important project. We will be sending you a $10 check for completing this survey. Please place your mailing address below, and return this survey to the following: Valerie Long Deputy Director-Center for Food Assistance and Nutrition Altarum Institute [email protected]

BASICS Nutrition and Physical Activity Program INN ● Program Evaluation
A.13. Discussion Guide for Building and Strengthening Iowa Community Support Nutrition and Physical Activity Program school principals [post-implementation]

Discussion Guide for BASICs School Principals [POST-IMPLEMENTATION]
State:
Respondent /Title/Organization:
Address:
Phone:
Fax:
E-mail:
Interviewer:
Date of Interview:
Time of Interview:
Thank you for taking the time to participate in this interview. The U.S. Department of Agriculture’s Food and Nutrition Service has contracted with Altarum Institute to conduct a study of Iowa Nutrition Network (INN) Building and Strengthening Iowa Community Support for Nutrition and Physical Activity (BASICS) program that is offering information to children and their families about healthy foods to eat and the importance of being active. Altarum is a health and nutrition policy research and consulting Institute, and our work focuses on helping to improve the health and nutrition status of children, families, and adults. This study will provide information on how the INN BASICS program works from the perspective of the people who planned the program, the program teachers, you and your staff and some of the parents whose children participated. We also will use what you tell us today to provide recommendations for how INN BASICS program can be improved to better work with organizations like yours and the children and families you serve. Any answers that you provide for this study will be kept private, and your name will not be identified with any answers that you provide. The estimated amount of time required to complete this interview is 30 minutes. I want to thank you for taking the time today to speak with me. Before I begin, do you have any questions?
Office of Management and Budget (OMB) No. 0584-0554 Expiration Date: 06/30/2014
The public reporting burden for this collection of information is estimated to average 30 minutes per response,
including the time for reviewing instructions, searching existing data sources, gathering and maintaining the
data needed, and completing and reviewing the collection of information. An agency may not conduct or
sponsor, and a person is not required to respond to, a collection of information unless it displays a currently
valid OMB control number. Send comments regarding this burden estimate or any other aspect of this
collection of information, including suggestions for reducing this burden, to the following address: U.S.
Department of Agriculture, Food and Nutrition Services, Office of Research and Analysis, Room 1014,
Alexandria, VA 22302, ATTN: PRA (0584-0554). Do not return the completed form to this address.

1. Tell me about your involvement in overseeing the implementation of INN BASICS program.
REQUIRED PROBES: (a) Have you observed any of the classes for the children? (b) Have you been able to read any of the BASICS program materials that were sent home with
children to their parents?
2. Now that the intervention is over, tell me your views about the nutrition educator who taught eight of the BASICS lessons? Do you feel they were effective? Was the BASICS program fun and interesting to the students?
(a) What are your views about the classroom teacher who taught four of the lessons? Do you think this was a good collaboration—having an outside educator and classroom teacher teaming up to teach this 12-lesson curriculum?
3. What would you say are the most useful aspects of the INN BASICS program overall for the targeted age groups?
4. How did you promote the program and recruit teachers to participate in the INN BASICS program at your school?
(a) Can you describe what you did to recruit teachers? (b) What could be changed or improved to promote interest and participation in the program?
5. Were other teachers in the school interested in participating in the INN BASICS program once they saw the program in action?
6. In general how effective do you feel the nutrition educator/classroom teacher model [nutrition educator teaching eight lessons and classroom teacher teaching four lessons] was?
(a) Did your classroom teachers feel they had time to teach their lessons? (b) Was the nutrition educator/classroom teacher team a collaborative one? (c) Does this method provide for “buy-in” by the classroom teacher? (d) Do the lessons fit into the curriculum standards of your school?
7. How effective do you think the various strategies that were used by the INN BASICS program to encourage parent involvement (e.g., take-home materials, activities targeted to parents and caregivers)? If you are not familiar with the strategies used, please feel free to skip this question.
(a) What worked well? Why? (b) What could be changed or improved to increase parent or other caregiver engagement in the
program’s nutrition education components?
8. What challenges or issues did you face in implementing this program at your school/site? How did you address these? Did you need to communicate with the INN BASICS/IDPH program staff to address any of these issues? If so what did you need to communicate to them about and how were those issues addressed?
9. What could be done to make the INN BASICS program more appealing to schools like yours?
10. Do you have any other suggestions for ways that this educational program could be improved?
11. The INN BASICS program aside, do you have any suggestions for other ways that schools like yours can encourage children to eat more fruits and vegetables at home and encourage their parents to serve more fruits and vegetables at home?
12. Do you think the classroom teachers involved with the INN BASICS program would
(a) Be interested and able to continue some of the lessons and activities with the students in the classroom?
(b) Need assistance? (c) Need outside resources?

13. From a program administrator perspective- how did it work for the classroom teachers to lead four lessons of the BASICS programs themselves? Did the teachers have to be “covered” for other duties they are responsible for in the school to be able to be trained and teach the BASICS lessons?
14. My final and very straightforward question for you today is, would you want the INN BASICS program to come to your school next year? Why or why not?
That ends my formal interview questions. Do you have any comments or recommendations that you would like to add?
Thank you very much for your time and input on this very important project. We have a gift card to thank you for your time.

BASICS Nutrition and Physical Activity Program INN ● Program Evaluation
A.14. Focus Group Guide for parents of students participating in the Building and Strengthening Iowa Community Support Nutrition and Physical Activity Program [post implementation]

Group Discussion Guide for Parents/Caregivers [POST-IMPLEMENTATION]
Date of Discussion:
Location:
Study ID #:
Facilitator:
Note Taker:
Number of Participants:
Start Time:
End Time:
Welcome! My name is _____. I am here with my co-worker ____from Altarum Institute. Thank you for taking the time for this group discussion. The U.S. Department of Agriculture’s Food and Nutrition Service (FNS) has contracted with Altarum Institute to conduct a study of the Building and Strengthening Iowa Community Support for Nutrition and Physical Activity (BASICS) program that is offering information to children and their families about healthy foods to eat and the importance of being active. Altarum is a health and nutrition policy research consulting institute, and our work focuses on helping improve the health and nutrition status of children, families, and adults. This study will provide information on how the program in which your children participated works from the perspective of the people who planned the program, the teachers, you, and your child. The purpose of today’s group is to hear from you about your own and your child’s experiences and satisfaction with this program that recently took place at your child’s day care/school. We also will use what you tell us today provide recommendations for how BASICS program can be improved to better serve the children and families in your community and those in other communities like yours. We will be using first names only today. Everything that you say will be kept private. After we conduct several of these group discussions, we will write a report for the FNS. Your name will not appear anywhere in the report. Nothing that is said today will be attached to your name at any point. Nothing that you say will affect the services that you receive through any of the programs that we talk about today.
Office of Management and Budget (OMB) No. 0584-0554 Expiration Date: 06/30/2014
The public reporting burden for this collection of information is estimated to average 2 hours per response,
including the time for reviewing instructions, searching existing data sources, gathering and maintaining the
data needed, and completing and reviewing the collection of information. An agency may not conduct or
sponsor, and a person is not required to respond to, a collection of information unless it displays a currently
valid OMB control number. Send comments regarding this burden estimate or any other aspect of this
collection of information, including suggestions for reducing this burden, to the following address: U.S.
Department of Agriculture, Food and Nutrition Services, Office of Research and Analysis, Room 1014,
Alexandria, VA 22302, ATTN: PRA (0584-0554). Do not return the completed form to this address.

Before we begin, I would like to review a few details about our discussion:
First, your participation in today’s discussion is voluntary. You are free to leave at any time.
There are no right or wrong answers. Remember that we do not work for the schools or with the educators, so please feel free to say whatever you think.
Also, it is okay to have ideas or opinions that are different from each other. We want to hear everyone’s point of view.
We are tape-recording this session so that we do not miss anything important. It will be helpful to have only one person talking at a time. If two people talk at once, we cannot understand what anyone is saying. We may remind you of this during the group discussion.
We would like everyone to participate. But you each don’t have to answer every question. You don’t have to raise your hand either. If, however, some of you are shy or we really want to know what you think about a particular question, we may ask you what you think.
We have a lot to talk about today, so don’t be surprised if at some point we interrupt the discussion and move to another topic. But do not let us cut you off. If there is something important you want to say, let us know and you can add your thoughts before we change subjects.
Finally, we just want to emphasize what we said earlier: We will be using first names only. Everything that you say is private. What you say today will not be attached to your name at any point. Nothing that you say will affect the child care that you receive at this site or any other services that you receive from this or any other program.
The group will last no more than 2 hours and will end no later than 7:30 p.m. We will not be taking a formal break, but if you need to leave for a restroom break, the bathrooms are [give directions to bathroom]. And feel free to get snacks. For this session, I will read a question and then listen to your responses. I also may ask follow-up questions to get some more detail. Let’s get started! I’m looking forward to hearing more about BASICS program. Do you have any questions before we begin?
Introductions/Icebreaker
Let’s go around the room for this one: Please introduce yourself, tell us how long your child has been going to his or her school, and name one fun activity you like doing with your child. [MODERATOR NOTE: It is helpful to go in order of seating to allow the transcriptionist to label responses by person. Also, for note taking, you can then label Person1, Person 2, Person 3, etc. when writing comments.]
Exposure and Accessibility of SNAP-Ed Intervention for Parents/Caregivers
Please raise your hand if you know that your child has been participating in a program at this school where they learn about healthy foods and being active. [Ask the following questions to those who raise their hands.]
1. What did your children tell you about what they did in these classes or sessions?
PROBES: Food they tried? Activities they did? Games they played? Lessons they learned?
2. Did you see any take home materials on food and physical activity recently provided for you by the BASICS program? [The moderator should prompt a response by showing some sample take-home materials used in the intervention.]
3. What did you think about these take-home materials? Were they helpful to you and your child to assist in learning more about nutrition and physical activity?
PROBES: What did you like about the materials? What were the least helpful aspects of these take-home materials? What didn’t you like about the materials?

4. Did you hear about the Family Night Out event offered at your child’s school? If yes, how did you hear about them?
5. Raise your hand if you went to the Family Night Out event at your child’s school.
(a) If you raised your hand, what made you decide to go? (b) If you didn’t raise your hand, what were the reasons that you didn’t go (e.g., barriers related to
timing and location, other barriers related to accessibility, level or interest or perceived need)?
6. Please think for a moment about what could be done to encourage more parents like you to participate in these Family Night Out events. [Ask participants to give you their thoughts.]
7. If you went to the Family Night Out event did you go to the nutrition and physical activity stations?
(a) What did you learn from the nutrition and physical activity stations at the Family Night Out event?
(b) Do you think it was a good way to learn?
8. If you went to the Family Night Out event did you receive any handouts?
(a) Which handouts were most helpful and why? (b) Which handouts were not helpful and why?
Satisfaction/Likes and Dislikes With Intervention
9. Tell me about the parts of the BASICS program overall—including the classes for your children, the take home materials, and Family Night Out event you may have participated in—that you liked the best and why you liked these parts.
10. What parts of the BASSICS program did you like least and why?
11. What parts of the BASICS program do you think your child liked the best and why?
12. What parts of the BASICS program did your child like the least and why?
Perceptions of Goals and Relevancy of Intervention
We are interested in hearing more about what you thought about the purpose of the classes and whether they helped you and provided useful information to you.
13. What do you think the BASICS program was trying to teach you and your child?
14. How useful was the information the program offered for parents like you with children?
15. How well did the BASICS program suggestions and information fit with the ways that people of your racial or ethnic background live your life?
16. How well did the program suggestions and information fit with the challenges faced by people who do not have a lot of money?
Intervention Impacts
These next few questions are about how you think the BASICS classes and materials may have helped you learn new information or other ways it may have changed things for you or your children.
17. What are the most important things that your child learned from the BASICS program?
18. What are the most important things that you learned from this program?
19. Now I would like to ask you a question that you probably need to think about: What is the most significant change or changes that have taken place in your household because of this program?
Awareness of Social Marketing Campaign

We are interested in knowing more about whether you picked up any additional information about nutrition for you and your family outside of school [and the Family Night Out event].
20. Do you remember seeing any information about fruits, vegetables, or low-fat milk in your community [grocery stores, billboards, buses, etc.]?
(a) PROBE: What do you recall seeing? Where did you see it? If you saw something about fruits, vegetables, or low-fat milk, what did you think of it?
(b) Did you do anything as a result of seeing this information?
Factors Affecting Fruit and Vegetable Availability at Home and Ways of Addressing these Barriers
Now I would like to take a few moments to ask you about the difficulties that parents who live in your neighborhood might face in trying to buy, store, and prepare fruits and vegetables for your preschool child.
21. What makes it harder for you or other parents like you to buy and keep fruits and vegetables at home (e.g., cost, access, storage)?
22. What makes it harder for you or other parents of young children like you to prepare and serve fruits and vegetables to your young children?
23. Did the information or take home materials provided to you by the BASICS help you to address any of these difficulties or barriers?
(a) For those who said yes, how was the information or materials helpful? (b) For those who said no, what could have been done to make the information or take-home
materials more helpful for parents?
Recommendations
24. Would you recommend this program to friends? Why or why not?
25. If you could change anything about the classes or take-home materials or other aspects of the BASICS program, what would it be?
26. Is there anything we haven’t asked that you would like to tell us about your experience with and opinions of the BASICS program?
27. Before we close, I would like you to help us by giving us your ideas for other ways that schools could encourage children to eat more fruits and vegetables and encourage their parents to serve fruits and vegetables more often.
Thank you very much for participating in this discussion group today. We have learned a lot from your experiences and recommendations.
In appreciation of your time and trouble today, we have gift cards for each of you today. Before you leave, make sure to take one of gift cards and sign the form indicating you have received one of the cards. Enjoy your day.

BASICS Nutrition and Physical Activity Program INN ● Program Evaluation
A.15. Building and Strengthening Iowa Community Support Nutrition and Physical Activity Program Lesson Observation Form

SNAP-Ed Wave II Nutrition Education INN BASICS Observation Form
The purpose of this observation tool is to describe the intervention as it is being implemented and inform the process evaluation of this project. This observation is not intended to evaluate the teaching abilities of the instructor. Name of observer: Date of class observed: Name of intervention: Name of instructor: Name and type of site:
A. PART A: BACKGROUND INFORMATION ABOUT THE NUTRITION INTERVENTION (to be filled out prior to class) Name of lesson to be taught: Lesson topic(s): Intended lesson objective(s): Target audience(s):
Children Yes No Grade/age range of children in class: Parents/guardians Yes No Older adults Yes No
B. PART B: CLASS OBSERVATION
1. Length of Class Class start time: Class end time:
2. Reach
Number of participants: How many of the participants were exposed to the complete class:
3. Description of the Setting
Physical location In a traditional classroom Indoors, in a general purpose room in the building (describe briefly) Indoors, in an informal area of the building not structured for group classes (describe briefly;
e.g., in the hallway, in the front waiting area): In an outdoor area
Adequacy of space Space is very ample for the number of participants and activities planned Space is sufficient, but somewhat limited for the number of participants and activities planned Space is insufficient for the number of participants and activities planned
Any other facilitators or barriers related to classroom setting:

Facilitators to teaching the lesson, carrying out planned activities, and engaging participants: Barriers to teaching the lesson, carrying out planned activities, and engaging participants:
Other observations about adequacy of space or class environment/setting:
4. Teaching Methods
Teaching techniques used: Check the teaching techniques used in teaching the lesson. Lecture/verbal presentation Educator engages the children in discussions Story reading Food preparation demonstration Food tasting Movement activity Student performance (e.g., dance) Small group discussions or activities (likely relevant only with large classes of parents) Other:
Types of teaching aids used: Check the types of teaching aids used in the lesson. Food models Storybooks Posters Music DVDs or videos Handouts Foods for demonstration purposes and tasting Other:
Materials distributed: Check the materials that were distributed during the lesson. Recipes Nutrition education newsletters Handouts: Weekly logs Other:
5. Participant Engagement in the Lesson
Describe the level of engagement of participants in the lesson as presented. For example, did it appear that the participants were engaged in the lesson? Was the lesson age appropriate? Was the literacy level appropriate? Was it culturally appropriate? Did it appear that this was new information for the participants?
C. PART C. LESSON TAUGHT AS PLANNED IN THE PROJECT Overall, did the instructor follow the curriculum for this lesson as developed? If not, how was it different and what are the apparent reasons for this deviation?
Observer comments/notes:
D. PART D. ENVIRONMENTAL REINFORCEMENTS/INFLUENCES
1. Classroom Teacher Involvement [for UKCES and INN only] What role(s) did the school/child care teacher(s) play during the intervention class?
N/A—absent from the classroom during the lesson Silent observer who did not participate or support the educator during the lesson

Assistant to the nutrition educator in handing out materials Assistant to the nutrition educator in activities beyond handing out materials Other roles, if any, that the teacher played in supporting the intervention messages:
2. Senior Center Director Involvement [for MSUE only]
What role(s) did the senior center director play during the intervention class? N/A—absent from the room during the lesson Silent observer who did not participate or support the educator during the lesson Assistant to the nutrition educator in handing out materials Assistant to the nutrition educator in activities beyond handing out materials Other roles, if any, that the director played in supporting the intervention messages:
3. Availability of Fruits and Vegetables at the Intervention Site
Request and review the current weekly or cycle menu to see the extent and variation in fruits and vegetables offered at the school/senior center for meals and snacks. Below, provide a general description of the number of the fruits and vegetables on menu each day and the variety of fruits and vegetables offered on menu. Attach a copy of the menu.
4. Supportive or Conflicting Indirect Nutrition Messages Visible at the Intervention Site
Note any posters, displays, bulletin boards at the intervention site that relate to nutrition and physical activity. Description of nutrition messaging at intervention site:
E. PART E. LESSONS LEARNED FOR IMPROVEMENT AND REPLICABILITY These are four questions for observers to ask educator after the lesson:
1. Did you deviate from the written lesson plan for today? Yes No [IF YES]
(a) What did you do differently? (b) Why did you decide to make this change (or changes) today?
2. What do you think works best today about this lesson and why?
3. What if anything made it challenging to teach the lesson as you had planned today?
4. What recommendations would you have for improving this lesson if you or others are teaching it another time?
Additional observer comments/notes:

BASICS Nutrition and Physical Activity Program INN ● Program Evaluation
A.16. Web Questionnaire for Building and Strengthening Iowa Community Support Nutrition and Physical Activity Program classroom teachers [pre-implementation]

Language:
Checkbox® 4.7 https://www.altarum.net/survey/Forms/PreviewSurvey.aspx?print=true&...
1 of 14 8/10/2011 8:43 AM

Office of Management and Budget (OMB) No. 0584-0554 Expiration Date: 06/30/2014
The public reporting burden for this collection of information is estimated to average 15 minutes perresponse, including the time for reviewing instructions, searching existing data sources, gathering andmaintaining the data needed, and completing and reviewing the collection of information. An agency maynot conduct or sponsor, and a person is not required to respond to, a collection of information unless itdisplays a currently valid OMB control number. Send comments regarding this burden estimate or anyother aspect of this collection of information, including suggestions for reducing this burden, to thefollowing address: U.S. Department of Agriculture, Food and Nutrition Services, Office of Research andAnalysis, Room 1014, Alexandria, VA 22302, ATTN: PRA (0584-0554).
If you have any questions, please feel free to contact Valerie Long at: 207-319-6997.
OMB No. 0584-0554
Checkbox® 4.7 https://www.altarum.net/survey/Forms/PreviewSurvey.aspx?print=true&...
2 of 14 8/10/2011 8:43 AM

The U.S. Department of Agriculture’s Food and Nutrition Service (FNS) wants to know about yourexperience with the Building and Strengthening Iowa Community Support (BASICS) program. They havecontracted with Altarum Institute to study how this program is being implemented at local schools.Please fill out the form below to provide your feedback and help improve this program for children andfamilies in your community and those in other communities like yours.
Your response to this questionnaire will be kept private. After we have received all of the completedquestionnaires and conducted interviews with a number of sites, we will write a report for FNS. Yourname will not appear anywhere in the report. Nothing that you write will be attached to your name at anypoint. None of your responses will affect your job or be shared with the school administrator where youwork.
*County
Waterloo
Council Bluffs
Des Moines
OMB No. 0584-0554
Checkbox® 4.7 https://www.altarum.net/survey/Forms/PreviewSurvey.aspx?print=true&...
3 of 14 8/10/2011 8:43 AM

*School:
Edison Elementary
Irving Elementary
Lowell Elementary
Highland Elementary School
*School:
Bloomer Elementary Longfellow Elementary
Carter Lake Elementary School Roosevelt Elementary School
Edison Elementary Rue Elementary School
Franklin Elementary
*School:
Cattell Elementary Studebaker Elementary
Wright Elementary School Findley Elementary School
Morris Elementary Windsor Elementary School
Carver Elementary Jackson Elementary School
Brubaker Elementary Park Ave Elementary School
Lovejoy Elementary
*Your current job title:
*How long have you been in this position?
< 1 year
1-3 years
4-6 years
7-9 years
10+ years
OMB No. 0584-0554
Checkbox® 4.7 https://www.altarum.net/survey/Forms/PreviewSurvey.aspx?print=true&...
4 of 14 8/10/2011 8:43 AM

Fruits, Vegetables and Low-Fat Milk Products
*1. On a scale of 0-5, where 0 is Not Important and 5 is Extremely Important, how important . . .
*
NotImportant
ExtremelyImportant
0 1 2 3 4 5
. . . do you think eating more fruits,vegetables and consuming more low-fatmilk products are for you?
. . . do you think eating more fruits andvegetables is for your students and theirfamilies?
. . . do you think consuming more milkproducts is for your students and theirfamilies?
OMB No. 0584-0554
Checkbox® 4.7 https://www.altarum.net/survey/Forms/PreviewSurvey.aspx?print=true&...
5 of 14 8/10/2011 8:43 AM

Fruits, Vegetables and Low-Fat Milk Products
4. What fruit(s), vegetables(s), and/or milk products do you not like/consume?
Fruits
Vegetables
Low-Fat Milk products
OMB No. 0584-0554
Checkbox® 4.7 https://www.altarum.net/survey/Forms/PreviewSurvey.aspx?print=true&...
6 of 14 8/10/2011 8:43 AM

BASICS for Nutrition and Physical Activity Curriculum and Training
*5. How familiar are you with the BASICS for Nutrition and Physical Activity curriculum?
Not familiar
Fairly familiar
Familiar
Very familiar
*6. Describe the training you have had to teach the BASICS for Nutrition and Physical Activity curriculum.
No training
1-2 hours
2-4 hours
5-7 hour
More:
*7. Have you been able to review the BASICS for Nutrition and Physical Activity curriculum and take-home materials?
Not looked over or read at all
Glanced at materials
Reviewed all of the materials
Read through materials carefully
More:
OMB No. 0584-0554
Checkbox® 4.7 https://www.altarum.net/survey/Forms/PreviewSurvey.aspx?print=true&...
7 of 14 8/10/2011 8:43 AM

BASICS for Nutrition and Physical Activity Curriculum and Training
*8. What is your impression of the BASICS for Nutrition and Physical Activity curriculum?
Excellent curriculum
Looks to be an effective curriculum
Has parts that look to be effective
Not impressed
Don’t know
*9. At this point, prior to teaching the curriculum, would you make any changes to the curriculum?
Yes
No
OMB No. 0584-0554
Checkbox® 4.7 https://www.altarum.net/survey/Forms/PreviewSurvey.aspx?print=true&...
8 of 14 8/10/2011 8:43 AM

BASICS for Nutrition and Physical Activity Curriculum and Training
9a. What changes would you make to the curriculum?
*10. Do you feel prepared to teach the BASICS for Nutrition and Physical Activity curriculum?
Yes
Somewhat
No
Don’t know
OMB No. 0584-0554
Checkbox® 4.7 https://www.altarum.net/survey/Forms/PreviewSurvey.aspx?print=true&...
9 of 14 8/10/2011 8:43 AM

Parent/Family Messages and Events
*11. Have you seen the BASICS for Nutrition and Physical Activity newsletters and family activity cards for parents?
Yes
No
Don't know
*12. How effective do you think these materials will be in the promotion of fruits, vegetables and milk with parents?
Very effective
Somewhat effective
Not effective
Don’t know
*13. Are you aware of the family events that will be part of BASICS for Nutrition and Physical Activity program?
Yes
No
Don't know
OMB No. 0584-0554
Checkbox® 4.7 https://www.altarum.net/survey/Forms/PreviewSurvey.aspx?print=true&...
10 of 14 8/10/2011 8:43 AM

Parent/Family Messages and Events
*14. How effective do you think these events will be in the promotion of fruits, vegetables and milk with parents?
Very effective
Somewhat effective
Not effective
Don’t know
*15. Are you aware of the social marketing campaign that will be a supplemental component of the BASICS forNutrition and Physical Activity curriculum?
Yes
No
Don't know
*16. If you are aware of the social marketing campaign, do you think it will be an effective complement to thecurriculum?
Yes
Somewhat
No
Don't know
OMB No. 0584-0554
Checkbox® 4.7 https://www.altarum.net/survey/Forms/PreviewSurvey.aspx?print=true&...
11 of 14 8/10/2011 8:43 AM

Working with BASICS Nutrition Educator
*17. Have you ever worked with the BASICS nutrition educator before?
Yes
No
Don't know
*18. If you have worked with the BASICS nutrition educator in the past, how effective do you think they were?
Very effective
Somewhat effective
Not effective
Don’t know
*19. If you have not worked with the outside nutrition educator in the past, how do you feel about sharing theresponsibility of teaching the BASICS for Nutrition and Physical Activity curriculum with them?
Looking forward to it
Fine with it
Somewhat apprehensive
Not looking forward to it
Don’t know
OMB No. 0584-0554
Checkbox® 4.7 https://www.altarum.net/survey/Forms/PreviewSurvey.aspx?print=true&...
12 of 14 8/10/2011 8:43 AM

Overall Opinion
20. Overall, what is your feeling about BASICS for Nutrition and Physical Activity curriculum, as you start thisintervention?
OMB No. 0584-0554
Checkbox® 4.7 https://www.altarum.net/survey/Forms/PreviewSurvey.aspx?print=true&...
13 of 14 8/10/2011 8:43 AM

Thank you very much for your time and input into this very important project!
OMB No. 0584-0554
Checkbox® 4.7 https://www.altarum.net/survey/Forms/PreviewSurvey.aspx?print=true&...
14 of 14 8/10/2011 8:43 AM

BASICS Nutrition and Physical Activity Program INN ● Program Evaluation
A.17. Web Questionnaire for Building and Strengthening Iowa Community Support Nutrition and Physical Activity Program Classroom Teachers [post-implementation]

Language:
Checkbox® 4.7 https://www.altarum.net/survey/Forms/PreviewSurvey.aspx?print=true&...
1 of 19 8/10/2011 8:42 AM

Office of Management and Budget (OMB) No. 0584-0554 Expiration Date: 06/30/2014
The public reporting burden for this collection of information is estimated to average 15 minutes perresponse, including the time for reviewing instructions, searching existing data sources, gathering andmaintaining the data needed, and completing and reviewing the collection of information. An agency maynot conduct or sponsor, and a person is not required to respond to, a collection of information unless itdisplays a currently valid OMB control number. Send comments regarding this burden estimate or anyother aspect of this collection of information, including suggestions for reducing this burden, to thefollowing address: U.S. Department of Agriculture, Food and Nutrition Services, Office of Research andAnalysis, Room 1014, Alexandria, VA 22302, ATTN: PRA (0584-0554).
If you have any questions, please feel free to contact Valerie Long at: 207-319-6997.
The U.S. Department of Agriculture’s Food and Nutrition Service (FNS) wants to know about yourexperience with the Building and Strengthening Iowa Community Support (BASICS) program. They havecontracted with Altarum Institute to study how this program is being implemented at local schools.Please fill out the form below to provide your feedback and help improve this program for children andfamilies in your community and those in other communities like yours.
Your response to this questionnaire will be kept private. After we have received all of the completedquestionnaires and conducted interviews with a number of sites, we will write a report for FNS. Yourname will not appear anywhere in the report. Nothing that you write will be attached to your name at anypoint. None of your responses will affect your job or be shared with the school administrator where youwork.
OMB No. 0584-0554
Checkbox® 4.7 https://www.altarum.net/survey/Forms/PreviewSurvey.aspx?print=true&...
2 of 19 8/10/2011 8:42 AM

Fruits, Vegetables and Low-Fat Milk Products
*1. On a scale of 0-5, where 0 is Not Important and 5 is Extremely Important, how important . . .
*
NotImportant
ExtremelyImportant
0 1 2 3 4 5
. . . do you think eating more fruits,vegetables and consuming more low-fatmilk products are for you?
. . . do you think eating more fruits andvegetables is for your students and theirfamilies?
. . . do you think consuming more milkproducts is for your students and theirfamilies?
OMB No. 0584-0554
Checkbox® 4.7 https://www.altarum.net/survey/Forms/PreviewSurvey.aspx?print=true&...
3 of 19 8/10/2011 8:42 AM

Fruits, Vegetables and Low-Fat Milk Products
4. As a result of teaching this program, are there any new fruits, vegetables, and/or low-fat milk products that younow consume?
OMB No. 0584-0554
Checkbox® 4.7 https://www.altarum.net/survey/Forms/PreviewSurvey.aspx?print=true&...
4 of 19 8/10/2011 8:42 AM

BASICS for Nutrition and Physical Activity Curriculum and Training
*5. Do you feel that the training you received for the BASICS for Nutrition and Physical Activity program providedyou with enough knowledge and skills to effectively teach your lessons?
Yes
No
Don't know
OMB No. 0584-0554
Checkbox® 4.7 https://www.altarum.net/survey/Forms/PreviewSurvey.aspx?print=true&...
5 of 19 8/10/2011 8:42 AM

BASICS for Nutrition and Physical Activity Curriculum and Training
5a. If you didn’t feel that the training was adequate, how would you have improved it?
OMB No. 0584-0554
Checkbox® 4.7 https://www.altarum.net/survey/Forms/PreviewSurvey.aspx?print=true&...
6 of 19 8/10/2011 8:42 AM

BASICS for Nutrition and Physical Activity Curriculum and Training
*6. Now that you have taught this curriculum, would you make any changes to the curriculum?
*7. How many of the BASICS lessons taught by the nutritionist were you able to observe in the classroom?
all
7
6
5
4
3
2
1
none
*8. Outside of the four lessons you taught, did you incorporate any nutrition messages, sample activities, or toolsfrom BASICS program in the classroom?
Yes
No
Some
OMB No. 0584-0554
Checkbox® 4.7 https://www.altarum.net/survey/Forms/PreviewSurvey.aspx?print=true&...
7 of 19 8/10/2011 8:42 AM

BASICS for Nutrition and Physical Activity Curriculum and Training
*8a. How did you incorporate these messages and materials into your classroom activities?
OMB No. 0584-0554
Checkbox® 4.7 https://www.altarum.net/survey/Forms/PreviewSurvey.aspx?print=true&...
8 of 19 8/10/2011 8:42 AM

BASICS for Nutrition and Physical Activity Curriculum and Training
*9. How often would you estimate you used the new information you received from the BASICS program in yourclassroom?
A couple of times
Once every week
A few times a week
More than a few times a week
*9a. What aspects of the BASICS content or design of the messages, sample activities or tools made it easier foryou to incorporate these into your classroom activities (e.g., ease of use in the classroom setting, culturalsensitivity, age appropriateness of the materials for the target audience)?
*9b. What aspects prevented you from using these tools in your classroom (e.g., lack of time, lack of money forsupplies, lack of confidence)?
OMB No. 0584-0554
Checkbox® 4.7 https://www.altarum.net/survey/Forms/PreviewSurvey.aspx?print=true&...
9 of 19 8/10/2011 8:42 AM

BASICS for Nutrition and Physical Activity Curriculum and Training
*10. What do you think are the strengths of the curriculum now that you have seen it taught, and taught fourlessons yourself?
*11. What do you think are the weaknesses of the curriculum now that you have seen it taught, and taught fourlessons yourself?
OMB No. 0584-0554
Checkbox® 4.7 https://www.altarum.net/survey/Forms/PreviewSurvey.aspx?print=true&...
10 of 19 8/10/2011 8:42 AM

Parent/Family Messages and Events
*12. How effective do you think these materials were in the promotion of fruits, vegetables and milk with parents?
Very effective
Somewhat effective
Not effective
Don’t know
*13. How many of the BASICS parent/family activities that were held at your school were you able to attend?
0
1
2
3
4
*14. How effective do you think these events were in the promotion of fruits, vegetables and milk with parents?
Very effective
Somewhat effective
Not effective
Don’t know
OMB No. 0584-0554
Checkbox® 4.7 https://www.altarum.net/survey/Forms/PreviewSurvey.aspx?print=true&...
11 of 19 8/10/2011 8:42 AM

Parent/Family Messages and Events
*15. If not effective, what changes or improvements would you suggest to make them more effective?
OMB No. 0584-0554
Checkbox® 4.7 https://www.altarum.net/survey/Forms/PreviewSurvey.aspx?print=true&...
12 of 19 8/10/2011 8:42 AM

Parent/Family Messages and Events
*16. Were you aware of the social marketing campaign that was a supplemental component of the BASICS forNutrition and Physical Activity curriculum?
Yes
No
Don't know
*17. If you saw or heard any of the social marketing campaign ads or store demonstrations, what did you see do youthink it was an effective complement to the curriculum?
Yes
Somewhat
No
Don't know
Did not see the social marketing campaign
OMB No. 0584-0554
Checkbox® 4.7 https://www.altarum.net/survey/Forms/PreviewSurvey.aspx?print=true&...
13 of 19 8/10/2011 8:42 AM

Working with BASICS Nutrition Educator
*18. How effective do you think the outside nutrition educator was in teaching eight lessons of the curriculum?
Very effective
Somewhat effective
Not effective
Don’t know
*19. After having co-taught the curriculum together, how do you feel about sharing the responsibility of teaching thecurriculum with an outside nutrition educator?
It was great
It was fine
Neutral
Didn’t like it
Don’t know
OMB No. 0584-0554
Checkbox® 4.7 https://www.altarum.net/survey/Forms/PreviewSurvey.aspx?print=true&...
14 of 19 8/10/2011 8:42 AM

Overall Opinion
*20. Overall, what is your feeling about BASICS for Nutrition and Physical Activity curriculum, as you finish thisintervention?
OMB No. 0584-0554
Checkbox® 4.7 https://www.altarum.net/survey/Forms/PreviewSurvey.aspx?print=true&...
15 of 19 8/10/2011 8:42 AM

Overall Opinion
*21. What changes or improvements would you suggest to better reach parents with the BASICS for Nutrition andPhysical Activity program messages?
OMB No. 0584-0554
Checkbox® 4.7 https://www.altarum.net/survey/Forms/PreviewSurvey.aspx?print=true&...
16 of 19 8/10/2011 8:42 AM

Overall Opinion
*22. Do you have any recommendations or suggestions for ways the BASICS for Nutrition and Physical Activitycurriculum can be improved overall?
OMB No. 0584-0554
Checkbox® 4.7 https://www.altarum.net/survey/Forms/PreviewSurvey.aspx?print=true&...
17 of 19 8/10/2011 8:42 AM

Thank you very much for your time and input into this very important project! As a gift of appreciation,Altarum Institute will mail you a check for $10. Please submit your name and mailing address below.
Name:
Address:
City:
State:
Zip Code:
OMB No. 0584-0554
Checkbox® 4.7 https://www.altarum.net/survey/Forms/PreviewSurvey.aspx?print=true&...
18 of 19 8/10/2011 8:42 AM

Thank you very much for your time and input into this very important project!
OMB No. 0584-0554
Checkbox® 4.7 https://www.altarum.net/survey/Forms/PreviewSurvey.aspx?print=true&...
19 of 19 8/10/2011 8:42 AM

BASICS Nutrition and Physical Activity Program INN ● Program Evaluation
A.18. Building and Strengthening Iowa Community Support Nutrition and Physical Activity Program Classroom Teacher Monthly Supplemental Activity Log Forms

1/16/13 Waterloo Teacher Time Lesson 1 Survey
https://www.surveymonkey.com/s/WaterlooteachtimeNOV 1/2
Exit this survey
Waterloo Teacher Time Lesson 1
1. Classroom:
2. The classroom teacher completed the following activities: (If the classroon teacher
did not complete all the activities, please provide the reason in the comments section)
3. How much time did the classroom teacher spend on nutrition education?
Please keep your teacher reporting forms. Do not throw them away. IDPH will collect the forms.
Thank you
DoneDone
Pow ered by SurveyMonkey
Check out our sample surveys and create your ow n now !
Jammin' Minute
Read pages 5-14 and 20-26 from the Monster Health Book
Placed items from the school lunch menu into the food groups from MyPlate paying special attention to
those foods that represent multiple food groups.
Jammin' Minute
Read the Grapes of Math book
Quantitative reasoning problems using fruit/veggie wheels
Comments

1/16/13 Waterloo Teacher Time Lesson 1 Survey
https://www.surveymonkey.com/s/WaterlooteachtimeNOV 2/2

BASICS Nutrition and Physical Activity Program INN ● Program Evaluation
A.19. Building and Strengthening Iowa Community Support Nutrition and Physical Activity Program Nutrition Educator Monthly Supplemental Activity Log Forms

1/16/13 Waterloo Educator November Lesson 1 Survey
https://www.surveymonkey.com/s/BASICSNov1Waterloo 1/2
Exit this survey
Waterloo Educator November Lesson 1
1. Which classroom were you in?
2. Number of students in class ON THE DAY you taught the lesson:
3. How much time was spent in the classroom on nutrition education? (actual
teaching time by the nutrition educator)
4. Of the total amount of education time reported in question 3, how much time was
spent on the tasting experience?
5. Please check all the lesson activities you completed.
If you did not check one of the activities, please provide the reason why in the
comments section.
Jammin' Minute
Introduction to MyPlate
Tasted jicama
Students completed cryptogram
Thumb's up exercise- students who taste receive "I tried it" sticker
Take home materials(bingo cards, pencils, magnets, and newsletters)
Reason unable to complete lesson plan:

1/16/13 Waterloo Educator November Lesson 1 Survey
https://www.surveymonkey.com/s/BASICSNov1Waterloo 2/2
6. Please let us know if you have comments about any of the lessons for this month.
DoneDone
Pow ered by SurveyMonkey
Check out our sample surveys and create your ow n now !

Appendix B
Process Evaluation Data and Supplemental
Information


BASICS Nutrition and Physical Activity Program INN ● Program Evaluation
List of Contents
B.1: BASICS Project Resource and Expense Tracking Form (Design, Implementation, and Evaluation Costs)
B.2. BASICS Evaluation Parent Follow-up Survey Descriptive Tables for Process Questions
B.3. BASICS Curriculum Materials *
B.4. Detailed Description of Social Marketing Campaign
B.5. Pick a Better Snack Social Marketing Campaign Materials *
B.6. Their Bodies Change Social Marketing Campaign Materials *

BASICS Nutrition and Physical Activity Program INN ● Program Evaluation
B.1: BASICS Project Resource and Expense Tracking Form (Design, Implementation, and Evaluation Costs)

SNAP-Ed Wave II: Project Resource and Expense Tracking Form for Program Administrator [POST-IMPLEMENTATION]
This data collection form will be used to summarize information about actual resources used for and expenses related to your SNAP-Ed WAVE II intervention. In Section 1, we are requesting information that is specific to the planning and design of your project. In Section 2, we are requesting cost related data specific to the implementation of your project. In Section 3, we are requesting information that is specific only to the evaluation (Demonstration Project-led assessment) component of your intervention.
SECTION 1. Planning and design
In the following tables, please provide the requested information as it relates to the planning and design of your project. Please do not include resources or expenses related to the implementation or evaluation of your project.
1.1 Summarize staff costs (human capital) for the planning and design of your SNAP-Ed WAVE II
intervention.
(a) At the administrative, coordination, oversight, and trainer levels
Title of position Brief description of
responsibilities FTEs
Average salary for this position
IDPH Research Project Coordinator
Co-Principal Investigator 373 hours of 2080 0.18 FTE
$80,495
IDPH Social Marketing Coordinator
Development and implementation of social
marketing campaign
228 hours of 2080 0.11 FTE
$80,495
IDPH Administrative Assistant
Survey distribution, data cleaning, file management
33 hours of 2080 0.0158 FTE
$61,590
IDPH Fiscal Manager Manage fiscal contracts and budgets
26 hours of 2080 0.0125 FTE
$77,125
(b) At the nutrition educator level (per intervention site), if applicable
Title of position Brief description of
responsibilities FTEs
Average salary for this position
Des Moines Nutrition Educator
Nutrition Education at school
47 hours of 2080 0.0225 FTE
$64,377
Council Bluffs Nutrition Educator 1
Nutrition Education at school
34 hours of 2080 0.0163 FTE
$45,809
Council Bluffs Nutrition Educator 2
Nutrition Education at school
4 hours of 2080 0.0019 FTE
$24,960
Waterloo Nutrition Educator
Nutrition Education at school
48.5 hours of 2080 0.0233 FTE
$48,480
(c) IT/technical staff, if applicable
Title of position Brief description of
responsibilities FTEs
Average salary for this position
Not Applicable

(d) Other
Title of position Brief description of
responsibilities FTEs
Average salary for this position
Salary range for this position
Not Applicable
1.2 Please provide the following information for ACTUAL expenditures related to the planning and design
of your SNAP-Ed WAVE II intervention only (NOT FOR IIMPLEMENTATION OR EVALUATION).
Expenses (a) Non-Federal Funds
(b) Federal non-SNAP-Ed Funds 1112
(c) Federal SNAP-Ed Funds
1108
(d) Total Federal Funds
(b+c)
(e) Total Funds (a+b+c)
1. Salary/benefits $0.00 $0.00 $28,399.23 $28,399.23 $28,399.23
2. Contracts/grants agreements
$0.00 $16,647.71 $73,514.11 $90,161.82 $90,161.82
3. Noncapital equipment/ supplies
$0.00 $0.00 $0.00 $0.00 $0.00
4. Materials $0.00 $1,650 $14,650.00 $16,300.00 $16,300.00
5. Travel $0.00 $2,216.77 $0.00 $2,216.77 $2,216.77
6. Administrative $0.00 $0.00 $0.00 $0.00 $0.00
7. Building/space $0.00 $0.00 $0.00 $0.00 $0.00
8. Maintenance $0.00 $0.00 $0.00 $0.00 $0.00
9. Equipment and other capital expenditures
$0.00 $0.00 $0.00 $0.00 $0.00
10. TOTAL Direct Costs $0.00 $20,514.48 $116,563.34 $137,077.82 $137,077.82
11. Indirect costs $0.00 $0.00 $7,440.60 $7,440.60 $7,440.60
12. TOTAL Costs $0.00 $20,514.48 $124,003.93 $144,518.41 $144,518.41
SECTION 2. Implementation In the following tables, please provide the requested information as it relates to the implementation of your project. Please do not include resources or expenses related to your planning and design or evaluation.
2.1. Summarize staff costs (human capital) for the implementation of your SNAP-Ed WAVE II project.
(a) At the administrative, coordination, oversight level, and trainer levels

Title of position Brief description of
responsibilities FTEs
Average salary for this position
IDPH Research project
coordinator at IDPH
Co-P.I. with Dr. Shelley 147 hours of 2080
0.07 FTE
$80,495
IDPH Social marketing
coordinator
development and
implementation of social
marketing strategies
321 hours of 2080
0.154 FTE
$80,495
IDPH Administrative
assistant
survey distribution, data
cleaning, file management
84 hours of 2080
0.040FTE
$61,590
IDPH Fiscal manager
manage fiscal contracts
and budgets
26 hours of 2080
0.0101 FTE
$77,125
(b) At the nutrition educator level (per intervention site), if applicable
Title of position Brief description of
responsibilities FTEs
Average salary for this position
Des Moines nutrition
educator
Nutrition Education at
school
129 hours of 2080
.0620 FTE
$64,377
Council Bluffs nutrition
educator 1
Nutrition Education at
school
82 hours of 2080 .0394
FTE
$45,809
Council Bluffs nutrition
educator 2
Nutrition Education at
school
32.5 hours of 2080
.0156 FTE
$24,960
Waterloo nutrition
educator
Nutrition Education at
school
106 hours of 2080
.0509 FTE
$48,480

(c) IT/technical staff, if applicable
Title of position Brief description of
responsibilities FTEs
Average salary for this position
Salary range for this position
Not Applicable
(d) Other
Title of position Brief description of
responsibilities FTEs
Average salary for this position
Salary range for this position
Not Applicable
2.2. Describe the actual costs other than staff costs (physical capital) required to implement project.
(a) Space (b) Audiovisual (c) Computer/software (d) Other
2.3. Please provide the following information for actual expenditures related to the implementation of your
SNAP-Ed WAVE II intervention only (NOT FOR EVALUATION).
Expenses (a) Non-Federal Funds
(b) Federal non-SNAP-Ed Funds 1112
(c) Federal SNAP-Ed Funds
1108
(d) Total Federal Funds
(b+c)
(e) Total Funds (a+b+c)
13. Salary/benefits $0 $0 $21,795.78 $21,796 $21,795.78
14. Contracts/grants agreements
$43,319 $61,905 $67,037 $128,942 $172,261
15. Noncapital equipment/ supplies
$0 $0 $0 $0 $0
16. Materials $0 $0 $0 $0 $0
17. Travel $0 $0 $0 $0 $0
18. Administrative $0 $0 $0 $0 $0
19. Building/space $0 $0 $0 $0 $0
20. Maintenance $0 $0 $0 $0 $0
21. Equipment and other capital expenditures
$0 $0 $0 $0 $0
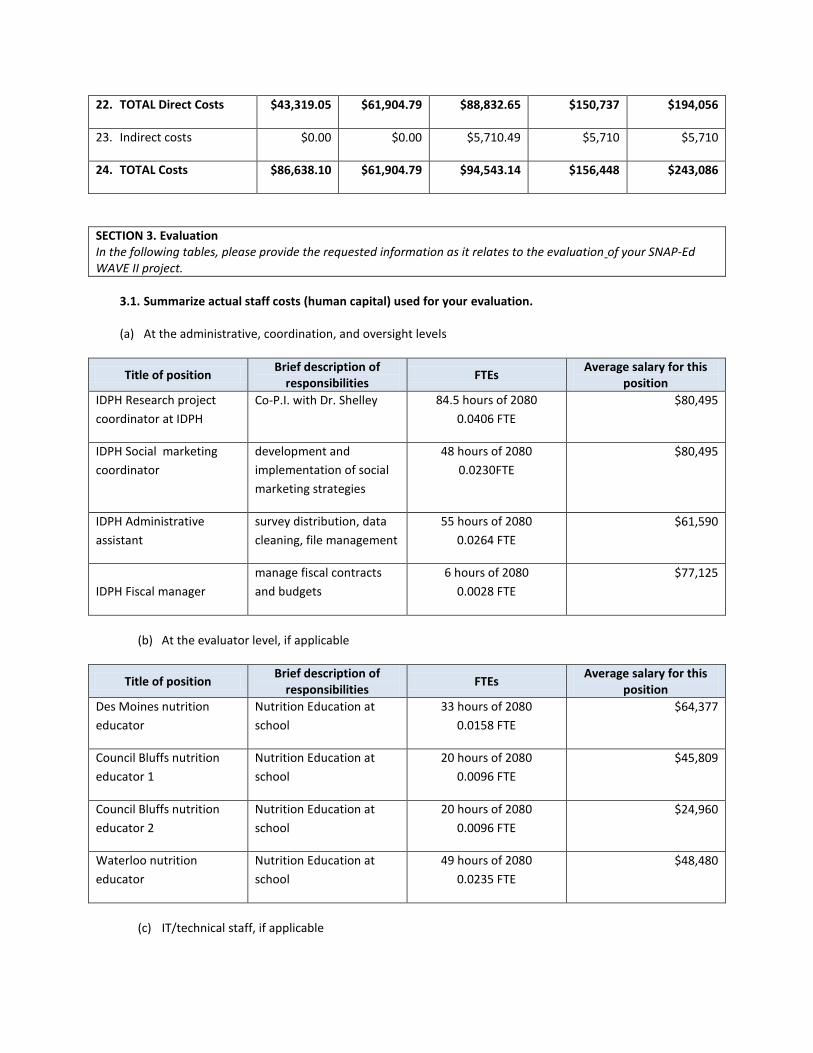
22. TOTAL Direct Costs $43,319.05 $61,904.79 $88,832.65 $150,737 $194,056
23. Indirect costs $0.00 $0.00 $5,710.49 $5,710 $5,710
24. TOTAL Costs $86,638.10 $61,904.79 $94,543.14 $156,448 $243,086
SECTION 3. Evaluation In the following tables, please provide the requested information as it relates to the evaluation of your SNAP-Ed WAVE II project.
3.1. Summarize actual staff costs (human capital) used for your evaluation.
(a) At the administrative, coordination, and oversight levels
Title of position Brief description of
responsibilities FTEs
Average salary for this position
IDPH Research project
coordinator at IDPH
Co-P.I. with Dr. Shelley 84.5 hours of 2080
0.0406 FTE
$80,495
IDPH Social marketing
coordinator
development and
implementation of social
marketing strategies
48 hours of 2080
0.0230FTE
$80,495
IDPH Administrative
assistant
survey distribution, data
cleaning, file management
55 hours of 2080
0.0264 FTE
$61,590
IDPH Fiscal manager
manage fiscal contracts
and budgets
6 hours of 2080
0.0028 FTE
$77,125
(b) At the evaluator level, if applicable
Title of position Brief description of
responsibilities FTEs
Average salary for this position
Des Moines nutrition
educator
Nutrition Education at
school
33 hours of 2080
0.0158 FTE
$64,377
Council Bluffs nutrition
educator 1
Nutrition Education at
school
20 hours of 2080
0.0096 FTE
$45,809
Council Bluffs nutrition
educator 2
Nutrition Education at
school
20 hours of 2080
0.0096 FTE
$24,960
Waterloo nutrition
educator
Nutrition Education at
school
49 hours of 2080
0.0235 FTE
$48,480
(c) IT/technical staff, if applicable

Title of position Brief description of
responsibilities FTEs
Average salary for this position
Salary range for this position
Not Applicable
(d) Other
Title of position Brief description of
responsibilities FTEs
Average salary for this position
Salary range for this position
Not Applicable
3.2. Describe the actual physical capital required to evaluate this project.
(a) Space (b) Audiovisual (c) Computer/software (d) Other
3.3. Please provide the following information for actual expenditures related to the evaluation of your
SNAP-Ed WAVE II intervention only (NOT FOR IMPLEMENTATION).
Expenses (a) Non-Federal Funds
(b) Federal non-SNAP-Ed Funds 1112
(c) Federal SNAP-Ed Funds
1108
(d) Total Federal Funds
(b+c)
(e) Total Funds (a+b+c)
25. Salary/benefits $0 $0 $8,050 $8,050 $8,050
26. Contracts/grants agreements
$0 $59,180 $16,783 $75,963 $75,963
27. Noncapital equipment/ supplies
$0 $0 $0 $0 $0
28. Materials $0 $0 $0 $0 $0
29. Travel $0 $0 $0 $0 $0
30. Administrative $0 $0 $0 $0 $0
31. Building/space $0 $0 $0 $0 $0
32. Maintenance $0 $0 $0 $0 $0
33. Equipment and other capital expenditures
$0 $0 $0
34. TOTAL Direct Costs $0.00 $59,180.00 $24,833.27 $84,013.27 $84,013.27

35. Indirect costs $0.00 $0.00 $2,109.05 $2,109.05 $2,109.05
36. TOTAL Costs $0.00 $59,180.00 $26,942.32 $86,122.32 $86,122.32
SECTION 4. Total Expenditures In the following table, please provide the requested information as it relates to the TOTAL cost of your SNAP-Ed WAVE II project.
4.1. Provide the total expenditures for the SNAP-Ed WAVE II project (sum of 1.2, 2.3, and 3.3).
Expenses (a) Non-Federal Funds
(b) Federal non-SNAP-Ed Funds 1112
(c) Federal SNAP-Ed Funds
1108
(d) Total Federal Funds
(b+c)
(e) Total Funds (a+b+c)
37. Salary/benefits $0.00 $0.00 $58,244.83 $58,244.83 $58,244.83
38. Contracts/grants agreements
$43,319.05 $137,732.50 $157,334.43 $295,066.93 $338,385.98
39. Noncapital equipment/ supplies
$0.00 $0.00 $0.00 $0.00 $0.00
40. Materials $0.00 $1,650.00 $14,650.00 $16,300.00 $16,300.00
41. Travel $0.00 $2,216.77 $0.00 $2,216.77 $2,216.77
42. Administrative $0.00 $0.00 $0.00 $0.00 $0.00
43. Building/space $0.00 $0.00 $0.00 $0.00 $0.00
44. Maintenance $0.00 $0.00 $0.00 $0.00 $0.00
45. Equipment and other capital expenditures
$0.00 $0.00 $0.00 $0.00 $0.00
46. TOTAL Direct Costs $43,319.05 $141,599.27 $230,229.25 $371,828.52 $415,147.57
47. Indirect costs $0.00 $0.00 $15,260.14 $15,260.14 $15,260.14
48. TOTAL Costs $86,638.10 $141,599.27 $245,489.39 $387,088.66 $473,726.76

BASICS Nutrition and Physical Activity Program INN ● Program Evaluation
B.2. BASICS Evaluation Parent Follow-up Survey Descriptive Tables for Process Questions

Parent Survey Table Shells:
Building and Strengthening Iowa Community Support (BASICS) Program Evaluation
Iowa Nutrition Network

Table 1. Parent Participation in BASICS Program “Family Night Out” Event
Overall BASICS BASICS+SM
Question n % n % n %
Attended the “Family Night Out” eventa
Yes 144 28.3 47 18.6 97 37.9
No 365 71.7 206 81.4 159 62.1
Number of respondents 509 100.0 253 100.0 256 100.0
Number of non-responses 4 2 2
a Participating schools had a “Family Night Out” event with parents and children together, which focused on healthy eating and exercise.
Source: Parent Follow-Up Survey, data collected in May–July 2012; respondents are parents/caregivers of children participating in the evaluation study

Table 2. Reasons for Nonparticipation in the BASICS Program “Family Night Out” Event
Overall BASICS BASICS+SM
Question n % n % n %
Reasons for not attending the “Family Night Out” eventa
The event was not offered at my child’s school 36 9.9 23 11.2 13 8.2
Did not know about the event 132 36.2 82 39.8 50 31.4
The event was offered at times that did not work 178 48.8 95 46.1 83 52.2
Did not think the event would be useful 8 2.2 5 2.4 3 1.9
Do not like to go to events like this 5 1.4 2 1.0 3 1.9
Was sick/had to care for sick relative 6 1.6 2 1.0 4 2.5
Had to work 11 3.0 5 2.4 6 3.8
Could not find transportation 2 0.6 2 1.0 0 0.0
Other reason 8 2.2 6 2.9 2 1.3
Number of respondents 365 206 159
a Respondents could select multiple responses.
Source: Parent Follow-Up Survey, data collected in May–July 2012; respondents are parents/caregivers of children participating in the evaluation study
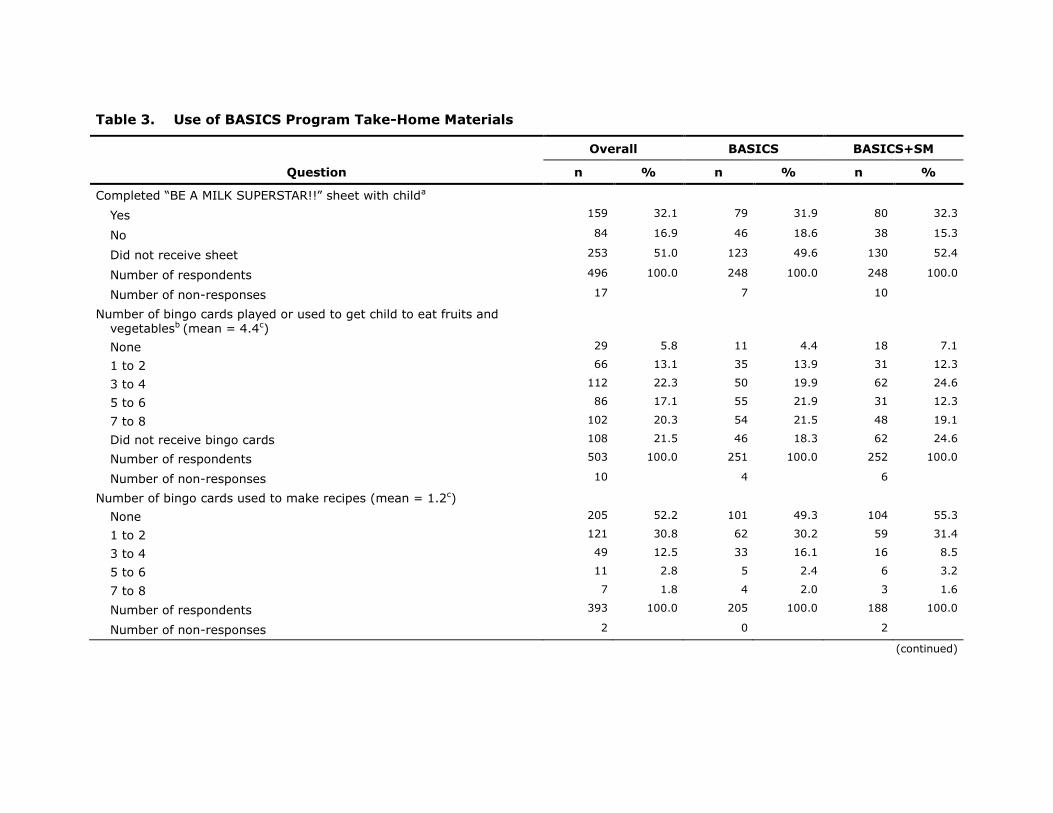
Table 3. Use of BASICS Program Take-Home Materials
Overall BASICS BASICS+SM
Question n % n % n %
Completed “BE A MILK SUPERSTAR!!” sheet with childa
Yes 159 32.1 79 31.9 80 32.3
No 84 16.9 46 18.6 38 15.3
Did not receive sheet 253 51.0 123 49.6 130 52.4
Number of respondents 496 100.0 248 100.0 248 100.0
Number of non-responses 17 7 10
Number of bingo cards played or used to get child to eat fruits and vegetablesb (mean = 4.4c)
None 29 5.8 11 4.4 18 7.1
1 to 2 66 13.1 35 13.9 31 12.3
3 to 4 112 22.3 50 19.9 62 24.6
5 to 6 86 17.1 55 21.9 31 12.3
7 to 8 102 20.3 54 21.5 48 19.1
Did not receive bingo cards 108 21.5 46 18.3 62 24.6
Number of respondents 503 100.0 251 100.0 252 100.0
Number of non-responses 10 4 6
Number of bingo cards used to make recipes (mean = 1.2c)
None 205 52.2 101 49.3 104 55.3
1 to 2 121 30.8 62 30.2 59 31.4
3 to 4 49 12.5 33 16.1 16 8.5
5 to 6 11 2.8 5 2.4 6 3.2
7 to 8 7 1.8 4 2.0 3 1.6
Number of respondents 393 100.0 205 100.0 188 100.0
Number of non-responses 2 0 2
(continued)

Table 3. Use of BASICS Program Take-Home Materials (continued)
Overall BASICS BASICS+SM
Question n % n % n %
Read family newslettersd
Yes, all or most of them 164 32.5 88 34.9 76 30.0
Yes, some of them 233 46.1 118 46.8 115 45.5
No 35 6.9 13 5.2 22 8.7
Did not receive family newsletters 73 14.5 33 13.1 40 15.8
Number of respondents 505 100 252 100 253 100.0
Number of non-responses 8 3 5
a The “BE A MILK SUPERSTAR!!” sheet was sent home with participating students. Parents were encouraged to use the sheet with their child to track each time a family member had milk.
b Bingo cards were sent home with participating students. Children were encouraged to eat the fruits or vegetables pictured and to do the activities pictured to try to get bingo. The back of the bingo cards included recipes and other information on healthy eating and exercise. c Means were calculated for respondents who received the bingo cards. d Family newsletters with tips on healthy eating were sent home with participating students. The newsletters contained tips on healthy eating.
Source: Parent Follow-Up Survey, data collected in May–July 2012; respondents are parents/caregivers of children participating in the evaluation study

Table 4. Parent Satisfaction with BASICS Program Materials and “Family Night Out” Events
Overall BASICS BASICS+SM
Question n % n % n %
Parents’ level of understanding of the family newsletter and other materials on healthy eatinga
Very easy 161 40.7 83 40.3 78 41.1
Easy 193 48.7 101 49.0 92 48.4
Somewhat easy 35 8.8 20 9.7 15 7.9
Not very easy 6 1.5 2 1.0 4 2.1
Not at all easy 1 0.3 0 0.0 1 0.5
Number of respondents 396 100 206 100 190 100
Number of non-responses 36 13 23
Parents’ level of agreement with the statement: “I used the information
from the family newsletters and other materials on healthy eating to help my child eat healthier foods.”a
Strongly agree 57 14.4 33 16.0 24 12.7
Agree 257 65.1 132 64.1 125 66.1
Disagree 74 18.7 39 18.9 35 18.5
Strongly disagree 7 1.8 2 1.0 5 2.7
Number of respondents 395 100 206 100 189 100
Number of non-responses 37 13 24
Parents’ level of agreement with the statement: “I used the information I
learned from the Family Night Out event to help my child eat healthier foods” b
Strongly agree 37 25.9 8 17.4 29 29.9
Agree 89 62.2 34 73.9 55 56.7
Disagree 13 9.1 3 6.5 10 10.3
Strongly disagree 4 2.8 1 2.2 3 3.1
Number of respondents 143 100 46 100 97 100
Number of non-responses 1 1 0
a Family newsletters with tips on healthy eating were sent home with participating students. Responses are for parents who received the newsletters.

b Participating schools had a “Family Night Out” event with parents and children together, which focused on healthy eating and exercise. Responses are for parents who attended the event.
Source: Parent Follow-Up Survey, data collected in May–July 2012; respondents are parents/caregivers of children participating in the evaluation study

Table 5. Parents’ Awareness of Campaigns
Overall BASICS BASICS+SM
Campaign n % n % n %
“Pick a Better Snack” 414 82.8 199 79.6 215 86.0
“Their bodies change, so should their milk” 124 24.8 50 20.0 74 29.6
“Be Strong” 207 42.5 121 49.4 86 35.5
“Mr. Juicebar”a 50 10.0 23 9.2 27 10.8
Number of respondents 500 250 250
Number of non-responses 13 5 8
a Not a real program; included as a distractor.
Source: Parent Follow-Up Survey, data collected in May–July 2012; respondents are parents/caregivers of children participating in the evaluation study.

Table 6. Ways Participants Saw, Read, or Heard about “Pick A Better Snack” Campaign
Overall BASICS BASICS+SM
Methoda n % n % n %
Radio 6 1.5 1 0.5 5 2.3
TV 22 5.3 9 4.5 13 6.1
Billboards, signs on buses, or at bus stops 98 23.7 49 24.6 49 22.8
Signs at gas stations 69 16.7 17 8.5 52 24.2
Poster, brochure, or other materials at grocery store 9 2.2 5 2.5 4 1.9
Poster, brochure, or other materials at child’s school 82 19.8 36 18.1 46 21.4
Poster, brochure, or other materials at food assistance programs, such as food pantries, WIC clinics, or DHS
303 73.2 148 74.4 155 72.1
Heard about the campaign from children 84 20.3 39 19.6 45 20.9
Don’t remember 12 2.9 2 1.0 10 4.7
Other 3 0.7 2 1.0 1 0.5
Number of respondents 414 199 215
a Responses are for respondents aware of the program. Respondents could select multiple responses.
Source: Parent Follow-Up Survey, data collected in May–July 2012; respondents are parents/caregivers of children participating in the evaluation study.

Table 7. Ways Participants Saw, Read, or Heard about “Their bodies change, so should their milk” Campaign
Overall BASICS BASICS+SM
Methoda n % n % n %
Radio 5 4.0 1 2.0 4 5.4
TV 14 11.3 1 2.0 13 17.6
Billboards, signs on buses, or at bus stops 33 26.6 13 26.0 20 27.0
Signs at gas stations 30 24.2 4 8.0 26 35.1
Poster, brochure, or other materials at grocery store 3 2.4 1 2.0 2 2.7
Poster, brochure, or other materials at child’s school 22 17.7 9 18.0 13 17.6
Poster, brochure, or other materials at food assistance programs, such as food pantries, WIC clinics, DHS
56 45.2 29 58.0 27 36.5
Doctor’s office 27 21.8 15 30.0 12 16.2
Don’t remember 3 2.4 2 4.0 1 1.4
Other 2 1.6 1 2.0 1 1.4
Number of respondents 124 50 74
a Responses are for respondents aware of the program. Respondents could select multiple responses.
Source: Parent Follow-Up Survey, data collected in May–July 2012; respondents are parents/caregivers of children participating in the evaluation study.

Table 8. Ways Participants Saw, Read or Heard about “Be Strong” Campaign
Overall BASICS BASICS+SM
Methoda n % n % n %
Radio 9 4.3 3 2.5 6 7.0
TV 17 8.2 8 6.6 9 10.5
Billboards, signs on buses, or at bus stops 59 28.5 35 28.9 24 27.9
Signs at gas stations 28 13.5 12 9.9 16 18.6
Poster, brochure, or other materials at grocery store 5 2.4 4 3.3 1 1.2
Poster, brochure, or other materials at child’s school 37 17.9 24 19.8 13 15.1
Poster, brochure, or other materials at food assistance programs, such as food pantries, WIC clinics, DHS
123 59.4 82 67.8 41 47.7
Don’t remember 50 24.2 24 19.8 26 30.2
Other 3 1.4 1 0.8 2 2.3
Number of respondents 207 121 86
Number of non-responses 4 2 2
a Responses are for respondents aware of the programs. Respondents could select multiple responses.
Source: Parent Follow-Up Survey, data collected in May–July 2012; respondents are parents/caregivers of children participating in the evaluation study.

Table 9. Baseline Demographic Characteristics for Parent Respondents and their Children who Participated in the
BASICS Evaluation
Characteristic Overall
(SE) BASICS
(SE) BASICS+SM
(SE) Comparison Group (SE)
Difference BASICS+SM vs. BASICS
Difference BASICS+SM vs.
Comparison
Child demographics
Sex, % male 49.30 (1.31) 51.07 (2.51) 50.88 (2.48) 46.42 (2.43) -0.18 4.46
Age 8.57 (0.01) 8.55 (0.02) 8.55 (0.02) 8.6 (0.02) 0.00 -0.04
Parenta/household demographics
Respondent age, %
18 to 34 58.61 (1.76) 60.83 (2.44) 57.79 (3.41) 57.48 (3.37) -2.70 0.32
35 to 44 33.53 (1.62) 31.90 (2.08) 32.20 (3.19) 36.36 (3.15) -0.48 -4.16
45 or older 7.82 (0.84) 7.22 (1.39) 10.27 (1.27) 5.95 (1.24) 2.99 4.33*
Respondent sex, % male 7.05 (0.74) 9.26 (1.15) 5.45 (1.06) 6.65 (1.04) -3.81* -1.20
Respondent is Hispanic or Latino, % 14.62 (1.40) 16.88 (2.59) 16.40 (2.36) 10.65 (2.34) -0.49 5.75
Respondent race, %
American Indian or Alaska Native 0.92 (0.27) 0.96 (0.52) 1.26 (0.48) 0.59 (0.45) 0.30 0.67
Asian 2.39 (0.72) 0.36 (1.30) 5.48 (1.32) 1.40 (1.28) 5.13* 4.08*
Black or African American 15.03 (2.18) 8.36 (3.09) 13.33 (3.34) 22.93 (3.27) 5.00 -9.60
Native Hawaiian or other Pacific Islander 0.61 (0.24) 1.58 (0.45) 0.32 (0.23) 0.00 (0.22) -1.29 0.32
White 76.80 (2.62) 86.48 (4.00) 74.94 (3.96) 69.43 (3.88) -11.53 5.51
More than one raceb 4.09 (0.73) 1.97 (1.18) 4.74 (1.39) 5.44 (1.34) 2.75 -0.70
Size of household 4.93 (0.07) 5.04 (0.09) 4.84 (0.13) 4.92 (0.13) -0.21 -0.07
Single-adult household, % 23.85 (1.23) 20.34 (2.04) 27.00 (2.12) 23.96 (2.09) 6.66* 3.04
Language spoken by family at home, %
Speak English all of the time 85.07 (2.31) 82.49 (4.09) 77.83 (3.57) 94.76 (3.55) -4.68 -16.92**
Speak English some of the time and
speak another language some of the time
12.62 (1.94) 13.54 (3.39) 19.45 (2.88) 4.98 (2.85) 5.90 14.47**
Speak another language all of the time 2.41 (0.56) 4.11 (1.03) 2.86 (0.93) 0.27 (0.92) -1.16 2.6
Member of household currently receives SNAP benefits, %
51.83 (2.34) 47.30 (3.24) 49.84 (4.10) 58.07 (4.06) 2.40 -8.23
Member of household currently receives WIC benefits, %
18.57 (1.24) 19.01 (2.06) 15.45 (1.98) 21.08 (1.96) -3.58 -5.63
(continued)

Table 9. Baseline Demographic Characteristics for Parent Respondents and their Children who Participated in the
BASICS Evaluation (continued)
Characteristic Overall
(SE) BASICS
(SE) BASICS+SM
(SE) Comparison Group (SE)
Difference
BASICS+SM vs. BASICS
Difference
BASICS+SM vs. Comparison
School-provided food, %
Received breakfast and lunch 42.18 (2.38) 39.54 (4.00) 40.33 (4.16) 46.59 (4.12) 0.77 -6.26
Received lunch onlyc 35.96 (2.53) 39.63 (4.21) 35.96 (4.41) 32.35 (4.37) -3.58 3.61
Received breakfast and/or snacks only 5.86 (0.75) 4.85 (1.45) 7.71 (1.18) 4.92 (1.16) 3.02 2.79
Received no food from school 15.65 (1.32) 15.78 (2.46) 15.44 (2.43) 15.8 (2.40) -0.34 -0.36
Perceived nutrition environmentd 12.86 (0.08) 12.82 (0.14) 12.82 (0.14) 12.95 (0.14) 0.00 -0.13
Number of respondents, % 1,037 342 343 352
Number of schools 33 11 11 11
*Indicates statistical significance if the p-value is less than or equal to 0.05.
**Indicates statistical significance if the p-value is less than or equal to 0.01.
a Represents the parent/guardian who completed the survey. b Includes respondents who selected more than one race category. c Some in this category also reported receiving school-provided snacks. d Index score (4–16) derived from four items that asked participants to describe their access to fresh fruits and vegetables in the area that they live. Each item
had a 4-point Likert scale. A higher score indicates perceived greater access to fresh fruits and vegetables.
Note: Standard errors (SEs) and t-statistic used to test the null hypothesis of no difference between the specified study conditions were derived from model-based comparisons adjusted for clustering of students within schools.
Source: Parent Baseline Survey, data collected September–October 2011

BASICS Nutrition and Physical Activity Program INN ● Program Evaluation
B.3. BASICS Curriculum Materials * *This is a sample. Additional materials can be found on the Iowa Nutrition Network Website
http://www.idph.state.ia.us/INN/PickABetterSnack.aspx

Nutrition Educator Lesson

Funded by USDA’s Supplemental Nutrition Assistance Program, an equal opportunity provider and employer, in collaboration with the Iowa Department of Public Health. Iowa Food Assistance can help you buy healthy food. Visit www.yesfood.iowa.gov for more information.
December - Lesson Plan Grades 2-3
Objectives Learn the health value of broccoli. Examine how the nutrients of broccoli are released in the body during the process of digestion.
Background Broccoli has been grown for over 2,000 years. Romans prized broccoli and by the 16th century it was eaten by families in France and Italy. Thomas Jefferson noted the planting of broccoli in his family garden in the late 1700’s but it didn’t become widely known until the turn of the 20th century. Over ninety percent of the broccoli crop is grown in California. Two brothers, Stefano and Andrea D’Arrigo from Messina, Italy, arrived in the U.S. in the early 1900’s. In 1922, they started their own produce company in San Jose, California. They were the first commercial growers in the West to successfully raise and ship box loads of broccoli. Their broccoli was developed from seeds sent from Italy by their father. They created a distinctive brand name for their broccoli – “Andy Boy” – and put a photo of Stefano’s two-year-old son, Andrew, on the label. Theirs was the first fresh produce company in the U.S. to use a brand name on their advertising. (Harvest of the Month, February 2006) Over 30,000 plants can grow in only one acre of land! WOW! A field may be harvested two to three times to remove all the broccoli. Ideally, broccoli should be harvested during the cooler months in order to ensure the longest storage time. It should be cut with 8 to 10 inches of stem left intact and the heads should be cooled immediately to prevent opening and discoloration. Broccoli may be packed in the field or transported to a processing facility where it is cut and packaged. Broccoli is called the crown jewel of nutrition because it is so rich in vitamins and minerals. It has calcium and vitamins C and A. Half of a pound of broccoli has more vitamin C than two and a half pounds of oranges or 204 apples. The word broccoli comes from the Italian “brocco” meaning arm branch. Broccoli is a member of the Cruciferae family which means it’s related to cabbage, cauliflower, and Brussels sprouts. There are two types of broccoli:
Supplies Needed
December Pick a better snack™ & Act bingo card “Veggie and Fruit Maze” handout
Tasting Opportunities Featured vegetable:
Broccoli
Begin each nutrition education lesson with a short physical activity break from the card set provided by IDPH. Have fun and get active with your students!
Begin each nutrition education lesson with a short physical activity break from the card set provided by IDPH. Have fun and get active with your students!

Page 2 of 5
December Lesson Plan Grades 2-3
sprouting/Italian broccoli (Brassica Oleracea Italica) the most common, and heading broccoli (Brassica Oleracea) which looks like cauliflower. The broccoli we eat is the flower of the broccoli plant. Other vegetables that are flowers include cauliflower and artichokes.
Web Site Resources
www.idph.state.ia.us/pickabettersnack www.fruitsandveggiesmorematters.org www.choosemyplate.gov
Do the Activity:
Review digestion of food: When we eat such things as bread, meat, and vegetables, they are not in a form that the body can use as nourishment. Our food and drink must be changed into smaller molecules of nutrients before they can be absorbed into the blood and carried to cells throughout the body. Digestion is the process by which food and drink are broken down into their smallest parts so that the body can use them to build and nourish cells and to provide energy. Hold up a stalk of broccoli. Discuss what happens to broccoli when we eat it. This is called digestion. (Review only what is appropriate for the age of your students.)
1. Digestion begins in the mouth where the broccoli is chewed and swallowed.
2. Once the broccoli is in the stomach, it mixes with other foods and liquids that you ate with the broccoli. Digestive juices are released and mixed with the food. Your stomach is a very strong muscle!
3. The stomach slowly releases the food mixture into the intestines (like a long, soft tube) where the food is further broken down so our bodies can absorb the nutritious parts of the food such as protein, carbohydrates (starch and sugars), fats, vitamins and minerals.
4. The water, sugar, vitamins C and A, and calcium from the broccoli are absorbed in the small intestine.
5. These nutrients pass through the intestine into the blood and are carried off in the bloodstream to other parts of the body for storage or further chemical change.
6. The leftover fiber from the broccoli would go into the large intestine or colon where it would remain, usually for a day or two, until feces are expelled by a bowel movement.
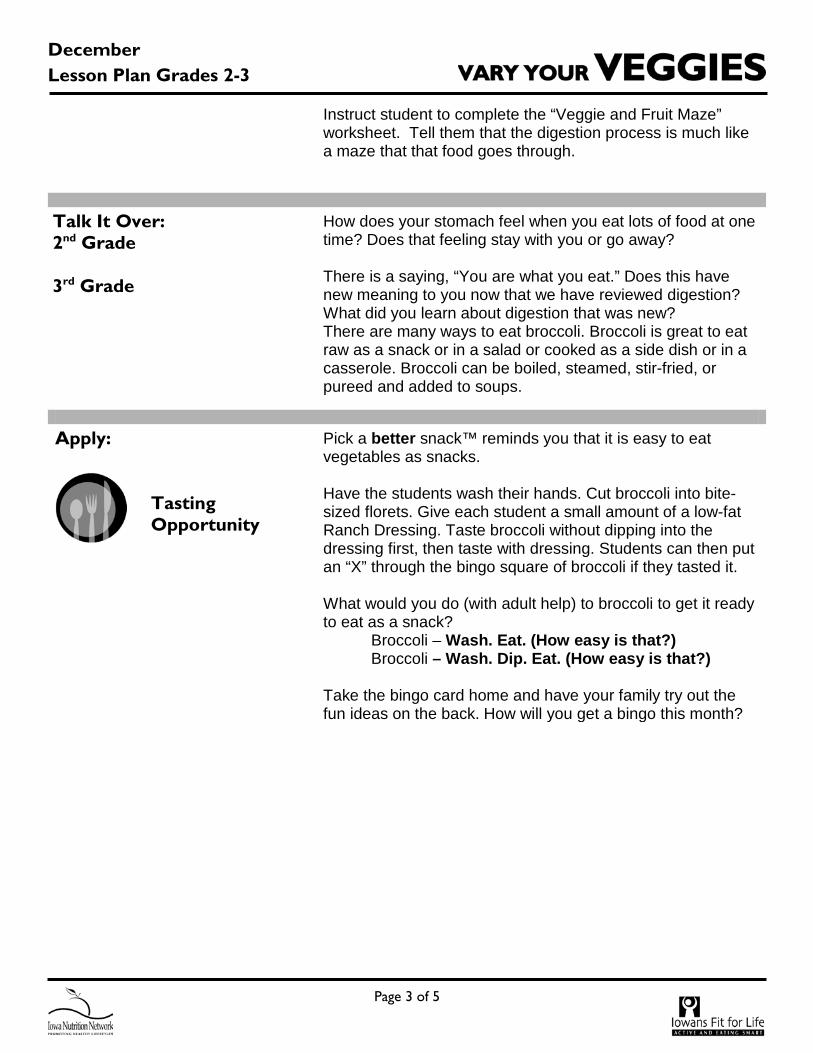
Page 3 of 5
December Lesson Plan Grades 2-3
Instruct student to complete the “Veggie and Fruit Maze” worksheet. Tell them that the digestion process is much like a maze that that food goes through.
Talk It Over: 2nd Grade 3rd Grade
How does your stomach feel when you eat lots of food at one time? Does that feeling stay with you or go away? There is a saying, “You are what you eat.” Does this have new meaning to you now that we have reviewed digestion? What did you learn about digestion that was new? There are many ways to eat broccoli. Broccoli is great to eat raw as a snack or in a salad or cooked as a side dish or in a casserole. Broccoli can be boiled, steamed, stir-fried, or pureed and added to soups.
Apply:
Tasting Opportunity
Pick a better snack™ reminds you that it is easy to eat vegetables as snacks. Have the students wash their hands. Cut broccoli into bite-sized florets. Give each student a small amount of a low-fat Ranch Dressing. Taste broccoli without dipping into the dressing first, then taste with dressing. Students can then put an “X” through the bingo square of broccoli if they tasted it. What would you do (with adult help) to broccoli to get it ready to eat as a snack?
Broccoli – Wash. Eat. (How easy is that?) Broccoli – Wash. Dip. Eat. (How easy is that?)
Take the bingo card home and have your family try out the fun ideas on the back. How will you get a bingo this month?

Page 4 of 5
December Lesson Plan Grades 2-3
Extend the Activity
Art, Music & PE
Invent a winter scene- in forest, in storm, etc. Use real broccoli piece glued to the paper to represent trees and bushes. Modify the lyrics of Kermit the Frog’s song “It’s Good to be Green.” Include all the good qualities of broccoli.
Language Arts & Reading
Write a Haiku (a three line poem consisting of 5-7-5 syllables) about broccoli:
Broccoli has C Italians brought it to us Grow healthy with it.
Research information on broccoli, write a one paragraph article and illustrate. Share with class.
Math
Fact: Over 90% of broccoli is grown in California. Discuss percentages. Cut apart graph paper into 10 x 10 squares. Place 90 of the squares into one pile and 2 in another.
Science & Health
What makes broccoli green? What are some things you can eat with broccoli? How many have you tried? Bring in recipes from home and see how many different ones you can collect. Share with parents.
Social Studies
Ask “Where does broccoli grow?” Mainly California, but is now grown in nearly every other state, including Iowa. Have someone who grows broccoli come in to describe how broccoli is planted, harvested, etc. Contact Master Gardeners through Extension or there are many “truck” gardens around the area. Using scale of miles, use a map to calculate the distance from the capitol of California (Sacramento) to the capitol of Iowa (Des Moines).

Page 5 of 5
December Activity – Grades 2-3
Veggie and Fruit Maze
Parents: MyPlate suggests that children 4 to 8 years old eat 1 to 1½ cups of fruit every day. Go easy on 100% fruit juice; choose whole fruit for more fiber and nutrients. Go to www.choosemyplate.gov for more details.

Classroom Teacher Supplemental Lesson

Nutrition Education Lesson Third Grade (TL-3-1)
Nutrition constructs
This lesson is designed to increase students’ knowledge of the health benefits of fruits and vegetables.
Iowa Core 21st Century Skills (K-2 Financial Literacy) – Understand financial instruments – Distinguish different types of money and the values of each type of money. This lesson also reinforces Iowa Core 2.MD.8 – Solve word problems involving dollar bills, quarters, dimes, nickels and pennies, using $ and cent symbols appropriately.
Supplies needed
Physical Activity Card Set (provided) Optional: grocery store circulars/ads
Time required
20-30 minutes
Before the lesson
Write vitamin C, vitamin A, potassium and fiber on the board or a word wall and review the health benefits of each.
Lesson 1. Begin this lesson by doing a few minutes of physical activity with your students. Choose an activity from the physical activity card set provided. Take the opportunity to remind your students how important it is to be active throughout the day to keep our bodies and minds strong.
2. Write the 5 nutrients below on the board. Tell students that today they’re going to learn about some things we can eat that are good for our bodies.
a. Vitamin C helps our immune system. Does anyone know what the immune system does? It keeps us from getting sick and helps us heal when we get a cut or scratch. It is important to keep your immune system strong. Think of it like a suit of armor! Oranges, peppers, cantaloupe and kiwi have a lot of vitamin C.
b. Vitamin A helps our eyes. Like special, super power glasses, vitamin A protects our eyes and helps us see. Hold your hands up to your eyes and show me your super power glasses. Sweet potatoes, spinach and carrots have a lot of vitamin A.
c. Potassium is important for our hearts. Our hearts pump blood all around our bodies so it is important to keep them strong. Everyone put your hand on your heart and feel it pumping. Bananas and potatoes have a lot of potassium.
d. Fiber keeps us full and helps us digest our food well. Berries, kiwi, crunchy vegetables and beans have a lot of fiber. 3. Describe Anita. Anita is a very smart third grader. She knows that eating healthy will keep her body strong and help her grow. Anita likes to
play soccer and she eats fruits and vegetables because they are good for her body. Tell students their job is to help Anita choose some healthy after-school snacks that contain vitamin C, vitamin A, potassium and fiber.
a. Let’s start with vitamin C. Anita loves sweet bell peppers and they have a lot of vitamin C. The red pepper at the grocery store costs 75 cents. Anita has 5 nickels and 5 dimes; does she have enough money to buy the pepper?
b. Anita needs vitamin A to keep her eyes sharp, she would like to buy a bag of carrots that costs $1.50. Anita has one dollar bill, six nickels and three dimes. Does she have enough money?
c. Potassium will keep Anita’s heart strong while she runs around playing soccer. Bananas have a lot of potassium and a bunch costs 60 cents. Anita has 5 dimes and 4 nickels. Does she have enough money to buy the bananas?
d. Fiber will keep Anita full during practice. Kiwi has a lot of fiber and each one costs about $0.50. Anita has one dollar bill, 4 dimes and 3 nickels. Does she have enough money for 4 kiwi fruits? How much more money does she need?
4. As an optional extension activity, bring in grocery store ads and encourage students to identify fruits and veggies in those ads. Are any of those
good sources of vitamin C, vitamin A, potassium or fiber?

BINGO Card

www.idph.state.ia.us/pickabettersnack
Iowa’s Food Assistance Program provides nutrition assistance to people with low income. It can help you buy nutritious foods for a better diet.
Go to www.yesfood.iowa.gov for more information.
Funded by USDA, an equal opportunity provider and employer, in collaboration with the Iowa Departments of Public Health and Human Services. Iowa Food Assistance can help you buy healthy food. Visit www.yesfood.iowa.gov for more information.
DECEMBER
Pick a better snack™ & Act allows you to enjoy a variety of fruits, vegetables and physical activities. Complete the card by putting an “X” through the squares of fruits, vegetables and physical activities you have tried. A “bingo” is complete when you make a line of X’s diagonally, horizontally, or vertically.
banana
walk play
star fruit play kiwi
tangerine broccoi sweet potato grapefruit
shoot hoops kiwi stretch
familyate a mealtogether
Family Goal Setting Wash and cut veggies every weekend this month and put them in plastic bags for a quick after-school snack. Add something new from time to time like pieces of red bell pepper for a colorful crunch!
tangerine
build
grapefruit
dance
Canned
broccoli
balance jump
skate
hit ball

Eat SMaRt. play haRD.™piCk a BEttER SnaCk. lEt’S MovE!
Broccoli (Wash. Bite. How easy is that?) • Buying: Broccoli is delicious fresh or frozen. Choose fresh broccoli with tight, dark green florets. Stay clear of broccoli with yellow florets. You can save money by buying whole heads of broccoli and cutting them up yourself. Rinse the broccoli under cold water and dry thoroughly. Cut the broccoli into bite-size florets including about 1 inch of stem on each piece. Frozen broccoli tastes great too. Add frozen broccoli to spaghetti sauce or casseroles. It’s an easy way to boost the nutritional value of your family’s favorite dishes.
• Storing: Refrigerate broccoli in a plastic bag or container and use within 3-5 days.
• Enjoying: Make your own dip for broccoli! Buy a small (6 oz) non-fat plain yogurt in the dairy section of your grocery store. Stir in 1⁄3 cup of your favorite salsa. Kiwi (Scoop. Eat. How easy is that?) • Buying: Choose slightly firm kiwi with a rough, fuzzy skin. The soft-ness should be similar to a ripe peach.
• Storing: Store kiwis that aren’t soft yet on the counter until they ripen. You’ll know they’re ripe because they become soft. Store ripe kiwis in plastic bags in the refrigerator for 2 to 4 weeks.
• Enjoying: The easiest way to enjoy kiwi is to cut the kiwi in half. Use a spoon to scoop out the fresh green fruit. How easy it that!
www.idph.state.ia.us/pickabettersnackIn accordance with Federal law and U.S. Department of Agriculture policy, this institution is prohibited from discriminating on the basis of race, color, national origin, sex, age, religion, political beliefs or disability. To file a complaint of discrimination, write USDA, Director, Office of Civil Rights, 1400 Independence Avenue, S. W., Washington, D.C. 20250-9410 or call (800)795-3272 (voice) or (202)720-6382 (TTY). USDA is an equal opportunity provider and employer.
Resource:Is your food budget
tight? Find out if
you qualify for WIC
(Women, Infants and
Children) program at
www.idph.state.ia.us/
wic/families.aspx
naME
SiGnatURE
has played Pick a better snack™ & Act bingo this month.
www.fns.usda.gov/eatsmartplayhardkidsEat Smart. Play Hard. is the United States Department of Agriculture (USDA), Food and Nutrition Service’s (FNS) Campaign to promote healthy eating and encourage physical activity in children and families. Power Panther™ is the messenger for this campaign.
Move IndoorsIt’s officially winter! Check out these ideas for fun ways to get you and your family moving indoors:
• Check out a dance or exercise DVD from your library. Learn hip-hop, belly dancing, kung fu or kick-boxing.
• Play indoor games as a family, such as hide and seek or tag.
• Head to the nearest mall and walk inside. Most malls open doors early just for mall walkers.
• Check out your local high school, YMCA, parks and recreation department or community center to find indoor physical activity classes. Many organizations offer free or low-cost options during evenings and weekends.
• Set a timer and pick up the house in 10 minutes! Get everyone involved. See if you can beat the clock to clean a room in your house.

Family Newsletter

DECEMBERPick a better snack & Act with your family.
Grow Happy Kidsarguing with children is not a favorite among any parents i know. arguments about food and TV time can become tiresome and disrupt the time you have to enjoy with your kids. you can encour-age healthy habits without feeling like the bad guy. it is just as important to encourage and re-ward good choices as it is to discourage bad ones. when children make a healthy choice, make sure they know you are proud of them. a few words of encouragement from you can go a long way.adapted from Massachusetts wiC program, Touching Hearts, Touching Minds.
rECipE To THE rEsCUEHere is another no-recipe meal for a busy week night. Just keep these ingredients on hand and you always know you have what you need to make a healthy meal.
Healthy Pasta in a Hurrywhole wheat pastapurchased tomato sauceFrozen veggies
Heat the sauce in the microwave or on the stove while the pasta boils. Three minutes before the pasta is done, drop in some frozen broccoli, peas, spinach or peppers. you will have a tasty, healthy meal in about 15 minutes.
aCTiVE ToGETHErparents have a remarkable influence on the adults their children become. studies show that kids who are surrounded by people who are physically active are more likely to be active themselves. Even if your family doesn’t have time for organized activities each day, you can still model an active lifestyle. Here are some ideas: •Parkatthebackoftheparkinglot. •Takethestairsatthemall. •Takeawalkafterdinner. •TurnofftheTVafteroneortwoshows. •Makeactivitypartoffamilycelebrations.
spEnd sMarT. EaT sMarT.are you a savvy shopper? Test your shopping skills in the supermarket game!
shopping with an eye on budget and health takes skills. Check out this supermarket game on the spend smart Eat smart website and put your skills to the test. Throughout the game you’ll get tips to help you become a savvy shopper.
http://www.extension.iastate.edu/foodsavings/shop/shoppingskills/
Visit our website at www.idph.state.ia.us/pickabettersnack Funded by Usda’s snap-Ed program, an equal opportunity provider and employer, in collaboration with the iowa dept. of public Health. iowa’s Food assistance program provides nutrition assistance to people with low income. it can help you buy nutritious foods for a better diet. Go to www.yesfood.iowa.gov for more information.
❆ ❆

BASICS Nutrition and Physical Activity Program INN ● Program Evaluation
B.4. Detailed Description of Social Marketing Campaign

Hradek, 1-Aug-12
Iowa Nutrition Network Wave 2 Demonstration Project Social Marketing Details Youth-Specific Goals 1. Children will choose to eat fruits and vegetables for snacks. 2. Children will choose to consume milk and milk products at meals and snacks, choosing low-fat or fat-free most often. Parent-Specific Goals 1. Model positive fruit and vegetable behaviors. 2. Offer fruits and vegetables to their child at meals and snacks. 3. Model positive milk behaviors. 4. Purchase and offer fat-free or low-fat milk and milk products for their family.
Channel or Venue Description
Placement Reach Key Messages Materials Used Relevant Project Goals
Point-of Purchase Intervention • 6 SNAP-Ed qualified
retail grocery stores • 2 demonstrations per
month for seven months coordinated to classroom tastings
• Signage in milk and produce departments for 7 months with refreshed signage available in March 2012
• November 2011 through May 15, 2012
• Demonstrations 2 times per month during the first week of each month (one week day, one weekend)
• Stores selected based on high-volume SNAP redemption and proximity to Wave 2 school sites.
• 10,764 individuals received a food tasting.
• Average of 1,537 people per month for 7 months
• Pick a better snackTM & Act. How easy is that?
• PABS sub-messages such as Wash. Bite., Peel. Eat., Dip. Eat. How easy is that?
• Their bodies change. So should their milk.
• Pull-up banners featuring imagery from PABS and Bodies Change.
• Recipe cards • Tip sheets (many from
USDA 10 Tips series) • Preparation directions for
select produce items • Nutrition facts label
comparisons for different types of milk
Youth-Specific Goals • Children will choose fruits and
vegetables for snacks. • Children will choose milk and milk
products at meals and snacks, choosing low-fat or fat-free most often.
Parent-Specific Goals • Model positive fruit and vegetable
behaviors. • Offer fruits and vegetables to their
child at meals and snacks. • Model positive milk behaviors. • Purchase and offer fat-free or low-fat
milk and milk products for their family.

Hradek, 1-Aug-12
Channel or Venue Description
Placement Reach Key Messages Materials Used Relevant Project Goals
Billboards • 14 billboards
featuring campaign messages and imagery
• All boards in SNAP-Ed qualified, low-income census tracts
• Each billboard’s placement period was approximately 4 weeks.
• Boards are placed in waves beginning March 1 and boards were placed through April, at minimum, added value may continue beyond May 1st.
• Creative change halfway through placement – each board will start with Pick a better snackTM & Act or Bodies Change and around April 1st the content will switch to the other campaign.
• Boards selected based on proximity to Wave 2 schools, major thoroughfares and presence in low-income census tracts per SNAP-Ed Guidance.
• 279,744 impressions among women age 18-34.
• 5,589,428 impressions among adults over the age of 18
• Pick a better snackTM & Act. How easy is that?
• PABS sub-messages such as Wash. Bite., Peel. Eat. Dip. Eat. How easy is that?
• Their bodies change. So should their milk.
• Billboards featuring messages from PABS and Bodies Change.
Youth-Specific Goals • Children will choose fruits and
vegetables for snacks.
Parent-Specific Goals • Offer fruits and vegetables to their
child at meals and snacks. • Purchase and offer fat-free or low-fat
milk and milk products for their family.

Hradek, 1-Aug-12
Channel or Venue Description
Placement Reach Key Messages Materials Used Relevant Project Goals
Bus Shelters • 7 shelters serving
passengers on Des Moines Area Rapid Transit bus lines.
• All shelters in SNAP-Ed qualified, low-income census tracts
• March through May 1st.
• Creative will change halfway through placement – each shelter will start with Pick a better snackTM & Act or Bodies Change and around April 1st the content will switch to the other campaign.
• Locations selected based on proximity to Wave 2 schools, major thoroughfares and presence in low-income census tracts per SNAP-Ed Guidance.
• Impressions data not available, but 15,000 people ride Des Moines Area Regional Transit busses per day.
• Pick a better snackTM & Act. How easy is that?
• Their bodies change. So should their milk.
• Pick a better snackTM & Act sub-messages such as Wash. Bite., Peel. Eat. Dip. eat. How easy is that?
• Shelter signage featuring messages from Pick a better snackTM & Act and Bodies Change (same content as billboards).
• Parent-Specific Goals • Model positive fruit and vegetable
behaviors. • Offer fruits and vegetables to their
child at meals and snacks. • Purchase and offer fat-free or low-fat
milk and milk products for their family. • *These are not in locations where
children are likely to see them.

Hradek, 1-Aug-12
Channel or Venue Description
Placement Reach Key Messages Materials Used Relevant Project Goals
Television • Pick a better
snackTM & Act and Bodies Change spots on 5 stations with viewers in our target demographic.
• Pick a better snackTM & Act spots are 15 seconds, Bodies Change spots are 30 seconds
• March 5-19 • April 2-16 • Stations and
airtimes selected based on Nielsen ratings and Scarborough data. Chose highly-rated networks for women 18-34 with a household income of less than $30,000/year.
• PABS - 302,493 impressions among women 18-34. 1,008 paid spots. 849,046 total impressions among individuals age 2 and over.
• Milk - 193,696 impressions among women 18-34. 672 paid spots. 584,460 total impressions among individuals age 2 and over.
• Up to 100% added value in un-paid spots which are not included in impressions data.
• Pick a better snackTM & Act. How easy is that?
• Kids are hungry when they get home from school, leave them a healthy snack.
• Their bodies change. So should their milk.
• 1% and fat-free milk have the same nutrients with less fat. 1% and fat-free milk are the best choices for kids age two and older.
• Pick a better snackTM & Act ads each featuring a different child and a different fruit or vegetable.
• One Bodies Change ad showing a child age through pictures and ending with the campaign message.
Youth-Specific Goals • Children will choose fruits and
vegetables for snacks.
Parent-Specific Goals • Offer fruits and vegetables to their
child at meals and snacks • Purchase and offer fat-free or low-fat
milk and milk products for their family.

Hradek, 1-Aug-12
Channel or Venue Description
Placement Reach Key Messages Materials Used Relevant Project Goals
Radio • Pick a better
snackTM & Act and Bodies Change spots on three radio stations with listeners in our target demographic.
• Spots split evenly between the two campaigns.
• 536 across the three stations averaging 36 spots per week per station.
• April 1st through May 7th.
• The top 2 rated stations for women 18-34 were purchased. Spots aired during dayparts that low-income mothers are most apt to listen based on Arbitron and Scanborough data. Also purchased time on a station with extensive reach to African American women.
• PABS – 243,476 impressions among women 18-34. 268 paid spots. 1,029, 310 total impressions among persons age 12 and up.
• Milk – 243,476 impressions among women 18-34. 268 paid spots. 975,136 total impressions among people age 12 and up.
• Up to 100% added value in unpaid spots which are not included in impressions data.
• Wash. Bite. How easy is that?
• 1% and fat-free milk have the same nutrients with less fat. 1% and fat-free milk are the best choices for kids age two and older.
• One radio ad for each campaign.
Youth-Specific Goals • Children will choose fruits and
vegetables for snacks.
Parent-Specific Goals • Offer fruits and vegetables to their
child at meals and snacks. • Purchase and offer fat-free or low-fat
milk and milk products for their family.

Hradek, 1-Aug-12
Channel or Venue Description
Placement Reach Key Messages Materials Used Relevant Project Goals
• Family Nights Out • 11 events, 1 at each
school involved in the study.
• Purpose is to provide families with hands-on, fun nutrition and physical activity education as well as resources to help them develop healthy habits.
• Stations o Pictionary on
MyPlate o Shopping Smart o Physical Activity o Blind Milk Taste
Test o Pledge Wall
• 3/6 • 3/8 • 3/12 • 3/13 • 3/27 • 3/29 • 4/3 • 4/5 • 4/9 • 4/10 • 4/12
• 595 • 382 children, 213
adults
• Pick a better snackTM & Act. How easy is that?
• Pick a better snackTM & Act sub-messages such as Wash. Bite., Peel. Eat. Dip. Eat. How easy is that?
• Their bodies change. So should their milk.
• Adding fruits and veggies to meals can be easy and affordable.
• Pull-up banners and posters featuring imagery from Pick a better snackTM & Act and Bodies Change.
• Recipe cards • Tip sheets (many from
USDA 10 Tips series) • Preparation directions for
select produce items • Nutrition facts label
comparisons for different types of milk
Youth-Specific Goals • Children will choose fruits and
vegetables for snacks. • Children will choose milk and milk
products at meals and snacks, choosing low-fat or fat-free most often.
Parent-Specific Goals • Model positive fruit and vegetable
behaviors. • Offer fruits and vegetables to their
child at meals and snacks. • Model positive milk behaviors. • Purchase and offer fat-free or low-fat
milk and milk products for their
Earned Media 1 Two-minute, on-air interview and snack preparation on KCCI evening news. *highest rated evening news in Des Moines metro area.
• 73,098 persons age 2 and over.
• Pick a better snackTM & Act sub-messages such as Wash. Bite., Peel. Eat. Dip. Eat. How easy is that?
• Want your kids to reach for a healthy snack? Make sure fruits and veggies are in reach (introduced concept of a snack bowl).
• Pick a better snackTM & Act logo apron
Parent-Specific Goals • Offer fruits, vegetables and low-fat
dairy products to their child at meals and snacks.

Hradek, 1-Aug-12
Channel or Venue Description
Placement Reach Key Messages Materials Used Relevant Project Goals
Earned Media 2 Four-minute on-air interview on STAR 102.5 radio followed by participation in the STAR 102.5 family night out at a local mall.
• 4,000 persons age 12 and up reached during on-air interview (Arbitron data)
• 300 persons reached during family night out event.
• Pick a better snackTM & Act. How easy is that?
• Pick a better snackTM & Act sub-messages such as Wash. Bite., Peel. Eat. Dip. Eat. How easy is that?
• Their bodies change. So should their milk.
• Adding fruits and veggies to meals can be easy and affordable.
• Pull-up banners featuring imagery from Pick a better snackTM & Act and Bodies Change.
• Recipe cards • Tip sheets (many from
USDA 10 Tips series) • Preparation directions for
select produce items • Nutrition facts label
comparisons for different types of milk
Youth-Specific Goals • Children will choose fruits and
vegetables for snacks. • Children will choose milk and milk
products at meals and snacks, choosing low-fat or fat-free most often.
Parent-Specific Goals • Model positive fruit and vegetable
behaviors. • Offer fruits and vegetables to their
child at meals and snacks. • Model positive milk behaviors. • Purchase and offer fat-free or low-fat
milk and milk products for their

BASICS Nutrition and Physical Activity Program INN ● Program Evaluation
B.5. Pick a Better Snack Social Marketing Campaign Materials * *A sample of the materials used. Additional materials can be found on the Iowa Nutrition Network
website http://www.idph.state.ia.us/INN/PickABetterSnack.aspx

Retail Store Signage

Billboards

Retail Store Demonstration

Television Advertisement Script: Carrot
TV 15s
A KID COMES HOME FROM SCHOOL. HE PUTS HIS BAG DOWN AND OPENS THE
FRIDGE DOOR. THE CARROT LEANS IN WITH HIM AND BITES A CARROT. THE KID
SEES HIM AND CLOSES THE DOOR. THE CARROT OFFERS THE KID A PLATE OF
CARROTS. THE KID TAKES ONE AND BITES IT.
[VO] Your kids are hungry when they get home from school. So set out a healthy
snack. Because if they see it they’ll eat it.
PABS AND SUPPORTING LOGOS

Radio Advertisement Script
Wash and Bite
SFX OF A HOUSE DOOR CLOSING. THUMP OF A BOOK BAG HITTING THE FLOOR.
MOM Hey hun! How was your day at school?
MATT Fine.
MOM Did you learn anything new?
MATT Just wash, bite.
MOM Oh yeah! What subject is that? And what is wash, bite?
MATT It’s not a subject mom, it’s just snacking. Mrs. Rumsfield was teaching us
easy ways to snack. All you have to do is, wash and bite.
MOM Ok, what do you have to wash and bite?
MATT Well, fruits and vegetables like carrots, apples, grapes or peppers. Which
reminds me, do we have any carrots in the fridge? Because I need something tasty.
SFX OF A FRIDGE DOOR OPENING
MOM Take a look, I think we have some in the bottom drawer. Why were they
teaching you about wash and bite?
MATT Well our teachers want us to know how important it is to snack healthy.
So they let us try it out for ourselves. We learned that it’s as simple as wash and bite.
SFX OF RUNNING WATER AND THE BITING OF A CARROT.
VO Make after school snacking simple, by stocking up on snacks that will
keep your kids healthy and happy. This message was brought to you by the USDA and the
Wellmark Foundation.

BASICS Nutrition and Physical Activity Program INN ● Program Evaluation
B.6. Their Bodies Change Social Marketing Campaign Materials * *A Sample of the materials used. Additional materials can be found on the Iowa Nutrition Network
website http://www.idph.state.ia.us/INN/LowFatMilk.aspx

Retail Store Signage

Billboards

Television Advertisement Script
“Never Outgrow”
:30 TV
MUSIC: SENTIMENTAL YET UPBEAT -- CAN’T USE THE WORDS OF COURSE, BUT
HERE IS THE FEEL: “RETURN TO POOH CORNER, KENNY LOGGINS.” SIMPLE
ACOUSTIC WOULD PROBABLY WORK WELL HERE.
WE SEE PHOTOS OF ONE CHILD GROWING UP THROUGH PICTURES (SAMPLE
DESCRIPTIONS FOLLOW):
A SERIES OF PHOTOS OF AN ACTIVE INFANT. CRAWLING, TRYING TO STAND UP
ON OWN FEET.
A FOUR-YEAR-OLD AT HIS BIRTHDAY PARTY.
A SIX-YEAR-OLD DURING HALLOWEEN.
AN EIGHT-YEAR-OLD PLAYING THE DRUMS.
A TEN-YEAR-OLD MUGGING FOR THE CAMERA WITH HIS/HER BEST FRIEND.
VO: Whole milk gives your baby the nutrition they need to be healthy. As they grow up, their
bodies still need the nutrition. Just not the extra fat. So for children age two or older…
BEAUTY SHOT OF MILK BEING POURED INTO A GLASS IN SLO MO.
VO: … serving them one percent or fat free milk gives them the same calcium. With less fat
and calories.
A TWELVE-YEAR-OLD HOLDING THE FIRST PHOTO OF THE INFANT HE ONCE WAS.
VO: It’s the milk they’ll never outgrow.
SUPER: THEIR BODIES CHANGE SO SHOULD THEIR MILK

Radio Advertisement Script
“Grow up fast”
:60 Radio
(SEE NOTE ON TV – MAYBE USE THAT MUSIC HERE. OR POSSIBLY NO MUSIC.)
(Kids at various ages asking for something from mother. Their voices change, mature. )
INFANT: Momma, mommmmmm-ma.
ANNCR: Whole milk gives your baby the nutrition they need to be healthy. But as babies
grow up…
TWO: Mom, can I go to Billy’s house and play?
ANNCR: … their bodies change. Sure, they still need the nutrition whole milk gives them.
Just not the fat.
FOUR: Mom, can I go to the park? Can I please.
ANNCR: For children over the age of two, serving them one percent or fat free milk
provides them with the same calcium. Just with less fat.
SIX: Mom, do I have to go to school?
ANNCR: Switching to one percent or fat free milk could also save your children from 150
unnecessary calories every day.
TEN: Mom, can I do a sleep over at Jakes house?
ANNCR: So at every meal, serve your kids one percent or fat free milk. It’s the milk they’ll
never outgrow. No matter how fast they grow up.
TWELVE: Mom, can I borrow the car?
MOM: You’re twelve.
TWELVE: Doesn’t hurt to try.
ANNCR: This message was brought to you by the USDA and the Wellmark Foundation.

Appendix C
Parent Survey Instruments

BASICS Nutrition and Physical Activity Program INN ● Program Evaluation
List of Contents
C.1: Baseline Survey, Intervention and Comparison Groups
C.2: Follow-Up Survey, Intervention Group
C.3: Follow-Up Survey, Comparison Group

BASICS Nutrition and Physical Activity Program INN ● Program Evaluation
C.1: Baseline Survey, Intervention and Comparison Groups*
*Cups of fruits and vegetables graphics courtesy of Dr. Marilyn Townsend and Kathryn
Sylva, University of California, Davis.


OMB No. 0584-0554
Expiration date: 6/30/2014
See OMB statement on inside cover
Thank you for taking part in this important study!
Please fill out and return the survey to RTI in the enclosed envelope
within the next week.
If you have any questions about the What Does Your Child Eat? study, please send an
e-mail to [email protected] or call toll-free at 1-866-800-9176.
Put label here

Public reporting burden for this collection of information is estimated to average 15 minutes per response, including the time for reviewing instructions, searching existing data sources, gathering and maintaining the data needed, and completing and reviewing the collection of information. An agency may not conduct or sponsor, and a person is not required to respond to, a collection of information unless it displays a currently valid OMB Comparison number. Send comments regarding this burden estimate or any other aspect of this collection of information, including suggestions for reducing this burden, to: U.S. Department of Agriculture, Food and Nutrition Services, Office of Research and Analysis, Room 1014, Alexandria, VA 22302 ATTN: PRA (0584-0554). Do not return the completed form to this address. If you have questions regarding your rights as a research participant, you may contact RTI’s Office of Research Protection toll-free at 866-214-2043.

1
This survey asks about what your child eats. This study is being sponsored by the U.S.
Department of Agriculture’s Food and Nutrition Service and conducted by RTI International, a
nonprofit research organization. The survey will take about 15 minutes to fill out. You will
receive $10 for filling out this survey and $15 for filling out a second survey that we will mail
to you in about 9 months.
All of your answers to the survey will be kept private. We will not share your answers with
anyone, except as otherwise required by law. You may skip any questions you do not want to
answer. If you have any questions, please call Brian Head at RTI at 1-866-800-9176.
Questions on Whether Certain Foods Are Available at Home
1. Were any of these foods in your home during the past week? Include fresh, frozen,
canned, and dried foods. (Circle Yes or No for each food.)
a. Bananas Yes No
b. Apples Yes No
c. Grapes Yes No
d. Raisins Yes No
e. Pears Yes No
f. Celery Yes No
g. Carrots Yes No
h. Cucumbers Yes No
i. Broccoli Yes No
j. Zucchini Yes No
k. Potato chips, tortilla chips, corn chips, or other chips Yes No
l. Regular soft drinks or sodas Yes No
Questions on the Fruits and Vegetables Your Child Eats
For the next questions, think about what your child ate during the past week, or the past 7
days. Do NOT include food eaten at school, before/after school care, or day care.
2. How many days during the past week did your child eat more than one kind of fruit each
day? Do NOT include fruit juice. (Circle one.)
1. None
2. 1 to 2 days
3. 3 to 4 days
4. 5 to 6 days
5. Every day

2
3. Think about what your child ate during the past week. About how many cups of fruit did
your child eat on a typical day? Do NOT include fruit juice. (Circle one.)
1. None
2. ½ cup
3. 1 cup
4. 1 ½ cups
5. 2 cups None 1 cup 2 cups 3 cups
6. 2 ½ cups
7. 3 cups or more
4. How many days during the past week did your child eat more than one kind of vegetable
each day? Do NOT include white potatoes, French fries, or vegetable juice. (Circle one.)
1. None
2. 1 to 2 days
3. 3 to 4 days
4. 5 to 6 days
5. Every day
5. Think about what your child ate during the past week. About how many cups of
vegetables did your child eat on a typical day? Do NOT include white potatoes, French
fries, or vegetable juice. (Circle one.)
1. None
2. ½ cup
3. 1 cup
4. 1 ½ cups
5. 2 cups None 1 cup 2 cups 3 cups
6. 2 ½ cups
7. 3 cups or more
6. During the past week, did your child eat any meals or snacks that were provided by
his/her school, before school care program, after school care program, or day care?
(Circle all that apply.)
1. No, did not eat breakfast, lunch, or snacks provided by school, before or after school
care program, or day care
2. Yes, breakfast
3. Yes, lunch
4. Yes, snacks

3
7. Is your child willing to try a new kind of fruit? Do NOT include fruit juice. (Circle one.)
1. No
2. Maybe
3. Yes
8. How many days during the past week did you give your child fruit for a snack? Do NOT
include fruit juice. (Circle one.)
1. None
2. 1 to 2 days
3. 3 to 4 days
4. 5 to 6 days
5. Every day
9. How many days during the past week did you give your child fruit at dinner? Do NOT
include fruit juice. (Circle one.)
1. None
2. 1 to 2 days
3. 3 to 4 days
4. 5 to 6 days
5. Every day
10. Is your child willing to try a new kind of vegetable? (Circle one.)
1. No
2. Maybe
3. Yes
11. How many days during the past week did you give your child a vegetable for a snack?
Do NOT include white potatoes, French fries, or vegetable juice. (Circle one.)
1. None
2. 1 to 2 days
3. 3 to 4 days
4. 5 to 6 days
5. Every day

4
12. How many days during the past week did you give your child a vegetable at dinner? Do
NOT include white potatoes, French fries, or vegetable juice. (Circle one.)
1. None
2. 1 to 2 days
3. 3 to 4 days
4. 5 to 6 days
5. Every day
Questions on Milk
13. Did your child drink milk or use milk on his/her cereal at home during the past week?
(Circle one.)
1. No [Go to Question 17]
2. Yes
14. What kind of milk did your child most often drink or use on his/her cereal at home
during the past week? (Circle only one. If your child drinks more than one type of milk,
circle the type he/she drinks most often.)
1. Whole milk
2. 2% milk, also called reduced-fat milk
3. 1% milk, also called low-fat milk
4. Skim milk, also called fat-free milk
5. Other type of milk, such as soy, almond, or rice milk
15. How many days during the past week did you give your child milk to drink at dinner?
(Circle one.)
1. None
2. 1 to 2 days
3. 3 to 4 days
4. 5 to 6 days
5. Every day
16. Which one of these statements best describes how you feel about the milk you give your
third-grade child? (Circle one.)
1. I believe that whole milk is healthier for my child than 1% or skim milk.
2. I believe that 1% or skim milk is healthier for my child than whole milk.
3. I believe that whole milk and 1% or skim milk are equally healthy for my child.

5
Questions on Shopping and Eating Habits
17. How strongly do you agree or disagree with each of these statements? (Circle one for
each statement.)
a. It is easy to buy fresh fruits or
vegetables where I live.
Strongly
agree Agree Disagree
Strongly
disagree
b. There is a large selection of fresh fruits
or vegetables available where I live.
Strongly
agree Agree Disagree
Strongly
disagree
c. I do not usually buy fresh fruits or
vegetables because they spoil quickly.
Strongly
agree Agree Disagree
Strongly
disagree
d. I can afford fruits or vegetables in the
store where I shop for most of my
food.
Strongly
agree Agree Disagree
Strongly
disagree
e. I can encourage my child to try new
fruits or vegetables.
Strongly
agree Agree Disagree
Strongly
disagree
f. I usually drink 1% or skim milk. Strongly agree
Agree Disagree Strongly disagree
18. During the past month, how often did your child ask you to buy a certain type of fruit?
(Circle one.)
1. Never
2. Seldom
3. Sometimes
4. Often
5. Always
19. During the past month, how often did your child ask you to buy a certain type of
vegetable? (Circle one.)
1. Never
2. Seldom
3. Sometimes
4. Often
5. Always
20. How many days during the past week did you and your child sit down to eat dinner as a
family? (Circle one.)
1. None
2. 1 to 2 days
3. 3 to 4 days
4. 5 to 6 days
5. Every day

6
21. How many days during the past week did your child eat dinner with the TV on? (Circle
one.)
1. None
2. 1 to 2 days
3. 3 to 4 days
4. 5 to 6 days
5. Every day
22. How many days during the past week did you eat fruit for a snack? Do NOT include fruit
juice. (Circle one.)
1. None
2. 1 to 2 days
3. 3 to 4 days
4. 5 to 6 days
5. Every day
23. How many days during the past week did you eat vegetables for a snack? Do NOT
include white potatoes, French fries, or vegetable juice. (Circle one.)
1. None
2. 1 to 2 days
3. 3 to 4 days
4. 5 to 6 days
5. Every day
Questions about You and Your Household
24. Does anyone in your household currently get Food Stamps or EBT benefits? (Circle one.)
1. No
2. Yes
25. Does anyone in your household currently get Women, Infants, and Children (WIC)
program benefits? (Circle one.)
1. No
2. Yes
26. How many people under 18 years of age live in your household? (Circle one.)
1. One
2. Two
3. Three
4. Four
5. Five
6. Six
7. Seven
8. Eight
9. Nine
10. Ten or more

7
27. Including yourself, how many people 18 years of age or older live in your household?
(Circle one.)
1. One
2. Two
3. Three
4. Four
5. Five
6. Six
7. Seven
8. Eight
9. Nine
10. Ten or more
28. What is your age? (Circle one.)
1. 18 to 24
2. 25 to 34
3. 35 to 44
4. 45 to 54
5. 55 to 64
6. 65 to 74
7. Over 74
29. What is your gender? (Circle one.)
1. Male
2. Female
Please answer the next two questions about your ethnicity and race.
30. Are you Hispanic or Latino? (Circle one.)
1. Hispanic or Latino
2. Not Hispanic or Latino
31. What is your race? (Circle one or more.)
1. American Indian or Alaska Native
2. Asian
3. Black or African American
4. Native Hawaiian or other Pacific Islander
5. White
32. Does your family speak English at home? (Circle one.)
1. We speak English all of the time at home.
2. We speak English some of the time at home and speak another language some of
the time.
3. We never speak English at home. We speak another language.

8
33. In what month was the child who is participating in the “What Does Your Child Eat”
study born? (Circle one.)
1. January
2. February
3. March
4. April
5. May
6. June
7. July
8. August
9. September
10. October
11. November
12. December
34. In what year was the child who is participating in the “What Does Your Child Eat” study
born? (Circle one.)
1. 2000
2. 2001
3. 2002
4. 2003
5. 2004
35. Do you have any other children attending the same school as the child who is
participating in the “What Does Your Child Eat” study? (Circle one.)
1. No
2. Yes
Thank you for completing our survey.
Please return the survey to RTI in the enclosed envelope.
If you have misplaced the envelope, call 1-866-800-9176
for a replacement or mail the survey to
RTI INTERNATIONAL
ATTN: Data Capture (0212343.001.008.002)
PO Box 12194
Research Triangle Park, NC 27709-9779
Do NOT return the survey to your child’s school.
Please send the Contact Card to your child’s school.

BASICS Nutrition and Physical Activity Program INN ● Program Evaluation
C.2: Follow-Up Survey, Intervention Group*
*Cups of fruits and vegetables graphics courtesy of Dr. Marilyn Townsend and Kathryn
Sylva, University of California, Davis.


OMB No. 0584-0554
Expiration date: 6/30/2014
See OMB statement on inside cover
Thank you for taking part in this important study!
Please fill out and return the survey in the enclosed envelope within the next week.
If you have any questions about the What Does Your Child Eat? study, please send an
e-mail to [email protected] or call toll-free at 1-866-800-9176.
Put label here

Public reporting burden for this collection of information is estimated to average 15 minutes per response, including the time for reviewing instructions, searching existing data sources, gathering and maintaining the data needed, and completing and reviewing the collection of information. An agency may not conduct or sponsor, and a person is not required to respond to, a collection of information unless it displays a currently valid OMB Comparison number. Send comments regarding this burden estimate or any other aspect of this collection of information, including suggestions for reducing this burden, to: U.S. Department of Agriculture, Food and Nutrition Services, Office of Research and Analysis, Room 1014, Alexandria, VA 22302 ATTN: PRA (0584-0554). Do not return the completed form to this address. If you have questions regarding your rights as a research participant, you may contact RTI’s Office of Research Protection toll-free at 866-214-2043.

1
This survey asks about what your child eats. You may recall that we asked some of the same
questions in the last survey. This study is being sponsored by the U.S. Department of
Agriculture’s Food and Nutrition Service and conducted by RTI International, a nonprofit
research organization. The survey will take about 15 minutes to complete. You will receive
$15 for completing this survey.
All of your answers to the survey will be kept private. We will not share your answers with
anyone, except as otherwise required by law. You may skip any questions you do not want to
answer. If you have any questions, please call Brian Head at RTI at 1-866-800-9176.
Questions on Whether Certain Foods Are Available at Home
1. Were any of these foods in your home during the past week? Include fresh, frozen,
canned, and dried foods. (Circle Yes or No for each food.)
a. Bananas Yes No
b. Apples Yes No
c. Grapes Yes No
d. Raisins Yes No
e. Pears Yes No
f. Celery Yes No
g. Carrots Yes No
h. Cucumbers Yes No
i. Broccoli Yes No
j. Zucchini Yes No
k. Potato chips, tortilla chips, corn chips, or other chips Yes No
l. Regular soft drinks or sodas Yes No
Questions on the Fruits and Vegetables Your Child Eats
For the next questions, think about what your child ate during the past week, or the past
7 days. Do NOT include food eaten at school, before/after school care, or day care.
2. How many days during the past week did your child eat more than one kind of fruit each
day? Do NOT include fruit juice. (Circle one.)
1. None
2. 1 to 2 days
3. 3 to 4 days
4. 5 to 6 days
5. Every day

2
3. Think about what your child ate during the past week. About how many cups of fruit did
your child eat on a typical day? Do NOT include fruit juice. (Circle one.)
1. None
2. ½ cup
3. 1 cup
4. 1 ½ cups
5. 2 cups None 1 cup 2 cups 3 cups
6. 2 ½ cups
7. 3 cups or more
4. How many days during the past week did your child eat more than one kind of vegetable
each day? Do NOT include white potatoes, French fries, or vegetable juice. (Circle one.)
1. None
2. 1 to 2 days
3. 3 to 4 days
4. 5 to 6 days
5. Every day
5. Think about what your child ate during the past week. About how many cups of
vegetables did your child eat on a typical day? Do NOT include white potatoes, French
fries, or vegetable juice. (Circle one.)
1. None
2. ½ cup
3. 1 cup
4. 1 ½ cups
5. 2 cups None 1 cup 2 cups 3 cups
6. 2 ½ cups
7. 3 cups or more
6. During the past week, did your child eat any meals or snacks that were provided by
his/her school, before school care program, after school care program, or day care?
(Circle all that apply.)
1. No, did not eat breakfast, lunch, or snacks provided by school, before or after school
care program, or day care
2. Yes, breakfast
3. Yes, lunch
4. Yes, snacks

3
7. Is your child willing to try a new kind of fruit? Do NOT include fruit juice. (Circle one.)
1. No
2. Maybe
3. Yes
8. How many days during the past week did you give your child fruit for a snack? Do NOT
include fruit juice. (Circle one.)
1. None
2. 1 to 2 days
3. 3 to 4 days
4. 5 to 6 days
5. Every day
9. How many days during the past week did you give your child fruit at dinner? Do NOT
include fruit juice. (Circle one.)
1. None
2. 1 to 2 days
3. 3 to 4 days
4. 5 to 6 days
5. Every day
10. Is your child willing to try a new kind of vegetable? (Circle one.)
1. No
2. Maybe
3. Yes
11. How many days during the past week did you give your child a vegetable for a snack?
Do NOT include white potatoes, French fries, or vegetable juice. (Circle one.)
1. None
2. 1 to 2 days
3. 3 to 4 days
4. 5 to 6 days
5. Every day

4
12. How many days during the past week did you give your child a vegetable at dinner? Do
NOT include white potatoes, French fries, or vegetable juice. (Circle one.)
1. None
2. 1 to 2 days
3. 3 to 4 days
4. 5 to 6 days
5. Every day
Questions on Milk
13. Did your child drink milk or use milk on his/her cereal at home during the past week?
(Circle one.)
1. No [Go to Question 17]
2. Yes
14. What kind of milk did your child most often drink or use on his/her cereal at home
during the past week? (Circle only one. If your child drinks more than one type of milk,
circle the type he/she drinks most often.)
1. Whole milk
2. 2% milk, also called reduced-fat milk
3. 1% milk, also called low-fat milk
4. Skim milk, also called fat-free milk
5. Other type of milk, such as soy, almond, or rice milk
15. How many days during the past week did you give your child milk to drink at dinner?
(Circle one.)
1. None
2. 1 to 2 days
3. 3 to 4 days
4. 5 to 6 days
5. Every day
16. Which one of these statements best describes how you feel about the milk you give your
third-grade child? (Circle one.)
1. I believe that whole milk is healthier for my child than 1% or skim milk.
2. I believe that 1% or skim milk is healthier for my child than whole milk.
3. I believe that whole milk and 1% or skim milk are equally healthy for my child.

5
Questions on Shopping and Eating Habits
17. How strongly do you agree or disagree with each of these statements? (Circle one for
each statement.)
a. It is easy to buy fresh fruits or
vegetables where I live.
Strongly
agree Agree Disagree
Strongly
disagree
b. There is a large selection of fresh fruits
or vegetables available where I live.
Strongly
agree Agree Disagree
Strongly
disagree
c. I do not usually buy fresh fruits or
vegetables because they spoil quickly.
Strongly
agree Agree Disagree
Strongly
disagree
d. I can afford fruits or vegetables in the
store where I shop for most of my
food.
Strongly
agree Agree Disagree
Strongly
disagree
e. I can encourage my child to try new
fruits or vegetables.
Strongly
agree Agree Disagree
Strongly
disagree
f. I usually drink 1% or skim milk. Strongly agree
Agree Disagree Strongly disagree
18. During the past month, how often did your child ask you to buy a certain type of fruit?
(Circle one.)
1. Never
2. Seldom
3. Sometimes
4. Often
5. Always
19. During the past month, how often did your child ask you to buy a certain type of
vegetable? (Circle one.)
1. Never
2. Seldom
3. Sometimes
4. Often
5. Always
20. How many days during the past week did you and your child sit down to eat dinner as a
family? (Circle one.)
1. None
2. 1 to 2 days
3. 3 to 4 days
4. 5 to 6 days
5. Every day

6
21. How many days during the past week did your child eat dinner with the TV on? (Circle
one.)
1. None
2. 1 to 2 days
3. 3 to 4 days
4. 5 to 6 days
5. Every day
22. How many days during the past week did you eat fruit for a snack? Do NOT include fruit
juice. (Circle one.)
1. None
2. 1 to 2 days
3. 3 to 4 days
4. 5 to 6 days
5. Every day
23. How many days during the past week did you eat vegetables for a snack? Do NOT
include white potatoes, French fries, or vegetable juice. (Circle one.)
1. None
2. 1 to 2 days
3. 3 to 4 days
4. 5 to 6 days
5. Every day
Questions on Nutrition Education Materials Your Child Got at School
24. Did the child participating in the “What Does Your Child Eat Study” change schools
during the school year?
1. No [Go to Question 26]
2. Yes
25. What is the name of your child’s new school and the county in which it is located?
School name: __________________________________________________________
County: _______________________________________________________________

7
26. Your child’s teacher sent home a sheet called “BE A MILK SUPERSTAR!!” The sheet
asked you and your child to track each time a family member had milk. Did you or
someone else in your household do the sheet with your child? (Circle one.)
1. Did not get sheet
2. No
3. Yes
27. During the school year, your child’s teacher sent home bingo cards once a month with
pictures of fruits and vegetables and children being active. How many months did your
child eat the fruits or vegetables or do the activities on the card to try to get bingo?
(Circle one.)
1. Did not get bingo cards [Go to Question 29]
2. None
3. 1 to 2
4. 3 to 4
5. 5 to 6
6. 7 to 8
28. The back of the bingo cards included recipes and other information on healthy eating
and exercise. How many months did you or someone else in your household make one
of the recipes with your child? (Circle one.)
1. None
2. 1 to 2
3. 3 to 4
4. 5 to 6
5. 7 to 8
29. Your child’s teacher sent home family newsletters with tips on healthy eating. Did you or
someone else in your household read the family newsletters? (Circle one.)
1. Did not get family newsletters [Go to Question 32]
2. No [Go to Question 32]
3. Yes, some of them
4. Yes, all or most of them

8
30. How easy was it to understand the family newsletters and other materials on healthy
eating sent home by your child’s teacher? (Circle one.)
1. Not at all easy
2. Not very easy
3. Somewhat easy
4. Easy
5. Very easy
31. How strongly do you agree or disagree with this statement? “I used the information from
the family newsletters and other materials on healthy eating to help my child eat
healthier foods.” (Circle one.)
1. Strongly agree
2. Agree
3. Disagree
4. Strongly disagree
32. Your child’s school had an event on healthy eating and exercise called Family Night Out.
Did you or someone else in your household go to this event? (Circle one.)
1. No [Go to Question 34]
2. Yes
33. How strongly do you agree or disagree with this statement? “I used the information I
learned from the Family Night Out event to help my child eat healthier foods.” (Circle
one.) [Go to Question 35 after answering this question]
1. Strongly agree
2. Agree
3. Disagree
4. Strongly disagree
34. Why didn’t you go to the Family Night Out event? (Circle all that apply.)
1. The event was not offered at my child’s school
2. Did not know about the event
3. The event was offered at times that did not work for me
4. Did not think the event would be useful
5. Do not like to go to events like this
6. Other reason (Describe): ______________________________________________
___________________________________________________________________

9
35. Please share any comments about the Family Night Out event, family newsletters, bingo
cards, and other materials on healthy eating.
_____________________________________________________________________
_____________________________________________________________________
_____________________________________________________________________
36. Have you seen, read, or heard about any of these campaigns on healthy eating? (Circle
Yes or No for each campaign.)
“Pick a Better Snack” Yes No
“Their bodies change, so should their milk” Yes No
“Mr. Juicebar” Yes No
“Be Strong” Yes No
37. Where did you see, read, or hear about “Pick a Better Snack?” (Circle all that apply.)
1. Did not see, read, or hear about this campaign
2. Radio
3. TV
4. Billboards, signs on buses, or at bus stops
5. Signs at gas stations
6. Poster, brochure, or other materials that I saw or got at the grocery store
7. Poster, brochure, or other materials that I saw or got at my child’s school
8. Poster, brochure, or other materials that I saw or got at food assistance programs,
such as food pantries, WIC clinics, or Department of Human Services (DHS)
9. Other (Describe): ____________________________________________________
___________________________________________________________________
38. Where did you see, read, or hear about “Their bodies change, so should their milk”
(Circle all that apply.)
1. Did not see, read, or hear about this campaign
2. Radio
3. TV
4. Billboards, signs on buses, or at bus stops
5. Signs at gas stations
6. Poster, brochure, or other materials that I saw or got at the grocery store
7. Poster, brochure, or other materials that I saw or got at my child’s school
8. Poster, brochure, or other materials that I saw or got at food assistance programs,
such as food pantries, WIC clinics, or Department of Human Services (DHS)
9. Other (Describe): ____________________________________________________
___________________________________________________________________

10
39. Where did you see, read, or hear about “Be Strong?” (Circle all that apply.)
1. Did not see, read, or hear about this campaign
2. Radio
3. TV
4. Billboards, signs on buses, or at bus stops
5. Signs at gas stations
6. Poster, brochure, or other materials that I saw or got at the grocery store
7. Poster, brochure, or other materials that I saw or got at my child’s school
8. Poster, brochure, or other materials that I saw or got at food assistance programs,
such as food pantries, WIC clinics, or Department of Human Services (DHS)
9. Other (Describe): ____________________________________________________
___________________________________________________________________
Thank you for completing our survey.
Please return the survey to RTI in the enclosed envelope.
If you have misplaced the envelope, call 1-866-800-9176
for a replacement or mail the survey to
RTI INTERNATIONAL
ATTN: Data Capture (0212343.001.008.002)
PO Box 12194
Research Triangle Park, NC 27709-9779

BASICS Nutrition and Physical Activity Program INN ● Program Evaluation
C.3: Follow-Up Survey, Comparison Group*
*Cups of fruits and vegetables graphics courtesy of Dr. Marilyn Townsend and Kathryn
Sylva, University of California, Davis.


OMB No. 0584-0554
Expiration date: 6/30/2014
See OMB statement on inside cover
Thank you for taking part in this important study!
Please fill out and return the survey in the enclosed envelope within the next week.
If you have any questions about the What Does Your Child Eat? study, please send an
e-mail to [email protected] or call toll-free at 1-866-800-9176.
Put label here

Public reporting burden for this collection of information is estimated to average 15 minutes per response, including the time for reviewing instructions, searching existing data sources, gathering and maintaining the data needed, and completing and reviewing the collection of information. An agency may not conduct or sponsor, and a person is not required to respond to, a collection of information unless it displays a currently valid OMB Comparison number. Send comments regarding this burden estimate or any other aspect of this collection of information, including suggestions for reducing this burden, to: U.S. Department of Agriculture, Food and Nutrition Services, Office of Research and Analysis, Room 1014, Alexandria, VA 22302 ATTN: PRA (0584-0554). Do not return the completed form to this address. If you have questions regarding your rights as a research participant, you may contact RTI’s Office of Research Protection toll-free at 866-214-2043.

1
This survey asks about what your child eats. You may recall that we asked some of the same
questions in the last survey. This study is being sponsored by the U.S. Department of
Agriculture’s Food and Nutrition Service and conducted by RTI International, a nonprofit
research organization. The survey will take about 15 minutes to complete. You will receive
$15 for completing this survey.
All of your answers to the survey will be kept private. We will not share your answers with
anyone, except as otherwise required by law. You may skip any questions you do not want to
answer. If you have any questions, please call Brian Head at RTI at 1-866-800-9176.
Questions on Whether Certain Foods Are Available at Home
1. Were any of these foods in your home during the past week? Include fresh, frozen,
canned, and dried foods. (Circle Yes or No for each food.)
a. Bananas Yes No
b. Apples Yes No
c. Grapes Yes No
d. Raisins Yes No
e. Pears Yes No
f. Celery Yes No
g. Carrots Yes No
h. Cucumbers Yes No
i. Broccoli Yes No
j. Zucchini Yes No
k. Potato chips, tortilla chips, corn chips, or other chips Yes No
l. Regular soft drinks or sodas Yes No
Questions on the Fruits and Vegetables Your Child Eats
For the next questions, think about what your child ate during the past week, or the past
7 days. Do NOT include food eaten at school, before/after school care, or day care.
2. How many days during the past week did your child eat more than one kind of fruit each
day? Do NOT include fruit juice. (Circle one.)
1. None
2. 1 to 2 days
3. 3 to 4 days
4. 5 to 6 days
5. Every day

2
3. Think about what your child ate during the past week. About how many cups of fruit did
your child eat on a typical day? Do NOT include fruit juice. (Circle one.)
1. None
2. ½ cup
3. 1 cup
4. 1 ½ cups
5. 2 cups None 1 cup 2 cups 3 cups
6. 2 ½ cups
7. 3 cups or more
4. How many days during the past week did your child eat more than one kind of vegetable
each day? Do NOT include white potatoes, French fries, or vegetable juice. (Circle one.)
1. None
2. 1 to 2 days
3. 3 to 4 days
4. 5 to 6 days
5. Every day
5. Think about what your child ate during the past week. About how many cups of
vegetables did your child eat on a typical day? Do NOT include white potatoes, French
fries, or vegetable juice. (Circle one.)
1. None
2. ½ cup
3. 1 cup
4. 1 ½ cups
5. 2 cups None 1 cup 2 cups 3 cups
6. 2 ½ cups
7. 3 cups or more
6. During the past week, did your child eat any meals or snacks that were provided by
his/her school, before school care program, after school care program, or day care?
(Circle all that apply.)
1. No, did not eat breakfast, lunch, or snacks provided by school, before or after school
care program, or day care
2. Yes, breakfast
3. Yes, lunch
4. Yes, snacks

3
7. Is your child willing to try a new kind of fruit? Do NOT include fruit juice. (Circle one.)
1. No
2. Maybe
3. Yes
8. How many days during the past week did you give your child fruit for a snack? Do NOT
include fruit juice. (Circle one.)
1. None
2. 1 to 2 days
3. 3 to 4 days
4. 5 to 6 days
5. Every day
9. How many days during the past week did you give your child fruit at dinner? Do NOT
include fruit juice. (Circle one.)
1. None
2. 1 to 2 days
3. 3 to 4 days
4. 5 to 6 days
5. Every day
10. Is your child willing to try a new kind of vegetable? (Circle one.)
1. No
2. Maybe
3. Yes
11. How many days during the past week did you give your child a vegetable for a snack?
Do NOT include white potatoes, French fries, or vegetable juice. (Circle one.)
1. None
2. 1 to 2 days
3. 3 to 4 days
4. 5 to 6 days
5. Every day

4
12. How many days during the past week did you give your child a vegetable at dinner? Do
NOT include white potatoes, French fries, or vegetable juice. (Circle one.)
1. None
2. 1 to 2 days
3. 3 to 4 days
4. 5 to 6 days
5. Every day
Questions on Milk
13. Did your child drink milk or use milk on his/her cereal at home during the past week?
(Circle one.)
1. No [Go to Question 17]
2. Yes
14. What kind of milk did your child most often drink or use on his/her cereal at home
during the past week? (Circle only one. If your child drinks more than one type of milk,
circle the type he/she drinks most often.)
1. Whole milk
2. 2% milk, also called reduced-fat milk
3. 1% milk, also called low-fat milk
4. Skim milk, also called fat-free milk
5. Other type of milk, such as soy, almond, or rice milk
15. How many days during the past week did you give your child milk to drink at dinner?
(Circle one.)
1. None
2. 1 to 2 days
3. 3 to 4 days
4. 5 to 6 days
5. Every day
16. Which one of these statements best describes how you feel about the milk you give your
third-grade child? (Circle one.)
1. I believe that whole milk is healthier for my child than 1% or skim milk.
2. I believe that 1% or skim milk is healthier for my child than whole milk.
3. I believe that whole milk and 1% or skim milk are equally healthy for my child.

5
Questions on Shopping and Eating Habits
17. How strongly do you agree or disagree with each of these statements? (Circle one for
each statement.)
a. It is easy to buy fresh fruits or
vegetables where I live.
Strongly
agree Agree Disagree
Strongly
disagree
b. There is a large selection of fresh fruits
or vegetables available where I live.
Strongly
agree Agree Disagree
Strongly
disagree
c. I do not usually buy fresh fruits or
vegetables because they spoil quickly.
Strongly
agree Agree Disagree
Strongly
disagree
d. I can afford fruits or vegetables in the
store where I shop for most of my
food.
Strongly
agree Agree Disagree
Strongly
disagree
e. I can encourage my child to try new
fruits or vegetables.
Strongly
agree Agree Disagree
Strongly
disagree
f. I usually drink 1% or skim milk. Strongly agree
Agree Disagree Strongly disagree
18. During the past month, how often did your child ask you to buy a certain type of fruit?
(Circle one.)
1. Never
2. Seldom
3. Sometimes
4. Often
5. Always
19. During the past month, how often did your child ask you to buy a certain type of
vegetable? (Circle one.)
1. Never
2. Seldom
3. Sometimes
4. Often
5. Always
20. How many days during the past week did you and your child sit down to eat dinner as a
family? (Circle one.)
1. None
2. 1 to 2 days
3. 3 to 4 days
4. 5 to 6 days
5. Every day

6
21. How many days during the past week did your child eat dinner with the TV on? (Circle
one.)
1. None
2. 1 to 2 days
3. 3 to 4 days
4. 5 to 6 days
5. Every day
22. How many days during the past week did you eat fruit for a snack? Do NOT include fruit
juice. (Circle one.)
1. None
2. 1 to 2 days
3. 3 to 4 days
4. 5 to 6 days
5. Every day
23. How many days during the past week did you eat vegetables for a snack? Do NOT
include white potatoes, French fries, or vegetable juice. (Circle one.)
1. None
2. 1 to 2 days
3. 3 to 4 days
4. 5 to 6 days
5. Every day
24. Did the child participating in the “What Does Your Child Eat Study” change schools
during the school year?
1. No [End of Survey]
2. Yes
25. What is the name of your child’s new school and the county in which it is located?
School name: __________________________________________________________
County: _______________________________________________________________

7
Thank you for completing our survey.
Please return the survey in the enclosed envelope.
If you have misplaced the envelope, call 1-866-800-9176
for a replacement or mail the survey to
RTI INTERNATIONAL
ATTN: Data Capture (0212343.001.008.002)
PO Box 12194
Research Triangle Park, NC 27709-9779

Appendix D
Parent Survey Supplemental Materials

2

BASICS Nutrition and Physical Activity Program INN ● Program Evaluation
List of Contents
D.1: Initial Letter
D.2: Information Sheet, Intervention Group
D.3: Information Sheet, Comparison Group
D.4: Contact Card
D.5: Brochure

BASICS Nutrition and Physical Activity Program INN ● Program Evaluation
D.1: Initial Letter


September 2011
Dear Parent or Caregiver,
I am writing to ask you to take part in a research study about what children eat. This study is
being sponsored by the U.S. Department of Agriculture’s Food & Nutrition Service. The study is
being conducted by RTI International, a non-profit research organization, and the Iowa
Department of Public Health.
If you decide to take part in this study, both you and your third-grade child will be asked to fill
out two surveys about what your child eats. The first survey is enclosed. Please fill out this
survey and mail to RTI in the large envelope. No postage is necessary. We will mail the second
survey to you next May. Each survey will take about 15 minutes to fill out. We will mail you $10
cash for filling out the first survey and $15 cash for filling out the second survey.
Your child will be asked to fill out two surveys at school in October and May. Researchers at
RTI and the Iowa Nutrition Network will combine the answers from your surveys with your
child’s surveys to more fully understand your child’s eating habits.
If you want to take part in the What Does Your Child Eat? study, please check the “Yes” box and
add your contact information. Then return the Contact Card to your child’s teacher in the small
envelope provided. The Contact Card and surveys should be completed by the adult in your
household who knows the most about your child’s eating habits.
If you do not want to take part in the study, please check the “No” box and still return the
Contact Card to your child’s teacher in the small envelope provided. Every child who returns the
envelope will receive a surprise gift and your child’s school will receive a cash donation for
helping us with the study.
We hope you will agree to take part in this important research study. Your survey answers will
help improve nutrition education programs for children in your community. The enclosed
brochure has more information on the study. If you have any questions, please e-mail me at
[email protected] or call me toll-free at 1-866-800-9176.
Sincerely,
Brian F. Head
RTI International

BASICS Nutrition and Physical Activity Program INN ● Program Evaluation
D.2: Information Sheet, Intervention Group

Consent Version: 09/29/10
RTI IRB ID: 12651
RTI IRB Approval Date: 09/29/10
Information Sheet
Introduction
You are being asked to take part in a research study, which is being sponsored by the U.S. Department of
Agriculture’s Food & Nutrition Service. The study is being conducted by RTI International and the Iowa
Department of Public Health. Before you decide whether to take part in this study, you need to read this sheet to
understand what the study is about and what you will be asked to do. This sheet tells you who can be in the study,
the risks and benefits, how your information will be protected, and who to call with questions.
Purpose
The purpose of this study is to learn what children eat, as part of a study to improve child nutrition education
programs. You are one of about 900 families who will be asked to take part in this study.
Procedures
If you decide to take part in this study, you and your child will be asked to fill out two surveys that ask about your
child’s eating habits. Researchers at RTI and the Iowa Department of Public Health will combine your answers with
your child’s answers to more fully understand your child’s eating habits. At school, your child will also get to try
some dairy products and fresh fruits and vegetables as part of the study. Your child may choose not to eat any food
for any reason. We will work with classroom teachers and school nurses to address any food allergies or other
dietary concerns before the study begins.
Study Duration
The first survey is enclosed. We will mail the second survey to you next May. Each survey will take about 15
minutes to fill out. Your child will complete surveys at school in October and May. Each of these surveys will take
about 30 minutes to fill out.
Possible Risks or Discomforts
There are minimal psychological, social, or legal risks to taking part in this study. There is minimal risk of loss of
privacy. The survey answers will be kept private except as required by law, and every effort will be made to protect
your contact information. We will not share your contact information or survey answers with anyone outside the
study team.
Benefits
There are no direct benefits to you or your child from taking part in this study. The survey answers will help us
improve child nutrition education programs in your community and across the country.
Payment for Participation
We will mail you $10 cash for filling out the first survey and $15 cash for filling out the second survey. Your child
will receive a small gift for returning the contact card.
Privacy
Many precautions have been taken to protect your contact information. Your name will be replaced with an
identification number. Other personal information like your address will be stored separately from your survey
answers. If the results of this study are presented at scientific meetings or published in scientific journals, no
information will be included that could identify you or your child or your survey answers personally. The
Institutional Review Boards (IRB) at RTI International and Iowa State University have reviewed this research. An
IRB is a group of people who are responsible for making sure the rights of participants in research are protected. The
IRB may review the records of your participation in this research to assure that proper procedures were followed.
Future Contacts
If you decide to take part in this study, you and your child will be asked to fill out surveys now and again in May.
We may also call you and ask you to take part in a group discussion for an additional payment.
Your Rights
Your decision to take part in this research study is completely up to you. You or your child can choose not to answer
any survey questions, and stop participating at any time. If you decide to take part and later change your mind, you
will not be contacted again or asked for further information.
Your Questions
If you have any questions about the study, please call Brian Head at 1-866-800-9176. If you have any questions about
your rights as a study participant, please call RTI’s Office of Research Protection at 1-866-214-2043 or Kerry Ann
Agnitsch with Iowa State University’s Office for Responsible Research at 515-294-4271.


BASICS Nutrition and Physical Activity Program INN ● Program Evaluation
D.3: Information Sheet, Comparison Group


Consent Version: 09/29/10
RTI IRB ID: 12651
RTI IRB Approval Date: 09/29/10
Information Sheet
Introduction
You are being asked to take part in a research study, which is being sponsored by the U.S. Department of
Agriculture’s Food & Nutrition Service. The study is being conducted by RTI International and the Iowa
Department of Public Health. Before you decide whether to take part in this study, you need to read this sheet to
understand what the study is about and what you will be asked to do. This sheet tells you who can be in the study,
the risks and benefits, how your information will be protected, and who to call with questions.
Purpose
The purpose of this study is to learn what children eat, as part of a study to improve child nutrition education
programs. You are one of about 900 families who will be asked to take part in this study.
Procedures
If you decide to take part in this study, you and your child will be asked to fill out two surveys that ask about your
child’s eating habits. Researchers at RTI and the Iowa Department of Public Health will combine your answers with
your child’s answers to more fully understand your child’s eating habits.
Study Duration
The first survey is enclosed. We will mail the second survey to you next May. Each survey will take about 15
minutes to fill out. Your child will complete surveys at school in October and May. Each of these surveys will take
about 30 minutes to fill out.
Possible Risks or Discomforts
There are minimal psychological, social, or legal risks to taking part in this study. There is minimal risk of loss of
privacy. The survey answers will be kept private except as required by law, and every effort will be made to protect
your contact information. We will not share your contact information or survey answers with anyone outside the
study team.
Benefits
There are no direct benefits to you or your child from taking part in this study. The survey answers will help us
improve child nutrition education programs in your community and across the country.
Payment for Participation
We will mail you $10 cash for filling out the first survey and $15 cash for filling out the second survey. Your child
will receive a small gift for returning the contact card.
Privacy
Many precautions have been taken to protect your contact information. Your name will be replaced with an
identification number. Other personal information like your address will be stored separately from your survey
answers. If the results of this study are presented at scientific meetings or published in scientific journals, no
information will be included that could identify you or your child or your survey answers personally. The
Institutional Review Boards (IRB) at RTI International and Iowa State University have reviewed this research. An
IRB is a group of people who are responsible for making sure the rights of participants in research are protected. The
IRB may review the records of your participation in this research to assure that proper procedures were followed.
Future Contacts
If you decide to take part in this study, you and your child will be asked to fill out surveys now and again in May.
We may also call you and ask you to take part in a group discussion for an additional payment.
Your Rights
Your decision to take part in this research study is completely up to you. You or your child can choose not to answer
any survey questions, and stop participating at any time. If you decide to take part and later change your mind, you
will not be contacted again or asked for further information.
Your Questions
If you have any questions about the study, please call Brian Head at 1-866-800-9176. If you have any questions about
your rights as a study participant, please call RTI’s Office of Research Protection at 1-866-214-2043 or Kerry Ann
Agnitsch with Iowa State University’s Office for Responsible Research at 515-294-4271.


BASICS Nutrition and Physical Activity Program INN ● Program Evaluation
D.4: Contact Card


CONTACT CARD Case ID: [FILL]
This card should be filled out by the adult in your household who knows the most about your child’s eating habits.
I have read and understand the risks and benefits of taking part in the “What Does Your Child
Eat?” study and agree that my child and I will take part in this study. YES NO
If “YES,” please clearly PRINT your contact information below.
Mr. Mrs. Ms. Your First Name: _____________________ Your Last Name: __________________________
Child’s First Name: _______________________________ Child’s Last Name: ____________________________________
Child’s Gender: Male Female School Name: _________________________ Teacher Name: _________________
Mailing Address: ________________________________________________________ Apt. Number: ______
City: _____________________________________ State: ________ Zip Code: ____________
Primary Phone Number: (______) ___________________ Home Cell Work
Alternate Phone Number: (______) __________________ Home Cell Work
Would you like to receive the second survey in English or Spanish? English Spanish
Please return this card even if you checked that you do not want to take part in this study. Seal it in the envelope
provided and have your child return it to the teacher to receive a small gift. Thank you.
According to the Paperwork Reduction Act of 1995, an agency may not conduct or sponsor, and a person is not required to respond to, a
collection of information unless it displays a valid OMB Comparison number. The valid OMB Comparison number for this information
collection is 0584-0554 and the expiration date is 6/30/2014. The time required to complete this information collection is estimated to
average 5 minutes per response, including the time for reviewing instructions, searching existing data sources, gathering and maintaining
the data needed, and completing and reviewing the collection of information.
CONTACT CARD Case ID: [FILL]
This card should be filled out by the adult in your household who knows the most about your child’s eating habits.
I have read and understand the risks and benefits of taking part in the “What Does Your Child
Eat?” study and agree that my child and I will take part in this study. YES NO
If “YES,” please clearly PRINT your contact information below.
Mr. Mrs. Ms. Your First Name: ______________________ Your Last Name: __________________________
Child’s First Name: _________________________________ Child’s Last Name: __________________________________
Child’s Gender: Male Female School Name: _________________________ Teacher Name: ________________
Mailing Address: ________________________________________________________ Apt. Number: ______
City: _____________________________________ State: ________ Zip Code: ____________
Primary Phone Number: (______) ___________________ Home Cell Work
Alternate Phone Number: (______) __________________ Home Cell Work
Would you like to receive the second survey in English or Spanish? English Spanish
Please return this card even if you checked that you do not want to take part in this study. Seal it in the envelope
provided and have your child return it to the teacher to receive a small gift. Thank you.
According to the Paperwork Reduction Act of 1995, an agency may not conduct or sponsor, and a person is not required to respond to, a
collection of information unless it displays a valid OMB Comparison number. The valid OMB Comparison number for this information
collection is 0584-0554 and the expiration date is 6/30/2014. The time required to complete this information collection is estimated to
average 5 minutes per response, including the time for reviewing instructions, searching existing data sources, gathering and maintaining
the data needed, and completing and reviewing the collection of information.

BASICS Nutrition and Physical Activity Program INN ● Program Evaluation
D.5: Brochure


Appendix E
Impact Evaluation Methodological Analyses

BASICS Nutrition and Physical Activity Program INN ● Program Evaluation

BASICS Nutrition and Physical Activity Program INN ● Program Evaluation
List of Contents
Table E-1.— Baseline Demographic Characteristics for Parent Respondents and their Children who Participated in the BASICS Evaluation
Table E-2.— Baseline Outcome Measures for the Evaluation of the BASICS Program
Table E-3.— Unadjusted Baseline Means of Participants Providing Follow-Up Data for the Evaluation of the BASICS Program
Table E-4.— Unadjusted Post-test Means for the Evaluation of the BASICS Program
Table E-5.— Attrition Analysis for the Evaluation of the BASICS Program
Table E-6.— Post Hoc Analysis of the BASICS Program on Primary Impacts Stratified by FFVP Participation: Non-FFVP Schools Only
Table E-7.— Post Hoc Analysis of the BASICS Program on Primary Impacts Stratified by FFVP Participation: FFVP Schools Only
Table E-8.— Post Hoc Analysis Assessing the Influence of the FFVP on Primary Impacts: BASICS Plus Group
Table E-9.— Post Hoc Analysis Assessing the Influence of the FFVP on Primary Impacts: BASICS Group
Table E-10.— Post Hoc Analysis Assessing the Influence of the FFVP on Primary Impacts: Comparison Group

BASICS Nutrition and Physical Activity Program INN ● Program Evaluation
Table E-1.— Baseline Demographic Characteristics for Parent Respondents and
their Children who Participated in the BASICS Evaluation
Number of Respondents
Characteristic Overall BASICS
BASICS
Plus
Comparison
Group
Child demographics
Sex, male 510 174 173 163
Age
Age 8 and under 894 297 297 300
Age 9 and older 127 40 39 48
Parenta/household demographics
Respondent age
18 to 34 600 207 195 198
35 to 44 343 109 107 127
45 or older 80 25 34 21
Respondent sex, male 72 31 18 23
Respondent is Hispanic or Latino 148 56 55 37
Respondent race
American Indian or Alaska Native 9 3 4 2
Asian 23 1 17 5
Black or African American 140 23 41 76
Native Hawaiian or other Pacific Islander
6 5 1 0
White 743 271 234 238
More than one raceb 39 6 15 18
Size of household
2 members 35 11 15 9
3 members 168 50 61 57
4 members 281 92 93 96
5 members 254 80 82 92
6 or more members 284 106 86 92
Single-adult household 244 69 91 84
Language spoken by family at home
Speak English all of the time 873 281 262 330
Speak English some of the time
and speak another language some of the time
128 45 66 17
Speak another language all of the time
25 14 10 1
(continued)

BASICS Nutrition and Physical Activity Program INN ● Program Evaluation
Table E-1.— Baseline Demographic Characteristics for Parent Respondents and
their Children who Participated in the BASICS Evaluation (continued)
Number of Respondents
Characteristic Overall BASICS
BASICS
Plus
Comparison
Group
Member of household currently receives SNAP benefit
525 160 167 198
Member of household currently receives WIC benefits
190 65 52 73
School-provided food
Received breakfast and lunch 419 130 133 156
Received lunch onlyc 372 133 123 116
Received breakfast and/or snacks
only
59 16 26 17
Received no food from school 157 52 51 54
Number of respondents 1,037 342 343 352
Number of schools 33 11 11 11
a Represents the parent/guardian who completed the survey. b Includes respondents who selected more than one race category. c Some in this category also reported receiving school-provided snacks.
Source: Parent Baseline Survey, data collected September–October 2011; respondents are parents/caregivers of children participating in the evaluation study.

Table E-2.— Baseline Outcome Measures for the Evaluation of the BASICS Program
Difference
Measure Overall
(SE) BASICS
(SE) BASICS
Plus (SE) Comparison Group (SE)
BASICS
Plus vs. Comparison
BASICS vs. Comparison
BASICS Plus vs. BASICS
Primary outcomes (at-home consumption)
Cups of fruits and vegetablesa 2.46 (0.06) 2.42 (0.08) 2.26 (0.08) 2.69 (0.08) −0.43** −0.27* −0.16
Cups of fruitsa 1.29 (0.03) 1.26 (0.05) 1.20 (0.05) 1.40 (0.05) −0.19** −0.14 −0.05
Cups of vegetablesa 1.17 (0.03) 1.17 (0.04) 1.06 (0.04) 1.29 (0.04) −0.22** −0.12 −0.10
Used 1% or skim milkb 37.86 (1.76) 37.79 (3.13) 35.92 (3.14) 39.87 (3.13) −3.95 −2.08 −1.87
Child’s other dietary behaviors
Ate variety of fruitsc 3.36 (0.07) 3.21 (0.10) 3.18 (0.10) 3.66 (0.10) −0.47** −0.45** −0.02
Ate variety of vegetablesc 3.55 (0.09) 3.44 (0.14) 3.30 (0.14) 3.91 (0.14) −0.61** −0.47* −0.14
Willingness to try new fruitsb 67.93 (1.53) 66.40 (2.32) 63.29 (2.30) 74.11 (2.29) −10.83** −7.71* −3.11
Willingness to try new vegetablesb 48.19 (1.85) 45.77 (3.21) 47.30 (3.21) 51.46 (3.19) −4.16 −5.69 1.53
Asked parent to buy certain fruitd 2.37 (0.04) 2.32 (0.07) 2.30 (0.07) 2.49 (0.07) −0.20* −0.17 −0.02
Asked parent to buy certain vegetabled
1.56 (0.04) 1.59 (0.08) 1.48 (0.08) 1.60 (0.08) −0.12 −0.01 −0.11
Parent behavior and household variables
Availability of fruits and vegetablese 5.54 (0.07) 5.49 (0.13) 5.49 (0.13) 5.64 (0.13) −0.16 −0.15 0.00
Parent offered fruit for a snackc 2.94 (0.09) 2.77 (0.14) 2.77 (0.14) 3.26 (0.14) −0.49* −0.49* 0.00
Parent offered fruit at dinnerc 1.96 (0.09) 1.86 (0.15) 1.95 (0.15) 2.07 (0.15) −0.11 −0.21 0.09
Parent offered vegetable for a snackc 1.52 (0.06) 1.51 (0.11) 1.37 (0.11) 1.67 (0.11) −0.30 −0.17 −0.14
Parent offered vegetable at dinnerc 4.46 (0.10) 4.25 (0.14) 4.15 (0.14) 4.96 (0.14) −0.80** −0.70** −0.10
Parent offered milk at dinnerc 3.67 (0.09) 3.73 (0.14) 3.87 (0.14) 3.43 (0.14) 0.44* 0.30 0.14
Parent ate fruit for a snackc 2.95 (0.07) 2.87 (0.12) 2.86 (0.12) 3.12 (0.12) −0.26 −0.24 −0.02
Parent ate vegetable for a snackc 1.96 (0.06) 1.94 (0.11) 1.92 (0.11) 2.04 (0.11) −0.13 −0.10 −0.02
(continued)

Table E-2.— Baseline Outcome Measures for the Evaluation of the BASICS Program (continued)
Difference
Measure Overall
(SE) BASICS
(SE) BASICS
Plus (SE) Comparison Group (SE)
BASICS Plus
vs. Comparison
BASICS vs. Comparison
BASICS Plus vs. BASICS
Parent can encourage child to try new fruits or vegetablesf
36.42 (1.45) 37.34 (2.60) 36.35 (2.61) 35.72 (2.56) 0.63 1.62 −0.99
Parent usually drinks 1% or skim milkg
52.59 (1.84) 51.29 (3.29) 53.95 (3.31) 52.55 (3.26) 1.40 −1.26 2.66
Parent believes that 1% or skim
milk is healthier for their child than whole milkh
53.73 (2.10) 50.27 (3.59) 58.56 (3.63) 52.45 (3.61) 6.11 −2.18 8.29
Number of respondents 1,037 342 343 352
Number of schools 33 11 11 11
*Indicates statistical significance if the p-value is less than or equal to 0.05.
**Indicates statistical significance if the p-value is less than or equal to 0.01.
a Continuous measure based on parental reports of at-home consumption: 0–6 for fruits and vegetables, 0–3 for fruits, and 0–3 for vegetables. b Dichotomous variable indicates the proportion responding yes. c Reported as the number of days in the past week. d Response categories converted to continuous variable, with 0 = never and 4 = always. e Index score (0–10) based on reported household availability of 10 fruits and vegetables. f Dichotomous variable indicates the proportion responding strongly agree. g Dichotomous variable indicates the proportion responding strongly agree or agree. h Dichotomous variable indicates the proportion of respondents who selected this statement to describe how they feel about the milk they give their third-grade
child.
Note: Standard errors (SEs) and t-statistic used to test the null hypothesis of no difference between the specified study conditions were derived from model-based comparisons adjusted for clustering of students within schools.
Source: Parent Baseline Survey, data collected September–October 2011 and May–July 2012 (Follow-Up); respondents are parents/caregivers of children participating in the evaluation study.

Table E-3.— Unadjusted Baseline Means of Participants Providing Follow-Up Data for the Evaluation of the BASICS
Program
Difference
Measure Overall
(SE) BASICS
(SE) BASICS
Plus (SE) Comparison Group (SE)
BASICS
Plus vs. Comparison
BASICS vs. Comparison
BASICS
Plus vs. BASICS
Primary outcomes (at-home consumption)
Cups of fruits and vegetablesa 2.48 (0.06) 2.42 (0.10) 2.31 (0.10) 2.69 (0.10) −0.38* −0.27 −0.11
Cups of fruitsa 1.29 (0.04) 1.26 (0.06) 1.23 (0.06) 1.38 (0.06) −0.16 −0.12 −0.03
Cups of vegetablesa 1.19 (0.03) 1.17 (0.05) 1.09 (0.05) 1.30 (0.05) −0.21** −0.13 −0.07
Used 1% or skim milkb 40.62 (2.06) 40.57 (3.65) 37.65 (3.65) 43.56 (3.58) −5.91 −2.99 −2.92
Child’s other dietary behaviors
Ate variety of fruitsc 3.40 (0.08) 3.30 (0.14) 3.27 (0.14) 3.61 (0.13) −0.34 −0.30 −0.04
Ate variety of vegetablesc 3.59 (0.10) 3.50 (0.17) 3.38 (0.17) 3.87 (0.16) −0.48* −0.36 −0.12
Willingness to try new fruitsb 68.23 (1.68) 66.50 (2.55) 62.81 (2.54) 74.98 (2.41) −12.17** −8.48* −3.69
Willingness to try new vegetablesb 47.99 (1.90) 46.60 (3.33) 45.64 (3.32) 51.47 (3.21) −5.84 −4.87 −0.97
Asked parent to buy certain fruitd 2.38 (0.04) 2.36 (0.08) 2.34 (0.08) 2.42 (0.08) −0.08 −0.06 −0.02
Asked parent to buy certain vegetabled
1.54 (0.05) 1.57 (0.09) 1.51 (0.09) 1.54 (0.09) −0.03 0.03 −0.06
Parent behavior and household variables
Availability of fruits and vegetablese 5.61 (0.09) 5.61 (0.16) 5.56 (0.16) 5.67 (0.15) −0.10 −0.05 −0.05
Parent offered fruit for a snackc 2.92 (0.10) 2.74 (0.17) 2.82 (0.17) 3.20 (0.16) −0.38 −0.46 0.09
Parent offered fruit at dinnerc 1.98 (0.10) 1.87 (0.17) 1.97 (0.17) 2.09 (0.16) −0.12 −0.22 0.10
Parent offered vegetable for a snackc 1.45 (0.06) 1.42 (0.11) 1.37 (0.11) 1.55 (0.11) −0.18 −0.13 −0.06
Parent offered vegetable at dinnerc 4.48 (0.11) 4.26 (0.16) 4.25 (0.17) 4.90 (0.16) −0.65** −0.64** −0.01
Parent offered milk at dinnerc 3.60 (0.11) 3.55 (0.18) 3.88 (0.18) 3.36 (0.18) 0.51 0.18 0.33
Parent ate fruit for a snackc 2.95 (0.08) 2.87 (0.14) 2.90 (0.14) 3.08 (0.13) −0.18 −0.20 0.02
Parent ate vegetable for a snackc 1.92 (0.08) 1.91 (0.14) 1.88 (0.14) 1.97 (0.13) −0.10 −0.06 −0.03
(continued)

Table E-3.— Unadjusted Baseline Means of Participants Providing Follow-Up Data for the Evaluation of the
BASICS Program (continued)
Difference
Measure Overall
(SE) BASICS
(SE) BASICS Plus
(SE) Comparison Group (SE)
BASICS Plus
vs. Comparison
BASICS vs. Comparison
BASICS
Plus vs. BASICS
Parent can encourage child to try new fruits or vegetablesf
34.41 (1.65) 34.56 (2.99) 34.68 (3.02) 34.08 (2.87) 0.60 0.48 0.11
Parent usually drinks 1% or skim
milkg
54.00 (2.08) 53.84 (3.74) 53.35 (3.77) 54.75 (3.64) −1.40 −0.91 −0.49
Parent believes that 1% or skim milk is healthier for their child than whole milkh
55.75 (2.23) 51.59 (3.87) 60.36 (3.89) 55.37 (3.80) 4.99 −3.78 8.77
Number of respondents 782 254 252 276
Number of schools 33 11 11 11
*Indicates statistical significance if the p-value is less than or equal to 0.05.
**Indicates statistical significance if the p-value is less than or equal to 0.01.
a Continuous measure based on parental reports of at-home consumption: 0–6 for fruits and vegetables, 0–3 for fruits, and 0–3 for vegetables. b Dichotomous variable indicates the proportion responding yes. c Reported as the number of days in the past week. d Response categories converted to continuous variable, with 0 = never and 4 = always. e Index score (0–10) based on reported household availability of 10 fruits and vegetables. f Dichotomous variable indicates the proportion responding strongly agree. g Dichotomous variable indicates the proportion responding strongly agree or agree h Dichotomous variable indicates the proportion of respondents who selected this statement to describe how they feel about the milk they give their third-grade
child.
Note: Model-adjusted means vary slightly across comparisons. Standard errors (SEs) and t-statistic used to test the null hypothesis of no difference between the specified study conditions were derived from model-based comparisons adjusted for clustering of students within schools.
Source: Parent Baseline Survey, data collected September–October 2011; respondents are parents/caregivers of children participating in the evaluation study.

Table E-4.— Unadjusted Post-test Means for the Evaluation of the BASICS Program
Difference
Measure Overall
(SE) BASICS
(SE) BASICS
Plus (SE) Comparison Group (SE)
BASICS
Plus vs. Comparison
BASICS vs. Comparison
BASICS
Plus vs. BASICS
Primary outcomes (at−home consumption)
Cups of fruits and vegetablesa 2.60 (0.05) 2.6 (0.09) 2.53 (0.09) 2.67 (0.09) −0.14 −0.06 −0.07
Cups of fruitsa 1.38 (0.03) 1.39 (0.05) 1.35 (0.06) 1.39 (0.05) −0.03 0.00 −0.04
Cups of vegetablesa 1.23 (0.02) 1.21 (0.04) 1.18 (0.04) 1.28 (0.04) −0.10 −0.07 −0.03
Used 1% or skim milkb 43.15 (2.36) 41.44 (4.22) 45.62 (4.23) 42.48 (4.12) 3.14 −1.04 4.18
Child’s other dietary behaviors
Ate variety of fruitsc 3.63 (0.08) 3.75 (0.15) 3.53 (0.15) 3.61 (0.14) −0.08 0.14 −0.22
Ate variety of vegetablesc 3.62 (0.08) 3.54 (0.14) 3.62 (0.14) 3.71 (0.14) −0.09 −0.17 0.08
Willingness to try new fruitsb 76.38 (1.22) 76.02 (2.08) 79.84 (2.09) 73.58 (1.95) 6.26* 2.44 3.82
Willingness to try new vegetablesb 49.91 (1.61) 48.54 (2.90) 52.30 (2.92) 48.96 (2.78) 3.34 −0.42 3.76
Asked parent to buy certain fruitd 2.47 (0.04) 2.50 (0.07) 2.36 (0.07) 2.53 (0.06) −0.17 −0.04 −0.14
Asked parent to buy certain vegetabled
1.70 (0.04) 1.71 (0.07) 1.62 (0.07) 1.76 (0.06) −0.14 −0.05 −0.09
Parent behavior and household variables
Availability of fruits and vegetablese 5.72 (0.07) 5.79 (0.12) 5.75 (0.12) 5.64 (0.12) 0.10 0.15 −0.05
Parent offered fruit for a snackc 3.33 (0.09) 3.26 (0.15) 3.16 (0.15) 3.57 (0.14) −0.41 −0.31 −0.10
Parent offered fruit at dinnerc 2.25 (0.10) 2.22 (0.18) 2.27 (0.18) 2.25 (0.18) 0.01 −0.03 0.05
Parent offered vegetable for a snackc
1.69 (0.08) 1.72 (0.14) 1.63 (0.14) 1.72 (0.14) −0.08 0.01 −0.09
Parent offered vegetable at dinnerc 4.61 (0.10) 4.43 (0.14) 4.27 (0.14) 5.08 (0.13) −0.81** −0.64** −0.17
Parent offered milk at dinnerc 3.65 (0.09) 3.49 (0.14) 3.96 (0.14) 3.52 (0.13) 0.44* −0.03 0.47*
Parent ate fruit for a snackc 3.17 (0.08) 3.16 (0.15) 3.18 (0.15) 3.17 (0.15) 0.00 −0.01 0.01
Parent ate vegetable for a snackc 2.19 (0.10) 2.22 (0.18) 2.18 (0.18) 2.16 (0.17) 0.02 0.06 −0.04
(continued)

Table E-4.— Unadjusted Post-test Means for the Evaluation of the BASICS Program (continued)
Difference
Measure Overall
(SE) BASICS
(SE) BASICS Plus
(SE) Comparison Group (SE)
BASICS
Plus vs. Comparison
BASICS vs. Comparison
BASICS
Plus vs. BASICS
Parent can encourage child to try new fruits or vegetablesf
38.15 (1.84) 37.91 (3.25) 41.76 (3.25) 35.03 (3.12) 6.73 2.88 3.85
Parent usually drinks 1% or skim milkg
54.12 (2.01) 54.18 (3.63) 56.31 (3.62) 52.01 (3.51) 4.30 2.17 2.13
Parent believes that 1% or skim milk is healthier for their child than whole milkh
56.92 (1.80) 54.25 (3.13) 61.85 (3.13) 54.89 (2.98) 6.96 −0.64 7.60
Number of respondents 782 254 252 276
Number of schools 33 11 11 11
*Indicates statistical significance if the p-value is less than or equal to 0.05.
**Indicates statistical significance if the p-value is less than or equal to 0.01.
a Continuous measure based on parental reports of at-home consumption: 0–6 for fruits and vegetables, 0–3 for fruits, and 0–3 for vegetables. b Dichotomous variable indicates the proportion responding yes. c Reported as the number of days in the past week. d Response categories converted to continuous variable, with 0 = never and 4 = always. e Index score (0–10) based on reported household availability of 10 fruits and vegetables. f Dichotomous variable indicates the proportion responding strongly agree. g Dichotomous variable indicates the proportion responding strongly agree or agree. h Dichotomous variable indicates the proportion of respondents who selected this statement to describe how they feel about the milk they give their third-grade
child.
Note: Model-adjusted means vary slightly across comparisons. Standard errors (SEs) and t-statistic used to test the null hypothesis of no difference between the specified study conditions were derived from model-based comparisons adjusted for clustering of students within schools.
Source: Parent Follow-Up Survey, data collected May–July 2012; respondents are parents/caregivers of children participating in the evaluation study.

Table E-5.— Attrition Analysis for the Evaluation of the BASICS Program
Characteristic
Estimated
Odds Ratio
95% Wald Confidence Limitsa
p-value Lower Upper
Child demographics
Sex
Male 0.90 0.68 1.20 0.4789
Female (reference group) 1.00 — — —
Age 0.78 0.56 1.08 0.1330
Parentb/household demographics
Respondent age
18 to 34 (reference group) 1.00 — — —
35 to 44 2.15** 1.55 2.98 <0.0001
45 or older 3.60** 1.72 7.50 0.0006
Respondent sex
Male 0.73 0.43 1.25 0.2514
Female (reference group) 1.00 — — —
Respondent race and ethnicity
White, non-Hispanic (reference group)
1.00 — — —
Hispanic or Latino 0.70 0.48 1.03 0.0676
Black, non-Hispanic 0.91 0.61 1.37 0.6575
Other or more than one racec 1.78 0.88 3.61 0.1117
Size of household 1.00 0.93 1.08 0.9673
** Indicates statistical significance if the p-value is less than or equal to 0.01. a Estimate (with 95% confidence limits) indicates the odds ratio of completers to noncompleters. b Represents the parent/guardian who completed the survey. c Includes respondents who selected more than one race category.
Notes: Generalized linear mixed model (SAS PROC GLIMMIX) used to evaluate program attrition while accounting for the clustering of students within schools. Dichotomous participation indicator (based on availability of post-intervention data) was regressed on child and parent demographic characteristics and household descriptors.
Source: Parent Baseline Survey, data collected September–October 2011; respondents are parents/caregivers of children participating in the evaluation study.

Table E-6.— Post Hoc Analysis of the BASICS Program on Primary Impacts Stratified by FFVP Participation: Non-
FFVP Schools Only
Daily At-Home Consumption
Model-Adjusted Baseline Means (SE)
Model-Adjusted Follow-Up Means (SE)
Estimated Impacta (95% CI)
BASICS Plus
BASICS
Comparison Group
BASICS Plus
BASICS
Comparison Group
BASICS Plus vs. Comparison
BASICS vs. Comparison
Cups of fruits and vegetables
2.10 (0.09) 2.40 (0.09) 2.60 (0.09) 2.44 (0.11) 2.63 (0.11) 2.57 (0.10) 0.37* (0.06, 0.68) 0.26 (−0.05, 0.57)
Cups of fruits 1.11 (0.06) 1.25 (0.06) 1.35 (0.06) 1.31 (0.06) 1.46 (0.06) 1.34 (0.06) 0.20 (−0.01, 0.42) 0.22* (0.00, 0.43)
Cups of vegetables 0.98 (0.04) 1.14 (0.05) 1.25 (0.04) 1.15 (0.06) 1.17 (0.06) 1.24 (0.05) 0.18** (0.11, 0.26) 0.05 (−0.05, 0.14)
Number of respondents 174 174 170 123 131 138
Number of schools 5 6 5 5 6 5
*Indicates statistical significance if the p-value is less than or equal to 0.05.
**Indicates statistical significance if the p-value is less than or equal to 0.01. a Program impact (with 95% confidence limits) estimated via difference-in-difference models comparing change across time in the BASICS Plus versus
Comparison and BASICS versus Comparison groups among schools not participating in the Fresh Fruit and Vegetable Program.
Note: Model-adjusted means vary slightly across comparisons. General linear mixed models (SAS PROC MIXED) for continuous impact variables were used to evaluate the program impact while accounting for the clustering of students within schools. Covariates in the model included child and respondent sex, child and respondent age, respondent race/ethnicity, and household size. Missing data ranged from 4.4 to 4.8%. SE = standard error. CI = confidence interval.
Source: Parent Baseline Survey, data collected September–October 2011 and May–July 2012 (Follow-Up); respondents are parents/caregivers of children participating in the evaluation study.

Table E-7.— Post Hoc Analysis of the BASICS Program on Primary Impacts Stratified by FFVP Participation: FFVP
Schools Only
Daily At-Home Consumption
Model-Adjusted Baseline Means (SE)
Model-Adjusted Follow-Up Means (SE)
Estimated Impacta (95% CI)
BASICS Plus
BASICS
Compariso
n Group
BASICS Plus
BASICS
Comparison Group
BASICS Plus vs. Comparison
BASICS vs. Comparison
Cups of fruits and
vegetables
2.68 (0.12) 2.53 (0.12) 2.53 (0.13) 2.68 (0.13) 2.36 (0.12) 2.63 (0.13) 0.22 (−0.14, 0.58) 0.21 (−0.16, 0.57)
Cups of fruits 1.40 (0.07) 1.31 (0.08) 1.36 (0.08) 1.37 (0.08) 1.26 (0.07) 1.38 (0.08) 0.13 (−0.13, 0.38) 0.09 (−0.17, 0.35)
Cups of vegetables 1.27 (0.06) 1.23 (0.06) 1.17 (0.07) 1.31 (0.07) 1.11 (0.06) 1.26 (0.07) 0.07 (−0.12, 0.26) 0.09 (−0.10, 0.28)
Number of respondents 169 168 182 129 123 138
Number of schools 6 5 6 6 5 6
a Program impact (with 95% confidence limits) estimated via difference-in-difference models comparing change across time in the BASICS Plus versus Comparison and BASICS versus Comparison groups among schools participating in the Fresh Fruit and Vegetable Program.
Note: Model-adjusted means vary slightly across comparisons. General linear mixed models (SAS PROC MIXED) for continuous impact variables were used to evaluate the program impact while accounting for the clustering of students within schools. Covariates in the model included child and respondent sex, child and respondent age, respondent race/ethnicity, and household size. Missing data ranged from 4.7 to 5.2%. SE = standard error. CI = confidence interval.
Source: Parent Baseline Survey, data collected September–October 2011 and May–July 2012 (Follow-Up); respondents are parents/caregivers of children participating in the evaluation study.

Table E-8.— Post Hoc Analysis Assessing the Influence of the FFVP on Primary Impacts: BASICS Plus Group
Daily At-Home Consumption
Model-Adjusted Baseline Means (SE)
Model-Adjusted Follow-Up Means (SE)
Estimated Impacta (95% CI)
Wald Chi-
Square p-value FFVP Schools
Non-FFVP Schools FFVP Schools
Non-FFVP Schools
Cups of fruits and vegetables 2.34 (0.10) 2.12 (0.10) 2.52 (0.12) 2.47 (0.12) −0.17 (−0.50, 0.16) 0.3056
Cups of fruits 1.25 (0.06) 1.13 (0.06) 1.36 (0.07) 1.32 (0.07) −0.09 (−0.32, 0.13) 0.4087
Cups of vegetables 1.10 (0.06) 0.99 (0.05) 1.16 (0.06) 1.15 (0.06) −0.09 (−0.25, 0.07) 0.2414
Number of respondents 169 174 129 123
Number of schools 6 5 6 5
a Program impact (with 95% confidence limits) estimated via difference-in-difference models comparing change across time in the FFVP schools versus non-FFVP schools.
Note: Model-adjusted means vary slightly across comparisons. General linear mixed models (SAS PROC MIXED) for continuous impact variables were used to evaluate the program impact while accounting for the clustering of students within schools. Covariates in the model included child and respondent sex, child and respondent age, respondent race/ethnicity, and household size. Missing data ranged from 4.6 to 5.0%. SE = standard error. CI = confidence interval.
Source: Parent Baseline Survey, data collected September–October 2011 and May–July 2012 (Follow-Up); respondents are parents/caregivers of children
participating in the evaluation study.

Table E-9.— Post Hoc Analysis Assessing the Influence of the FFVP on Primary Impacts: BASICS Group
Daily At-Home Consumption
Model-Adjusted Baseline Means (SE)
Model-Adjusted Follow-Up Means (SE)
Estimated Impacta (95% CI)
Wald Chi-
Square p-value FFVP Schools
Non-FFVP Schools FFVP Schools
Non-FFVP Schools
Cups of fruits and vegetables 2.51 (0.10) 2.41 (0.10) 2.67 (0.12) 2.65 (0.11) −0.08 (−0.40, 0.25) 0.6382
Cups of fruits 1.30 (0.06) 1.25 (0.06) 1.36 (0.07) 1.46 (0.07) −0.15 (−0.37, 0.08) 0.1882
Cups of vegetables 1.21 (0.06) 1.16 (0.06) 1.30 (0.06) 1.19 (0.06) 0.06 (−0.10, 0.22) 0.4542
Number of respondents 168 174 123 131
Number of schools 5 6 5 6
a Program impact (with 95% confidence limits) estimated via difference-in-difference models comparing change across time in the FFVP schools versus non-FFVP schools.
Note: Model-adjusted means vary slightly across comparisons. General linear mixed models (SAS PROC MIXED) for continuous impact variables were used to evaluate the program impact while accounting for the clustering of students within schools. Covariates in the model included child and respondent sex, child and respondent age, respondent race/ethnicity, and household size. Missing data ranged from 4.6 to 5.0%. SE = standard error. CI = confidence interval.
Source: Parent Baseline Survey, data collected September–October 2011 and May–July 2012 (Follow-Up); respondents are parents/caregivers of children
participating in the evaluation study.

Table E-10.— Post Hoc Analysis Assessing the Influence of the FFVP on Primary Impacts: Comparison Group
Daily At-Home Consumption
Model-Adjusted Baseline Means (SE)
Model-Adjusted Follow-Up Means (SE)
Estimated Impacta (95% CI)
Wald Chi-
Square p-value FFVP Schools
Non-FFVP Schools FFVP Schools
Non-FFVP Schools
Cups of fruits and vegetables 2.68 (0.10) 2.61 (0.10) 2.62 (0.11) 2.58 (0.11) −0.02 (−0.34, 0.29) 0.8804
Cups of fruits 1.40 (0.06) 1.36 (0.06) 1.37 (0.07) 1.35 (0.07) −0.02 (−0.24, 0.20) 0.8320
Cups of vegetables 1.27 (0.05) 1.25 (0.05) 1.25 (0.06) 1.23 (0.06) 0.00 (−0.15, 0.14) 0.9862
Number of respondents 182 170 138 138
Number of schools 6 5 6 5
a Program impact (with 95% confidence limits) estimated via difference-in-difference models comparing change across time in the FFVP schools versus non-FFVP schools.
Note: Model-adjusted means vary slightly across comparisons. General linear mixed models (SAS PROC MIXED) for continuous impact variables were used to evaluate the program impact while accounting for the clustering of students within schools. Covariates in the model included child and respondent sex, child and respondent age, respondent race/ethnicity, and household size. Missing data ranged from 4.6 to 5.0%. SE = standard error. CI = confidence interval.
Source: Parent Baseline Survey, data collected September–October 2011 and May–July 2012 (Follow-Up); respondents are parents/caregivers of children
participating in the evaluation study.

Appendix F
Instruments for Assessment of Demonstration
Projects Evaluation


BASICS Nutrition and Physical Activity Program INN ● Program Evaluation
List of Contents
F.1: Discussion Guide for Building and Strengthening Iowa Community Support Nutrition and Physical Activity Program Implementing Agency Evaluation Lead [pre-implementation]
F.2. Discussion Guide for Building and Strengthening Iowa Community Support Nutrition and Physical Activity Program Implementing Agency Evaluation Lead [post-implementation]
F.3. Review Form for Assessment of the Demonstration Project’s Evaluation
F.4. Outline for Demonstration Project’s Evaluation
F.5. Resource and Expense Tracking Form

BASICS Nutrition and Physical Activity Program INN ● Program Evaluation
F.1: Discussion Guide for Building and Strengthening Iowa Community Support Nutrition and Physical Activity Program Implementing Agency Evaluation Lead [pre-implementation]

Discussion Guide for INN Evaluation Manager [PRE-IMPLEMENTATION]
State: Respondent/Title/Organization: Address: Phone: Fax: E-mail: Interviewer: Date of Interview: Time of Interview:
Thank you for taking the time for this interview. The U.S. Department of Agriculture’s Food and Nutrition Service has contracted with Altarum Institute to conduct a study of [that is offering information to older adults/children and their families about healthy foods to eat and the importance of being active. Altarum is a health and nutrition policy research and consulting institute, and our work focuses on helping improve the health and nutrition status of children, families, and adults. The purpose of the study is to evaluate several Supplemental Nutrition Assistance Program-Education models around the country and to provide recommendations for how these interventions could be improved to better serve the older adults/children and families in your community. We also will be evaluating how the intervention might be replicated in other communities. Although there are only a select number of programs participating in this evaluation, we will do our best to aggregate data wherever possible in order to avoid information being tied back to a particular respondent. Nothing that is said today will be attached to you, and nothing that you say will affect your job or be shared with your employers. I expect that our discussion today will take 30 minutes. Before I begin, do you have any questions? Evaluation-Planning Phase I would like to ask you briefly about your experiences in the design and planning phase for this evaluation.
1. What challenges, if any, have you faced during the design and planning phases of this evaluation? 2. What factors do you feel have contributed to a successful design and planning phase? 3. What lessons have you learned during this key phase of the evaluation design?
(a) What would you do differently? (b) What would you do the same?
4. How will data be documented and entered from the various evaluation instruments? Please describe forms and software.
Anticipated Challenges for Implementation and Quality Control Efforts
Office of Management and Budget (OMB) No. 0584-0554 Expiration Date: 06/30/2014
The public reporting burden for this collection of information is estimated to average 30 minutes per response,
including the time for reviewing instructions, searching existing data sources, gathering and maintaining the data
needed, and completing and reviewing the collection of information. An agency may not conduct or sponsor,
and a person is not required to respond to, a collection of information unless it displays a currently valid OMB
control number. Send comments regarding this burden estimate or any other aspect of this collection of
information, including suggestions for reducing this burden, to the following address: U.S. Department of
Agriculture, Food and Nutrition Services, Office of Research and Analysis, Room 1014, Alexandria, VA 22302,
ATTN: PRA (0584-0554). Do not return the completed form to this address.

5. What challenges do you anticipate for this evaluation as you now approach your initial evaluation data collection phase?
6. Please describe any quality control or monitoring that will take place during data collection? (a) Who will conduct these? (b) With what frequency? (c) What methods will be used?
Evaluation of the Social Marketing Campaign [INN ONLY] I would like to ask you briefly about your experiences in the design and planning phase of the evaluation of the social marketing campaign.
7. What challenges, if any, have you faced during the design and planning phases of the social marketing campaign evaluation?
8. What factors do you feel have contributed to a successful design and planning phase of this evaluation? 9. What factors do you feel have been barriers to a successful design and planning of the evaluation of the
social marketing campaign? 10. If this social marketing campaign is part of a larger Iowa Department of Public Health social marketing
campaign, has this collaboration helped or hindered your work on this project? 11. What lessons have you learned during this key phase of the evaluation design?
(a) What would you do differently? (b) What would you do the same?
12. How will data be documented and entered from the various media outlets/retail stores [include the demonstrations in the stores]?
13. Please describe forms/software/other types of tracking methods. Anticipated Challenges for Implementation and Quality Control Efforts
14. What challenges do you anticipate for this evaluation as you now approach your initial evaluation data collection phase?
15. Please describe any quality control or monitoring that will take place during data collection? (a) Who will conduct these? (b) With what frequency? (c) What methods will be used?
Dissemination of Evaluation Results
16. When do you expect to complete data collection? 17. When do you anticipate that you will complete data analysis? 18. Who will conduct the data analysis? 19. How do you intend to use and/or disseminate your evaluation results? 20. Do you have an updated evaluation plan to share with us? If not, please send any changes to the
evaluation plan, no matter how minor, to my attention. 21. Is there anything else you would like to share about your evaluation plans, methodologies, or staffing?
That ends my formal interview questions. Do you have any information about your evaluation plans, comments, or recommendations that you would like to add? Thank you very much for your time and input on this very important project.

BASICS Nutrition and Physical Activity Program INN ● Program Evaluation
F.2. Discussion Guide for Building and Strengthening Iowa Community Support Nutrition and Physical Activity Program Implementing Agency Evaluation Lead [post-implementation]

Discussion Guide for INN Evaluation Manager [POST-IMPLEMENTATION]
State: Respondent/Title/Organization: Address: Phone: Fax: E-mail: Interviewer: Date of Interview: Time of Interview:
Thank you for taking the time for this interview. As you know, the U.S. Department of Agriculture’s Food and Nutrition Service (FNS) has contracted with Altarum Institute to conduct a study of the [NAME OF INTERVENTION] that is offering information to children and their families about healthy foods to eat and the importance of being active. Altarum is a health and nutrition policy research and consulting institute, and our work focuses on helping to improve the health and nutrition status of children, families, and adults. This study will include not only outcome evaluation information but also process information on how it is being implemented and how you are evaluating the intervention. All of this will be useful to both FNS and to other Supplemental Nutrition Assistance Program-Education (SNAP-Ed)-implementing agencies that are planning to evaluate their own SNAP-Ed interventions. As I mentioned during our last meeting, we will be using first names only today. Everything you say will be kept private. After we conduct several of these interviews, we will write a report for the FNS. Your name will not appear anywhere in the report. Nothing that is said today will be attached to your name at any point. Nothing that you say will affect your job or be shared with your employers. Today we will specifically discuss how the implementation of the program differed from your expectations. We also will discuss lessons learned and your feedback on how the program might be improved. I expect that this discussion will take about 40 minutes. I appreciate you taking the time to speak with me today. Before I begin, do you have any questions? Specific Changes From Planned to Actual Evaluation We would like to know about the specific aspects of your evaluation that might have changed along the way. We want to be able to describe any deviations from the evaluation plan you described to us during our first meeting, and also know why you had to make any specific changes from your plans.
Office of Management and Budget (OMB) No. 0584-0554 Expiration Date: 06/30/2014
The public reporting burden for this collection of information is estimated to average 30 minutes per response,
including the time for reviewing instructions, searching existing data sources, gathering and maintaining the data
needed, and completing and reviewing the collection of information. An agency may not conduct or sponsor,
and a person is not required to respond to, a collection of information unless it displays a currently valid OMB
control number. Send comments regarding this burden estimate or any other aspect of this collection of
information, including suggestions for reducing this burden, to the following address: U.S. Department of
Agriculture, Food and Nutrition Services, Office of Research and Analysis, Room 1014, Alexandria, VA 22302,
ATTN: PRA (0584-0554). Do not return the completed form to this address.

School-based Evaluation 1. Let’s start with the evaluation design. What changes, if any, occurred from your planned evaluation
design? What caused these changes? [Prompt: discuss both classroom-based evaluation and social marketing if applicable]
2. What changes, if any, occurred in your process measures, outcome measures, your data collection tools, and/or your planned data collection techniques? What caused these changes?
3. What changes, if any, did you make in the methods for protecting participant privacy? What caused these changes?
4. What changes, if any, did you make [or are you planning to make] in your data analysis plan? What caused these changes?
5. What changes, if any, did you make in the staffing for your data collection or staffing for your data analysis?
6. Did you need more or less time than budgeted for staff to spend on the data collection? On the data analysis? Why do you think you needed more/less time than budgeted for these evaluation tasks?
7. Did you have or are you anticipating any increased non-personnel costs or resources required for the evaluation? If so, what additional costs or resources have been or will be needed compared to what you planned for?
Social Marketing Campaign
8. What changes, if any, occurred from your planned evaluation design for the social marketing campaign? What caused these changes?
9. What changes, if any, occurred in your process measures, outcome measures, data collection tools, and/or planned data collection techniques for the social marketing campaign? What caused these changes?
10. What changes, if any, did you make [or are you planning to make] in your data analysis plan for the social marketing campaign? What caused these changes?
11. What changes, if any, did you make in the staffing for your data collection or for your data analysis for the social marketing campaign?
12. Did you need more or less time than budgeted for staff to spend on the data collection? On the data analysis? Why do you think you needed more/less time than budgeted for these evaluation tasks?
13. If this campaign was part of a larger effort within the Iowa Department of Public Health, can you describe the shared staffing for data collection and analysis?
14. Did you have or are you anticipating any increased non-personnel costs or resources required for the evaluation? If so, what additional costs or resources have been or will be needed compared to what you planned for?
Outcome/Impact Related Questions for INN – Based on Responses from Evaluation Report The first set of questions is intended to clarify any information in your evaluation report that was unclear or for which we need additional information. Project Outcome Level Objectives – Classroom-based Intervention
1. Could you compare the school-based outcome objectives in your demonstration project application to the actual outcomes?
Project Outcome Level Objectives – Social Marketing Intervention
1. Could you compare the social marketing outcome objectives in your demonstration project application to the actual outcome
Outcome Variables
1. Can you provide additional information on the scales used to assess the intervention?

Sample Size/ Sampling Strategies
1. Are there data comparing the sample students to the school-level data on student characteristics? Data Collection
1. Did the data collectors receive any instruction specific to data handling, confidentiality, or minimizing demand characteristics?
2. Please provide additional information on the script used to help minimize instrument 3. bias. 4. Was the Family Nutrition and Physical Activity Assessment tool used to capture data about program
impact on the home environment. We understand that this is a new evaluation tool for the Network. a. What were the results if the tool was used?
Data Analysis
1. Please provide additional information on the models used to assess program impacts. Questions Related to Analysis
15. With many programs, there are alternative explanations of program outcomes that need to be ruled out due to plausible threats to validity. If you saw changes in the program outcomes, what other factors could explain the changes you see? [Probe as needed on validity threats such as competing programs, concurrent media campaigns, and the effects of maturation among evaluation participants.]
16. [If needed] What subgroup analyses were conducted for primary outcomes? Lessons Learned Next let’s talk about your overall experience in carrying out this evaluation and what you see as lessons learned and recommendations for the future.
17. Other than those that we discussed above, what challenges, if any, have you faced during the implementation of this evaluation? [Refer back to the anticipated challenges cited by the interviewee prior to beginning the demonstration project led evaluation.]
18. What do you think worked very well in the implementation of this evaluation? What factors contributed to what worked well?
19. What do you think did not work well, and what factors contributed to this? 20. What lessons have you learned from this evaluation design?
(a) What would you do differently? (b) What would you be sure to do the same? (c)
Dissemination Plans 21. How do you plan to use and/or disseminate your evaluation results?
Future Evaluation Plans
22. Will you be working with the BASICS project conducting future evaluations?[if no, do not ask question 23] 23. If you are planning to continue with evaluation activities for the INN, what changes would you make for
future evaluations? That ends my formal interview questions. Do you have any comments or recommendations that you would like to add? Thank you very much for your time and input on this important project.

BASICS Nutrition and Physical Activity Program INN ● Program Evaluation
F.3. Review Form for Assessment of the Demonstration Project’s Evaluation

ASSESSMENT OF IA-LED IMPACT EVALUATION
REVIEW FORM
Implementing Agency: ____________________________________ Reviewer: ____________________________________ Date: __________________
Rating scale
The evaluation component being rated…
Not
Acceptable
1 …is missing or so poorly described that its value to the evaluation cannot be
determined.
2 …is inappropriate, misunderstood, or misrepresented in such a way that it
cannot contribute to an effective evaluation of the program. The actions or
materials reported are not appropriate from the evaluation effort proposed.
3 …shows a general understanding of its role in the evaluation. However, key
details have been overlooked or not thoroughly reported. Needs moderate
revision to be considered acceptable.
Acceptable
4 …is appropriate for the evaluation, technically correct, and is described well
enough to show a general understanding of its role in the overall evaluation.
Evidence shows that it will or has been implemented properly, but minor
details may be missing or unclear.
5 …is appropriate for the program being evaluated and is presented in a way
that shows the evaluator has a clear understanding of its role in the
evaluation.
To develop the evaluation review form, we started by emulating the data abstraction form that the Center for Substance Abuse Prevention (CSEP) used in development of the National Registry of Evidence-based Programs and Practices (NREPP) database, a service of the Substance Abuse and
Mental Health Services Administration (SAMHSA; http://www.nrepp.samhsa.gov/). Then we compared
the data abstraction form against the Society for Prevention Research Standards of Evidence criteria to ensure that the review form captured all relevant evaluation components
(http://www.preventionresearch.org/StandardsofEvidencebook.pdf). We expect raters to complete this review form after reading Implementing Agencies’ (IA) State SNAP Ed Annual Final Reports and information extracted from other data sources as indicated in the accompanying matrix. We plan to collect much of the data for this review from data abstractions of IAs’ applications and evaluation reports. Other data will be obtained from in-depth interviews with the evaluation manager at each of the IA sites.

A. Research Objectives and Hypotheses Score: _____________________
Clarity of research questions/hypotheses the evaluation is addressing o Are the objectives stated in SMART terms (specific, measurable, achievable,
realistic, time-bound)?
o A clear theory of causal mechanisms should be stated.
Alignment of evaluation goals and objectives with intervention activities o Do the objectives/hypotheses include endpoints that are behavioral, meaningful,
and related to the program’s theory of change?
B. Viable Comparison Strategy Score: _____________________
(Outcome Evaluation Research Design)
Note: under no circumstances should self-selection into treatment or control be viewed as
an acceptable method for developing a comparison strategy.
Appropriateness of the control or comparison group o Are the members of the control/comparison groups likely to be similar to the
members of the treatment group? Is the study an experimental (randomized) or a
quasi-experimental (non-randomized) design? Does this strategy make sense in
the context of the treatment program?
Threats to the validity of the design o Have plausible threats to validity (i.e., factors that permit alternative
explanations of program outcomes) been discussed?
o The evaluator must be able to rule out other factors that could explain changes,
such as competing programs, concurrent media campaigns, and the effects of
maturation among evaluation participants.
o Absent true randomization, there is additional onus on the program to identify
and rule out alternative explanations of program effects.
C. Sampling Size/Sampling Strategy Score: ______________________
Sample size estimations o Should be supported by power analysis that indicates the sample is sufficient to
detect statistically significant differences in outcomes between treatment and
control/comparison groups.
o The power analysis should be matched to the outcome evaluation design. It
should be based on an anticipated program effect size that is empirically valid
(i.e., drawn from published literature or pilot work).
Method of selecting sample participants from the population. o Should specify what/who the sample is and how it was obtained. Should be
detailed and provide a reasonable basis for generalization of program effects to
the broader population of people ‘like those’ in the study.

Recruitment plans. o Description of steps to be taken by project staff to increase the likelihood that
members of the target population approached by the program will agree to
participate in the program
NOTE: no program will have 100% recruitment, but rates below 70% - 80%
should be closely examined for justification.
D. Outcome Measures Score: ______________________
Quality of the data collection instruments (surveys, interviews) o Information on reliability (internal consistency (alpha), test-retest reliability,
and/or reliability across raters) and construct validity of measures should be
provided.
o When possible, the use of scales is preferable to single item measures.
Alignment of evaluation measures with the intervention activities.
o Outcome measures assess actual behavior change.
o Outcome measures should map onto research objectives/hypotheses
o Higher scores should be considered for measures that include intermediate
factors in the behavior change process.
E. Data Collection Score: ______________________
Overview of data collection schedule o Timing of data collection should align with program activities
o Should be realistic and achievable
Rigor of the data collection process o Data collection for the intervention and comparison group participants should be
similar. Any differences should be noted and justified.
o Participant data should be anonymous (no names linked to data) or confidential
(names linked to data are kept private).
o Should include description of data management and data security measures
o Describe longitudinal tracking procedures
Quality of the data collection process o Evidence of thorough training of data collectors
o High scores should be given for data collection procedures that are least likely to
introduce bias or promote non-response.
F. Data Analysis Score: ______________________
Note: Descriptive statistics are not sufficient to show program effects!
Sample characteristics and baseline comparability o Tables showing demographic information and number of participants in the
intervention and comparison groups
o Statistical tests assessing baseline comparability across treatment conditions

Statistical methods used to assess the program impacts o Multivariate statistics should be used to assess program effects
o Statistical approach should be matched to the characteristics of the research
design and the data being collected
Additional Statistical Procedures and Analyses o Analyses/Methods for handling attrition bias are proposed/conducted properly
o Procedures for accounting for missing data are proposed/conducted properly
o Subgroup analyses proposed/presented for primary outcomes
Potential indicators for specifying sub-groups include demographic and
socioeconomic variables.
G. Attrition (loss of participants) Score: ______________________
Attrition is program drop out. It is the differences between the number of participants
completing baseline survey and the number completing the post-intervention and follow-
up survey(s). Modest attrition should be anticipated in the design. Lowest scores given
for extraordinary attrition rates.
H. Missing Data (incomplete survey/items) Score: ______________________
Missing data is survey non-response. It represents the absence of, or gaps in,
information from participants who remain involved in the evaluation. Lowest scores
given for a large amount of missing data.

BASICS Nutrition and Physical Activity Program INN ● Program Evaluation
F.4. Outline for Demonstration Project’s Evaluation

Outline for the INN SNAP-Ed Demonstration Project’s Impact Evaluation Report
Altarum and RTI International request the project data in this outline from the SNAP-Ed - Wave II demonstration projects.
These data will be used in the demonstration project case study reports as well as the integrated report to USDA Food and
Nutrition Service. We thank you for your assistance in providing these data. If you should have any questions, please contact
Valerie Long at 207-319-6997.
A. Research Objectives and Hypothesis
1. Specify project level goals and objectives.
2. Specify each impact (outcome variable) assessed by the evaluation
B. Outcome Measures
3. For each impact (outcome variable) being assessed by the evaluation (including intermediate factors in the
behavior change process, if appropriate):
a. Describe key measures or indicators used to assess the intervention’s impact (outcome variable)
b. State whether the measures were scales or single item measures
c. Provide information on reliability (internal consistency [alpha], test-retest reliability, and/or
reliability across raters) and construct validity of each measure
C. Comparison Strategy/Research Design
D. Sample Size/Sampling Strategy
1. Describe the study population and the number of individuals in the study population
2. Provide sample size and describe method used to select sample participants from population
3. If applicable, provide information on the power analysis that was conducted
4. Describe steps taken to increase likelihood that members of the target population approached by the
program would participate (i.e., recruitment strategies used to increase the program response rate)
Impact Measure/Indicator
Scale or Single
Item Measure
Information on
Reliability and
Validity
E. Instrument Development and Testing
F. Data Collection
1. Describe data collection methods and timing of pre- and-post intervention data collection
2. Note and describe any differences in data collection for the intervention and control group participants
3. Describe procedures used to track participants longitudinally
4. Describe training provided to data collectors

5. Provide information on survey response rates at pre- and post-intervention
G. Data Analysis
1. Provide table showing demographic information for all participants and number of participants in the
intervention and control group. Describe tests of statistical significance to assess baseline comparability
across treatment and control groups. Table 1 provides a suggested format for providing this
information.
2. For each outcome measure, compare intervention and control groups at pre- and post-intervention, the
number of participants measured at each time period, and the program impact (i.e., difference in the change
for the intervention and control groups). Describe tests of statistical significance and their results. Table 2
provides a suggested format for providing this information for means and Table 3 provides a
suggested format for providing this information for percentages.
3. Describe modeling approach (model specification) used, including variables included in the model,
software package used, and estimation procedures
H. Attrition
1. Describe analyses and methods used to handle attrition bias, if any
2. If conducted, provide results of attrition analyses. (For example, indicate if any characteristics
distinguished between participants lost to attrition and those who completed the post-intervention data
collection.)
I. Missing Data (item non-response)
1. Describe procedures used to account for missing data, if any
2. Provide amount of missing data on an item-by-item basis for the demographic and outcome variables
included in the model (# of cases, % missing)
Table 1. Suggested Format for Providing Information on the Demographic Characteristics of the Full Sample and
Comparisons between Intervention and Control Groups at Baseline
Characteristic
Full Sample
(N = 484)
Intervention
(n = 246)
Control
(n = 238) 2 p
Age in years M (SD) 48.29 (14.08)a 48.34 (13.74)
a 48.30 (14.50)
a 0.07
b 0.981
Gender % 3.97 0.052
Female 77.69 81.30 73.73
Male 22.31 18.70 26.27
Etc.
a Mean (standard deviation).
b t-values from studentized t-test.

Table 2. Suggested Format for Providing Information on Outcome Measures (Means)
Intervention Control
Estimated Impact
(95% CI)a
Wald Chi-
square p-
value Pre Post t p Pre Post t p
Outcome
Variable 1
Sample size 246 175 238 169
Mean (SE) 1.42 (0.14) 1.69 (0.15) 1.92 0.057 1.68 (0.21) 1.71 (0.22) 0.17 0.861 0.23 (0.22, 0.24) 0.355
Etc.
a Program impact (with 95% confidence limits) estimated via difference-in-difference models comparing change across time in the intervention versus control
groups.
Table 3. Suggested Format for Providing Information on Outcome Measures (Percentages)
Intervention Control
Estimated Impact
(95% CI)a
Wald Chi-
square p-
value Pre Post 2 p Pre Post 2 p
Outcome
Variable 2
Sample size 246 174 238 168
Percent (SE) 53.91 (4.41) 67.92 (4.13) 7.45 0.059 59.0 (6.33) 62.3 (6.23) 1.50 0.683 10.8 (9.8, 11.8) 0.090
Etc. a Program impact (with 95% confidence limits) estimated via difference-in-difference models comparing change across time in the intervention versus control
groups.

SNAP-Ed Wave II Quantitative Data Elements for Process Evaluation
School/Classroom Data
1. How many schools actually received the intervention and when (time period of intervention)?
2. How many classrooms within each school actually received the intervention and when (time period), and the
age range/grade of the students in each classroom that received the intervention?
3. How many lessons did the nutrition educators actually provide in each classroom?
4. How many students were in attendance for each lesson?
5. How many classes did each child receive (dosage)?
6. Were all 12 lessons taught at every school, e.g. did the classroom teachers teach all four of the lessons?
7. How many PABS newsletters were distributed to parents via students? Please divide by district.
8. Please list the nutrition education handouts that were sent home with students in the intervention groups, and the
numbers of each handout.
9. Please list the date and content of training sessions provided to nutrition educators, and the number of staff who
participated in those trainings.
Social Marketing
1. Please list the number and type of retail outlets participating in the social marketing campaign in Des Moines.
2. Please list the number of demonstrations conducted at retail outlets, topic, and number of people reached.
3. Please list the date and location of retail intercepts, and number completed.
4. Please provide the analysis of retail intercepts.
5. Please list the type of retail outlet signage/messaging, topic area, and outlets where they were placed.
6. Please list the type of messaging (15 second PSA, etc.), topic area, and TV outlets where they were played.
7. Please attach the schedule of TV PSA’s/ads from each TV station (schedule of impressions).
8. Please list the type of messaging (30 second PSA), topic area, and radio outlets where they were played.
9. Please attach the schedule of radio PSA’s/ads from each radio station (schedule of impressions).
10. Please list the type of messaging, topic area, and location of billboards where signage was displayed.
11. Please list the location of each Family Night event and the number in attendance.
12. Please list the social marketing items posted in the intervention schools by type and message.

BASICS Nutrition and Physical Activity Program INN ● Program Evaluation
F.5. Resource and Expense Tracking Form

SNAP-Ed Wave II: Project Resource and Expense Tracking Form for Program Administrator [POST-IMPLEMENTATION]
This data collection form will be used to summarize information about actual resources used for and expenses related to your SNAP-Ed WAVE II intervention. In Section 1, we are requesting information that is specific to the planning and design of your project. In Section 2, we are requesting cost related data specific to the implementation of your project. In Section 3, we are requesting information that is specific only to the evaluation (Demonstration Project-led assessment) component of your intervention.
SECTION 1. Planning and design
In the following tables, please provide the requested information as it relates to the planning and design of your project. Please do not include resources or expenses related to the implementation or evaluation of your project.
1.1 Summarize staff costs (human capital) for the planning and design of your SNAP-Ed WAVE II
intervention.
(a) At the administrative, coordination, oversight, and trainer levels
Title of position Brief description of
responsibilities FTEs
Average salary for this position
Salary range for this position
(b) At the nutrition educator level (per intervention site), if applicable
Title of position Brief description of
responsibilities FTEs
Average salary for this position
Salary range for this position
(c) IT/technical staff, if applicable
Title of position Brief description of
responsibilities FTEs
Average salary for this position
Salary range for this position
(d) Other
Title of position Brief description of
responsibilities FTEs
Average salary for this position
Salary range for this position
1.2 Please provide the following information for ACTUAL expenditures related to the planning and design
of your SNAP-Ed WAVE II intervention only (NOT FOR IIMPLEMENTATION OR EVALUATION).

Expenses (a) Non-Federal Public Funds
(b) Non-Federal, Non-
cash
(c) Total Non-Federal Funds
(a+b)
(d) Federal Funds
Total Funds (c+d)
Cash In-Kind
Donations
1. Salary/benefits
2. Contracts/grants agreements
3. Noncapital equipment/ supplies
4. Materials
5. Travel
6. Administrative
7. Building/space
8. Maintenance
9. Equipment and other capital expenditures
10. TOTAL Direct Costs
11. Indirect costs
12. TOTAL Costs
SECTION 2. Implementation In the following tables, please provide the requested information as it relates to the implementation of your project. Please do not include resources or expenses related to your planning and design or evaluation.
2.1. Summarize staff costs (human capital) for the implementation of your SNAP-Ed WAVE II project.
(a) At the administrative, coordination, oversight level, and trainer levels
Title of position Brief description of
responsibilities FTEs
Average salary for this position
Salary range for this position
(b) At the nutrition educator level (per intervention site), if applicable
Title of position Brief description of
responsibilities FTEs
Average salary for this position
Salary range for this position

(c) IT/technical staff, if applicable
Title of position Brief description of
responsibilities FTEs
Average salary for this position
Salary range for this position
(d) Other
Title of position Brief description of
responsibilities FTEs
Average salary for this position
Salary range for this position
2.2. Describe the actual costs other than staff costs (physical capital) required to implement project.
(a) Space (b) Audiovisual (c) Computer/software (d) Other
2.3. Please provide the following information for actual expenditures related to the implementation of your
SNAP-Ed WAVE II intervention only (NOT FOR EVALUATION).
Expenses (a) Non-Federal Public Funds
(b) Non-Federal, Non-
cash
(c) Total Non-Federal Funds
(a+b)
(d) Federal Funds
Total Funds (c+d)
Cash In-Kind
Donations
1. Salary/benefits
2. Contracts/grants agreements
3. Noncapital equipment/ supplies
4. Materials
5. Travel
6. Administrative
7. Building/space
8. Maintenance
9. Equipment and other capital expenditures
10. TOTAL Direct Costs
11. Indirect costs
12. TOTAL Costs

SECTION 3. Evaluation In the following tables, please provide the requested information as it relates to the evaluation of your SNAP-Ed WAVE II project.
3.1. Summarize actual staff costs (human capital) used for your evaluation.
(a) At the administrative, coordination, and oversight levels
Title of position Brief description of
responsibilities FTEs
Average salary for this position
Salary range for this position
(b) At the evaluator level, if applicable
Title of position Brief description of
responsibilities FTEs
Average salary for this position
Salary range for this position
(c) IT/technical staff, if applicable
Title of position Brief description of
responsibilities FTEs
Average salary for this position
Salary range for this position
(d) Other
Title of position Brief description of
responsibilities FTEs
Average salary for this position
Salary range for this position
3.2. Describe the actual physical capital required to evaluate this project.
(a) Space (b) Audiovisual (c) Computer/software (d) Other
3.3. Please provide the following information for actual expenditures related to the evaluation of your
SNAP-Ed WAVE II intervention only (NOT FOR IMPLEMENTATION).

Expenses (a) Non-Federal Public Funds
(b) Non-Federal, Non-
cash
(c) Total Non-Federal Funds
(a+b)
(d) Federal Funds
Total Funds (c+d)
Cash In-Kind
Donations
1. Salary/benefits
2. Contracts/grants agreements
3. Noncapital equipment/ supplies
4. Materials
5. Travel
6. Administrative
7. Building/space
8. Maintenance
9. Equipment and other capital expenditures
10. TOTAL Direct Costs
11. Indirect costs
12. TOTAL Costs
SECTION 4. Total Expenditures In the following table, please provide the requested information as it relates to the TOTAL cost of your SNAP-Ed WAVE II project.
4.1. Provide the total expenditures for the SNAP-Ed WAVE II project (sum of 1.2, 2.3, and 3.3).
Expenses (a) Non-Federal Public Funds
(b) Non-Federal, Non-
cash
(c) Total Non-Federal Funds
(a+b)
(d) Federal Funds
Total Funds (c+d)
Cash In-Kind
Donations
1. Salary/benefits
2. Contracts/grants agreements
3. Noncapital equipment/ supplies
4. Materials
5. Travel
6. Administrative
7. Building/space
8. Maintenance
9. Equipment and other capital expenditures
10. TOTAL Direct Costs
11. Indirect costs
12. TOTAL Costs

Appendix G
Process Evaluation Methodology


BASICS Nutrition and Physical Activity Program INN ● Program Evaluation
List of Contents
G.1: Process Evaluation Methodology

BASICS Nutrition and Physical Activity Program INN ● Program Evaluation
G.1: Process Evaluation Methodology

A. PROCESS EVALUATION METHODOLOGY
As described in chapter I, the following seven broad research questions provided the framework for the
process evaluation design and approach:
● What was the demonstration project’s overall objectives and approach?
● How was the intervention implemented and administered?
● How many people did it reach and how much exposure did participants have it?
● What resources and associated costs were needed for implementation of the intervention?
● What were the facilitators, challenges, and lessons learned regarding implementation and
administration of the intervention?
● What feedback did participants have about the implementation of and their satisfaction with
the intervention?
These broad research questions and more specific indicators, also described in chapter I, guided the
design of the Building and Strengthening Iowa’s Communities (BASICS) evaluation, including
respondent samples, instrument development, data collection procedures, response rates, and analysis
approach, all of which are described in detail in the following sections.
1. Research Design and Data Sources
As noted in the introductory chapter, the process evaluation methodology was designed to ensure
comparable data collection across the three demonstration projects while allowing for project-specific
tailoring of the approach. The research design for the BASICS process evaluation was primarily
qualitative in approach. The distinctive characteristics of this program, as well as their influence on the
tailored research design, are summarized in exhibit G-1.
Exhibit G-1.— Characteristics of the BASICS Program that Contributed to a Tailored
Evaluation Research Design
Characteristic Implications for research design
1 BASICS is a SNAP-Ed school-
based nutrition education program that has been conducted in Iowa for more than a decade.
Since BASICS has been implemented for more than a decade
as a SNAP-Ed nutrition education program, it was especially important to document the barriers, challenges and successes of the program for the potential of replication in other State SNAP-Ed programs. This rigorous process
evaluation not only documents challenges and opportunities, but also lessons learned, and captures the perspective of the target audience’s perspective about level of satisfaction with the nutrition education messages and materials.
2 The BASICS Plus social
marketing campaign included multiple components ranging from billboards, family events, signage in retail stores and store demonstrations and radio and television.
The social marketing campaign, although well planned,
required thorough process evaluation methodologies in order to capture the breadth and depth of this comples campaign. The campaign conducted at retail outlets, especially, required additional tracking and documentation as some of the campaign materials were moved or removed for cleaning, the holidays, and other reasons. Additionally, some campaign
activities, such as demonstrations at supermarkets and Family Nights Out events, required additional scheduling to

observe and document. Thorough observations of social
marketing materials in the environment (e.g. billboards), signage in supermarkets, demonstrations in supermarkets, Family Nights Out events, and radio and television ads were all included in the process evaluation.
Characteristic Implications for research design
3 The BASICS program was administered by a small, but cohesive group.
The INN team – individuals responsible for designing, planning, implementation, and evaluation of the BASICS
program – was a small yet collaborative team who worked to implement the demonstration project. Although the roles and responsibilities were well defined, there was some overlap in the roles played by team members, and the process team was flexible and inclusive when conducting and analyzing key informant interviews.
To address each of the research questions it was necessary to gather both objective and subjective
information, as such, the process evaluation team acquired and assessed data from secondary and primary
data sources using multiple methods, including data abstraction; in-depth, open-ended interviews with
stakeholders; direct educator lesson logs; questionnaires for childcare center staff members; direct
nutrition education observation; and focus groups with parents and caregivers who participated in parent
classes.
Exhibit G-2 summarizes how various sources were used to inform the six broad process-related research
questions by providing a crosswalk of data sources—both secondary and primary—to the indicators that
were collected and analyzed for the BASICS demonstration project. More detail on the specific secondary
and primary sources of information for the process evaluation is provided below.

Exhibit G-2.— Crosswalk of Process Evaluation Research Questions and Indicators to BASICS Data Sources
Research Questions and Indicators
Secondary Data
Sources
Primary Data Sources
Program Managers
and Evaluators
Direct Educators and their
Supervisors
School
Principals and
Classroom Teachers
Retail Store
Manager /Dietician
Parents and
Caregivers
Nutrition Education
Observation
What was the demonstration project’s overall objectives and approach?
Target audience and intended reach
Intended effects
Method and setting of education delivery
Theoretical underpinnings or logic model
Project development timeline
Formative research and pilot testing
Number and topic of lessons
Key nutrition education messages and activities
Planned education dose and intensity
Types and sources of nutrition education materials
How was the intervention implemented and administered?
Management and oversight structure
Partnerships
Direct educators’ qualifications, characteristics, or
training
Recruitment approach (for intervention sites, for parents)
Quality control and monitoring procedures
How many people were reached and how much exposure did participants have to the intervention?
Number of participating schools and classrooms
Number and demographics of participating children
Number of classes attended by children
Number of parents or caregivers attending parent events
Number of parents and caregivers exposed to social
marketing

Exhibit G-2.— Crosswalk of Process Evaluation Research Questions and Indicators to BASICS Data Sources (continued)
Research Questions and Indicators
Secondary Data
Sources
Primary Data Sources
Program Managers
and Evaluators
Direct Educators and their
Supervisors
School Principals
and Classroom Teachers
Retail Store Manager
/Dietician Parents and Caregivers
Nutrition Education
Observation
What resources and costs were needed for implementation of the intervention?
Range and mean salary, by staff type
Number of FTEs, by staff type
Other direct costs
Physical capital used
What are the facilitators, challenges, and lessons learned regarding implementation and administration of the intervention?
Deviations from plan, reasons for deviations
Key challenges
Key facilitators
Recommendations for program improvement
What feedback did participants have about the implementation of and their satisfaction with the intervention?
Facilitators of and challenges to participation
Parent perception of the intervention goals
Parent satisfaction with the education
Reported changes in nutrition behaviors
Barriers or challenges to changing nutrition behaviors
Recommendations for improving program accessibility
Recommendations for improving program usefulness

a. Secondary data sources
Exhibit G-3 lists the secondary data sources collected and reviewed at various stages of the evaluation.
These sources served as rich sources of descriptive, objective information on key aspects of the
demonstration project’s design and implementation. Abstracting this type of information from secondary
sources helped to reduce the burden on key informants, who would otherwise have needed to supply this
information through interviews or surveys. The existing sources that the evaluation team collected and
reviewed can be categorized into four groups: planning and reporting, implementation documents,
administrative data on program reach and dosage, and program costs.
Exhibit G-3.— Secondary Data Sources for the Process Evaluation of the BASICS
Demonstration Project
Document Category Specific Documents Reviewed
Planning and Reporting Documents
● Demonstration project application
● FY 2012 SNAP-Ed Plan
Implementation Documents ● The BASICS curriculum (12 lessons: 8 direct educator taught; 4 classroom teacher taught)
● Copies of BASICS supplemental materials for each lessons (take-
home educational materials for students and parents)
● Direct educator lesson toolkit (list of items needed to implement
BASICS)
● Direct educator training agenda
● Classroom teacher training agenda
Administrative Data on Program Reach and Dosage
● Information on Federal FY2012 BASICS nutrition education activities from data collected by INN for the SNAP-Ed Education
and Administrative Reporting System (EARS), as well as social
marketing activities and estimated reach.
Program Costs* ● Standardized cost tables consistent with FNS SNAP-Ed
expenditure reporting requirements
* Altarum Institute provided a form for INN to complete to ensure cost data were collected in a standardized way (see
“Resource and expenss tracking form” in Appendix A).
i. Planning and reporting documents
The Iowa Nutrition Network’s (INN) original application to FNS for this study provided detailed
background and objective information related to how INN planned to develop, implement, and evaluate
the BASICS demonstration project. INN’s FY 2012 SNAP-Ed Plan was also reviewed to provide
information related to the program’s stated objectives, approach, administration, and design.
ii. Implementation documents
Implementation documents, such as the BASICS curriculum, student and parent handouts, training
curriculum, and agenda, and social marketing plans contributed substantial objective information on the
program’s educational messages, lesson objectives, handout materials used for indirect education of the
children’s families, as well as the social marketing materials used to supplement the BASICS curriculum.
iii. Administrative data on program reach and dosage
The BASICS program staff tabulated program and reach data based on routine student data that are
collected at each school and entered into the SNAP-Ed EARS system for FNS. These data were provided
for the statewide program and specifically for the 22 intervention schools. Based on information gathered
to populate the EARS system, INN provided detailed data on the number of the children enrolled in

BASICS classes and the range and mean in the number of classes children attended. For the intervention
sites, INN provided these data by schools so that we could assess the similarities and differences in
program attendance across sites. INN also provided detailed social marketing campaign reach and dosage
data as estimated by the marketing firm contracted by INN to assist with the development of the
campaign. Careful records were kept of media reach, as well as numbers in attendance for the Family
Nights Out events and retail store demonstrations.
iv. Program costs
INN provided data on resources and costs associated with implementing and evaluating the BASICS program.
Although Altarum provided INN with a series of cost-related tables to complete, this information was
categorized as a secondary data source because it was requested in a format that is consistent with FNS SNAP-
Ed reporting requirements, thus should have already existed in one form or another.
b. Primary data sources
Primary data were collected from four categories of key informants—program-level managers, direct
educators and their supervisors, intervention site key contacts (principals and teachers), store managers and
dietitians, and the target audience (parents of children in the intervention classrooms)—as well as through
direct nutrition education observation. The information gathered from key informants was descriptive and
primarily qualitative in nature. The timing of data collection from key informants was strategic; interviews
with state-level staff members took place in October, prior to the start of the intervention at any of the 22
schools. Interviews with the BASICS direct educators, and their supervisors, were conducted both pre- and
post-intervention, with the timing of the data collection tailored to accommodate the varied implementation
schedules at each site. Pre- and post-online surveys were conducted with classroom teachers, with a subset
of classroom teachers participating in a post-intervention interview. Focus groups with parents were
administered post-intervention and within two weeks from the completion date of the intervention at their
center.
Exhibit G-4 below lists the respondent types, methods used, and number of respondents for the process
evaluation’s pre- and post-intervention primary data collection efforts.
Exhibit G-4.— Iowa Nutrition Network Respondent Types, Data Collection Methods,
and Number of Respondents
Type of Respondent Data Collection
Method
Number of Respondents
Pre-intervention
Post-intervention
Program Staff
Program Administrators Interview 2 2
School Food Service/Project Directors Interview 2 2
Direct Educators Interview 3 3
Program Evaluators Interview 3 3
Fiscal Manager Interview 1 1
Intervention Retail Staff
Retail Store Managers Interview n/a 5
Intervention School Staff
School Principals or Administrative
Managers
Interview n/a 6
Classroom Teachers Questionnaire 29 26
Classroom Teachers Interview n/a 7
Program Participants

Type of Respondent
Data Collection
Method
Number of Respondents
Pre-
intervention
Post-
intervention
Parents/caregivers of children in the intervention classrooms
Focus Group n/a
3 groups
(25 adults)
Survey (process questions
included in parent follow-up survey)
n/a 513
Note: n/a= not applicable
i. Program managers
In selecting program managers for interviews, we worked directly with the program director to identify key
members of the BASICS management team and to gain a basic understanding of their respective roles and
responsibilities. Based on this information, the process data collection plan included interviewing the INN
director, the INN social marketing manager, and the Iowa Department of Public Health (IDPH) fiscal
manager—all of whom work at the IDPH. These individuals were involved in the initial design and
implementation of the BASICS program and currently oversee its administration, implementation, and
direct educator training. Our data collection plan also included a joint interview with the impact evaluation
manager and graduate student at Iowa State University, as well as the process evaluation manager at the
University of Iowa. These interviews were also important to better understand the INN BASICS self-
evaluation and data collected.
ii. Direct educators and their supervisors
Collecting information from each of the direct educators who taught the program at the intervention
sites was very important to document variations in their background and training and in program
implementation, if any, and to ascertain their differing views on the facilitators and challenges to
program recruitment and implementation. Conducting key informant interviews with the supervisors of
the direct educators was important in understanding the BASICS model at the local level. In this study,
half of the direct educators are employed by a school district, and half by a local public health agency.
iii. Retail Store Managers
A subset of retail stores was selected from the stores conducting the social marketing campaign for retail
store manager key informant interviews. Indepth key informant interviews were conducted with a variety
of retail store managers, assistant managers and store dietitians. These interviews were valuable in
understanding the barriers, challenges and opportunities in the implementation of a social marketing
campaign in a retail environment. Additionally, these interviews included questions about the
demonstrations provided by INN as part of the social marketing campaign.
iv. School principals
Key informant interviews were conducted with a subset of school principals to capture commitment to the
BASICS program as well as any barriers or challenges to the implementation of the program. These
indepth interviews capture the perspective of the school administrator with respect to the priority of
nutrition education for students in their school, any logistical concerns from an administrative view, and
any issues related to the implementation.
v. Classroom teachers
Collecting information from classroom teachers, either via an online survey or key informant interview, is
critical to understanding the model used by INN in the implementation of the BASICS program. Since the

Data Collection Instruments
Used to Collect Process Data on the BASICS
Program.
● Data abstraction tools
● Program cost form
● In-depth, open-ended key informant
interview guides
● Online survey for classroom teachers
● Parent and caregiver structured group
interview guide
● Nutrition education observation protocol
● Social marketing observation protocol
classroom teachers are expected to integrate four of the 12 BASICS lessons into their curriculum,
understanding accurately how they accomplish this. The survey and interviews answer: what are the
barriers, challenges, and lessons learned in the integration of this material into their curriculum?
Classroom teachers provided a unique perspective on the possibility of the extension of the direct
educator lessons.
vi. Parents and caregivers whose children participated in
BASICS classes
Since they would be knowledgeable about their child’s nutrition-related behaviors and because they were
indirect and direct recipients of the BASICS education efforts, parents were important respondents for the
process evaluation and the most appropriate respondents from the BASICS target audiences. Parents or
caregivers were an important source of information related to accessibility of the nutrition education
materials to parents, participant satisfaction, relevance of the messages and materials, and
recommendations for improvement. As shown in exhibit G-4 above, 25 adults participated in the three
focus groups and 513 parents and caregivers participating in the intervention responded to the follow-up
survey. (The number of discussants in each group and their demographic characteristics are provided in
appendix B).
vii. Direct observation of nutrition education
The fourth primary data collection source was direct observation of a convenience sample of intervention
classes. As noted above, the focus of these observations was on the education environment (e.g., classroom
setting, student engagement, classroom teachers’ engagement) and factors related to program fidelity (e.g.,
Did the nutrition educator implement the lesson as planned? Was the lesson implemented consistently
across classrooms?).
2. Instrumentation
Data collectors used standardized secondary data abstraction tools and primary data collection
instruments across the three demonstration projects. The questions in each key informant interview and
the focus group discussion guide was tailored to each of the demonstration projects. While such
customization was important to capture the unique aspects of each demonstration program, at each data
collection occasion, we worked from the same core set of questions. All data collectors were trained on
the use of these approved instruments to collect information essential to answering the process-related
research questions and queries. In addition, key informant
interviews included relevant, probing questions to allow for
in-depth discussions of critical issues or topics.
Data collection commenced in December 2012. Detailed
descriptions of the instruments developed and implemented
as part of the process evaluation of the BASICS, including
their intent and various characteristics of their
administration, are provided below. Secondary data
collection tools are described first, followed by descriptions
of the primary data collection tools. Copies of most of the
process evaluation data collection instruments are provided
in appendix A. The parent follow-up survey instrument is
included in appendix C.

a. Secondary data sources
i. Data abstraction tools
Data abstraction from secondary data sources helped to reduce the burden on key informants who would
have otherwise needed to supply this information through interviews or surveys. The data abstraction tool
was designed to capture objective, yet descriptive information related to: formative research conducted to
inform the project; the demonstration project’s design (e.g., descriptions of the target audience,
intervention goals, nutrition education delivery methods, curriculum content, social marketing delivery
methods, social marketing key messages); and operational aspects of the program’s implementation.
ii. Program cost form
The BASICS management team compiled and provided us with resource and cost information for the
program implementation statewide. We provided a standardized program cost information form that was
also consistent with FNS SNAP-Ed reporting requirements. Specifically, we requested data on: human
capital (e.g., staff roles and responsibilities, number of FTEs, as well as averages and ranges of salaries
for each), physical capital (e.g., printing, labels, computers, folders), and line-item expenditures (e.g.,
salary and benefits, materials, travel) by funding source (i.e., non-Federal or Federal funds).
b. Primary data sources
i. In-depth, open-ended key informant interview guides
Consistent with a participant-oriented approach, primary data were elicited through in-depth, open-ended
discussions with a number of key informants. A separate discussion guide was developed for each of
these key informant types.
Since the BASICS program level staff members have been administering and managing this program for
more than a decade, a pre- and post-intervention interview was conducted with these individuals for the
process evaluation in order to determine program fidelity, training, needed skill level, and integration into
the school environment. An interview guide was developed for each of these key informants to capture rich
information from them on the planning and design of the demonstration project, the training that had taken
place, and their views on the facilitators and challenges of implementation based on their many years of
experience with the program.
For the interviews with the 3 direct educators, the interviews were conducted before and after program
implementation. Hence, for these key informants, two discussion guides were developed—one for use
prior to implementation of the classes at their intervention site and one for use post-intervention. The pre-
intervention interview guides were structured primarily to gather descriptive information on the
background of the direct educators and the number of years they have worked in the program. Post-
intervention interview guides with these key informants captured their views on the program’s
implementation at their intervention site, what worked well, and what could have gone better as well as
their broader recommendations for the program.
ii. Online surveys for classroom teachers
A pre- and post online survey was developed for a subset of 29 classroom teachers who are involved in
teaching four of the BASICS lessons in the classroom. The survey was designed to elicit important
information about teacher perceptions prior to the information about attitudes about healthy eating and
active living and the integration of the BASICS lessons into their classroom. The post-intervention survey
was designed to capture rich information about implementation of the BASICS lessons in their classroom.
The survey was developed with to be brief enough to limit burden on respondents.

iii. Key informant interviews with classroom teachers
After the interventions were completed at each site, questionnaires were distributed in person or by mail
to each lead teacher in the 12 study site classrooms. A shorter instrument with primarily closed-ended,
multiple-choice questions was used for this key respondent group. This questionnaire specifically asked
the teachers to rate how important they think eating more fruits and vegetables and choosing 1% or nonfat
milk is for preschool children and their families. This instrument used open-ended questions which sought
teachers’ views on what worked well and what could be improved in the program, with separate questions
that focused on the BASICS child classes, the BASICS take-home materials, and classes targeted to
parents and caregivers. The questionnaires for teachers also asked whether and how they had incorporated
the BASICS messages at meal time or in other parts of their preschool day.
iv. Parent and caregiver focus group discussion guide
The focus group discussion guide was designed to elicit experiences and perspectives from parents or
caregivers whose children participated in the BASICS intervention. These individuals also were recipients
of indirect education through the distribution of nutrition education take-home materials and the social
marketing campaign. Topics addressed during each focus group included exposure to and accessibility of
the intervention, level of satisfaction with the program, relevancy of the information and materials
provided, perceived impacts on their or their child’s nutrition-related behaviors, factors affecting fruit and
vegetable availability at home, and recommendations for improving the program were covered during
each focus group.
v. Structured nutrition education observation protocol
The nutrition education observation tool allowed for the documentation of environmental influences (e.g.,
classroom setting, classroom teachers’ engagement), participants’ interest in the nutrition education
lessons, and program fidelity. The tool also included several questions that were to be asked of the direct
educator at the completion of each of the observed lessons. These questions offered the direct educator
the opportunity to reflect on the previous lesson and describe any deviations from their lesson plan as well
as anything that did or did not go particularly well.
3. Data Collector Training
Several months prior to onsite data collection, data collection team members participated in a
comprehensive training. The purpose of this training was to review the logistics of the data collection
plan, walk through the process of respondent recruitment, and provide guidance and instructions on
scheduling these early site visits and coordinating interviews with multiple respondents. In addition, to
ensure that data collectors used each interview instrument correctly and consistently, the training also
included a review of the intent of each data collection instrument, the schedule of interviews, and the
specific study research questions underlying the topics and questions within each of the respondent-
specific interview discussion guides.
4. Data Collection Procedures
The process data collection team for the BASICS program comprised three evaluators, one of whom, a
senior staff member, took a lead role on all recruitment and data collection activities. One evaluator
conducted all interviews and focus groups with the staff members and parents. This section includes a
detailed description of the procedures used to recruit program participants, collect process information
from various sources, and document responses.
a. Data abstraction from secondary sources
All secondary data sources were collected directly from the demonstration project administrators as they
became available. Because most secondary data sources were available prior to implementation, data

abstraction was completed before onsite data collection commenced. Members of the process evaluation
team carefully reviewed all documentation provided by the demonstration projects and abstracted key
information to be included in the analysis and final summation of the project. Further, this review of
materials substantially informed revisions made to key informant interview guides. This data abstraction
tool and the information contained within it were used to develop a summary of the demonstration
project’s design and program content. When updated materials were provided to the project team or
updated information was obtained through interviews, this summary was revised accordingly.
b. Data collection procedures for program-level key informant interviews
At the onset of the study and throughout the study period, the evaluation team maintained informal
communication with the demonstration project staff—primarily the designated program liaison. This
ongoing communication fostered a strong working relationship, and, as a result, formal recruitment of the
program-level staff for key informant interviews was not necessary. However, to officially kick off our
recruitment effort and to ensure timely, efficient communication of information required to finalize plans
for onsite data collection, the following packet of materials was submitted to the INN program staff
approximately four months prior to the start of the intervention at the 22 schools, or two months prior to
the first process evaluation interviews. This packet, which was sent electronically, included a
Brief overview memorandum, or cover email, which described the packet of materials (sent as
attachments) and outlined next steps, including timelines and expectations;
Respondent contact information form for the program staff to complete with potential respondents’
contact information;
Draft letter for the program staff to review, revise as necessary, and submit to intervention and control
site contacts to inform them about the independent evaluation and request their cooperation; and,
Data collection plan summary, which provided an overview of our data collection plan for each site,
including the number and type of respondents and timing of data collection.
INN program staff members were very responsive to this form of communication and effectively
facilitated the recruitment of their staff, identifying a date, block of time, and location for the two
evaluators to conduct the onsite interviews with program staff.
c. Data collection procedures for implementation site key informant interviews
In addition to facilitating and accommodating onsite data collection with demonstration project staff, the
BASICS program director sent the introductory letter described above to the director at each of the 22
intervention schools. Once delivery of these communications was confirmed to the intervention sites, we
took the following steps to complete recruitment of the intervention site contacts for the process evaluation:

Follow-up letter to provide overview of the impact and process evaluation design. A follow-up
email was sent to the principal at each of the 22 intervention schools. It provided a detailed description
of the type and timing of data to be collected, and what would be needed from them during the study
period. These letters described both the process and impact evaluation processes.
Follow-up telephone call. Once the above correspondence was sent, we followed up with the
directors at the three site visit centers to formally recruit them into the study, answer any questions
they had, schedule a convenient time for the pre-intervention telephone interviews, and plan potential
dates for the onsite nutrition education observations and post-intervention interviews and focus groups.
d. Recruitment and data collection procedures for parent and caregiver
focus groups
A total of three parent and caregiver focus groups were conducted post-intervention in May of 2012.
Approximately three to four weeks prior to the focus group date, we mailed a recruitment letter and flier
to the schools to distribute to parents or caregivers of the nutrition education recipients who had attended
the BASICS parent classes.
To meet an ideal group interview size of 6 to 8 participants, 10 to 12 parents or caregivers were recruited
for each focus group to allow for an approximate 50 percent no-show rate. The following measures were
taken to meet recruitment targets and maximize actual participation on the day of the focus group:
Focus groups were scheduled in the evening so that a majority of the parents would be able to attend.
Child care was offered for parents not able to arrange care for their children.
A $50 incentive was offered to every parent for participation.
Dinner was provided before each focus group.
One or two days before each focus group was held, we made reminder phone calls to participating parents
or caregivers. The $50 incentive was distributed to participants at the time of the interview, after each
adult signed an informed consent form. In addition to the privacy-related information provided on the
consent form, privacy assurance was offered verbally prior to the start of the interview, as was a reminder
that participation in the interview was voluntary. The focus group discussions were recorded using a
digital recorder and transcribed for future coding and analysis.
e. Classroom observations
Observations of the BASICS classes took place in March 2010 at the one site visit center in upstate New
York and in May and June 2010 at the two site visit centers in New York City. The evaluation team
member completed the observation form during each lesson, administered the few questions on the form
to the direct educator at the end of each lesson, reviewed the form for completeness, and transcribed
handwritten information into an electronic copy of the form.
5. Analysis Approach
The evaluation team applied an analysis approach to the data that takes into account the range of data and
respondent types used in the process evaluation. Key informant responses from INN program managers,
direct educators and their supervisors, principals, classroom teachers, and retail outlet managers were
compiled into a master Microsoft Word 2007 document and organized by broad process evaluation
research question and process indicator. This approach helped to organize the extensive amount of
information that was available and allowed for the identification of both broad themes (e.g.,
implementation challenges) and specific topics (e.g., lesson plan scheduling) as well as agreement and

disagreement amongst respondents. Direct quotations were also identified where relevant and used to
support key findings.
Transcripts from the focus groups with parents or caregivers of the children participating at BASICS
intervention sites were coded in QSR International NVivo Version 8, which allowed the evaluation team
to systematically organize, process, and summarize information provided by this key stakeholder group. It
also allowed us to capture the breadth of opinions offered by parents or caregivers, while also identifying
common themes and issues. Direct quotations were also identified and used to support key findings.
Quantitative process data were primarily used to describe objective aspects of the BASICS intervention,
such as those related to dose, reach, and costs. Quantitative process data collected from parents or
caregivers through the parent follow-up survey were analyzed using SAS 9.3. Frequencies of participant
responses to each process question were reported. Qualitative information collected through key
informant interviews, the teacher questionnaires, and the parent focus groups, including direct quotes, was
used to further explain any quantitative findings. Integrating methods in this way provides the context
needed to obtain a complete picture of the evaluation results.

BASICS Nutrition and Physical Activity Program INN ● Program Evaluation
Appendix H
Impact Evaluation Methodology

BASICS Nutrition and Physical Activity Program INN ● Program Evaluation

This appendix describes the methodology for the impact evaluation of the BASICS program. It identifies
the research questions and describes the research design and sample selection, the survey instrument
development and testing procedures, and the survey administration procedures for the baseline and
follow-up surveys. It describes the procedures for data handling and data processing and the methodology
for the impact analysis.
1. Impact Evaluation Research Questions
The primary objective of the impact evaluation was to assess whether the BASICS program yielded
positive and statistically significant changes in observed nutrition behaviors. The specific primary and
secondary outcomes for the impact evaluation are described below.
▲ Primary Outcome
Based on FNS’ interest in observing a minimum increase in children’s dietary intake of 0.30 standard
deviation units, it was hypothesized that children participating in the BASICS program would increase
their average daily at-home consumption of fruits and vegetables by approximately 0.30 cups per day
compared with children not participating in the program.
▲ Secondary Outcomes
It was hypothesized that children and parents of children participating in the program would increase
other nutrition behaviors that may lead to children’s increased fruit and vegetable consumption or
increased use of 1 percent or skim milk in the home compared with those not participating in the program.
Exhibit H-1 lists the secondary outcome measures for the impact evaluation of the BASICS program. The
secondary outcome measures describe mediators and short-term outcomes that may influence at-home
consumption of fruits and vegetables. The secondary outcome measures are grouped into two categories:
(1) child’s other dietary behaviors and (2) parent’s behavior and household variables.
2. Research Design and Sample Selection
The study population for the BASICS program included parents or caregivers of third-grade students
attending eligible schools in four Iowa school districts (Council Bluffs, Waterloo, Des Moines, and
Davenport). For the independent impact evaluation of the BASICS program, the independent contractor
employed a quasi-experimental research design with data collected at pre- and post-intervention. A fully
randomized design was not chosen because social marketing campaigns are inherently ecological and pose
risk of contamination when applied using random assignment of schools to study conditions. Accordingly,
school districts were assigned to treatment conditions, and schools in each district were recruited to
participate in the study. Eleven schools were recruited from the combined list of eligible schools in Council
Bluffs and Waterloo to receive the single-channel intervention (school-based BASICS curriculum). Eleven
schools were recruited from the Des Moines school district to receive the multichannel intervention (school-
based BASICS curriculum and the Pick a Better Snack™ social marketing campaign), and 11 schools were
recruited from the Davenport school district to serve as the comparison condition.
Within each condition, the selection of the 11 schools was guided by the following criteria:
1. exclusion of year-round schools
2. exclusion (in Des Moines and Waterloo/Council Bluffs) of schools not participating in
the BASICS program in 2011–2012

Exhibit H-1.— Secondary Outcome Measures for the BASICS Impact Evaluation
Secondary outcomes: child’s other dietary behaviors at home
Number of days child ate more than one type of fruit during past week
Number of days child ate more than one type of vegetable during past week
Willingness to try new kind of fruit
Willingness to try new kind of vegetable
Frequency at which child asked parent to buy certain fruits during past montha
Frequency at which child asked parent to buy certain vegetables during past montha
Secondary outcomes: parent behavior and household variables
Availability of fruits and vegetables at home during past weekb
Number of days parent gave fruit as snack during past week
Number of days parent gave fruit at dinner during past week
Number of days parent gave vegetables as a snack during past week
Number of days parent gave vegetables at dinner during past week
Number of days parent gave milk at dinner during past week
Number of days parent ate fruit for a snack
Number of days parent ate a vegetable for snack
Parent can encourage child to try new fruits or vegetablesc
Parent usually drinks 1 percent or skim milkd
Parent believes that 1 percent or skim milk is healthier for their child than whole milke
a Response categories were converted to a dichotomous variable, with 0 = never and 4 = always.
b Calculated an index score (0–10) based on the number of the following fruits and vegetables available in the
home during the past week: bananas, apples, grapes, raisons, pears, celery, carrots, cucumbers, broccoli, and
zucchini.
c Response categories were converted to a dichotomous variable, with 0 = “strongly disagree,” “disagree,” or
“agree” and 1 = “strongly agree.”
d Response categories were converted to a dichotomous variable, with 0 = “strongly disagree” or “disagree” and 1
= “strongly agree” or “agree.”
e Dichotomous variable that indicates the proportion of respondents who selected this statement to describe how they feel
about the milk they give their third-grade child.
3. minimum of 53 third-grade students1
INN provided lists of available schools by district and information on the exclusion criteria. After
applying the exclusion criteria, 11 schools in Davenport and Waterloo/Council Bluffs were retained, and
18 schools in Des Moines were retained. Because the minimum number of schools in Davenport and
Waterloo/Council Bluffs was retained, these schools were accepted and made up the comparison
(Davenport) and BASICS-only (Waterloo/Council Bluffs) conditions. For Des Moines, 11 of the 18
schools available were randomly selected. The goal was to apply a random selection process that would
yield a group of schools that were as similar as possible to groups of schools in Davenport and
Waterloo/Council Bluffs. Each of the 18 schools in Des Moines was assigned a unique numeric value
1 This criterion had to be relaxed in Davenport. The smallest school provided 46 third-grade students, but the
average in Davenport was still above the average expected minimum.

between 1 and 100 using a random number generator. The schools with the 11 lowest numbers were
retained for the study.
Table H-1 provides an overview of the characteristics of the schools in each condition. Schools in the
three conditions are reasonably similar. The average number of third-grade students is a function of
average school size, which is slightly higher in Des Moines than in other conditions; all are above the
minimum criterion. The presence of the Fresh Food and Vegetable Program (FFVP) was thought to be a
major potential confound because it is very similar to the BASIC program; its distribution across the three
conditions is similar. Other nutrition and physical activity programs are less available in
Waterloo/Council Bluffs, but this does not seem to be a function of the selection process (16 of 18
schools in Des Moines have other nutrition and physical activity programs).
Table H-1.— Overview of Selected Schools by Study Condition
Condition District
Average Number of Third-Grade
Students
Number of Schools with
FFVP
Number of Schools with Other
Nutrition/Physical Activity Programs
BASICS Council Bluffs/Waterloo
67.5 5 4
BASICS Plus Des Moines 71.4 6 10
Comparison Davenport 60.3 6 10
▲ Sample Size Estimation
Sample size estimation procedures are used to quantify researchers’ level of confidence regarding their
ability to accurately reject the null hypothesis when empirical differences are statistically significant. The
main outcome measure and the focus of sample size estimation was the change in consumption of
servings of fruits and vegetables by children participating in BASICS as reported by their parents or
caregivers. The sample size estimation procedures followed the convention of estimating sample size
allowing for a type II error rate of 0.20 (yielding 80 percent statistical power) and a type I error rate of
0.05, with a two-tailed test.
Sample size estimation was predicated on FNS’ interest in observing a minimum increase in children’s
dietary intake of 0.30 standard deviation units and was carried out to identify the minimum number of
parents from each school that would be needed to obtain sufficient power. Few studies in the published
literature provide data on parent-reported values of children’s fruit and vegetable consumption.
Estimates were used from a trial in Chicago that included means and standard deviations for parent-
reported measures of their children’s fruit and vegetable consumption. The study included six lower
socioeconomic status communities and collected data from 516 parents on their young children’s dietary
intake. In this study population, mean fruit and vegetable consumption was 3.83 servings per day, with a
standard deviation of 2.04 servings (Evans, Necheles, Longjohn, & Christoffle, 2007). Next, an
appropriate expectation for the magnitude of the program impact, often referred to as the effect size or the
minimum detectable effect, was determined. This number describes the anticipated change in observed
outcomes among participants as a result of participating in the intervention. The aim of the current study
was to identify a change of 0.30 standard deviation units or greater. Based on the findings from the
Chicago study, the realized net change is expected to be 0.30 cups of fruit and vegetables from baseline

values between the two groups. This expectation is consistent with findings reported in a recent meta-
analysis by Knai, Pomerleau, Lock, and McKee (2006) who found that across a range of dietary
interventions, children’s fruit and vegetable consumption increased by 0.30 to 0.99 servings (i.e., 0.15 to
0.50 cups) per day.
Additional assumptions relate to the form of the standard error of the test of the intervention effect. These
include the anticipated intraclass correlation coefficient (ICC), the proportion of variation attributable to
the cluster (i.e., school) over and above the variation attributable to the individual, and the form of the
statistical model. At present, published ICC estimates on parents’ reports of children’s dietary intake are
not available. However, a study of middle school youth reported an ICC of 0.034 for self-reported fruit
and vegetable consumption (Murray, Phillips, Birnbaum, & Lytle, 2001). Using this study as a starting
point and recognizing the differences between the participants in Murray et al. (2001) and this study, this
study used an ICC 0.05 for the power calculation.
The final assumption involves the form of the statistical model. These calculations are appropriate for a
mixed-effects regression model that includes baseline and follow-up measures of the outcome of interest
(i.e., pretest and posttest model) and allows for the inclusion of covariates associated with the outcome
variable, but independent of the intervention. This model allows for two sources of reduction to the
variance of the outcome. First, the use of a pretest and posttest model helps ensure that baseline
differences and potential confounding influences will be minimized. Second, the inclusion of covariates
associated with the outcome of interest, but independent of the intervention, can further reduce unwanted
variation in the outcome and improve statistical power. The decision of which variables to include in the
model was determined through examination of the baseline data. Demographic variables such as age, sex,
and race or ethnicity are typically included.
Sample size was estimated with the aim of detecting a change in consumption of servings of fruits and
vegetables of 0.30 standard deviation units or better based on the parameters described above. The
calculations indicate an 80 percent probability of properly rejecting a false null hypothesis given complete
data (pretest and posttest) on an average of 242 completed surveys in each treatment condition. Table H-2
provides details on the sample size estimate for the BASICS evaluation and assumptions regarding
response rate and retention.
Table H-2.— Sample Size for the BASICS Program Impact Evaluation
Group (District)
Number of Schools
Number of Childrena
Number of Completed Surveys
Baseline Survey (Number of Parents
and Caregivers)b
Follow-Up Survey (Number of Parents
and Caregivers)c
BASICS
(Council Bluffs/ Waterloo)
11 583 303 242
BASICS Plus (Des Moines)
11 583 303 242
Comparison (Davenport)
11 583 303 242
a Assumes an average of 53 third-grade students per school.
b Assumes that 65 percent will consent to providing contact information and an 80 percent response rate for the
baseline survey.
c Assumes an 80 percent response and retention rate between the baseline and follow-up surveys.

3. Survey Instrument Development and Testing
Drafts of the survey instruments were developed for the baseline (pre-intervention) and follow-up (post-
intervention) surveys, and interviews were conducted with parents and caregivers to test and refine the
instruments. The impact instruments for the two demonstration projects with children as the target
audience (BASICS and LEAP2) were very similar because the primary outcome measures and some of
the secondary outcome measures were the same. The survey instrument development and testing
procedures are described below.
a. Outcome measures and instrument development
To develop the impact evaluation instrument, INN’s application and the BASICS curriculum were
reviewed, and discussions were held with INN project staff to identify the primary and secondary
outcome measures for the intervention. The instruments compiled as part of the literature review
conducted for the SNAP I study (Altarum Institute and RTI International, 2009) were reviewed to identify
instruments that address these outcomes and are feasible, appropriate for the target audience, reliable,
valid, and sensitive to change.
The impact evaluation instrument for the BASICS program collected information on the following:
● food availability
● intake and variety of fruits and vegetables
● willingness to try new fruits and vegetables, snacking on fruits and vegetables, and offering of
fruits and vegetables at mealtime
● use of 1 percent or skim milk
● parents’ attitudes toward the availability, selection, and affordability of fresh fruits and vegetables
● assessment of child “pester power” (Nicholls and Cullen, 2004)
● parents’ snacking on fruits and vegetables and use of 1 percent or skim milk
● dosage and satisfaction with the intervention
● WIC benefits
● demographics
In developing the impact instrument, the appropriateness of the instrument for collecting data on fruit and
vegetable outcomes was assessed. Exhibit H-2 provides information on the study population, mode(s) of
data collection, reliability, validity, and sensitivity to change for the instruments used to develop the
questionnaire items on outcome measures for the impact evaluation. The majority of the items were taken
or adapted from instruments that have been administered successfully with low-income audiences,
validated, and demonstrated to be reliable and sensitive to change in previous studies.
For the primary outcome measures, child’s dietary behavior, questions from the Food Stamp Program
Fruit and Vegetable Checklist (Townsend, Kaiser, Allen, Joy, & Murphy, 2003) and University of
California Cooperative Extension Food Behavior Checklist (Townsend, Silva, Martin, Metz, & Wooten-
Swanson, 2008) were modified to ask the respondent (parent or caregiver) to report on his or her child’s
at-home consumption of fruits and vegetables. Respondents were instructed not to include meals eaten at
school or day care, but rather to report only on observed consumption behavior.

6
Exhibit H-2.— Summary of Instruments Used to Develop Impact Instrument for the BASICS Program Impact Evaluation
Outcome Measures Instrument Study
Population(s) Mode(s) of Data
Collection Reliability Validity Sensitivity to
Change
Cups of fruits, vegetables, and fruits
and vegetables consumed by child each daya
Child ate variety of fruits each daya
Child ate variety of vegetables each daya
Child drank or used milk on cereal during past week
Food Stamp Program Fruit and Vegetable
Checklist (Townsend et al., 2003)
University of
California Cooperative Extension Food Behavior Checklist (Townsend et al.,
2008); includes graphics for fruits and vegetables
Low-income women
Self-administered, self-
administered in group setting, and interviewer administered
individually and in groups
The internal consistency
for the 7-item fruit and vegetable subscale was
high (α = 0.80)
The 7-item fruit and vegetable
subscale showed a significant correlation with serum carotenoid
values (r = 0.44, p < 0.001), indicating
acceptable criterion validity and showed significant correlation with dietary variables
Demonstrated sensitivity to
change for items expected to change as a result of the study intervention
Willingness of child to try new fruits
Willingness of child to try new vegetables
Parent offered fruit at dinner
Parent offered vegetable at dinner
Willingness to try new
fruits and vegetables
(Jamelske, Bica, McCarty, & Meinen, 2008)
4th, 7th, and 9th graders
Self-administered Not reported Not reported Compared with
comparisons, intervention
participants reported an
increased willingness to try new fruits and vegetables at school (p < 0.01)
Availability of fruits and
vegetables at home during past week
Fruit, juice, and
vegetable availability questionnaire (Marsh, Cullen, &
Baranowski, 2003; Cullen et al., 2003)
Parents of 4th
and 6th graders
Self-administered
and interviewer administered via telephone
The internal
consistencies for the fruit and vegetable availability
items were high
There was
significant agreement between self-reported and
observed in-
home availability for all fruit juices and most fruits and vegetables
Fruit, juice, and
vegetable availability was a significant predictor of child
fruit, juice, and
vegetable consumption (p < 0.05)
(continued)

7
Exhibit H-2.— Summary of Instruments Used to Develop Impact Instrument for the BASICS Program Impact Evaluation
(continued)
Outcome Measures Instrument Study
Population(s)
Mode(s) of Data
Collection Reliability Validity Sensitivity to Change
Child asked parent to buy certain fruit
Questionnaire items were developed and tested by RTI
— — — — —
Child asked parent to buy certain vegetable
Questionnaire items were developed and tested by RTI
— — — — —
Parent offered fruit for a snack
Questionnaire items were developed and tested by RTI
— — — — —
Parent offered vegetable for a snack
Questionnaire items were developed and tested by RTI
— — — — —
Parent offered milk at dinner Questionnaire items were developed and tested by RTI
— — — — —
Parent ate fruit for a snack Questionnaire items were developed and tested by RTI
— — — — —
Parent ate vegetable for a snack
Questionnaire items were developed and tested by RTI
— — — — —
Parent can encourage child
to try new fruits or vegetables
Questionnaire items were developed and tested by RTI
— — — — —
Parent usually drinks 1 percent or fat-free milk
Questionnaire items were developed and tested by RTI
— — — — —
Parent believes that 1
percent or skim milk is healthier for their child than whole milk
Questionnaire items were developed and tested by RTI
— — — — —
a The questions were modified to ask the respondent (parent or caregiver) to report on his or her child’s consumption of fruits and vegetables.

8
The readability of the instrument was assessed using the Fry Test (Fry, 1968). This test examines the
proportion of syllables and sentence length and is a commonly used measure of reading level. Generally,
the questions were between fourth- and eighth-grade reading levels.
b. Instrument testing
To pretest the draft impact instrument, in-person interviews were conducted in August 2010 with parents
and caregivers of children enrolled in first, second, or third grade during the 2010/2011 school year. The
independent contractor worked with an associate of the North Carolina Expanded Food and Nutrition
Education Program (EFNEP) to recruit SNAP-Ed recipients or eligibles. Because some recruited
individuals did not come to the office to complete their scheduled interview, an ad was posted on
Craigslist to recruit additional individuals to pretest the instruments. Individuals had to meet the following
criteria to be eligible for participation: (1) were 18 years of age or older; (2) had a child living in the
household who would be enrolled in first, second, or third grade in the 2010/2011 school year; (3) had a
child receiving free- or reduced-price lunch at school; and (4) had an annual household income of less
than $30,000. Nine individuals were interviewed to evaluate the draft instrument for the baseline survey
for UKCES and INN. The interviews were conducted at the Wake County Center in Raleigh, North
Carolina, and at RTI offices. Additionally, three cognitive interviews were conducted with Spanish-
speaking individuals to test the Spanish-translated version of the instrument.
After obtaining informed consent, the interviewer went through the draft instrument question by question.
After asking each question, the interviewer asked the respondent to provide his or her response, to explain
the reason for that response choice, and to explain whether the question or response items were confusing or
difficult to understand. Each interview lasted about 45 minutes, and participants received a $60 honorarium.
Based on the findings from these interviews, several questions and response items were modified to
improve understanding, and a few words were underlined or bolded for emphasis.
Three versions of the instrument were developed:
● Baseline survey—The same instrument was used for the intervention and comparison groups.
This instrument collected information on the primary and secondary outcomes and demographic
information.
● Follow-up survey for the intervention group—This instrument collected information on the
primary and secondary outcomes and included questions on use and satisfaction with the BASICS
intervention materials.
● Follow-up survey for the comparison group—This instrument collected information on the
primary and secondary outcomes.
Each survey took about 15 minutes to complete. The baseline survey was administered by mail (survey
booklet). For the follow-up surveys, separate versions of the instruments were prepared for administration
by mail and telephone (computer-assisted telephone interviewing [CATI]). For the CATI version,
respondents did not have access to the graphics with cups of fruits and vegetables. The survey instrument
and other survey materials were available in English and Spanish. Copies of the final survey instruments
(English version) are provided as appendix C.

9
4. Survey Administration Procedures and Response
This section describes the training of data collectors, the survey administration procedures, and the
response to the survey.
a. Data collector training
Telephone interviewers were trained to work on the data collection for the three SNAP II demonstration
projects. Each training class included a detailed training manual. The training manual provided
background materials, including a study overview and glossary of terms; answers to frequently asked
questions; description of likely data collection challenges and recommendations for avoiding or resolving
them; confidentiality and data security procedures; and review of the instrument and case management
system.
Interviewers attended a 2-day evening training totaling 8 hours. Bilingual interviewers had an additional 2
hours for review of Spanish-language materials and cultural variability in vocabulary. Before beginning
work on the administration of the survey, each telephone interviewer had to pass certification exercises
demonstrating knowledge of the study, facility with the instrument and control system for documenting
their work, and use of the equipment. The training included information on gaining respondent cooperation
and time for interviewers to practice administering the questionnaire and documenting calls. The training
used multiple formats, including classroom-style teaching, discussions, and role-playing. The survey
protocol was reinforced by trainer demonstrations and post-classroom practice.
b. Data collection procedures
A multimodal survey approach was used to maximize the survey response rate. Figure H-1 illustrates the
data collection procedures for the baseline and follow-up surveys. The baseline data collection was
conducted during September and October 2011. The independent contractor worked with INN to
coordinate study recruitment and the administration of the baseline survey at the intervention and
comparison schools. INN made the initial contact with the intervention and comparison schools to
encourage their cooperation in the study. Working with the schools in the study, the study team sent home
packets with information on the study with students. Each packet included consent and contact information
forms as well as the questionnaire. The field representatives collected the forms from teachers to contact
study participants by mail or telephone for the follow-up survey. Appendix D provides copies of the
survey materials for the baseline survey.
The baseline survey was conducted 2 months before the start of the intervention. So that the responses to
the FNS parent survey and the INN student survey could be matched, informed consent was obtained
from the parent/caregiver for their participation and their child’s participation in the study. For parents
who agreed to participate in the study, a unique identification number was assigned that allowed matching
of the parent and student data. Respondents received $10 cash for completing the baseline survey.
The data collection for the follow-up survey was conducted from May to July 2012. During the last week of
the intervention, an advance notification letter was mailed reminding study participants about the follow-up
survey. The mail survey packet was mailed approximately 1 week later, which was 1 week after completion
of the intervention. Five days later, a follow-up postcard was mailed to remind participants to complete the
survey and/or thank them for their participation if they had already done so. Approximately 10 days later a
second mail survey packet was sent. Telephone contact of nonrespondents began 2 weeks after the second

10
Figure H-1.— Data Collection Procedures for the Impact Evaluation of the BASICS
Program
packet mailing; at least 10 call attempts were made to each working phone number at various times of day
and days of the week. Respondents received $15 cash for completing the follow-up survey.
c. Survey response
Table H-3 provides the number of completed surveys for the intervention and comparison groups at
baseline and follow-up. At baseline, 342 participants in the BASICS group, 343 participants in the
BASICS Plus group, and 352 participants in the comparison group completed the survey. The response
rate for the baseline survey (among those agreeing to participate) was 85 percent for the BASICS group,
81 percent for the BASICS Plus group, and 84 percent for the comparison group.
At follow-up, 254 participants in the BASICS group, 252 participants in the BASICS Plus group, and 276
participants in the comparison group completed the survey, thus meeting the target of 242 participants per
group at follow-up. The response rate for the follow-up survey was 74 percent for the BASICS group, 73
percent for the BASICS Plus group, and 78 percent for the comparison group.
5. Data Processing and File Production Procedures
Data processing steps included entering the survey data, editing and cleaning the data, creating derived
variables, creating the analysis data files, and producing data documentation. Throughout data processing
and file production, quality control and assurance procedures were implemented as described below.
a. Data entry
Data entry consisted of entering data from the contact cards and mail surveys as well as entering data
through CATI for respondents contacted by phone to complete the survey. Double-keying verification
was performed on all hard copy data collection instruments, and any data entry errors were resolved by
comparing the first- and second-keying files. Item nonresponse was keyed as a “refusal,” and data were
checked for chronic item refusals. For surveys conducted by telephone, telephone interviewers entered the
survey responses using CATI; thus, data entry was not required.
Baseline Survey2 months before
intervention
Intervention7 months
Follow-Up SurveyStarting 1 week after intervention
Send information packet and survey home with child
Mail advance notification letter
last week of intervention
Mail survey to parents who
completed baseline survey
Mail reminder/thank you postcard
Call nonrespondents and attempt to
complete survey by phone
Call nonrespondents and attempt to
complete survey by phone
Mail reminder/thank you postcard
Mail nonrespondents
another copy of the survey

1
1
Table H-3.— Number of Completed Surveys and Response Rates for the Baseline and Follow-Up Surveys
School
Eligible Population
(Number of Students)a
Consent Rate (%)b
Number of
Completed Baseline Surveys
Response Rate
for Baseline Survey (%)c
Number of
Completed Follow-Up Surveys
Response Rate
for Follow-Up Survey (%)d
BASICS 613 66.2 344 84.7 258 75.0
Edison 44 70.5 26 83.9 18 69.2
Irving 67 52.2 31 88.6 24 77.4
Lowell 48 41.7 15 75.0 11 73.3
Highland 59 59.3 30 85.7 21 70.0
Bloomer 45 80.0 33 91.7 25 75.8
Carter Lake 60 65.0 27 69.2 23 85.2
Edison 71 70.4 41 82.0 35 85.4
Franklin 61 85.2 43 82.7 33 76.7
Longfellow 57 54.4 26 83.9 23 88.5
Roosevelt 48 72.9 32 91.4 23 71.9
Rue 53 79.2 40 95.2 22 55.0
BASICS Plus 631 68.3 350 81.2 265 75.7
Cattell 57 77.2 31 70.5 23 74.2
Wright 36 72.2 18 69.2 14 77.8
Morris 56 69.6 30 76.9 22 73.3
Carver 57 89.5 38 74.5 31 81.6
Brubaker 54 53.7 28 96.6 20 71.4
Lovejoy 42 66.7 28 100.0 24 85.7
Studebaker 71 76.1 45 83.3 34 75.6
Findley 50 42.0 19 90.5 15 78.9
Windsor 66 80.3 42 79.2 30 71.4
Jackson 67 49.3 26 78.8 22 84.6
Park Avenue 75 70.7 45 84.9 30 66.7
(continued)

1
2
Table H-3.— Number of Completed Surveys and Response Rates for the Baseline and Follow-Up Surveys
(continued)
School
Eligible Population (Number of Students)a
Consent Rate (%)b
Number of Completed
Baseline Surveys
Response Rate for Baseline Survey (%)c
Number of Completed Follow-
Up Surveys
Response Rate for Follow-Up Survey (%)d
Comparison 577 73.3 355 83.9 283 79.7
Buchanan 48 75.0 27 75.0 22 81.5
Fillmore 61 62.3 31 81.6 30 96.8
Garfield 45 75.6 28 82.4 23 82.1
Jefferson 64 56.3 27 75.0 22 81.5
McKinley 63 73.0 39 84.8 34 87.2
Monroe 69 88.4 51 83.6 34 66.7
Truman 65 76.9 48 96.0 38 79.2
Wilson 40 77.5 26 83.9 24 92.3
Lincoln 28 78.6 19 86.4 14 73.7
Hayes 48 66.7 29 90.6 20 69.0
Jackson 46 80.4 30 81.1 22 73.3
Total 1,821 69.2 1,049 83.3 806 76.8
a The eligible population is based on class enrollment data available at the start of the intervention. The eligible population may differ from the reach data
reported in chapter II, which are equal to the actual number of unduplicated children who attended at least one BASICS class at their school.
b Consent rate = number of parents who returned the contact card and agreed to participate in the study
eligible population.
c Response rate for the baseline survey = number of completed baseline surveys
number of parents who returned the contact card and agreed to participate in the study.
d Response rate for the follow-up survey = number of completed follow-up surveysnumber of completed baseline surveys
.

13
b. Data editing
To prepare the analysis data files, the following edits were made to the survey data:
● Responses to categorical questions were verified to ensure that they corresponded to a valid
response.
● To eliminate responses from parents with more than one child in the study, contact card
information was used to determine duplicate households. When necessary, one response from
each household was randomly selected for inclusion in the analysis.
● For questions with an “other, specify” response, responses were coded to existing categorical
responses and additional response codes were added as necessary. Additions of response codes are
noted in the survey result tables. Open-ended responses recorded in Spanish at the data entry stage
were translated to English and provided in the final dataset.
c. File production
Preparing the analysis data file for the impact analysis required several steps as described below.
● Combine the mail survey and phone survey responses. For the follow-up survey, in cases where a
CATI survey was completed before a mail survey was received for the same respondent, the mail
survey data were kept for analysis.
● Create derived variables: Several analysis variables were derived using the survey responses. Creation
of these variables is described in the next section.
6. Impact Analysis
The independent evaluation assessed the impacts of the BASICS and BASICS Plus programs on children’s
daily at-home consumption of fruits and vegetables and use of 1 percent or skim milk. This was
accomplished by first comparing each program to a no-treatment comparison group and then comparing the
two programs to each other.
a. Description of measures and variables used in statistical analyses
The contact card collected information on the child’s age and gender, and the baseline survey collected
demographic information on the parent or caregiver respondent and their household. Exhibit H-3
identifies the demographic variables included in the impact analysis and provides information on
procedures used to derive new variables.
The baseline and follow-up surveys collected information on the primary outcomes, the child secondary
outcomes, and the parent secondary outcomes. Exhibits H-4 through H-6 identify the variables for the
impact analysis and provide information on procedures used to derive new variables.

1
4
Exhibit H-3.— Description of Demographics Variables Used in the Analysis
Variable Question(s)a Analysis Variable Derivation
Child sex Contact card Female children were included as the reference group for the analysis.
Child age Question 33, “In what month was the child
who is participating in the “What Does Your Child Eat” study born?”
Question 34, “In what year was the child who is participating in the “What Does Your Child Eat” study born?”
Child’s age was determined using the date of birth information
provided during the baseline survey (month and year of birth) and the date the baseline survey was conducted.
Respondent age Question 28, “What is your age?” Age categories were combined to create a three-level categorical
variable: “18 to 34” (reference group for the analysis), “35 to 44,” and “45 or older.”
Respondent sex Question 29, “What is your gender?” Female respondents were included as the reference group for the analysis.
Size of household Question 26, “How many people under 18 years of age live in your household?”
Question 27, “Including yourself, how many people 18 years or older live in your household?”
Responses to the two questions were summed to calculate the total
number of individuals in the household, provided the respondent provided information for both questions.
Respondent race or ethnicity
Question 30, “Are you Hispanic or Latino?”
Question 31, “What is your race?” Multiple
responses were allowed for the race question.
Responses to the two questions were combined to create a four-level
categorical variable. Respondents indicating they were Hispanic or Latino were given priority over other race and ethnicity designations and assigned to “Hispanic.” Respondents indicating they were not Hispanic and only selected Black or African-American as their race were assigned to “Black, non-Hispanic.” Respondents indicating they
were not Hispanic and only selected White or Caucasian as their race were assigned to “White, non-Hispanic,” and this is the reference group for the analysis. Respondents indicating they were American Indian or Alaska Native, Asian or Native Hawaiian, or who selected more than one race were assigned to “other or more than one.”

1
5
Exhibit H-4.— Description of Primary Outcome Variables
Variable Question(s) Analysis Variable Derivation
Cups of fruits Question 3, “Think about what your child ate during
the past week. About how many cups of fruit did your child eat on a typical day? Do NOT include fruit juice.”a
Continuous variable in half-cup increments.
Cups of vegetables Question 5, “Think about what your child ate during
the past week. About how many cups of vegetables did your child eat on a typical day? Do NOT include white potatoes, French fries, or vegetable juice.”a
Continuous variable in half-cup increments.
Cups of fruits and vegetables
Questions 3 and 5 (above) Summed responses to questions 3 and 5 to create continuous variable in half-cup increments.
Used 1 percent or skim
milk
Question 13, “Did your child drink milk or use milk on
his/her cereal at home during the past week?” and
Question 14, “What kind of milk did your child use
most often?”
Responses to the two questions were combined to
create a binary variable with those indicating that their child used or drank 1 percent or fat-free milk assigned a value of “1,” and those indicating that their child did not use milk or used whole or 2 percent milk assigned a value of “0.”
a Response options were in half-cup increments ranging from 0 to 3 cups. Mail questionnaires provided visuals for cups of fruits and cups of vegetables.

1
6
Exhibit H-5.— Description of Child Secondary Outcome Variables
Variable Question(s) Analysis Variable Derivation
Ate variety of fruits Question 2, “How many days during the past
week did your child eat more than one kind of fruit each day? Do NOT include fruit juice.”a
Created continuous variable ranging from 0 to
7 using the midpoint for the 2-day responses (e.g., “1 to 2 days” was assigned a value of 1.5).
Ate variety of vegetables Question 4, “How many days during the past
week did your child eat more than one kind of vegetable each day? Do NOT include white potatoes, French fries, or vegetable juice.”a
Created continuous variable ranging from 0 to
7 using the midpoint for the 2-day responses.
Willingness to try new fruits Question 7, “Is your child willing to try a new kind of fruit?”
Created binary variable with “Yes” responses
assigned a value of “1” and “No” or “Maybe” responses assigned a value of “0.”
Willingness to try new vegetables Question 10, “Is your child willing to try a new kind of vegetable?”
Created binary variable with “Yes” responses
assigned a value of “1” and “No” or “Maybe” responses assigned a value of “0.”
Asked parent to buy certain fruit Question 18, “During the past month, how often
did your child ask you to buy a certain type of fruit?” b
Created continuous variable ranging from 0 (“never”) to 4 (“always”).
Asked parent to buy certain vegetable Question 19, “During the past month, how often
did your child ask you to buy a certain type of vegetable?” b
Created continuous variable ranging from 0 (“never”) to 4 (“always”).
a Response options were “None,” “1 to 2 days,” “3 to 4 days,” “5 to 6 days,” and “Every day.”
b Response options were “Never,” “Seldom,” “Sometimes,” “Often,” and “Always.”

1
7
Exhibit H-6.— Description of Parent Secondary Outcome Variables
Variable Question(s) Analysis Variable Derivation
Availability of fruits and vegetables Question 1, “Were any of the following foods
available in your home during the past week? bananas, apples, grapes, raisins,
pears, celery, carrots, cucumbers, broccoli, and zucchini Include fresh, frozen, canned, and dried foods.”
Created continuous variable ranging from 0 to
10 based on the number of “Yes” responses for availability of 10 fruits and vegetables
Parent offered fruit as snack Question 8, “How many days during the past
week did you give your child fruit as a snack?”a
Created continuous variable ranging from 0 to
7 using the midpoint for the 2-day responses.
Parent offered fruit at dinner Question 10, “How many days during the past
week did you give your child fruit at dinner?”a
Created continuous variable ranging from 0 to
7 using the midpoint for the 2-day responses.
Parent offered vegetable as snack Question 11, “How many days during the past
week did you give your child a vegetable as a snack?”a
Created continuous variable ranging from 0 to
7 using the midpoint for the 2-day responses.
Parent offered vegetable at dinner Question 12, “How many days during the past
week did you give your child a vegetable at dinner?”a
Created continuous variable ranging from 0 to
7 using the midpoint for the 2-day responses.
Parent offered milk at dinner Question 15, “How many days during the past
week did you give your child milk to drink at dinner?”
Created continuous variable ranging from 0 to
7 using the midpoint for the 2-day responses.
Parent ate fruit for a snack Question 22, “How many days during the past week did you eat fruit for a snack? Do NOT include fruit juice.”
Created continuous variable ranging from 0 to 7 using the midpoint for the 2-day responses.
Parent ate vegetable for a snack Question 23, “How many days during the past
week did you eat vegetables for a snack? Do NOT include white potatoes, French fries, or vegetable juice.”
Created continuous variable ranging from 0 to
7 using the midpoint for the 2-day responses.
Strongly agree: Parent can encourage
child to try new fruits or vegetables
Question 17e, “I can encourage my child to try
new fruits or vegetables.”
Created binary variable with “Strongly agree”
responses assigned a value of “1” and “Agree,” “Disagree,” and “Strongly disagree” responses assigned a value of “0.”
(continued)

1
8
Exhibit H-6.— Description of Parent Secondary Outcome Variables (continued)
Variable Question(s) Analysis Variable Derivation
Agree: I usually drink 1 percent or skim milk
Question 17f, “I usually drink 1 percent or skim milk.”
Created binary variable with “Strongly agree”
and “Agree” responses assigned a value of “1” and “Disagree” and “Strongly disagree” responses assigned a value of “0.”
Agree: I believe that 1 percent or skim
milk is healthier for my child than whole milk
Question 16, “Which one of these statements
best describes how you feel about the milk you give your third-grade child?”
Created binary variable with respondents who
selected this statement to describe how they feel about the milk they give their third-
grade child assigned a value of 1 and all others 0.
a Response options were “None,” “1 to 2 days,” “3 to 4 days,” “5 to 6 days,” and “Every day.”
b Response options were “Strongly agree,” “Agree,” “Disagree ,” and “Strongly disagree .”

b. Model selection
The independent evaluation of the BASICS program was based on a quasi-experimental design that
included 11 schools in each intervention and comparison group. A fully randomized design was not
appropriate given social marketing campaigns are inherently ecological and pose risk of contamination
when applied using random assignment of schools to study conditions.
c. Repeated-measures cohort models for program outcomes
BASICS was evaluated with a research design that includes multiple levels of nesting. The term “nested”
refers to situations that arise when one unit of analysis is uniquely located in a supra-ordinate unit of
analysis (i.e., cluster). The independent evaluation of BASICS included repeated measures on individual
respondents (e.g., observation nested within respondent), with respondents who are nested within schools
and schools that are nested in a study condition (i.e., intervention or comparison). When data are nested,
responses within the same cluster tend to be correlated. If the correlated nature of the data is ignored in
the selection and specification of the model, it is likely to lead to inflated type-I error rates. The study
team developed a series of hierarchical, or mixed-effects, regression models to evaluate BASICS
outcomes. These models account for correlated responses by allowing for the inclusion of multiple
sources of random variation.
Additional detail on the sampling models and link functions that describe the statistical models used to
assess program outcomes and the structural models that detail the explanatory variables and the model
coefficients is provided below. The sampling models vary at level one depending on the characteristics of
the outcome measure; these characteristics determine the appropriate link function. All sampling models
at level two and higher are assumed to conform to the assumptions of linearity (McCulloch & Searle,
2001; Raudenbush & Bryk, 2002).
Primary outcomes include parents’ reports on children’s fruit and vegetable consumption in the home and
a combined fruit and vegetable score derived from these measures. These outcomes have a continuous
measure, so general linear mixed models with Gaussian (i.e., normal) distributions and an identity link
function were employed. Secondary impact variables included both continuous and dichotomous
measures. For those based on dichotomous measures, generalized linear mixed models with a binomial
distribution and a logit link function were employed.
The structural model is assumed to be a linear and additive function of the outcome variable; for the binary
models, the assumptions of linearity and additivity apply to the transformed outcome variable. These
models are determined by the research question addressed rather than by the characteristics of the outcome.
i. Sampling models and linking functions
The sampling model describes the expectation and distributional characteristics of the outcome at each
level of the model. For the variables that constitute the outcomes of interest for this evaluation, level-one
sampling models vary according to the characteristics of the outcome under consideration.
For variables that express the outcome of interest as a continuous measure, the level-one sampling model
can be expressed as
2
: : : : : :| ~ ,ti j k ti j k ti j kY N . (1)

This indicates that, given the predicted value : :ti j k
, the outcome : :ti j kY measured at time t (t = 0, 1) for
respondent i (i = 1... m) from the jth center (j = 1…10) assigned to the k
th condition (k = 0, 1) is normally
distributed with expected value of :j:μti k
and a constant variance, 2 . The expectations of these values are
expressed as
:j: :j: :j:|ti k ti k ti kE Y and
2
:j: :j:Var ti k ti kY | μ σ (2)
for the mean and variance, respectively. When the outcome of interest follows a normal distribution, it
can be expressed directly as a function of a set of explanatory variables. However, to simplify the
expression of the structural models that follow, note that
:j: :j:ti k ti k
, (3)
which indicates that the modeled outcome :j:ti k
is equal to the expected value of : :ti j kY .
The level-one sampling model for variables that express the outcome of interest as a binary outcome
follows a binomial distribution that can be expressed as
:j: :j: :j: :j:| ~ ,ti k ti k ti k ti kY B s
, (4)
where :j:ti kY is the number of “successes” in each of
:j:ti ks trials, and :j:ti k
represents the probability of
success on each trial. In the evaluation of BASICS, :j:ti ks = 1 and the binary variable follows a Bernoulli
distribution where :j:ti kY takes on the value 1 (success) with probability
:j:ti k, and the expected value and
variance of :j:ti kY can be expressed as
:j: :j: :j:|ti k ti k ti kE Y and
:j: :j: :j: :j:Var | 1ti k ti k ti k ti kY . (5)
The canonical link when the level-one sampling distribution is binomial is the logit link, which can be
expressed as follows:
:j:
:j:
:j:
log1ti k
ti k
ti k
(6)
and indicates that the modeled outcome : :ti j k
is equal to the log of the odds of success.
The sampling distributions for level-two (and higher) models express the characteristics of the modeled
random effects. Here, the term 0: :j ku is used to indicate random effects. For all of the structural models
presented below, random effects are assumed to follow a normal distribution with
2
0 : 0 : 0 :: j k : j k : j k uu | ~ N ,σ . (7)
ii. Structural models
The structural models are used to express the expectation of the outcome as the function of a series of
explanatory variables. In general form,
: : : 0 : 0 :ti: j k ti: j k ti: j k : j k : j kx β z u . (8)
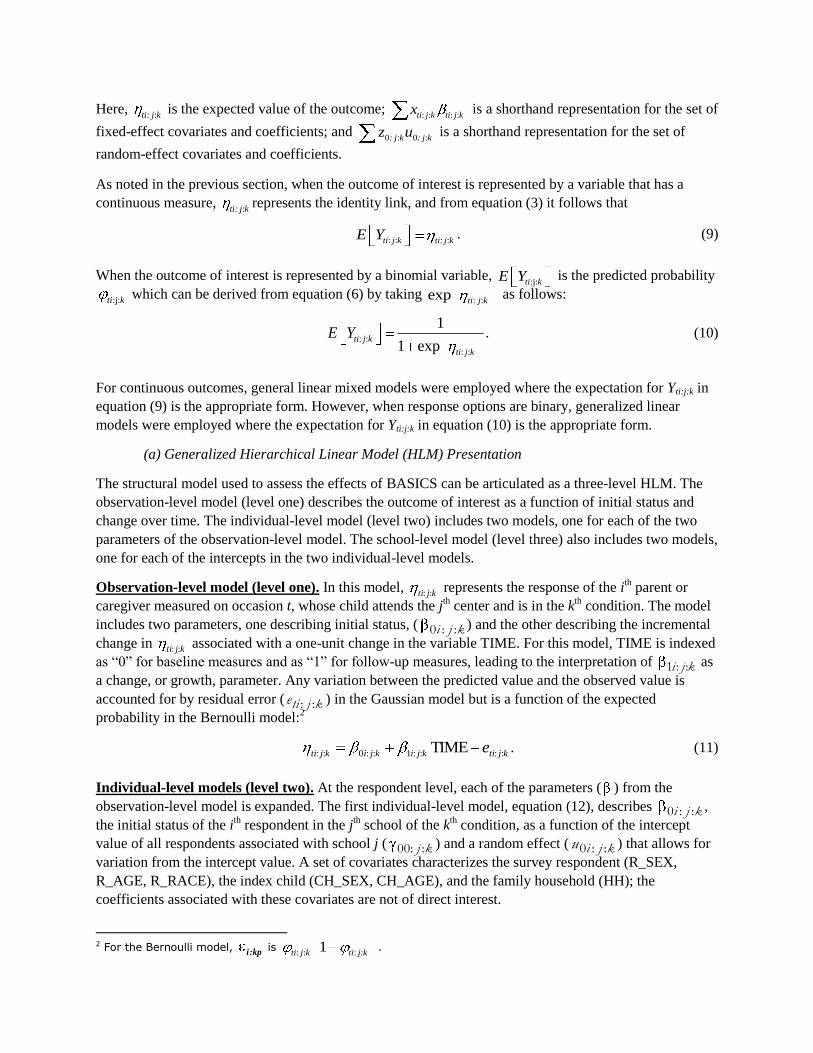
Here, :ti: j k
is the expected value of the outcome; : : : :ti j k ti j kx is a shorthand representation for the set of
fixed-effect covariates and coefficients; and 0 : 0 :: j k : j kz u is a shorthand representation for the set of
random-effect covariates and coefficients.
As noted in the previous section, when the outcome of interest is represented by a variable that has a
continuous measure, :ti: j k
represents the identity link, and from equation (3) it follows that
: : : :ti j k ti j kE Y . (9)
When the outcome of interest is represented by a binomial variable, :j:ti kE Y is the predicted probability
:j:ti k which can be derived from equation (6) by taking
:exp ti: j k as follows:
: :
: :
1
1 expti j k
ti j k
E Y . (10)
For continuous outcomes, general linear mixed models were employed where the expectation for Yti:j:k in
equation (9) is the appropriate form. However, when response options are binary, generalized linear
models were employed where the expectation for Yti:j:k in equation (10) is the appropriate form.
(a) Generalized Hierarchical Linear Model (HLM) Presentation
The structural model used to assess the effects of BASICS can be articulated as a three-level HLM. The
observation-level model (level one) describes the outcome of interest as a function of initial status and
change over time. The individual-level model (level two) includes two models, one for each of the two
parameters of the observation-level model. The school-level model (level three) also includes two models,
one for each of the intercepts in the two individual-level models.
Observation-level model (level one). In this model, kjti :: represents the response of the ith parent or
caregiver measured on occasion t, whose child attends the jth center and is in the k
th condition. The model
includes two parameters, one describing initial status, ( kji ::0 ) and the other describing the incremental
change in kjti :: associated with a one-unit change in the variable TIME. For this model, TIME is indexed
as “0” for baseline measures and as “1” for follow-up measures, leading to the interpretation of kji ::1 as
a change, or growth, parameter. Any variation between the predicted value and the observed value is
accounted for by residual error ( kjtie :: ) in the Gaussian model but is a function of the expected
probability in the Bernoulli model:2
kjtikjikjikjti e ::::1::0:: TIME . (11)
Individual-level models (level two). At the respondent level, each of the parameters ( ) from the
observation-level model is expanded. The first individual-level model, equation (12), describes kji ::0 ,
the initial status of the ith respondent in the j
th school of the k
th condition, as a function of the intercept
value of all respondents associated with school j ( kj ::00 ) and a random effect ( kjiu ::0 ) that allows for
variation from the intercept value. A set of covariates characterizes the survey respondent (R_SEX,
R_AGE, R_RACE), the index child (CH_SEX, CH_AGE), and the family household (HH); the
coefficients associated with these covariates are not of direct interest.
2 For the Bernoulli model,
kp:i is
: : : :1ti j k ti j k.

0 : : 00: : 01: : 02: : 03: : 04: :
05: : 06: : 0 : :
CH_SEX+ CH_AGE+ R_SEX+ R_AGE+
R_RACE+ HH
i j k j k j k j k j k j k
j k j k i j ku (12)
kjikjkji u ::1::10::1 (13)
The second student-level model, equation (13), describeskji ::1
, the change or growth over time of the ith
respondent in the jth school of the k
th condition as a function of the mean slope associated with school j
( ki ::10 ) and a random effect ( kjiu ::1 ) that allows for individual variation from the school-specific
slope. Given the structure of the data being modeled, kjiu ::1 is not directly estimable separate from
kjtie :: , as noted in the mixed model specification by the brackets [ ] in equation (16) below.
School-level models (level three). At the school level, the intercepts from the individual-level models are
expanded. The first school-level model. equation (14), describes kj ::00 , the initial status of the jth school
of the kth condition as a function of the mean intercept value across all schools ( k:0:00 ) and random
effect ( kju ::00 ) that allows for school-to-school variation from the overall intercept value. This model
includes an indicator variable (COND) identifying schools as a member of either the intervention or
comparison condition; its coefficient ( k:1:00 ) accounts for any difference in initial status between
schools in the two conditions.
00: : 00:0: 00:1: 00: :CONDj k k k j ku (14)
kjkkkj u ::10:1:10:0:10::10 COND (15)
The second school-level model, equation (15), describes kj ::10 , the change over time of the jth school of
the kth condition as a function of the mean slope across all schools k:0:10 and a random effect that
( kju ::10 ) allows for school-to-school variation from the condition-specific mean slope. This model also
includes an indicator variable (COND) identifying schools as a member of either the intervention or
comparison condition; its coefficient ( k:1:10 ) accounts for any difference in mean slope between
schools in the two conditions.
(b) Generalized Mixed Model Presentation
The five models described above can be combined into the familiar mixed-effects model shown in
equation (16). In this expression of the model, fixed-effect terms are presented in standard typeface, and
random-effect terms are presented in bold typeface. Fixed effects associated with lambdas ( ) represent
school-level effects, while those associated with gammas ( ) represent individual-level effects.
: : 00:0: 00:1: 10:0: 10:1: 01: :
02: : 03: : 04: : 05: : 06: :
COND TIME COND*TIME CH_SEX
+ CH_AGE+ R_SEX+ R_AGE+ R_RACE+ HH
+
ti j k k k k k j k
j k j k j k j k j k
00:j:k 0i:j:k 10:j:k 1i:j:k ti:j:ku + u + u TIME + u TIME + e .
(16)
In equation (16), TIMEi:j:ku1 is the component of variation associated with repeated measures within a
person at a given point in time; as previously noted, that component cannot be estimated apart from

residual error in this model and is dropped from further notation. Thus,
kjtikjkjkji euuu ::::10::00::0 TIME represents the total variation in the outcome, Yti:j:k.
d. Analytic approaches for mixed-model regression
To account properly for the multiple sources of random variation that result from randomizing schools to
conditions with measurements taken on the child and parent nested within those schools, the study
specified multilevel regression equations using SAS PROC MIXED (SAS Institute, 2004) and SAS
PROC GLIMMIX (SAS Institute, 2006) for general and generalized linear mixed models, respectively.
These two procedures offer a flexible approach to modeling the longitudinal and multilevel regression
models specified here. A primary strength of the mixed model approach is that multiple random effects
can be modeled independently. Under the general linear mixed model, the random effects are assumed to
be independent and normally distributed; the random effects necessary to avoid misspecification for each
model are identified in the preceding subsection. The analyses can be extended to non-Gaussian data in
the generalized linear mixed model through the appropriate specification of an alternative error
distribution and link function. The standard errors estimated and significance tests conducted account for
the fact that schools (not the child/parent) are the units of random assignment.
The models were estimated using restricted maximum likelihood (REML) for general linear mixed
models and the restricted pseudo-likelihood (RPL) for generalized linear mixed models. These
approaches provide parameter estimates by maximizing the probability that the predicted values agree
with the observed data. They are iterative, similar to maximum likelihood (ML) estimation, but provide
separate estimation for fixed and random effects. Separate estimation of the fixed and random
components is less efficient, which may result in a slightly larger mean square error; however, estimates
obtained in this manner are considered preferable because they produce less of a downward bias than ML
estimates (Murray, 1998; SAS Institute, 2004, 2006).
e. Post Hoc Analyses to Assess Potential Influence of USDA Fresh Fruit and
Vegetable Program (FFVP)
In addition to the primary and secondary impact analyses, a series of post hoc analyses assessed the
potential influence of the USDA FFVP. FFVP is designed to introduce school children to different types
of produce outside the normal time frame for the National School Lunch and National School Breakfast
Program by providing children in participating schools with a variety of free fresh fruits and vegetables
throughout the school day (USDA, 2010). The program is seen as an important catalyst for change in
efforts to combat childhood obesity by helping children learn more healthful eating habits. Because FFVP
emulates certain aspects of the BASICS program, additional analyses examined FFVP participation as a
factor potentially contributing to the primary outcomes.
The first set of post hoc analyses included all schools in the evaluation of the BASICS program. The aim
of these analyses was to examine whether FFVP participation influenced the reported impacts of the
BASICS intervention on fruit and vegetable consumption across study conditions. The second set of post
hoc analyses compared FFVP schools and non-FFVP schools within study conditions. The aim of these
analyses was to examine whether FFVP influenced change over time in fruit and vegetable consumption
within study conditions.
BASICS Nutrition and Physical Activity Program INN ● Program Evaluation
Appendix I
Methodology for Assessment of the Demonstration
Project’s Evaluation

BASICS Nutrition and Physical Activity Program INN ● Program Evaluation

This appendix describes the methodology for the assessment of INN’s self-evaluation of the BASICS
program. It identifies the research questions, describes the research design and data sources, and discusses
the analysis approach.
1. Research Questions
The purpose of the assessment of INN’s self-evaluation was to provide a detailed description of their
evaluation methods, measure the quality of their evaluation, examine the soundness of the outcome
measures, and determine the strengths and weaknesses of the evaluation’s design and implementation.
Specifically, this assessment addressed the following three broad research questions:
● How did each demonstration project plan to and actually evaluate the success of its
intervention(s)?
● What were the results of each demonstration project’s evaluation, and how do they compare
with the independent evaluation?
● What lessons are learned about each demonstration project’s evaluation?
2. Research Design and Data Sources
Determining the effectiveness of INN’s evaluation required a clear understanding of the planning, design,
and implementation of the evaluation based on both objective and subjective measures. To the extent
possible, the assessment was based on objective information (e.g., the evaluation report prepared by INN).
Qualitative methods were used to gather in-depth information as well as perspectives of key players in the
evaluation (e.g., program administrators and the evaluation manager). The data sources for the assessment
of INN’s evaluation are described below, including the evaluation review form, evaluation cost form,
abstraction of INN’s evaluation report, and the interview guides for interviews with key informants.
a. Evaluation review form
To assess the quality of INN’s evaluation, the independent contractor used the evaluation review form
provided in appendix F. To develop the evaluation review form, a scoring tool based on the one used by
the Center for Substance Abuse Prevention in developing the National Registry of Evidence-based
Programs and Practices (NREPP) database (see http://nrepp.samhsa.gov/ for additional information) was
adapted.
The evaluation review form (see exhibit I-1) includes eight components, each of which is scored on a
scale of 1 to 5, with 1 = “missing or so poorly described that its value to the evaluation cannot be
determined” and 5 = “is appropriate for the program being evaluated and is presented in a way that shows
the evaluator has a clear understanding of its role in the evaluation.”
b. Evaluation cost form
To document the resources used and costs incurred by INN to evaluate the BASICS program, INN was
provided with a series of tables to complete at the end of their project. These tables, which were specific
to the evaluation phase of the BASICS project, were included in the previously referenced Research and
Expense Tracking Form (see appendix B for completed evaluation cost information). The format of the
tables and the information requested therein was consistent with FNS SNAP-Ed reporting requirements,
thus minimizing reporting burden. Specifically, data was requested on:

● Human capital (e.g., staff roles and responsibilities, number of FTEs, as well as averages
and ranges of salaries for each);
● Physical capital (e.g., printing, labels, computers, folders); and
● Line item expenditures (e.g., salary and benefits, materials, travel) by funding source (non-
federal or federal funds).
Exhibit I-1.—Criteria for Assessing the Quality of INN’s Self-evaluation
Evaluation Component Specific Criteria
Research objectives and hypothesis
● Clarity of research questions and hypotheses that the evaluation addresses
● Alignment of evaluation goals and objectives with intervention
activities
Viable comparison strategy ● Appropriateness of the control or comparison group
● Threats to the validity of the design
Sampling size and strategy ● Sample size estimation
● Method of selecting sample participants from population
● Recruitment plans
Outcome measures ● Quality of data collection instruments
● Alignment of evaluation measures with intervention activities
Data collection ● Overview of data collection schedule
● Rigor of data collection process
● Quality of the data collection process
Data analysis ● Sample characteristics and baseline comparability
● Statistical methods used to assess program impacts
● Additional statistical procedures and analyses
Attrition ● Attrition rate
Missing data ● Level of item nonresponse
The evaluation cost tables were completed by INN and submitted at the completion of the demonstration
project, or once all evaluation-related costs had been incurred. These forms were reviewed for
completeness, and this information was used to summarize INN evaluation-related costs.
c. Abstraction of demonstration project’s evaluation report
INN was provided with an outline for their evaluation report that followed directly from the evaluation
review form. The independent contractor reviewed and abstracted key information from the report to
complete the assessment of INN’s evaluation.
d. Pre-evaluation and post-evaluation interview guides for key informant
interviews
Primary data related to INN’s evaluation of the BASICS program was elicited from four key
stakeholders—the program manager, two evaluation managers, and evaluation assistant (doctoral
student)— through in-depth, open-ended discussions. This method was used to capture rich, subjective
information both pre- and post-intervention. A pre-intervention interview, which focused on the planning

and design of the evaluation, sought to capture the experiences and perspectives of, as well as lessons
learned by the outcomes coordinator on this phase of the project. Several questions related to anticipated
challenges were also administered at this time. A post-intervention interview with the evaluation
managers and assistant evaluation manager sought to capture similar information, but for the
implementation and analysis phases of the evaluation. Additionally, a post-intervention interview with a
similar focus was conducted with the BASICS program manager to document lessons learned with regard
to the evaluation from a programmatic perspective as well as plans for future evaluations of the BASICS
program. Because of the varying foci of the interviews at each of these key time periods, two interview
guides were developed—one for use prior to implementation and one for use post-intervention. The post-
intervention interview guide for the program manager consisted of a subset of questions that were
included in the outcomes coordinator interview guide. Each guide was developed to be as concise as
possible. Anticipated response time ranged from 15 to 60 minutes, based on the timing of the data
collection and respondent type.
3. Analysis Approach
The assessment of the evaluation conducted by INN included a descriptive assessment of the management
and costs of the evaluation; a descriptive assessment of the quality of their evaluation; a comparison of
INN’s study design and results with the FNS independent evaluation; and an assessment of lessons
learned based on the quality assessment, cost analysis, and reported factors affecting evaluation
implementation. The analysis procedures are described below.
a. Descriptive assessment of evaluation management and costs
To assess and describe INN’s management of their evaluation, including roles and responsibilities,
training, and aspects of quality control, the independent contractor gathered and compared descriptive
information provided by INN through their evaluation report and key informant interviews. An analysis
approach similar to that described for the process evaluation was used, which entailed compiling key
informant responses to each interview question into a master Microsoft Word 2007 document and
identifying direct quotations where relevant to support key findings. Costs associated with the
demonstration project’s own evaluation were reported directly by INN through the previously described
evaluation cost form; these numbers were reported as is and were not manipulated or used for any
additional calculations.
b. Descriptive assessment of the quality of INN’s self evaluation
To assess the quality of INN’s evaluation, the evaluation review form provided in appendix F was used.
The independent contractor had two people rate the evaluation (one rater was the designated impact
evaluation leader for the FNS evaluation). Inter-rater agreement was assessed, and a consensus score
reached. In addition to reporting the score for each evaluation component, a descriptive assessment of the
strengths and weaknesses of INN’s evaluation was prepared.
c. Comparison of INN’s study design and results with the FNS independent
evaluation
The independent contractor described the study design employed by INN for their evaluation and
compared this design with the design of the FNS independent evaluation, noting the similarities and
differences in the two research designs and anticipated effects. The description of INN’s evaluation was

based on the abstraction of INN’s application and evaluation report and the interview with the evaluation
manager and other program staff members.
The results of INN’s evaluation were compared with the FNS independent evaluation, noting whether the
results were similar or different in terms of direction and magnitude. The description of the results of
INN’s self-evaluation was based on the abstraction of INN’s evaluation report and the interview with the
evaluation manager and other program staff members.
d. Assessment of lessons learned
The independent contractor used information collected primarily through key informant interviews to
assess and describe lessons learned from the perspective of the demonstration project staff. Key informant
responses to each interview question were entered into a master Microsoft Word 2007 document to allow
for the identification of similarities and differences between lessons the program manager and other
program staff members reported learning through their evaluation of the BASICS program. The
assessment of lessons learned also described approaches for improving evaluations based on the
weaknesses identified in the assessment of the quality of INN’s self-evaluation.

BASICS Nutrition and Physical Activity Program INN ● Program Evaluation
Appendix J
References


J1. References
Altarum Institute and RTI International. (2009, February). Models of Supplemental Nutrition Assistance
Program Nutrition Education and Evaluation, final nutrition education impact
measurements/instruments template.
Bandura, A. (2004). Health promotion by social cognitive means. Health Education and Behavior, 31(2),
143–164.
Baranowski, T., Davis, M., Resnicow, K., Baranowski, J., Doyle, C., Lin. L., …, Want, D. T. (2000).
Gimme 5 fruit, juice, and vegetables for fun and health: Outcome evaluation. Health Education and
Behavior, 27(1), 96–111.
Blitstein, J. L., Hannan, P. J., Murray, D. M., & Shadish, W. R. (2005). Increasing the degrees of freedom
in existing group randomized trials: The df* approach. Evaluation Review, 29(3), 241–267.
Centers for Disease Control and Prevention. (2007). 2005–2006 National Health and Nutrition
Examination (NHANES) Survey. Retrieved from http://www.cdc.gov/nchs/nhanes.htm.
Cullen, K. W., Baranowski, T., Owens, E., Marsh, T., Rittenberry, L., & de Moor, C. (2003). Availability,
accessibility, and preferences for fruit, 100% fruit juice, and vegetables influence children’s dietary
behavior. Health Education and Behavior, 30(5), 615–626.
Evans, W. D., Necheles, J., Longjohn, M., & Christoffel, K. K. (2007). The 5-4-3-2-1 Go! intervention:
Social marketing strategies for nutrition. Journal of Nutrition Education and Behavior, 39(2,
supplement 1), s55–s59.
Drewnowski, A., & C. Hann (1999). Food preferences and reported frequencies of food consumption as
predictors of current diet in young women. American Journal of Clinical Nutrition, 70(1), 28–36.
Flay, B. R., Biglan, A., Boruch, R. F., Castro, F. G., Gottfredson, D., Kellam, S., et al. (2005). Standards
of evidence: Criteria for efficacy, effectiveness, and dissemination. Prevention Science, 6(3), 151–
175.
Fry, E. (1968). A readability formula that saves time. Journal of Reading, 11(7), 265–271.
Green, L. W., Kreuter, M. W., Deeds, S. G., & Partridge, K. B. (1980). Health education planning: A
diagnostic approach. Palo Alto, CA: Mayfield Publishing Co.
Iowa Nutrition Network. (2012). Models of SNAP Nutrition Education and Evaluation - Wave 2: INN
Impact Evaluation Report. Submitted to Altarum Institute and RTI International.
Iowa Nutrition Network. (2009). Application: Models of SNAP Nutrition Education and Evaluation.
Jackson, C. J. (2004). An evaluation of the use of theater in nutrition education for low-income African-
American children. (Unpublished master’s thesis). Athens, GA: University of Georgia.

Jamelske, E., Bica, L. A., McCarty, D. J., & Meinen, A. (2008). Preliminary findings from an evaluation
of the USDA fresh fruit and vegetable program in Wisconsin schools. Wisconsin Medical Journal,
107(5), 225–230.
Knai, C., Pomerleau, J., Lock, K., & McKee, M. (2006). Getting children to eat more fruit and vegetables:
A systematic review. Preventive Medicine, 42(2), 85–95.
Marsh, T., Cullen, K. W., & Baranowski, T. (2003). Validation of a fruit, juice, and vegetable availability
questionnaire. Journal of Nutrition Education Behavior, 35, 100–104.
McCulloch, C. E., & Searle, S. R. (2001). Generalized, linear, and mixed models. New York: John Wiley
and Sons, Inc.
Mullen, P. D., Hersey, J. C., & Iverson, D. C. (1987). Health behavior models compared. Social Science
and Medicine, 24, 973–981.
Murray, D. M. (1998). Design and analysis of group-randomized trials. New York: Oxford University
Press.
Murray, D. M., Hannan, P. J., & Baker, W. L. (1996). A Monte Carlo study of alternative responses to
intraclass correlation in community trails: Is it ever possible to avoid Cornfield’s penalties?
Evaluation Review, 20(3), 313–337.
Murray, D. M., Phillips, G. A., Birnbaum, A. S., & Lytle, L. A. (2001). Intraclass correlation for measures
from a middle school nutrition intervention study: Estimates, correlates, and applications. Health,
Education, and Behavior, 28(6), 666–679.
Nicholls, J.A., and P. Cullen. 2004. “The Child–Parent Purchase Relationship: ‘Pester Power,’ Human
Rights and Retail Ethics.” Journal of Retailing and Consumer Services 11:75-86.
Raudenbush, S. W., & Bryk, A. S. (2002). Hierarchical linear models: Applications and data analysis
methods (2nd ed.). Thousand Oaks, CA: Sage Publications.
SAS Institute (2004). SAS procedures guide, on-line version 9. Cary, NC: SAS Institute, Inc.
SAS Institute (2006). Multilevel modeling of hierarchical and longitudinal data using SAS. Cary, NC:
SAS Institute, Inc.
Shadish, W. R., Cook, T. D., Campbell, D. T. (2002). Experimental and quasi-experimental designs for
generalized causal influence. Boston: Houghton Mifflin.
Snyder, L. B., Hamilton, M. A., Mitchell, E. W., Kiwanyka-Tondo, J., Fleming-Milici, F., & Proctor, D.
(2004). A meta-analysis of the effect of mediated health communication campaigns on behavior
change in the United States. Journal of Health Communications, 9, 71–96.
Thomson, C. A., & Ravia, J. (2011). A systematic review of behavioral interventions to promote intake of
fruit and vegetables. Journal of the American Dietetic Association, 111(10), 1523–1535.

Townsend, M. S., Kaiser, L. L., Allen, L., Joy, A., & Murphy, S. (2003). Selecting items for a food
behavior checklist for a limited-resource audience. Journal of Nutrition Education and Behavior,
35(2), 69–82.
Townsend, M., Sylva, K., Martin, A., Metz, D., & Wooten-Swanson, P. (2008). Improving readability of
an evaluation tool for low-income clients using visual information processing theories. Journal of
Nutrition Education and Behavior, 40(3), 181–186.
U.S. Department of Agriculture. (2011, August 4). ChooseMyPlate.gov. Retrieved from
http://www.choosemyplate.gov.
U.S. Department of Agriculture, Center for Nutrition Policy and Promotion. (2011). 2010 Dietary
Guidelines for Americans. Retrieved from http://www.cnpp.usda.gov/dietaryguidelines.htm
U.S. Department of Agriculture, Food and Nutrition Service. (2004) Food Stamp Nutrition Education
Systems Review. Retrieved from
http://www.fns.usda.gov/Ora/menu/Published/NutritionEducation/Files/FSNESystemsReview.pdf
U.S. Department of Agriculture, Food and Nutrition Service. (1999). Evaluation of statewide nutrition
education networks. Washington, DC: Research Triangle International and Health Systems Research,
Inc. Retrieved from
http://www.fns.usda.gov/Ora/menu/Published/NutritionEducation/Files/NetReport2.PDF.
U.S. Department of Agriculture, Food and Nutrition Service. (2010, March). USDA expands access to
fresh fruits and vegetables for schools across the nation. Investment aims to improve nutrition and
provide economic opportunities to producers. Press Release No. 0133.11. Retrieved from
http://www.fns.usda.gov/cga/PressReleases/2011/0133.htm.
U.S. Department of Agriculture, Food and Nutrition Service. (2012). Supplemental Nutrition Assistance
Program Education Guidance: Nutrition Education and Obesity Prevention Grant Program.
Retrieved from http://www.nal.usda.gov/fsn/Guidance/FY2013SNAP-EdGuidance.pdf.
U.S. Department of Agriculture, Food and Nutrition Service. (2006, September). Food Stamp Nutrition
Education systems review: Final report. Retrieved from
http://www.fns.usda.gov/ora/menu/published/NutritionEducation/Files/FSNEP-FinalReport.pdf.
Zucker, D. M. (1990). An analysis of variance pitfall: The fixed effects analysis in a nested design.
Education and Psychological Measurement, 50, 731–738.