iowa achievement gaps legislative report · an in-depth evaluation of the achievement gap using a...
TRANSCRIPT
Iowa Achievement Gaps
Legislative Report
Iowa Department of Education
August 2014

Iowa Department of Education Page | 1
State of Iowa
Department of Education Grimes State Office Building
400 E. 14th Street Des Moines, IA 50319-0146
State Board of Education
Charles C. Edwards, Jr., President, Des Moines Michael L. Knedler, Vice President, Council Bluffs Brooke Axiotis, Des Moines Michael Bearden, Gladbrook Diane Crookham-Johnson, Oskaloosa Angela English, Dyersville Rosie Hussey, Clear Lake Mike May, Spirit Lake Mary Ellen Miller, Wayne County Hannah Rens, Student Member, Sioux City
Administration
Brad A. Buck, Director and Executive Officer of the State Board of Education
Division of Learning and Results W. David Tilly, Deputy Director
Bureau of Information and Analysis Services Jay Pennington, Chief
It is the policy of the Iowa Department of Education not to discriminate on the basis of race, creed, color, sexual orientation, gender identity, national origin, sex, disability, religion, age, political party affiliation, or actual or potential parental, family or marital status in its programs, activities, or employment practices as required by the Iowa Code sections 216.9 and 256.10(2), Titles VI and VII of the Civil Rights Act of 1964 (42 U.S.C. § 2000d and 2000e), the Equal Pay Act of 1973 (29 U.S.C. § 206, et seq.), Title IX (Educational Amendments, 20 U.S.C.§§ 1681 – 1688), Section 504 (Rehabilitation Act of 1973, 29 U.S.C. § 794), and the Americans with Disabilities Act (42 U.S.C. § 12101, et seq.). If you have questions or complaints related to compliance with this policy by the Iowa Department of Education, please contact the legal counsel for the Iowa Department of Education, Grimes State Office Building, 400 E. 14th Street, Des Moines, IA 50319-0146, telephone number: 515-281-5295, or the Director of the Office for Civil Rights, U.S. Department of Education, Citigroup Center, 500 W. Madison Street, Suite 1475, Chicago, IL 60661-4544, telephone number: 312-730-1560, FAX number: 312-730-1576, TDD number: 877-521-2172, email: [email protected].
Iowa Department of Education Page | 2
Achievement Gaps Report Requirement Prepare and submit to the chairpersons and ranking members of the senate and house education committees a report on the state’s progress toward closing the achievement gap, including student achievement for minority subgroups, and a comprehensive summary of state agency and local district activities and practices taken in the past year to close the achievement gap.

Iowa Department of Education Page | 3
Executive Summary Achievement gaps occur when one group of students outperforms another group and the difference in average scores for the two groups is meaningfully significant. The gaps between race/ethnicity and socioeconomic subgroups are not unique to Iowa, and other states are also struggling to find answers to close these gaps. Countless studies have documented these disparities and investigated the many underlying reasons for them, but still they persist. The National Assessment on Educational Progress (NAEP) reports on the Hispanic-White achievement gap and the Black-White achievement gap using NAEP scores in mathematics and reading for these groups to illuminate patterns and changes in these gaps over time. These reports can be read in their entirety at http://nces.ed.gov/nationsreportcard/studies/gaps/. This analysis focuses on fourth grade reading and eighth grade mathematics in order to provide an in-depth evaluation of the achievement gap using a consistent set of information. The data in this report comes from NAEP, the Iowa Assessments, and ACT. No matter which of these indicators is used, the report is the same: Unacceptable achievement gaps persist in reading and mathematics in Iowa’s schools.
Iowa Department of Education Page | 4
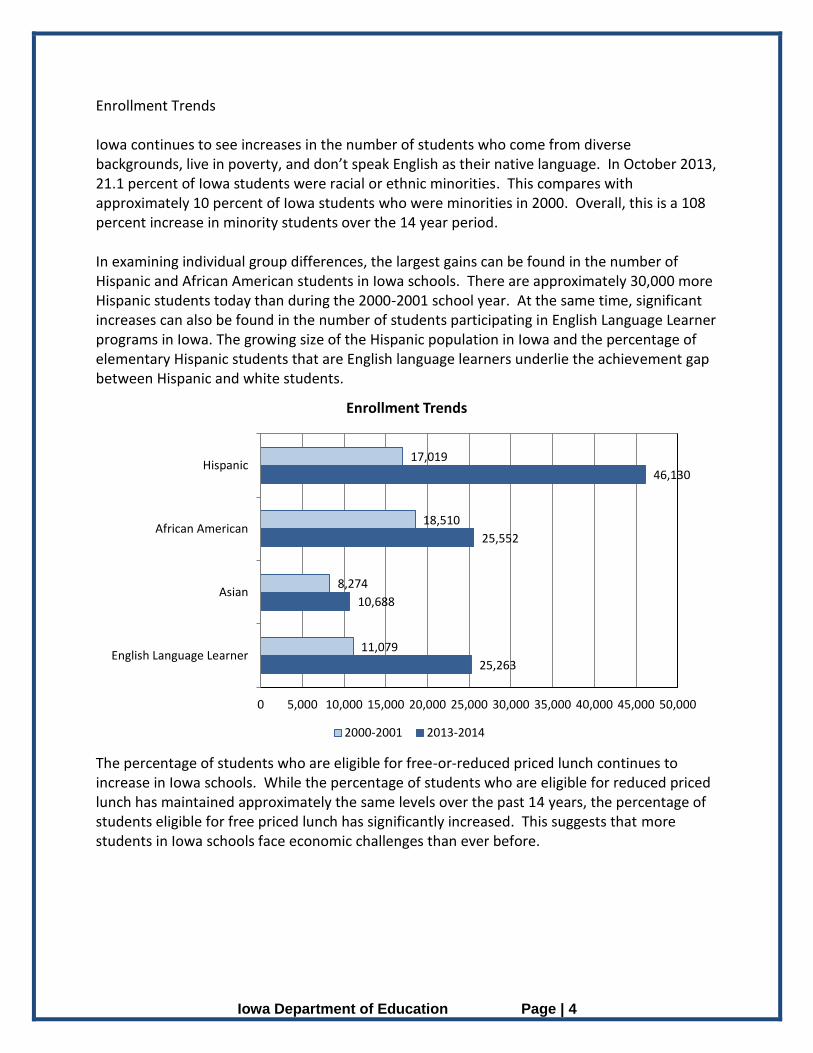
Enrollment Trends Iowa continues to see increases in the number of students who come from diverse backgrounds, live in poverty, and don’t speak English as their native language. In October 2013, 21.1 percent of Iowa students were racial or ethnic minorities. This compares with approximately 10 percent of Iowa students who were minorities in 2000. Overall, this is a 108 percent increase in minority students over the 14 year period. In examining individual group differences, the largest gains can be found in the number of Hispanic and African American students in Iowa schools. There are approximately 30,000 more Hispanic students today than during the 2000-2001 school year. At the same time, significant increases can also be found in the number of students participating in English Language Learner programs in Iowa. The growing size of the Hispanic population in Iowa and the percentage of elementary Hispanic students that are English language learners underlie the achievement gap between Hispanic and white students.
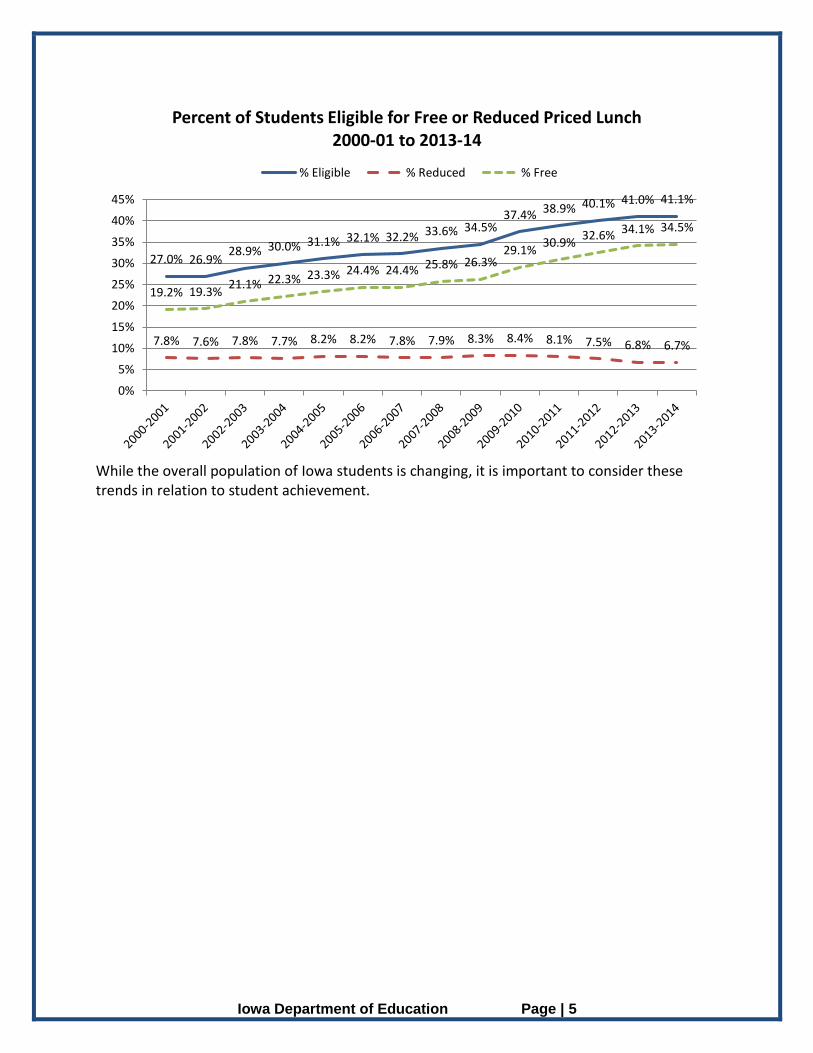
The percentage of students who are eligible for free-or-reduced priced lunch continues to increase in Iowa schools. While the percentage of students who are eligible for reduced priced lunch has maintained approximately the same levels over the past 14 years, the percentage of students eligible for free priced lunch has significantly increased. This suggests that more students in Iowa schools face economic challenges than ever before.
17,019
18,510
8,274
11,079
46,130
25,552
10,688
25,263
0 5,000 10,000 15,000 20,000 25,000 30,000 35,000 40,000 45,000 50,000
Hispanic
African American
Asian
English Language Learner
Enrollment Trends
2000-2001 2013-2014
Iowa Department of Education Page | 5
While the overall population of Iowa students is changing, it is important to consider these trends in relation to student achievement.
27.0% 26.9%28.9% 30.0% 31.1% 32.1% 32.2% 33.6% 34.5%
37.4% 38.9% 40.1% 41.0% 41.1%
7.8% 7.6% 7.8% 7.7% 8.2% 8.2% 7.8% 7.9% 8.3% 8.4% 8.1% 7.5% 6.8% 6.7%
19.2% 19.3%21.1% 22.3% 23.3% 24.4% 24.4% 25.8% 26.3%
29.1%30.9%
32.6% 34.1% 34.5%
0%
5%
10%
15%
20%
25%
30%
35%
40%
45%
Percent of Students Eligible for Free or Reduced Priced Lunch2000-01 to 2013-14
% Eligible % Reduced % Free
Iowa Department of Education Page | 6
Reading
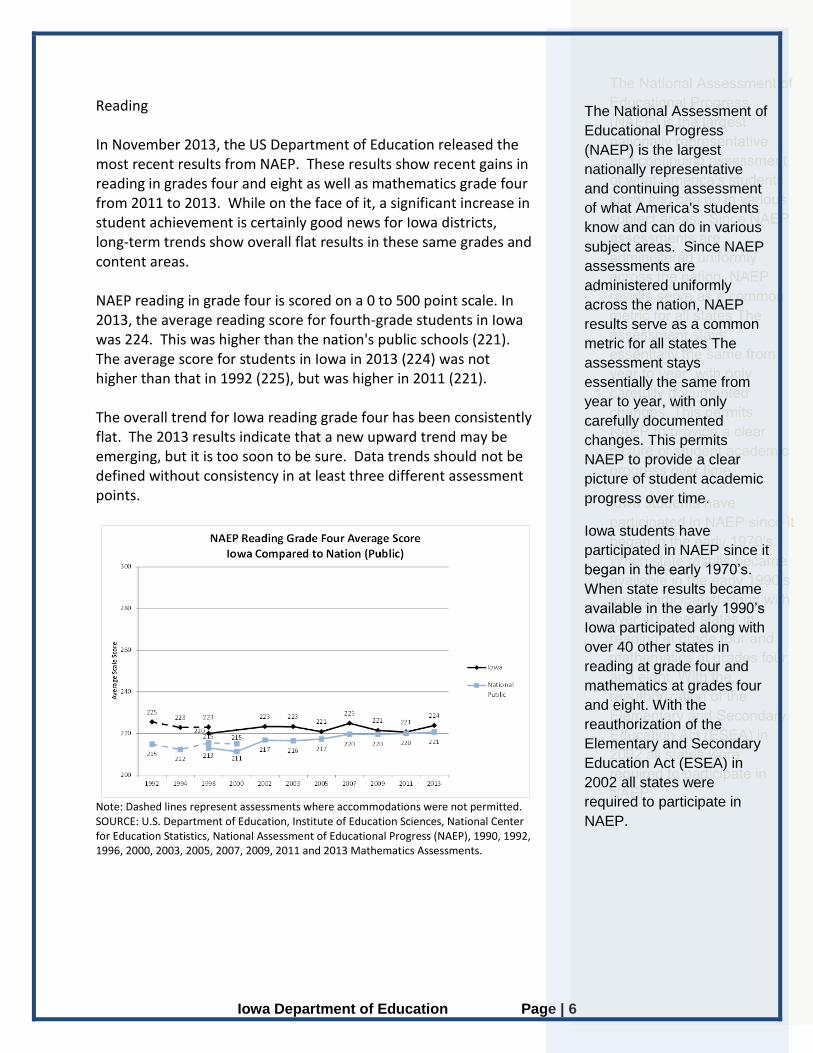
In November 2013, the US Department of Education released the most recent results from NAEP. These results show recent gains in reading in grades four and eight as well as mathematics grade four from 2011 to 2013. While on the face of it, a significant increase in student achievement is certainly good news for Iowa districts, long-term trends show overall flat results in these same grades and content areas. NAEP reading in grade four is scored on a 0 to 500 point scale. In 2013, the average reading score for fourth-grade students in Iowa was 224. This was higher than the nation's public schools (221). The average score for students in Iowa in 2013 (224) was not higher than that in 1992 (225), but was higher in 2011 (221). The overall trend for Iowa reading grade four has been consistently flat. The 2013 results indicate that a new upward trend may be emerging, but it is too soon to be sure. Data trends should not be defined without consistency in at least three different assessment points.
Note: Dashed lines represent assessments where accommodations were not permitted. SOURCE: U.S. Department of Education, Institute of Education Sciences, National Center for Education Statistics, National Assessment of Educational Progress (NAEP), 1990, 1992, 1996, 2000, 2003, 2005, 2007, 2009, 2011 and 2013 Mathematics Assessments.
The National Assessment of
Educational Progress
(NAEP) is the largest
nationally representative
and continuing assessment
of what America's students
know and can do in various
subject areas. Since NAEP
assessments are
administered uniformly
across the nation, NAEP
results serve as a common
metric for all states The
assessment stays
essentially the same from
year to year, with only
carefully documented
changes. This permits
NAEP to provide a clear
picture of student academic
progress over time.
Iowa students have
participated in NAEP since it
began in the early 1970’s.
When state results became
available in the early 1990’s
Iowa participated along with
over 40 other states in
reading at grade four and
mathematics at grades four
and eight. With the
reauthorization of the
Elementary and Secondary
Education Act (ESEA) in
2002 all states were
required to participate in
NAEP.
Iowa Department of Education Page | 7
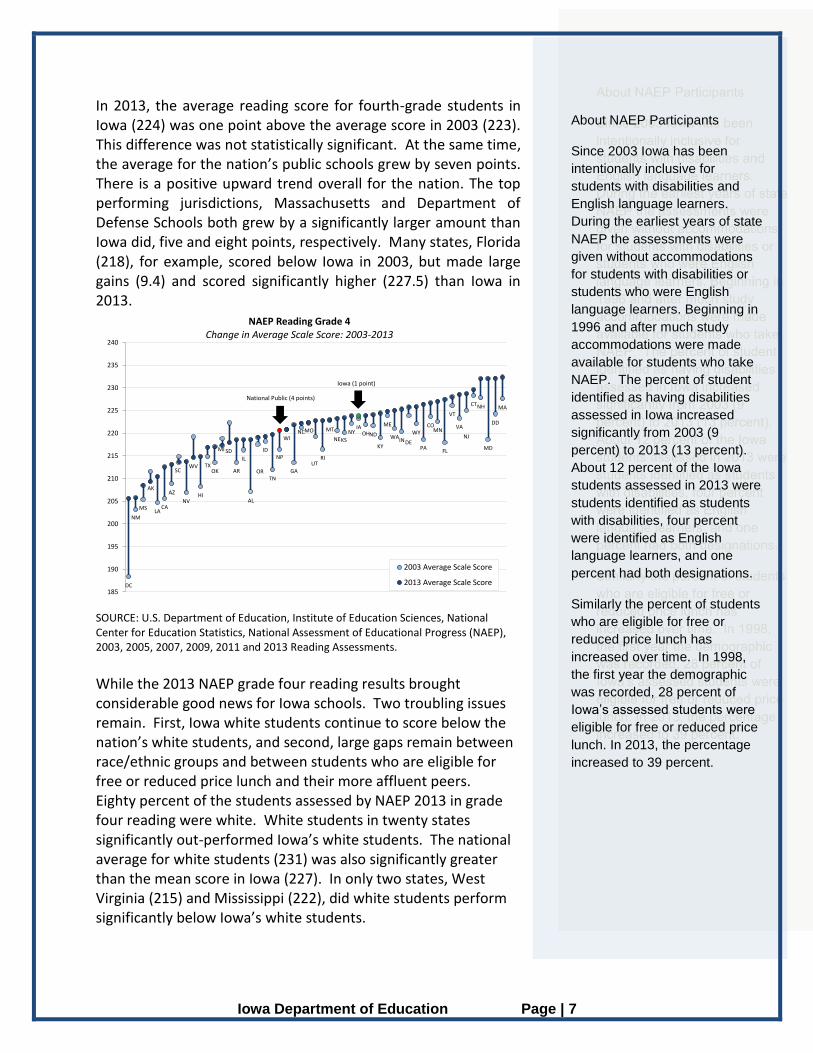
In 2013, the average reading score for fourth-grade students in Iowa (224) was one point above the average score in 2003 (223). This difference was not statistically significant. At the same time, the average for the nation’s public schools grew by seven points. There is a positive upward trend overall for the nation. The top performing jurisdictions, Massachusetts and Department of Defense Schools both grew by a significantly larger amount than Iowa did, five and eight points, respectively. Many states, Florida (218), for example, scored below Iowa in 2003, but made large gains (9.4) and scored significantly higher (227.5) than Iowa in 2013.
SOURCE: U.S. Department of Education, Institute of Education Sciences, National Center for Education Statistics, National Assessment of Educational Progress (NAEP), 2003, 2005, 2007, 2009, 2011 and 2013 Reading Assessments. While the 2013 NAEP grade four reading results brought considerable good news for Iowa schools. Two troubling issues remain. First, Iowa white students continue to score below the nation’s white students, and second, large gaps remain between race/ethnic groups and between students who are eligible for free or reduced price lunch and their more affluent peers. Eighty percent of the students assessed by NAEP 2013 in grade four reading were white. White students in twenty states significantly out-performed Iowa’s white students. The national average for white students (231) was also significantly greater than the mean score in Iowa (227). In only two states, West Virginia (215) and Mississippi (222), did white students perform significantly below Iowa’s white students.
DC
MS
AK
LACA
AZ
SC
NVHI
TXOK
MI SD
AR
IL
AL
ID
TN
WI
GA
MO
UTRI
MT
NENY
IAOHND
KY
ME
WAINDE
WY
PA
COMN
FL
VT
VA
CTNH
MD
DD
MA
NM
WVOR
NP
NC
KSNJ
185
190
195
200
205
210
215
220
225
230
235
240
NAEP Reading Grade 4Change in Average Scale Score: 2003-2013
2003 Average Scale Score
2013 Average Scale Score
Iowa (1 point)
National Public (4 points)
About NAEP Participants
Since 2003 Iowa has been
intentionally inclusive for
students with disabilities and
English language learners.
During the earliest years of state
NAEP the assessments were
given without accommodations
for students with disabilities or
students who were English
language learners. Beginning in
1996 and after much study
accommodations were made
available for students who take
NAEP. The percent of student
identified as having disabilities
assessed in Iowa increased
significantly from 2003 (9
percent) to 2013 (13 percent).
About 12 percent of the Iowa
students assessed in 2013 were
students identified as students
with disabilities, four percent
were identified as English
language learners, and one
percent had both designations.
Similarly the percent of students
who are eligible for free or
reduced price lunch has
increased over time. In 1998,
the first year the demographic
was recorded, 28 percent of
Iowa’s assessed students were
eligible for free or reduced price
lunch. In 2013, the percentage
increased to 39 percent.
Iowa Department of Education Page | 8
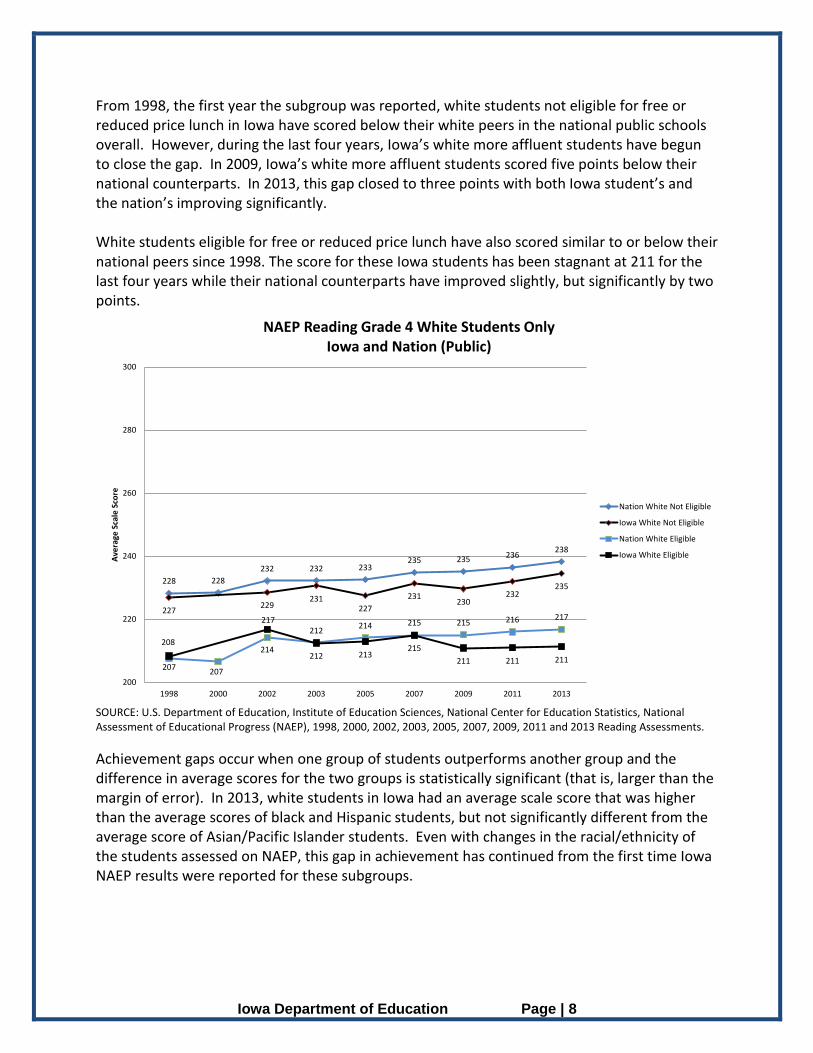
From 1998, the first year the subgroup was reported, white students not eligible for free or reduced price lunch in Iowa have scored below their white peers in the national public schools overall. However, during the last four years, Iowa’s white more affluent students have begun to close the gap. In 2009, Iowa’s white more affluent students scored five points below their national counterparts. In 2013, this gap closed to three points with both Iowa student’s and the nation’s improving significantly. White students eligible for free or reduced price lunch have also scored similar to or below their national peers since 1998. The score for these Iowa students has been stagnant at 211 for the last four years while their national counterparts have improved slightly, but significantly by two points.
SOURCE: U.S. Department of Education, Institute of Education Sciences, National Center for Education Statistics, National Assessment of Educational Progress (NAEP), 1998, 2000, 2002, 2003, 2005, 2007, 2009, 2011 and 2013 Reading Assessments.
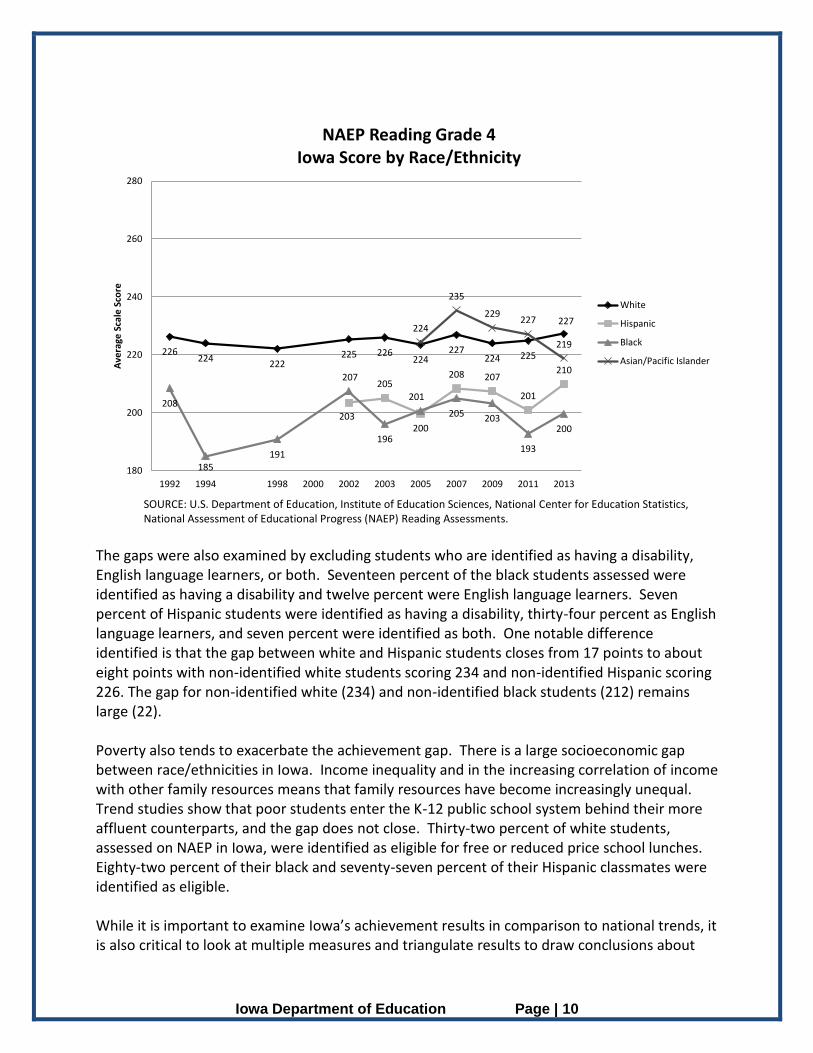
Achievement gaps occur when one group of students outperforms another group and the difference in average scores for the two groups is statistically significant (that is, larger than the margin of error). In 2013, white students in Iowa had an average scale score that was higher than the average scores of black and Hispanic students, but not significantly different from the average score of Asian/Pacific Islander students. Even with changes in the racial/ethnicity of the students assessed on NAEP, this gap in achievement has continued from the first time Iowa NAEP results were reported for these subgroups.
228 228
232 232 233235 235 236
238
227229
231227
231230
232235
207207
214
212214 215 215 216 217
208
217
212 213215
211 211 211
200
220
240
260
280
300
1998 2000 2002 2003 2005 2007 2009 2011 2013
Ave
rage
Sca
le S
core
NAEP Reading Grade 4 White Students OnlyIowa and Nation (Public)
Nation White Not Eligible
Iowa White Not Eligible
Nation White Eligible
Iowa White Eligible
Iowa Department of Education Page | 9
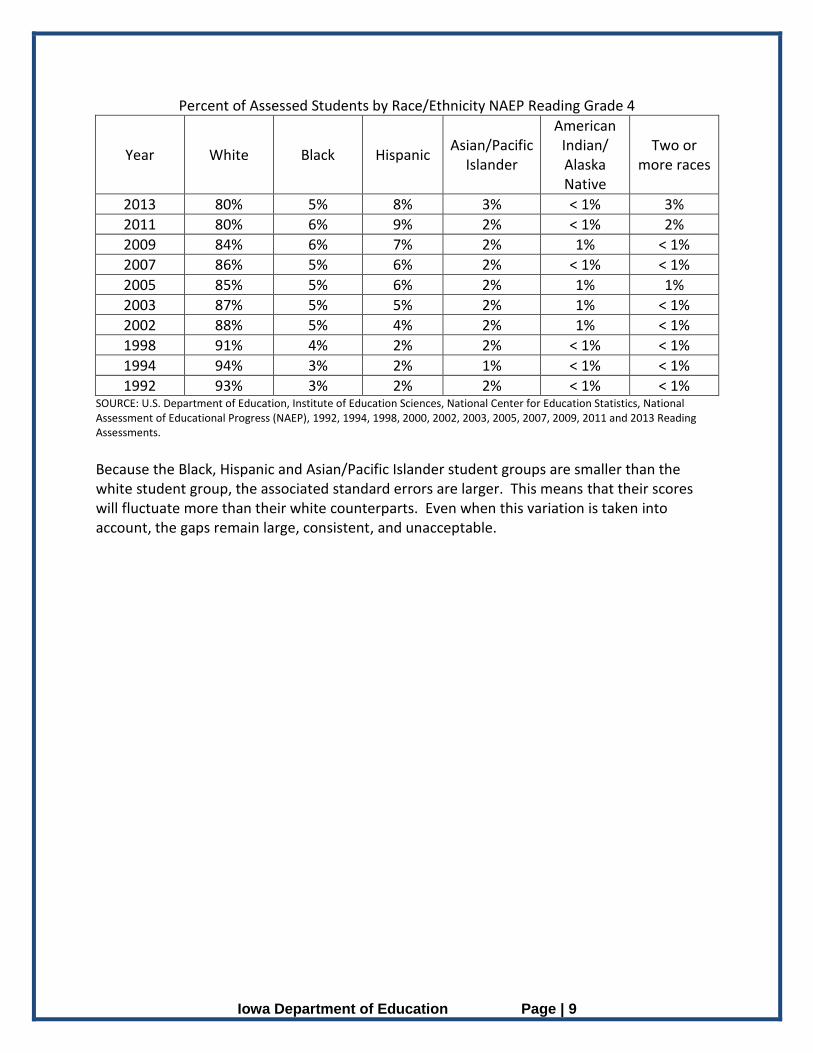
Percent of Assessed Students by Race/Ethnicity NAEP Reading Grade 4
Year White Black Hispanic Asian/Pacific
Islander
American Indian/ Alaska Native
Two or more races
2013 80% 5% 8% 3% < 1% 3%
2011 80% 6% 9% 2% < 1% 2%
2009 84% 6% 7% 2% 1% < 1%
2007 86% 5% 6% 2% < 1% < 1%
2005 85% 5% 6% 2% 1% 1%
2003 87% 5% 5% 2% 1% < 1%
2002 88% 5% 4% 2% 1% < 1%
1998 91% 4% 2% 2% < 1% < 1%
1994 94% 3% 2% 1% < 1% < 1%
1992 93% 3% 2% 2% < 1% < 1% SOURCE: U.S. Department of Education, Institute of Education Sciences, National Center for Education Statistics, National Assessment of Educational Progress (NAEP), 1992, 1994, 1998, 2000, 2002, 2003, 2005, 2007, 2009, 2011 and 2013 Reading Assessments.
Because the Black, Hispanic and Asian/Pacific Islander student groups are smaller than the white student group, the associated standard errors are larger. This means that their scores will fluctuate more than their white counterparts. Even when this variation is taken into account, the gaps remain large, consistent, and unacceptable.
Iowa Department of Education Page | 10
SOURCE: U.S. Department of Education, Institute of Education Sciences, National Center for Education Statistics, National Assessment of Educational Progress (NAEP) Reading Assessments.
The gaps were also examined by excluding students who are identified as having a disability, English language learners, or both. Seventeen percent of the black students assessed were identified as having a disability and twelve percent were English language learners. Seven percent of Hispanic students were identified as having a disability, thirty-four percent as English language learners, and seven percent were identified as both. One notable difference identified is that the gap between white and Hispanic students closes from 17 points to about eight points with non-identified white students scoring 234 and non-identified Hispanic scoring 226. The gap for non-identified white (234) and non-identified black students (212) remains large (22). Poverty also tends to exacerbate the achievement gap. There is a large socioeconomic gap between race/ethnicities in Iowa. Income inequality and in the increasing correlation of income with other family resources means that family resources have become increasingly unequal. Trend studies show that poor students enter the K-12 public school system behind their more affluent counterparts, and the gap does not close. Thirty-two percent of white students, assessed on NAEP in Iowa, were identified as eligible for free or reduced price school lunches. Eighty-two percent of their black and seventy-seven percent of their Hispanic classmates were identified as eligible. While it is important to examine Iowa’s achievement results in comparison to national trends, it is also critical to look at multiple measures and triangulate results to draw conclusions about
226224
222225 226
224227
224 225
227
203
205
200
208 207
201
210
208
185191
207
196
201
205 203
193
200
224
235
229227
219
180
200
220
240
260
280
1992 1994 1998 2000 2002 2003 2005 2007 2009 2011 2013
Ave
rage
Sca
le S
core
NAEP Reading Grade 4 Iowa Score by Race/Ethnicity
White
Hispanic
Black
Asian/Pacific Islander

Iowa Department of Education Page | 11
the achievement gap for Iowa students. The results from student scores from the Iowa Assessment provide another source of student achievement trends to meet this purpose. Data from the Iowa Assessments were examined over an eight year period between the 2005-06 and 2012-13 school years. For analytical purposes, student groups were collapsed across multiple grade levels to examine the subgroups as a whole in comparison to each other. There are multiple ways to examine the achievement gap between groups. In this chart, the achievement of subgroups is compared to the all student group using the Iowa Assessments. Overall, achievement for all students in the state was down slightly from 2005-06 to 2012-13 (-0.5 percent). At the same time, achievement for Iowa’s white students slightly increased over this same period of time (+0.6 percent). The achievement gaps in reading proficiency show mixed results between subgroups. For example, low socioeconomic students and Hispanic students improved, while African American and American Indian did not.
Gaps can also be compared by examining each subgroup’s proficiency rates compared with the remainder of the group. For example, students with disabilities were compared with students that do not have a disability (IEP versus Non-IEP). These comparisons were completed to determine if the gaps between groups increase or decrease over time. The low socioeconomic subgroup improved, but not by enough to close the gap during the next years.
73.6%
31.6%
57.9%
38.6%
48.8%
62.4%
77.6%
52.4%
76.2%73.1%
30.8%
59.3%
38.8%
46.3%
60.2%
73.4%
55.8%
76.8%
0%
10%
20%
30%
40%
50%
60%
70%
80%
90%
100%
Reading Proficency Iowa Assessments 2005-06 to 2012-13
2005-06 Reading
2012-13 Reading
Iowa Department of Education Page | 12
Reading Subgroup Gaps 2005-06 – 2012-13
2005-06 Proficiency 2012-13 Proficiency Change
IEP Non-IEP Gap IEP Non-IEP Gap IEP Non-IEP Gap
31.6% 80.6% 49% 30.8% 79.5% 48.7% -0.8% -1.1% +0.03%
2005-06 Proficiency 2012-13 Proficiency Change
FRL Non-FRL Gap FRL Non-FRL Gap FRL Non-FRL
Gap
57.9% 81.0% 23.1% 59.3% 81.9% 22.6% 1.4% 0.9% -0.5%
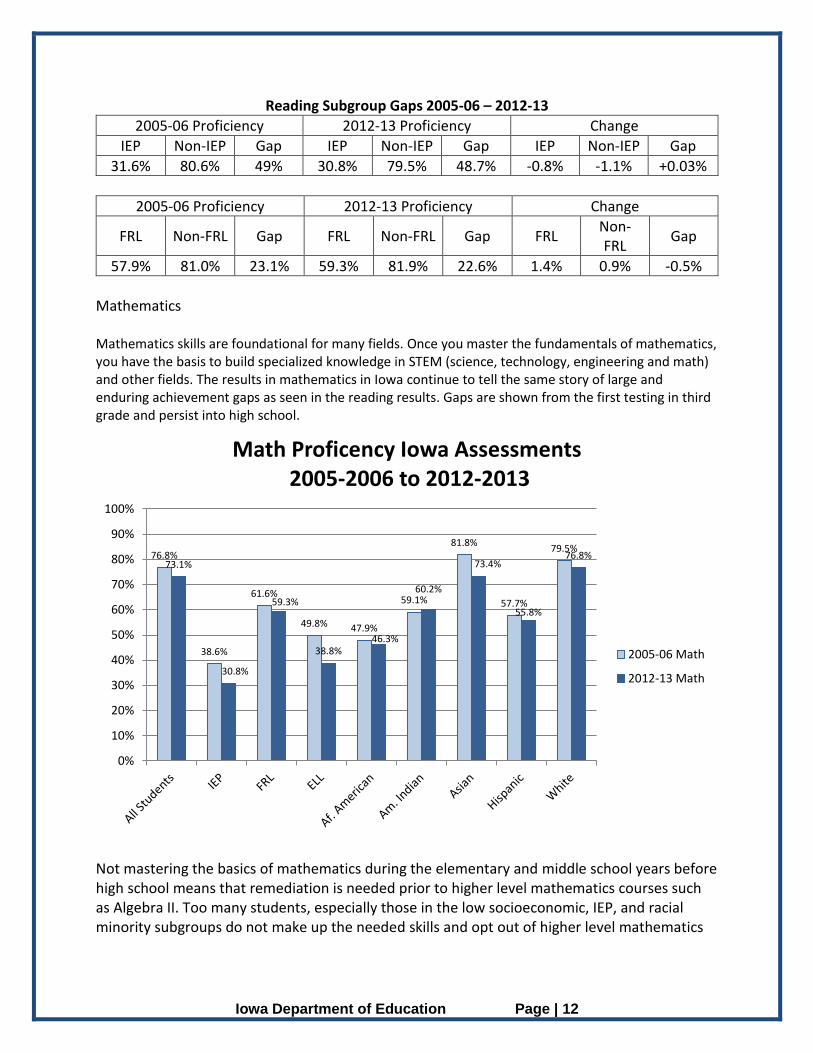
Mathematics
Mathematics skills are foundational for many fields. Once you master the fundamentals of mathematics, you have the basis to build specialized knowledge in STEM (science, technology, engineering and math) and other fields. The results in mathematics in Iowa continue to tell the same story of large and enduring achievement gaps as seen in the reading results. Gaps are shown from the first testing in third grade and persist into high school.
Not mastering the basics of mathematics during the elementary and middle school years before high school means that remediation is needed prior to higher level mathematics courses such as Algebra II. Too many students, especially those in the low socioeconomic, IEP, and racial minority subgroups do not make up the needed skills and opt out of higher level mathematics
76.8%
38.6%
61.6%
49.8% 47.9%
59.1%
81.8%
57.7%
79.5%
73.1%
30.8%
59.3%
38.8%46.3%
60.2%
73.4%
55.8%
76.8%
0%
10%
20%
30%
40%
50%
60%
70%
80%
90%
100%
Math Proficency Iowa Assessments2005-2006 to 2012-2013
2005-06 Math
2012-13 Math

Iowa Department of Education Page | 13
classes. The achievement gap becomes a skills gap as students consider postsecondary opportunities. NAEP was administered to a representative sample of Iowa grade 12 students in 2013. In addition to performance on an achievement assessment, additional information was collected using an accompanying student survey. One question asked of the second semester seniors was have you or are you currently taking Algebra II. Thirty-one percent of the low socioeconomic students said that they had not and were not taking Algebra II. Seventeen percent of their more affluent counterparts also stated that their high school courses would not include Algebra II. Forty-one percent of Black students and twenty-four percent of Hispanic students reported not taking Algebra II. Nineteen percent of white students said that they did not take Algebra II. The ACT is a national college admissions examination that consists of subject area tests in English, mathematics, reading, and science. Approximately 66 percent of Iowa’s 2013 graduating class completed the ACT assessment. The ACT College Readiness Benchmarks are scores on the ACT subject area tests that represent the level of achievement required for students to have a 50 percent chance of obtaining a B or higher or about a 75 percent chance of obtaining a C or higher in corresponding credit-bearing first-year college courses. Based on a nationally stratified sample, the benchmarks are median course placement values for these institutions and represent a typical set of expectations. Gaps on the ACT assessment echo the gaps seen in the earlier grades. African American, American Indian, and Hispanic students do not score as well as their counterparts. ACT does not disaggregate results based on socioeconomic status.
Source. ACT: The Condition of College & Career Readiness in Iowa 2013.
53%
27%
64%
55%
26%
16%
50%
0% 10% 20% 30% 40% 50% 60% 70% 80% 90% 100%
White
Hispanic
Hawaiian or Pacific Islander
Asian
American Indian
African American
All Students
Percent of 2013 ACT-Tested Iowa High School Graduates Meeting College Readiness Benchmarks in Mathematics
by Race/Ethnicity
Iowa Department of Education Page | 14
Practices to Close the Achievement Gap In this section, we provide a brief overview of practices Iowa schools have implemented and are continuing to implement in order to improve their students’ performance in reading and mathematics and reduce academic gaps.
1. The Iowa Core standards for all students. Iowa schools are implementing local curriculums that support the Iowa Core standards in English/language arts and mathematics. These include classroom-based practices that, if well implemented, can very likely lead to gap-closing learning opportunities for low-income students and children of color. These practices also hold promise for raising academic performance for all students and adequately preparing them for the academic rigors and job skills of the 21st century.
2. Multi-Tiered System of Supports (MTSS) is a decision-making framework of evidence-based practices in instruction and assessment that addresses the needs of all students starting in general education. MTSS allows educators to judge the overall health of their educational system by examining data on all students (general and special education) as well as identifying students who need additional supports. Those supports are provided in both small group and individual settings, and measured to determine if these supports are making a difference to ensure all learners demonstrate proficiency in the Iowa Core standards and leave school ready for life.
3. The Teacher Leadership and Compensation System rewards effective teachers with leadership opportunities and higher pay, attracts promising new teachers with competitive starting salaries and more support, and fosters greater collaboration for all teachers to learn from each other. The overriding philosophy of the system is multi-pronged, but boils down to this: Improving student learning requires improving the instruction they receive each day. There is no better way to do this than to empower our best teachers to lead the effort.
4. Iowa's Statewide Voluntary Preschool Program for Four-Year-Old Children provides an opportunity for all young children in the State of Iowa to enter school ready to learn by expanding voluntary access to quality preschool curricula for all four-year-old children. The allocation of funds for the Statewide Voluntary Preschool Program is intended to improve access to quality early childhood education and provide a predictable, equitable, and sustainable funding method to increase the number of children participating in quality programs.