iot-based inventory tracking in the pharmaceutical industry
TRANSCRIPT

IoT-Based Inventory Tracking in the Pharmaceutical Industry
Andrew Kerr
BSISE, University of Illinois, Urbana-Champaign, 2015
and
Anthony Orr
BSIE, Purdue University, West Lafayette, 2017
SUBMITTED TO THE PROGRAM IN SUPPLY CHAIN MANAGEMENTIN PARTIAL FULFILLMENT OF THE REQUIREMENTS FOR THE DEGREE OF
MASTER OF APPLIED SCIENCE IN SUPPLY CHAIN MANAGEMENTAT THE
MASSACHUSETTS INSTITUTE OF TECHNOLOGY
May 2020
© 2020 Andrew Kerr and Anthony Orr. All rights reserved.The authors hereby grant to MIT permission to reproduce and to distribute publicly paper and electronic
copies of this capstone document in whole or in part in any medium now known or hereafter created.
Signature of Author:
Department of Supply Chain ManagementMay 8, 2020
Signature of Author:
Department of Supply Chain ManagementMay 8, 2020
Certified by:
Dr. Matthias WinkenbachDirector, MIT Megacity Logistics Lab
Research Scientist, MIT Center for Transportation and LogisticsCapstone Advisor
Accepted by:
Prof. Yossi SheffiDirector, MIT Center for Transportation and Logistics
Elisha Gray II Professor of Engineering SystemsProfessor, Civil and Environmental Engineering
1

IoT-Based Inventory Tracking in the Pharmaceutical Industry
by
Andrew Kerr
and
Anthony Orr
Submitted to the Program in Supply Chain Managementon May 8, 2020 in Partial Fulfillment of the
Requirements for the Degree of Master of Applied Science in Supply Chain Management
Abstract
Inventory visibility has been a primary concern for corporate supply chains for decades. Utilizinginventory location and time data is particularly important for pharmaceutical companies, as is thesponsor, that have an ethical and legal responsibility to protect consumers from risky pharmaceuti-cal products in the market. Until recently, pharmaceutical companies have had to rely on archaic,cumbersome methods to track or count inventory units. These processes created inaccuracies andmismanaged inventory, leading to unnecessary product waste, returns, and consumer risk. How-ever, technological advancements have created platforms to track physical goods characteristics us-ing wireless network systems in real-time. This technology, commonly referred to as the Internetof Things (IoT), provides a potential solution for pharmaceutical companies to manage and pro-tect pharmacy inventory levels, while maintaining consumer protection and brand integrity. Thisstudy analyzes the economic and practical implications of implementing an IoT inventory visibilitysolution within the sponsor’s supply chain to mitigate consumer risk and existing corporate finan-cial waste streams. Through existing technology research, real-world device experimentation, andcross-functional supply chain analyses, the team proposes a Bluetooth technology IoT network in-frastructure and business implementation approach for the sponsor’s inventory visibility needs.
Capstone Advisor: Dr. Matthias WinkenbachTitle: Director of MIT Megacity Logistics Lab and Research Scientist at MIT Center for Transportationand Logistics
2

ACKNOWLEDGMENTS
We would like to extend our gratitude and thanks to to Dr. Matthias Winkenbach, Director of MITMegacity Logistics Lab and Research Scientist at MIT Center for Transportation and Logistics, for theopportunity to work on this project. His guidance, insights, and experience proved vital to the finalproduct.
Thank you to Pamela Siska, Robert Cummings, and the rest of the CTL staff for their supportthroughout the entirety of this project. We also thank Eren Bozbag, Lila Kerr, Gabriela Lamas Oporto,Justin Orr, Ben Ross, and Jamie Sweeney for their assistance with data collection throughout the ex-periment.
We would also like to thank our sponsoring company and the entirety of its team for proposing thisproject and providing the resources needed to help answer the initial research question. Without acohesive effort from our sponsor, this work would not have been possible.
Thank you to "Company X’s" team for their generous time and information sharing throughout theresearch process.
Finally, a special thank you to Ashley Orr and Brittany Foster for their continued support through-out this project and our time at MIT. We couldn’t have succeeded without them. Lastly, thank you toour families and loved ones for always being present in support as well.
3

CONTENTS
1 Introduction 81.1 The Sponsor . . . . . . . . . . . . . . . . . . . . . . . . . . . . . . . . . . . . . . . . . . . . . 81.2 Problem Motivation and Background . . . . . . . . . . . . . . . . . . . . . . . . . . . . . . 81.3 Problem Definition . . . . . . . . . . . . . . . . . . . . . . . . . . . . . . . . . . . . . . . . . 91.4 Scenarios of Analysis . . . . . . . . . . . . . . . . . . . . . . . . . . . . . . . . . . . . . . . . 10
1.4.1 Limited End-to-End Supply Chain Scenario . . . . . . . . . . . . . . . . . . . . . . 101.4.2 Extended End-to-End Supply Chain Scenario . . . . . . . . . . . . . . . . . . . . . 101.4.3 Clinical Supply Chain Scenario . . . . . . . . . . . . . . . . . . . . . . . . . . . . . . 11
2 Literature Review 122.1 Pharmaceutical Industry . . . . . . . . . . . . . . . . . . . . . . . . . . . . . . . . . . . . . . 12
2.1.1 Structure of Pharmaceutical Supply Chains . . . . . . . . . . . . . . . . . . . . . . 132.1.2 Wholesaler Distributors in Pharmaceutical Supply Chains . . . . . . . . . . . . . . 142.1.3 Reverse Logistics in Pharmaceutical Supply Chains . . . . . . . . . . . . . . . . . . 15
2.2 Healthcare Pharmaceutical Inventory Processes . . . . . . . . . . . . . . . . . . . . . . . . 152.2.1 Hospital Pharmacy Inventory Processes . . . . . . . . . . . . . . . . . . . . . . . . 162.2.2 Retail Pharmacy Inventory Processes . . . . . . . . . . . . . . . . . . . . . . . . . . 17
2.3 Internet of Things Technology . . . . . . . . . . . . . . . . . . . . . . . . . . . . . . . . . . 182.3.1 Narrow-Band IoT Technology . . . . . . . . . . . . . . . . . . . . . . . . . . . . . . . 192.3.2 Mesh Networking Technology . . . . . . . . . . . . . . . . . . . . . . . . . . . . . . 202.3.3 Radio Frequency Identification (RFID) . . . . . . . . . . . . . . . . . . . . . . . . . 202.3.4 Bluetooth Network Design . . . . . . . . . . . . . . . . . . . . . . . . . . . . . . . . 222.3.5 Sigfox Network Design . . . . . . . . . . . . . . . . . . . . . . . . . . . . . . . . . . . 232.3.6 Technology Comparison . . . . . . . . . . . . . . . . . . . . . . . . . . . . . . . . . . 24
2.4 SIPOC Approach . . . . . . . . . . . . . . . . . . . . . . . . . . . . . . . . . . . . . . . . . . 24
3 Methodology 263.1 Background . . . . . . . . . . . . . . . . . . . . . . . . . . . . . . . . . . . . . . . . . . . . . 263.2 Real-World Cambridge Experiment . . . . . . . . . . . . . . . . . . . . . . . . . . . . . . . 26
3.2.1 Product Introduction . . . . . . . . . . . . . . . . . . . . . . . . . . . . . . . . . . . . 263.2.2 Approach Overview . . . . . . . . . . . . . . . . . . . . . . . . . . . . . . . . . . . . . 273.2.3 Ping Frequency Hypothesis . . . . . . . . . . . . . . . . . . . . . . . . . . . . . . . . 273.2.4 Pilot Data Collection - Cambridge, MA . . . . . . . . . . . . . . . . . . . . . . . . . 293.2.5 Company X Cambridge Experiment: Data Collection Considerations . . . . . . . 30
3.3 Supply Chain Implementation . . . . . . . . . . . . . . . . . . . . . . . . . . . . . . . . . . 303.3.1 Business Scope . . . . . . . . . . . . . . . . . . . . . . . . . . . . . . . . . . . . . . . 313.3.2 SIPOC Approach . . . . . . . . . . . . . . . . . . . . . . . . . . . . . . . . . . . . . . 31
4 Results and Discussion 334.1 Company X Cambridge Experiment . . . . . . . . . . . . . . . . . . . . . . . . . . . . . . . 33
4.1.1 Initial Ping Data Results . . . . . . . . . . . . . . . . . . . . . . . . . . . . . . . . . . 334.1.2 Ping Data Statistical Fitting . . . . . . . . . . . . . . . . . . . . . . . . . . . . . . . . 354.1.3 National Data Outlook . . . . . . . . . . . . . . . . . . . . . . . . . . . . . . . . . . . 374.1.4 Additional Considerations: Detection Range Variability . . . . . . . . . . . . . . . 394.1.5 Additional Considerations: The Dedicated Beacon Effect . . . . . . . . . . . . . . 41
4.2 Supply Chain Implementation Strategy . . . . . . . . . . . . . . . . . . . . . . . . . . . . . 434.2.1 Customer Relations and Sales . . . . . . . . . . . . . . . . . . . . . . . . . . . . . . . 434.2.2 Procurement . . . . . . . . . . . . . . . . . . . . . . . . . . . . . . . . . . . . . . . . . 444.2.3 Manufacturing . . . . . . . . . . . . . . . . . . . . . . . . . . . . . . . . . . . . . . . 454.2.4 Packaging . . . . . . . . . . . . . . . . . . . . . . . . . . . . . . . . . . . . . . . . . . 45
4

4.2.5 Transportation . . . . . . . . . . . . . . . . . . . . . . . . . . . . . . . . . . . . . . . 464.2.6 Warehousing . . . . . . . . . . . . . . . . . . . . . . . . . . . . . . . . . . . . . . . . . 474.2.7 Inventory . . . . . . . . . . . . . . . . . . . . . . . . . . . . . . . . . . . . . . . . . . . 484.2.8 Distribution . . . . . . . . . . . . . . . . . . . . . . . . . . . . . . . . . . . . . . . . . 484.2.9 Point of Sale: Reverse Logistics vs. End-of-Life Disposal . . . . . . . . . . . . . . . 494.2.10 Environmental, Health, and Safety . . . . . . . . . . . . . . . . . . . . . . . . . . . . 504.2.11 Legal . . . . . . . . . . . . . . . . . . . . . . . . . . . . . . . . . . . . . . . . . . . . . 514.2.12 Incubation Team and Operations . . . . . . . . . . . . . . . . . . . . . . . . . . . . 51
5 Conclusion 545.1 Technology Insights and Recommendations . . . . . . . . . . . . . . . . . . . . . . . . . . 545.2 Supply Chain Management Insights and Recommendations . . . . . . . . . . . . . . . . 545.3 Future Research . . . . . . . . . . . . . . . . . . . . . . . . . . . . . . . . . . . . . . . . . . . 55
5

LIST OF FIGURES
1.1 Sponsor Company’s Supply Chain Network . . . . . . . . . . . . . . . . . . . . . . . . . . . 81.2 Technology Center of Gravity . . . . . . . . . . . . . . . . . . . . . . . . . . . . . . . . . . . 91.3 Limited End-to-End Supply Chain Network . . . . . . . . . . . . . . . . . . . . . . . . . . 101.4 Extended End-to-End Supply Chain Network . . . . . . . . . . . . . . . . . . . . . . . . . 101.5 Clinical Supply Chain Network . . . . . . . . . . . . . . . . . . . . . . . . . . . . . . . . . . 112.1 Total Nominal Spending in the US on Medication 2002-2018 (Statista, 2019) . . . . . . . 122.2 Proportion of Branded v Generic Prescriptions in the US 2005-2018 (Statista, 2019) . . . 132.3 Proportion of Branded v Generic Revenues in the US 2005-2018 (Mikulic, 2020) . . . . . 132.4 Pharmaceutical Supply Chain Design (Khezr et al., 2019) . . . . . . . . . . . . . . . . . . . 142.5 Hospital Inventory Management (de Vries, 2009) . . . . . . . . . . . . . . . . . . . . . . . 162.6 Hospital Supply Chains (Rivard-Royer et al., 2002) . . . . . . . . . . . . . . . . . . . . . . . 172.7 Example Over the Counter, Generic Drug Weekly Demand (Papanagnou & Matthews-
Amune, 2018) . . . . . . . . . . . . . . . . . . . . . . . . . . . . . . . . . . . . . . . . . . . . 172.8 Sensors Prices on the Decline Over Last 25 Years (Holdowsky et al., 2015) . . . . . . . . . 182.9 Computing Speed Continuously Increasing (Holdowsky et al., 2015) . . . . . . . . . . . . 182.10 Wireless Module Price (Huawei, 2016) . . . . . . . . . . . . . . . . . . . . . . . . . . . . . . 192.11 Mesh Versus Star Network (Liu et al., 2017) . . . . . . . . . . . . . . . . . . . . . . . . . . . 202.12 RFID System Device Configuration (Hunt et al., 2007) . . . . . . . . . . . . . . . . . . . . 212.13 Bluetooth Sample Devices (Harte, 2004) . . . . . . . . . . . . . . . . . . . . . . . . . . . . . 222.14 Sigfox Coverage Map: United States (Sigfox, 2020) . . . . . . . . . . . . . . . . . . . . . . . 232.15 Sigfox Coverage Map: Europe (Sigfox, 2020) . . . . . . . . . . . . . . . . . . . . . . . . . . 232.16 SIPOC Process Map (Rasmusson, 2006) . . . . . . . . . . . . . . . . . . . . . . . . . . . . . 252.17 SIPOC Process Example: Table Format (SIPOC Diagrams, 2020) . . . . . . . . . . . . . . . 253.1 Company X Bluetooth Connection Structure . . . . . . . . . . . . . . . . . . . . . . . . . . 264.1 Ping Density Map - Cambridge Experiment . . . . . . . . . . . . . . . . . . . . . . . . . . 334.2 Ping Distribution - Cambridge Experiment . . . . . . . . . . . . . . . . . . . . . . . . . . . 344.3 Daily Ping Distribution - Cambridge Experiment . . . . . . . . . . . . . . . . . . . . . . . 354.4 Client ID Time-of-Day Ping Distribution . . . . . . . . . . . . . . . . . . . . . . . . . . . . 424.5 Client ID Day-of-Week Distribution . . . . . . . . . . . . . . . . . . . . . . . . . . . . . . . 424.6 Coin Battery Cross Section (Energizer, 2017) . . . . . . . . . . . . . . . . . . . . . . . . . . 504.7 Waterfall Model (Hughey, 2009) . . . . . . . . . . . . . . . . . . . . . . . . . . . . . . . . . . 524.8 IoT Implementation Framework (Zdravkovic et al., 2018) . . . . . . . . . . . . . . . . . . 53
6

LIST OF TABLES
2.1 Passive RFID Frequency Characteristics (Lewis, 2004) . . . . . . . . . . . . . . . . . . . . 212.2 IoT Technology Comparison . . . . . . . . . . . . . . . . . . . . . . . . . . . . . . . . . . . 243.1 Cambridge Experiment Retail Locations . . . . . . . . . . . . . . . . . . . . . . . . . . . . 283.2 Cambridge Experiment Variable Definitions . . . . . . . . . . . . . . . . . . . . . . . . . . 283.3 SIPOC SME Interview List . . . . . . . . . . . . . . . . . . . . . . . . . . . . . . . . . . . . . 324.1 Regression Summary Statistics . . . . . . . . . . . . . . . . . . . . . . . . . . . . . . . . . . 364.2 Exponential Likelihood of Pings/Day/Store . . . . . . . . . . . . . . . . . . . . . . . . . . . 364.3 Company X User Density by City . . . . . . . . . . . . . . . . . . . . . . . . . . . . . . . . . 374.4 Percentage of Stores with at Least One Ping/Day . . . . . . . . . . . . . . . . . . . . . . . 384.5 Company X Model Comparison: Long vs. Short . . . . . . . . . . . . . . . . . . . . . . . . 394.6 Company X Tag Ping Frequency Comparison: Long vs. Short . . . . . . . . . . . . . . . . 394.7 Positive Selection of Standard Z Score Values (Z Table, 2020) . . . . . . . . . . . . . . . . 404.8 Short Z Scores . . . . . . . . . . . . . . . . . . . . . . . . . . . . . . . . . . . . . . . . . . . . 414.9 Battery Shipment Label Requirements (Energizer, 2017) . . . . . . . . . . . . . . . . . . . 47
7

1 INTRODUCTION
1.1 THE SPONSOR
The sponsor company for this project is a multi-billion dollar pharmaceutical manufacturer. It’s sup-ply chain structure creates natural barriers to customer-level inventory visibility. After manufactur-ing is complete, the sponsor ships its products to a distributor, who assumes financial ownershipand delivery to customers (hospitals, clinics, pharmacies, etc.). This downstream supply chain caninvolve numerous complexities, such as inter-warehouse shipments, third-party delivery, and last-mile delivery to and between customers. While the distributor or customer may own the inventoryafter manufacturing, the sponsor still assumes a wide range of product responsibility due to the legalobligations of drug manufacturers in the United States. Additionally, it is still financially responsiblefor any product returns due to shelf-life expiration, quality concerns, or mishandling in the field. Fig-ure 1.1 depicts the high-level supply chain network design from manufacturing to the end consumer.
Figure 1.1: Sponsor Company’s Supply Chain Network
The wholesaler network is used to store products closer to the end customer and manage logisticsand distribution challenges. As products transition from the distribution center to the wholesaler,a change in inventory ownership occurs. At that point, the sponsor no longer has ownership of theproduct and, without the use of IoT tracking technology, loses visibility of movement and storagewithin the wholesaler. The only other information that the sponsor receives is how much productleaves the wholesaler and when. The "visibility solution target" depicted in Figure 1.1 is the mainfocus of the implementation of IoT technologies and sensors for customer level visibility. While thesponsor is still in possession and ownership of the pharmaceuticals, two induction points exist at themanufacturing facility and distribution center that offer opportunities to implement technology totrack products.
Per the sponsor, the supply chain can be segmented into smaller, trial networks for use case im-plementation and testing which will allow the team to internalize supply chain disruptions, limit un-known variables, and impact fewer stakeholders. The goal of this segmented approach is to build thebusiness case for stakeholder buy-in and involvement and to address the scope and feasibility of in-ventory visibility across the United States. The team will build the foundation for the project throughlimited test case implementation. As the project scales, the inclusion of manufacturing and fillingthrough end customer will require stakeholder integration and change management techniques.
1.2 PROBLEM MOTIVATION AND BACKGROUND
The sponsor had previously deployed an internal team to test a potential on-cap solution for prod-ucts’ location tracking, temperature and condition information, and end usage data. The internalteam’s initial intent was to generate a similar approach to vial usage with an on-cap solution. Theteam faced issues with current market technologies available which included size and form factorfor an on-cap solution coupled with the regulations surrounding adjustments to product packag-
8

ing. Ultimately, data acquisition and analysis from the wholesaler would circumvent the need for atechnology solution until a better approach was devised.
The sponsor’s supply chain continued to suffer from unnecessary product waste driven by cus-tomer inventory mismanagement and out-of-date product returns. The contradiction between prod-uct ownership and lack of inventory visibility leaves the sponsor prone to product losses it is unableto anticipate nor investigate.
To minimize these costs and help customers adequately manage their inventory levels, the spon-sor purchases data from external third parties. This data includes location and time informationfor inventory as it is received and shipped by the distributor. Unfortunately, it does not include anyvisibility to inventory location nor status beyond the shipment at the distributor. This leaves thesponsor blind regarding its downstream inventory status at the customer level. Compiling the spon-sor’s supply chain costs is the multi-millions of dollars wasted on expired product returns resultingfrom inventory mismanagement at the customer level.
The company’s largest opportunity to reduce costs through enhanced customer inventory visibil-ity is by implementing product tracking technology. Moreover, by utilizing some form of Internet ofThings (IoT) sensing technology, The sponsor can obtain real-time visibility on each of its finishedproducts’ locations and, potentially, temperature. In order to be effective, this type of sensing tech-nology must be physically integrated within the sponsor’s packaging design. Additionally, the tech-nology must be able to meet the sponsor’s financial, technological, and practical needs to ensuresustainable implementation.
1.3 PROBLEM DEFINITION
The project’s goal is to identify a feasible type of IoT technology, test its use across a small, controlledsegment of the sponsor’s supply chain, and analyze the results to provide a proof-of-concept businesscase for full-scale implementation. The final solution is hypothesized to be a combination of NB IoTtechnologies and Mesh Networking as seen in Figure 1.2.
Figure 1.2: Technology Center of Gravity
This solution for inventory tracking may be the first step to a future scale up solution that encapsu-lates the sponsor’s supply chain requirements. A granularity of data and information is defined thatmust be obtained to meet the desired business case of inventory location and tracking to substantiatethe proposed investment. Later iterations of this solution will be needed to incorporate temperatureand conditional information of the product, which is currently out of scope for this study. The pur-pose of the solution for this problem is to enable a foundation for the sponsor to get closer to thepatient. Environmental conditions of the sponsor’s products, including temperature and humidity,are an important future step as the products are safe only when maintained within certain parame-ters dependent to the specific drug.
9

1.4 SCENARIOS OF ANALYSIS
The sponsor’s supply chain can be segmented into different distribution channels to provide clar-ity and opportunity during testing and validation phases of the project. Dividing the entire networkinto scenarios provides different advantages and disadvantages by segmentation and potentially atechnology solution. Sections 1.4.1, 1.4.2, and 1.4.3 detail the differences in the scenarios for consid-eration during implementation and scale-up, each of them requiring different levels of relationshipmanagement and stakeholder engagement.
1.4.1 LIMITED END-TO-END SUPPLY CHAIN SCENARIO
The limited end-to-end supply chain trial network was used early in the learning phase of the projectto gather data and information around feasibility and transparency of inventory movement fromthe distribution center through the wholesaler network, and to the end consumer (hospitals andpharmacies). Figure 1.3 represents the limited end-to-end supply chain network that the sponsorused during the business case development phase of the project.
Figure 1.3: Limited End-to-End Supply Chain Network
The advantages of the limited end-to-end supply chain trial scenario include fewer stakeholders,control at the distribution center, and key feasibility learning in the latter half of the entire network.As determined by the sponsor, this trial scenario does not present any foreseeable challenges duringtesting.
1.4.2 EXTENDED END-TO-END SUPPLY CHAIN SCENARIO
The extended end-to-end supply chain incorporates the manufacturing facility into the limited end-to-end supply chain previously mentioned. Figure 1.4 depicts the entirety of the extended networkthat will be used for scale-up in future phases of the project testing and launch.
Figure 1.4: Extended End-to-End Supply Chain Network
The advantages of the extended end-to-end supply chain include those from the limited end-to-end scenario as well as being more representative of the final state of implementation. Potential
10

challenges that could arise during this scenario include adding additional stakeholders and intro-ducing a complex induction point at the manufacturing level.
1.4.3 CLINICAL SUPPLY CHAIN SCENARIO
The clinical supply chain is the last segmented supply chain scenario for testing and launch. Thisopportunity includes a pre-determined wholesaler with a strong relationship with the sponsor andthe end consumers that is facilitated by a specialist team of pharmacists: Company Y. Figure 1.5shows the scenario with the manufacturing facility and distribution center collectively representedas "The Sponsor."
Figure 1.5: Clinical Supply Chain Network
The advantages of the clinical supply chain trial scenario are as follows: the wholesaler is a will-ing partner in the inventory project, minimal stakeholder engagement is needed to integrate at thisstage, the sponsor has brand recognition in this network, and the final induction point could bemoved to the wholesaler level rather than controlled by the sponsor. Achieving a return on the in-vestment poses a significant challenge in this network. The clinical supply chain already presents op-portunities for better inventory visibility based on structure, relationship, and production of brandedpharmaceuticals.
In summary, the sponsor’s complex supply chain structure and dependency upon third party datapromote a lack of inventory visibility beyond its first tier of customers. Ultimately, this capstonewill be an evaluation of viable IoT technology to identify the most appropriate solution to maximizefinancial return while minimizing supply chain disruptions and delivering inventory tracking capa-bilities to the business.
11

2 LITERATURE REVIEW
2.1 PHARMACEUTICAL INDUSTRY
The pharmaceutical industry is under immense pressure to meet the needs of the aging patient pop-ulation. Specifically, it must deliver better outcomes in a cost-efficient, timely manner. By the year2035, it is estimated that the total population over the age of 65 will surpass the total population underthe age of 18 in the United States. The Baby Boomer generation is aging and reaching a stage in life(age 65) where the average unique prescriptions per consumer rises from 3.15 to 8.85. Moreover, theneed for efficient modes of drug delivery is heightened exponentially (Watanabe, 2019). Data fromthe US Census Bureau and other government-supported entities state that the current populationages 65 and above represents approximately 16.9% of the population and will grow to approximately22% in the next thirty years (Statista 2019). Figure 2.1 represents the increasing nominal spend onmedicines in the United States from 2002 to 2018. With this trend, the value of real-time, accurateinformation aggregated back to the manufacturer is necessary to sustain industry growth.
Figure 2.1: Total Nominal Spending in the US on Medication 2002-2018 (Statista, 2019)
The pharmaceutical industry can be segmented and characterized by the branding of each drugas well as the type of substance being created. Pharmaceuticals are manufactured in the form ofbranded drugs or generics that can also be derived by forming different size molecules or utilizingdifferent biologic processes (Singh, 2005). Branded drugs are typically more specialized and requireprescriptions for the end user while generics are over the counter drugs that can be used withoutprescription. Packaging requirements also differ between branded and generic drugs which impactsthe form factor and available space for an IoT device solution for tracking.
Figure 2.2 depicts the change in prescriptions and consumer behavior from branded to genericssupplements. One of the key factors in the transition to consumers preferring generics over brandeddrugs is price point, as generics offer a cost-effective alternative to branded drugs (Hunt III et al.,2019). During the phase of exclusivity, pharmaceutical manufacturers’ branded drugs are pricedhigher to recover research and development costs sunk into producing the new drug. After the patentlife expires, drugs can be produced as generics and offered at lower price points. Figure 2.3 depictsthe share of revenues from 2005 to 2018 of branded drugs versus generics. The portion of prescrip-tions being filled shifting towards generics while the proportion of revenues generated by genericsremains relatively consistent.
12

Figure 2.2: Proportion of Branded v Generic Prescriptions in the US 2005-2018 (Statista, 2019)
Figure 2.3: Proportion of Branded v Generic Revenues in the US 2005-2018 (Mikulic, 2020)
The push to having backward visibility in the pharmaceutical supply chain is needed for the inte-gration of information from the consumer, through the distributor or wholesaler, to the manufacturer(Morris, 2019). Molecular or biological manufacturing processes of drug substances require differentlead times as well as different specifications for transportation and packaging. Visibility through-out the supply chain would provide insights back through manufacturing to address the specific re-quirements. Speed to market and proper inventory management principles allow pharmaceuticalmanufacturers to meet the ever-changing demands of consumers. With generics being sold over thecounter without prescription, the volume of pharmaceutical sales could follow a trend similar to thechange in demand from branded to generic. Having real-time, accurate inventory management willgive pharmaceutical companies, such as the sponsor, the ability to adapt and be agile in the marketplace.
2.1.1 STRUCTURE OF PHARMACEUTICAL SUPPLY CHAINS
The stakeholders involved in a pharmaceutical supply chain include research and development,manufacturers, warehouses, transportation, wholesale distributors, retail pharmacies, healthcareproviders, and end consumers or patients. When it comes to manufacturing, drug manufacturingis often done in batches or campaigns to build inventory over a rolling time period (Shah, 2004). Thisbatch style manufacturing does not lend itself to responsiveness to market or consumer demand
13

changes. Furthermore, it can lead to waste throughout the entire supply chain, most found in inven-tory holding. Companies in the pharmaceutical industry are interested in inventory holding becauseit ties up working capital that can be used elsewhere in the business, and strategic inventory posi-tioning is an important analysis towards reducing inventory costs (Krishnamurthy & Prasad, 2012).
Unlike the scenario depicted in Section 1.1, in some instances manufacturers ship directly to health-care providers or retail pharmacies. The multi-channel distribution strategies are dependent on therelationship between the pharmacy and manufacturer (Iacocca & Mahar, 2019). Figure 2.4 depicts apharmaceutical supply chain structure from research and development to the end consumers with-out the wholesaler distributor in the distribution network.
Figure 2.4: Pharmaceutical Supply Chain Design (Khezr et al., 2019)
However, in most cases, the manufacturer passes the finished product through their distributionnetwork to a wholesale distributor. The wholesale distributor takes ownership of warehousing, aggre-gating, and distributing inventory to the final destination accordingly. This wholesaler distributionchannel accounts for 86.6% of annual pharmaceutical purchases by pharmacies (Beier, 1995). Sup-ply chains must be structured to coordinate with the core business processes of end consumers. Thenetwork is historically built on relationships between wholesale distributors and pharmacy manage-ment (Singh, 2005).
Understanding the characteristics, including end-of-life thresholds, of pharmaceutical productsand their demand cycle uncertainties should influence appropriate inventory policies. As complexi-ties and tiers of supply chain networks become more diverse and increase the length of distribution,pharmaceutical manufacturers become more susceptible to risks and counterfeiting (Aigbogun et al.,2015). The tiered nature of pharmaceutical supply chain networks, coupled with the dynamic natureof consumer behavior in the industry, without visibility brings about risks of true consumption andusage beyond the purchasing and inventorying policies set in place. At the end of the network, thedifference in purchasing trends by pharmacies and consumption or point-of-sale information to theend consumer creates the opportunity for reverse logistics with buy-backs at a product’s end-of-life.product (Singh, 2005).
2.1.2 WHOLESALER DISTRIBUTORS IN PHARMACEUTICAL SUPPLY CHAINS
Wholesaler distributors play a critical role in the delivery of pharmaceuticals to pharmacies aroundthe world. The key responsibilities at this stage in the supply chain are demand and inventory ag-gregation, in addition to standard warehousing operations. The pharmaceutical industry is highlyregulated, adding complexity to a distribution workflow. Wholesale distributors are responsible formanaging appropriate inventory levels to service all of their consumers while giving their suppli-ers notice on current inventory levels to trigger production and delivery from manufacturers (Shah,2004). In a study conducted surrounding quality metrics for primary wholesaler distributors, the top
14

three attributes were 1) delivery within twenty-four hours of order placement, 2) electronic order-ing, and 3) consistent daily delivery times (Beier, 1995). With two of the top three metrics focusedon delivery, wholesalers attempt to anticipate pricing changes that influence demand. This leads topre-emptive large order requests from the manufacturers (Shah, 2004). A study conducted on whole-saler distributor inventory policies concluded that pooling inventory at the distributor level, insteadof disparate pharmacy locations, can improve entire system performance in terms of finances andflexibility (Iacocca & Mahar, 2019).
As products change ownership at the point of exchange from manufacturer to wholesaler, phar-maceutical companies tend to lose sight of their inventory. Although it has not reached the point ofconsumption, the inventory is out of their hands from a control perspective. Some data is sharedbetween wholesale distributors and manufacturers on inflows and outflows of product from ware-houses, but it does not give manufacturing companies a good sense of consumer demand and usage.This lack of transparency offers opportunities for manufacturing and inventorying inefficiencies tobe realized throughout the industry.
2.1.3 REVERSE LOGISTICS IN PHARMACEUTICAL SUPPLY CHAINS
Reverse logistics in the pharmaceutical industry, triggered by the end of life of a drug, materialize inthe form of recalls or inventory buy-backs. This study is mainly focused on the frequency of inven-tory buy-backs and the root causes of pharmaceuticals reaching their end-of-life while on the shelf.The industry faces a common dilemma of carrying high levels of finished goods inventory, which ex-acerbates the issue of drug expiration and required buybacks (Singh, 2005). Appropriate inventorymanagement principles and inventory turn procedures may provide a potential solution to one ofthe root causes of this reverse logistics requirement.
Any return implies a logistics route to be defined, financial impact to be recorded, disposal of thedrugs in a regulated environment, potential legal implications, and reconciling of all inventory acrossthe network (Singh, 2005). The environmental risk associated with improper disposal of pharmaceu-ticals is one of the key drivers of the need for reverse logistics programs (de Campos et al., 2017). Pos-itive customer perception is also necessary for pharmaceutical manufacturers to stay competitive.Taking the appropriate steps toward limiting the environmental impact helps organizations main-tain a positive image. Companies rely on brand recognition and speed-to-market to stay relevantin the industry. In contrast, research and development activities, through manufacturing practices,take years to formulate a new product.
With the various implications, especially legal and regulatory, of end-of-life or end-of-use drugs topharmaceutical companies, the importance of monitoring the patterns related to inventory expira-tion are crucial for implementing appropriate inventory principles. Without visibility as to productlocation and timing of consumption, pharmaceutical manufacturers are at the mercy of pharmaciesaround the country to maintain a first-in-first-out (FIFO) methodology to turn inventory and ensuredrugs are being used in their respective life-cycles.
2.2 HEALTHCARE PHARMACEUTICAL INVENTORY PROCESSES
Inventory systems in the healthcare setting have adopted operational management principles overthe years but have relied heavily on stakeholder management and relationships to build internal pro-cesses. Some organizations have started moving toward using supply chain management inventorypolicies to determine inventory levels and ordering processes.
Studies suggest that, historically, inventory management and ordering policies were typically drivenby political and experience-based care givers or managers rather than through data analysis and pol-icy (de Vries, 2009). In an typical supply chain setting, roles are defined and procedures for properinventory management that have few stakeholders involved in the decision-making process. In the
15

healthcare industry, multiple stakeholders are involved with different levels of perception regardingwhat constitutes quality service and appropriate inventory levels from nurses, to doctors, to pharma-cists, and financial analysts (de Vries, 2009). Healthcare professionals maintain a deep-rooted senseof the need to hold excess inventories to avoid stock outs given the dire consequences to patient care.
2.2.1 HOSPITAL PHARMACY INVENTORY PROCESSES
Hospital pharmacies tend to face higher demand volatility in comparison to retail pharmacies andgreater internal stakeholder pressure to hold inventory based on their environment of patient move-ment and employee involvement (de Vries, 2009). The consequences of inventory stock outs in ahospital setting are greatly heightened when patients have life-threatening diseases. In a study con-ducted by the Journal of Business Logistics, 43.8% of respondents used judgement or experience toset safety stock levels (Beier, 1995). This is exacerbated by physicians’ and providers’ willingness toswitch from branded to generic therapies, influenced by their product loyalty and historical treat-ment success rates (Schneller & Smeltzer, 2006). Figure 2.5 depicts the influence of stakeholders andperception on the overall inventory management process. Without proper inventory managementpractices for ordering and holding stock, hospitals can lose sight of their total inventory cost (includ-ing ordering, carrying, and holding costs).
Figure 2.5: Hospital Inventory Management (de Vries, 2009)
Hospital supply chain networks can be characterized as having external and internal distributionnetworks. Complexities arise due to the multitude of products that hospital pharmacies handle cou-pled with the effect of the pharmacy’s middle-man role between hospitals and patients. The phar-macy is tasked with the appropriate allocation of products to the necessary units (Rivard-Royer et al.,2002). Not only do hospitals have to manage the inventory coming into the building and pharmacyfrom vendors, but another level of inventory management exists within the hospital as to where thepharmaceuticals are distributed. The complexity of hospital pharmacy inventory management isdetailed in Figure 2.6 and shows the growing number of final nodes that the pharmaceutical can bedistributed to internally.
16

Figure 2.6: Hospital Supply Chains (Rivard-Royer et al., 2002)
Hospital inventory systems face constraints regarding demand forecasting, purchasing, receiving,handling, replenishment operations, distribution, and inventory control. The level of these con-straints varies given the unit or subsidiary within the hospital (Lapierre & Ruiz, 2007). Given the in-tricacies of stakeholder requests and process involvement, inventory management policies are man-aged by hospital networks on a case-by-case basis based on prior performance and local expertiselevels.
2.2.2 RETAIL PHARMACY INVENTORY PROCESSES
Retail pharmacies face demand uncertainties based on complex factors influencing their consumers.Demand volatility, coupled with minimal inventory planning processes or software utilization, haslead to a bullwhip effect as the volatility propagates back through the supply chain (Papanagnou &Matthews-Amune, 2018). Minor fluctuations at the retail level can lead to larger implications at themanufacturer level, depending on the level of risk and the reaction by intermediaries within the net-work. Figure 2.7 shows the demand volatility for a generic over the counter drug at a retail pharmacyover the span of 130 weeks.
Figure 2.7: Example Over the Counter, Generic Drug Weekly Demand (Papanagnou & Matthews-Amune, 2018)
17
Pharmacies need the ability to forecast demand accurately and implement a standard orderingpolicy, usually derived from an economic order quantity (EOQ) (de Vries, 2009).
2.3 INTERNET OF THINGS TECHNOLOGY
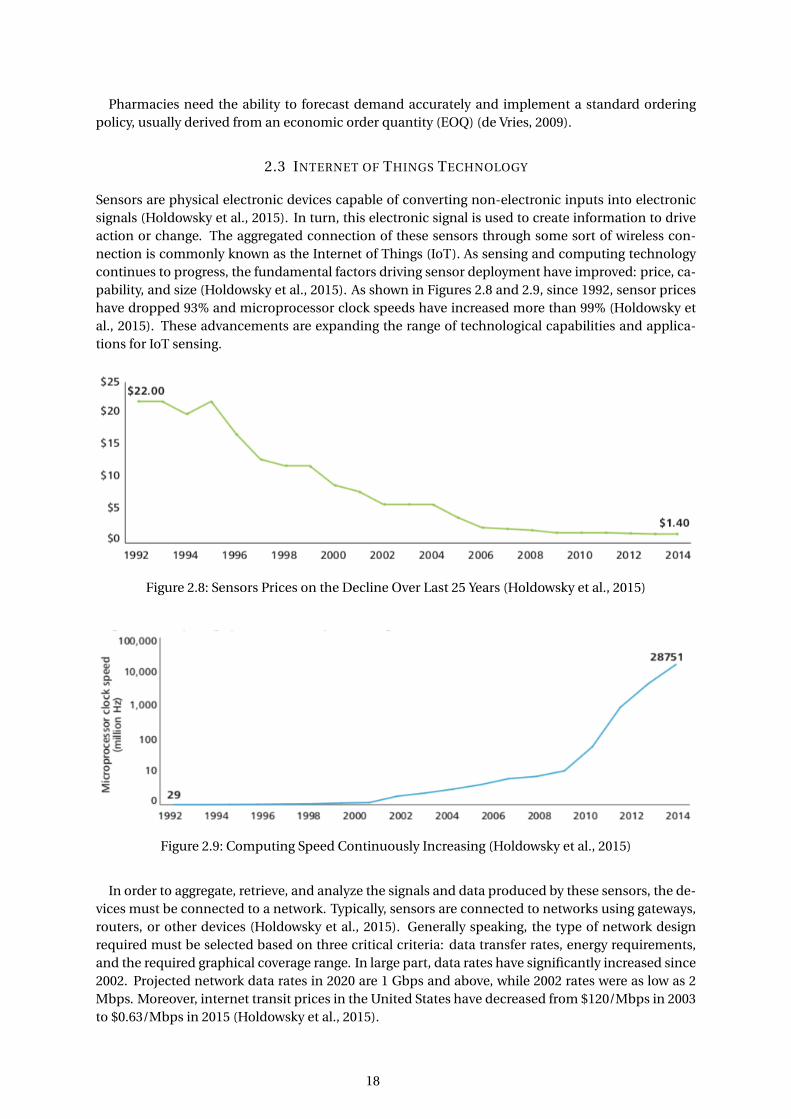
Sensors are physical electronic devices capable of converting non-electronic inputs into electronicsignals (Holdowsky et al., 2015). In turn, this electronic signal is used to create information to driveaction or change. The aggregated connection of these sensors through some sort of wireless con-nection is commonly known as the Internet of Things (IoT). As sensing and computing technologycontinues to progress, the fundamental factors driving sensor deployment have improved: price, ca-pability, and size (Holdowsky et al., 2015). As shown in Figures 2.8 and 2.9, since 1992, sensor priceshave dropped 93% and microprocessor clock speeds have increased more than 99% (Holdowsky etal., 2015). These advancements are expanding the range of technological capabilities and applica-tions for IoT sensing.
Figure 2.8: Sensors Prices on the Decline Over Last 25 Years (Holdowsky et al., 2015)
Figure 2.9: Computing Speed Continuously Increasing (Holdowsky et al., 2015)
In order to aggregate, retrieve, and analyze the signals and data produced by these sensors, the de-vices must be connected to a network. Typically, sensors are connected to networks using gateways,routers, or other devices (Holdowsky et al., 2015). Generally speaking, the type of network designrequired must be selected based on three critical criteria: data transfer rates, energy requirements,and the required graphical coverage range. In large part, data rates have significantly increased since2002. Projected network data rates in 2020 are 1 Gbps and above, while 2002 rates were as low as 2Mbps. Moreover, internet transit prices in the United States have decreased from $120/Mbps in 2003to $0.63/Mbps in 2015 (Holdowsky et al., 2015).
18

Collectively, the technological innovation of sensors and wireless network infrastructures has en-abled staggering increases in the number of connected devices. Globally, the total number of con-nected devices has increased from 0.5 billion in 2003 to 42.1 billion (projected) in 2019 (Holdowsky etal., 2015). This exponential device growth is likely to continue as industry trends demand increaseddata visibility and analysis, while technology consumers continue to demand faster network configu-rations. The remaining sections of Chapter 2 detail the most common tracking technology platformsacross a variety of industries as well as the relevant advantages and disadvantages of each platformas it relates to the sponsor’s pharmaceutical application.
2.3.1 NARROW-BAND IOT TECHNOLOGY
One common type of IoT technology infrastructure design is Narrow-Band (NB) IoT. NB IoT is de-signed for portable devices to leverage ubiquitous carrier networks. The infrastructure is designed toallow a significant number of devices to operate within a 200 MHz spectrum range. NB IoT devicesare attractive due to their improved indoor coverage, low power consumption, low device cost, andmassive connection capacity (Huawei, 2016). The low device costs delivered by NB IoT devices iscritical. Figure 2.10 compares the average cost of a NB IoT device relative to comparable IoT networkdevices.
Figure 2.10: Wireless Module Price (Huawei, 2016)
The most common NB IoT applications are found within various public and private sectors. Theseinclude, but are not limited to, smart metering (utilities), alarms, asset tracking, and smart agricul-ture (Huawei, 2016). Among all of these applications are the common attributes of low maintenancecosts, minimum device intervention, and large geographic coverage. Moreover, these applicationsare proven to be reliable in practice, as demonstrated by Huawei’s China Unicorn marking meterprogram and water metering solution delivered with Vodafone in 2015 (Huawei, 2016). Overall, thelow-cost, low-maintenance, and high-coverage characteristics of NB IoT make it incredibly appeal-ing for corporations seeking to implement product-integrated technology. The downside to the tech-nology, however, is its often large or non-functional physical form it takes as a commercial sensingproduct. The lack of innovation in NB IoT size reduction is a daunting hurdle for space-constrainedapplications. This trade-off is critical for public and private implementation initiatives to considerearly in the design phase of IoT ventures.
19

2.3.2 MESH NETWORKING TECHNOLOGY
Most wireless network types are star networks. Star networks are composed of devices that are alluniquely connected to a single central device, which then connects its subsequent devices to thesecondary cloud network. Wireless Mesh Networks (WMNs), on the other hand, are composed ofdevices that are all connected to themselves, then directly to the cloud network through one of thedevices. WMNs are communication networks made up of radio nodes organized in a mesh topologyinstead of a star topology (Liu et al., 2017). Figure 2.11 depicts the differences between a star andmesh network.
Figure 2.11: Mesh Versus Star Network (Liu et al., 2017)
Mesh network IoT configurations have a few distinct advantages. Primarily, expanding coverageof the network is fairly simple. In most cases, simply connecting a new router within the geographicrange of existing network devices is sufficient to amplify coverage in a new area (Liu et al., 2017).Moreover, once installed and powered, devices connect to the existing network automatically. Thistype of flexibility minimizes the amount of technical expertise and disruption required to serviceor expand existing WMNs. This ease of accessibility minimizes the cost of establishing networksin hard-to-access or remote areas without reliable coverage, such as rural regions (Liu et al., 2017).Furthermore, WMN system energy costs are typically lower than other IoT network infrastructures.Because most devices are connected over shorter distances than they are with a star network design,they do not require a central node to continuously connect distant devices (Liu et al., 2017). Thisshorter connection span reduces the energy required to power central devices.
WMNs also prevent a few disadvantages. A substantial amount of hardware is required to createthe WMN. Without an existing WMN in place, routers and connection points must be establishedin every area of potential use. Additionally, significant limitations exist with respect to the amountof data the end-node IoT devices can transfer while on a WMN (Liu et al., 2017). If the practicalrequirements of an IoT system require significant amounts of data transfer, a WMN may not be thebest choice.
2.3.3 RADIO FREQUENCY IDENTIFICATION (RFID)
Radio Frequency Identification (RFID) is a newly-popular method for tracking items throughout sup-ply chains. RFID systems are composed of three components: a 1) tag 2) interrogator and 3) con-troller, as shown in Figure 2.12 (Hunt et al., 2007). A tag, also called a transponder, typically consistsof a small chip-based device, antenna, and sometimes battery (Hunt et al., 2007). The tag attachesto the desired device to be tracked. The interrogator serves as the read/write device for the system -this is what identifies the tag and its characteristics. The interrogator communicates information toand from the tag via radio waves whenever the tag is within the read zone of the interrogator. Lastly,the controller is responsible for receiving and updating information from the interrogator(s). As theinterrogator retrieves new information from the tag, it transmits information to the controller via astandard LAN or wireless network (Hunt et al., 2007). Thereafter, the controller, often in the form of a
20

PC or workstation, updates the desired database with data from the interrogator (Hunt et al., 2007).This three tier processed is outlined in Figure 2.12.
Figure 2.12: RFID System Device Configuration (Hunt et al., 2007)
These networks may have multiple tags and transponders established on the same system, creatingsignificant flexibility for diverse applications. RFID technology applications fall into two categories:active and passive. Active RFID does not require the use of a stationary reading device and can trans-mit a signal across multiple miles. However, given the current cumbersome size, minimal batterylife, and exorbitant cost of this technology, is it not being considered at length for this practical case.Passive RFID, on the other hand, is achievable in many ways. Simply put, passive RFID technol-ogy enables a sensor to communicate with an immobile reader. This reader receives informationfrom the sensor and transmits the sensor’s information up through an established wireless network.RFID technology networks can be separated into four distinct categories: low frequency (LF), highfrequency (HF), ultra-high frequency (UHF), and microwave (Lewis, 2004). The frequency range ofthese various networks range from less than 135 KHz (LF) to 2.45 GHz (microwave), as outlined inTable 2.1 (Lewis, 2004). The primary considerations and trade-offs when considering RFID networksare 1) read range, 2) tag size, and 3) tag cost.
Table 2.1: Passive RFID Frequency Characteristics (Lewis, 2004)
21

The read range of passive RFID tags ranges from less than 0.5m with LF technology to about 4-5mwith UHF technology (Lewis, 2004). While vastly different on a small scale, these ranges are minimalcompared to other IoT network technology scales capable of connecting over multiple miles. Tagsize, while also varying, is relatively small. Passive RFID tags can be as small as the hotel key cardsthat fit in a wallet, or the security tags that are attached to expensive clothing items at retail stores.Additionally, tag costs are generally less than one U.S. dollar, making them financially accessible formost applications.
As previously mentioned, passive RFID technology requires the mobile tag device to come intoclose proximity with stationary readers (Lewis, 2004). The determination of required readers andassociated support networks can be cumbersome. Additionally, the business and financial relation-ships required to establish these reader networks across different organizations can be daunting, ifnot impossible. While passive RFID systems are reliable and have a low financial barrier to entry,they are typically most successful when implemented within a single organization.
2.3.4 BLUETOOTH NETWORK DESIGN
Bluetooth technology allows devices to connect across short distances. Primarily, Bluetooth tech-nology was created for short-term communications between wireless devices such as headphones,keyboards, and portable cell phones as a means for wireless communication between equipment anddevices (Harte, 2004). Although it originally formed as a means for wireless audio communication,Bluetooth technology has rapidly expanded to various applications including tracking, advertising,and external beacons for Bluetooth-enabled smartphones. Examples of these devices are shown inFigure 2.13.
Figure 2.13: Bluetooth Sample Devices (Harte, 2004)
The characteristics of Bluetooth include an unlicensed frequency band that ranges from 2.4 GHzto 2.483 GHz (Harte, 2004). This frequency band was chosen because it is available for use in mostcountries throughout the world (Harte, 2004). Connectivity options for Bluetooth include ClassicBluetooth and Bluetooth Smart (or Bluetooth Low Energy, BLE) for point-to-point, mesh, or othernetworks (Silicon Labs, 2019). While Bluetooth Classic is able to transmit at a higher communicationrange, Bluetooth Smart uses significantly less power and cost overall (Silicon Labs, 2019).
Overall, Bluetooth has significant advantages when creating an IoT network. For example, it hasa low barrier to entry from a development perspective. Smartphone companies such as Apple andGoogle have provided mature tools for developing the applications needed to access external Blue-tooth devices (Silicon Labs, 2019). Therefore, IoT device developers can easily design devices withinstant compatibility with major smartphone manufacturers without having to invest in lengthy andcostly integration configuration. This ease of development has triggered the explosion of Bluetoothapplications in various commercial applications. Additionally, Bluetooth devices are both physicallysmall and consume low levels of power. Oftentimes, Bluetooth tags can be as small as a quarter orhouse key.
Furthermore, the average cost of Bluetooth device tags is the lowest among all IoT devices. Theaverage cost of a Bluetooth device is only $1, as shown in Figure 2.9 (Huawei, 2016). This low fi-nancial barrier provides significant flexibility for application in ambiguous environments. However,
22

Bluetooth technology also has its disadvantages, primarily range. Bluetooth tags typically cannot bedetected more than a few hundred feet away from the active devices that read them (e.g. cell phones).Moreover, these tags are passive and require pinging from the connection device in order to transmitdata. As the number of Bluetooth-capable devices grows, signal congestion and interference may be-come a concern. Because the utilization of Bluetooth bandwidth is not regulated nor licensed, signalcongestion at similar frequencies can slow or prohibit connections during peak times (Harte, 2004).
2.3.5 SIGFOX NETWORK DESIGN
Founded in 2010, Sigfox is a proprietary, privatized network solution that companies may leveragefor their IoT needs (Sigfox, 2020). While most IoT network platforms are largely open-source with theopportunity for companies to build solutions on top of existing infrastructures, Sigfox is not. Mekkiobserves, "Sigfox deploys its proprietary base stations equipped with cognitive software-defined ra-dios and connect them to the back end servers using an IP-based network," (p. 2). Moreover, Sig-fox sells its solutions in various form factors: transceivers, modules, development kits, and others.Sigfox’s privatized network provides companies with a reliable service model to maintain networkinfrastructure and connectivity.
Sigfox IoT tracking devices range in size. Based on the retail inventory listed on its website, Sigfoxappears to have dozens of device options with an average device size similar to a luggage tag (Sigfox,2020). Furthermore, the average device price in 2020 was around $9 in a traditional single-unit retailenvironment. Given its private network design, a critical factor for companies considering Sigfox so-lutions is its network coverage. Figures 2.14 and 2.15 depict Sigfox’s network coverage in the UnitedStates and Europe, respectively, as of March 2020. Light blue indicates regions where coverage al-ready exists, while the purple indicates regions where coverage is currently being rolled out.
Figure 2.14: Sigfox Coverage Map: United States (Sigfox, 2020)
Figure 2.15: Sigfox Coverage Map: Europe (Sigfox, 2020)
23

As indicated in the maps above, Sigfox does not currently have nationwide coverage in the Unitedstates. While it does have established coverage zones in major U.S. cities such as Chicago, San Fran-cisco, and New York City, the lack of coverage across the country is sufficient to prevent a corporationof the sponsor’s scale from employing its network services. While it may be growing its coverage ar-eas, Sigfox’s current U.S. coverage of less than 10% is simply too little to provide a practical result forthe sponsor’s large-scale tracking needs. This is a potential solution for the sponsor to consider infuture years if the Sigfox coverage area expands in conjunction with lowered tracking device size andpricing. However, the existing high level of coverage in Europe may indicate a feasible solution forthe sponsor’s parent company’s business solutions at this time.
2.3.6 TECHNOLOGY COMPARISON
Five major considerations need to be considered when selecting the most viable path forward for thesponsor: battery life, cost, device size, communication range, and beacon requirements. Table 2.2displays an aggregated view of the general characteristics for each IoT network’s critical variables.
Table 2.2: IoT Technology Comparison
The most feasible technology option for the sponsor’s application is Bluetooth technology. Blue-tooth technology provides the lowest cost, smallest size, and most autonomous solution of all avail-able technologies at this time of writing. While Bluetooth devices typically do not have the longestbattery life, the existing battery range is sufficient to meet the sponsor’s inventory shelf life of one totwo years. Additionally, Bluetooth’s detection range is near the median of available platforms - lessthan 10% of Narrow Band and SigFox alternatives. However, given the accessibility and close range ofits mesh-like, public cellular beacons, this is not a critical weakness. Given the cost, size, and auton-omy of Bluetooth IoT networks, it is clearly the best path forward for the sponsor’s pharmaceuticalapplication.
2.4 SIPOC APPROACH
The SIPOC (short for Supplies, Inputs, Process, Outputs, and Customers) approach generates valueby producing a quick, simple, and high-level overview of a defined process and its components’ inter-dependencies (Rasmusson, 2006). The model details the suppliers, inputs, processes, outputs, andcontrols of a defined operation or process. SIPOC begins with a top-down view of a system whiledelivering micro-examinations of the tasks that support process or operation of interest. A SIPOCtable or diagram is used to categorize the different areas that interact with each other throughoutthe process being evaluated. The SIPOC tool can either be leveraged in a map or table format, asshown in Figures 2.16 and 2.17, respectively. Map formats, as shown in Figure 2.17, can be helpful tovisualize a process that is initially complex or ambiguous for stakeholders to understand.
24

Figure 2.16: SIPOC Process Map (Rasmusson, 2006)
Figure 2.17: SIPOC Process Example: Table Format (SIPOC Diagrams, 2020)
Map formats can be helpful to visualize a process that is initially complex or ambiguous for stake-holders to understand. Rather than using a SIPOC map, the team leveraged a table that simply listseach component of the SIPOC methodology in a more functional format. For the purposes of thisstudy, the SIPOC tool was primarily used to outline cross-functional components of the sponsor’ssupply chain. In this case, the tool’s value was to ensure that no supply chain stakeholders were ex-cluded from any part of the supply chain impact study. The tool’s structure of identifying high-levelprocesses and detailing each processes’ supplier, input, output, and customer ensured the team en-capsulated all of the sponsor’s supply chain stakeholders and partners that may be affected by an IoTimplementation.
25

3 METHODOLOGY
3.1 BACKGROUND
The applications of IoT technology have blossomed as devices and infrastructures become morepractical and inexpensive. Given the size, cost, and regulatory requirements of manufacturing andshipping pharmaceutical products, use of IoT as an end-to-end inventory tracking solution is in itsinfancy as a solution for pharmaceutical manufacturers. Therefore, the following methodology andsolutions discussed in this study are exploratory and naïve. To identify practical solutions, the teammust first understand what level of tracking is possible. The methodology outlined in this chapterdepicts various possible solutions, explored through projections and real-world experiments, andprojected corporate benefits of each solution.
3.2 REAL-WORLD CAMBRIDGE EXPERIMENT
3.2.1 PRODUCT INTRODUCTION
As outlined in the Literature Review, the most feasible IoT network platform for the sponsor companyis Bluetooth technology. Numerous corporations have created small IoT devices used to track indi-viduals’ personal items, such as keys and wallets, through Bluetooth signals that connect to users’cell phones. This connection of physical trackers to cell phones essentially creates a Bluetooth meshnetwork. A potential IoT inventory tracking solution for the sponsor company is to leverage one ofthese device platforms to embed Bluetooth trackers within the sponsor company’s product packag-ing. After delivery to the store, the Bluetooth trackers connect to an accessible Bluetooth wirelessnetwork to transmit location and time data back to the sponsor company, creating a real-time inven-tory snapshot of the retailers’ sponsor company inventory levels.
One example of an existing Bluetooth tracker provider is Company X, a manufacturer of small key-chain-like Bluetooth tags. Company X manufacturers and sells small key-chain-like trackers to con-sumers to help them track everyday items likely to be misplaced. Once a tag is purchased, the cus-tomer downloads the Company X application to their mobile device. The application, through thephone’s Bluetooth and cellular network, tracks and manages the owner’s Company X tag location andhistorical data. Company X’s Bluetooth tags connect to any Company X customer’s phone within thedevice’s read range (between 150 and 400 ft., depending on the model). Customers’ mobile phones,through the app, then autonomously transfer tracker data (location, time, etc.) through their respec-tive cellular networks to Company X’s database. Figure 3.1 depicts the connection flow between aBluetooth tracker, implanted within the sponsor company’s product packaging, to consumers’ cellphones, to Company X’s database through cellular signals.
Figure 3.1: Company X Bluetooth Connection Structure
If a customer loses the designated item or tag, he/she can use their Company X application toleverage the Company X community of users whose mobile devices have come within read range of
26

their device to locate the lost tag. The device’s location coordinates, now "found" by other users’ cellphones and transmitted to Company X’s database, is then shared from Company X and electronicallytransferred to the device’s owner so it can be retrieved.
3.2.2 APPROACH OVERVIEW
In order to project the effectiveness of this proposal on a national, full-scale implementation level,the team needed to project the potential frequency of natural Company X user data collection throughthe presence of trackers at the sponsor company retailers. In other words, answering the question:"How many times does a Company X customer, with the Company X app, come within Bluetoothrange of the sponsor company products in their customers’ inventory storage areas (retail pharma-cies, hospitals, clinics, etc.)?" Answering this question on a national level is challenging given thedegree of diversity in American regions: cities versus rural areas, West coast versus East coast, age de-mographics, pharmacy accessibility, and more. Further, the team crafted the solution in two phases:
1. Local Company X deployment experiment as a technology proof-of-concept
2. Data analysis for national Company X deployment model and implications
Phase one involved attempting to project Company X ping frequency for a specific, known geo-graphic area. After projecting ping frequency in this area, the team deployed physical Company Xtrackers at target pharmaceutical locations around the area and collected data to test the ping fre-quency hypothesis. After collecting ping frequency data from the deployed trackers, the team ana-lyzed the data and adjusted their initial assumptions and calculations to create a national forecastingmodel for the sponsor company inventory visibility through future tracker deployment. Ultimately,this two-tier approach provides a baseline for how practical the Company X (or similar Bluetoothinfrastructure) solution may be in the retail pharmacy industry.
Notably, this experimental approach does not include assessing the feasibility of such technologyin the hospital or clinical healthcare environments. These customer segments were intentionallyexcluded for two primary reasons. First, these customers represent a minority of the sponsor com-pany’s sales relative to the revenue volume that flows through retail pharmacies. Second, hospitaland clinical environments were excluded due to their high barrier to entry. The open, consumer-focused shopping nature of major pharmaceutical retailers facilitates easy access and monitoring.Hospitals and clinics, on the other hand, are more controlled due to the information protection oftheir patients and customers. Moving forward, these markets may be targeted for Bluetooth trialsafter establishing appropriate partnerships with the responsible company employees or executives.
3.2.3 PING FREQUENCY HYPOTHESIS
The word "ping" is commonly used to refer to a communication instance between an IoT tracker anddetection device. When an IoT tracker, such as a Bluetooth tag, "pings" off of a customer’s mobile de-vice, it represents the specific connection and communication instance between the mobile deviceand Company X tag, which is then transmitted back to Company X’s database. From this point on-ward, the word "ping" will be used to describe a unique connection between an IoT tag and detectiondevice, such as a Company X tag and user’s mobile phone.
The regional scope of this analysis was restricted to the city limits of Cambridge, MA, due to itsclose proximity to the MIT team. Moreover, the Cambridge, MA region houses retail locations repre-senting a wide variety of demographics, including both populous urban environments and residen-tial/suburban shopping environments. This diversity assisted the experimenters in extrapolating re-sults from the Cambridge, MA region to a national level when analyzing and projecting the results. Asmentioned previously, the business and application scope of this analysis was for retail pharmaciesonly. It does not, however, include hospitals or health clinics. Lastly, the ping frequency projection
27
only includes data from each store’s direct patrons. It does not include potential pings from nearbypedestrians, nor does it include potential pings from nearby vehicles or delivery services.
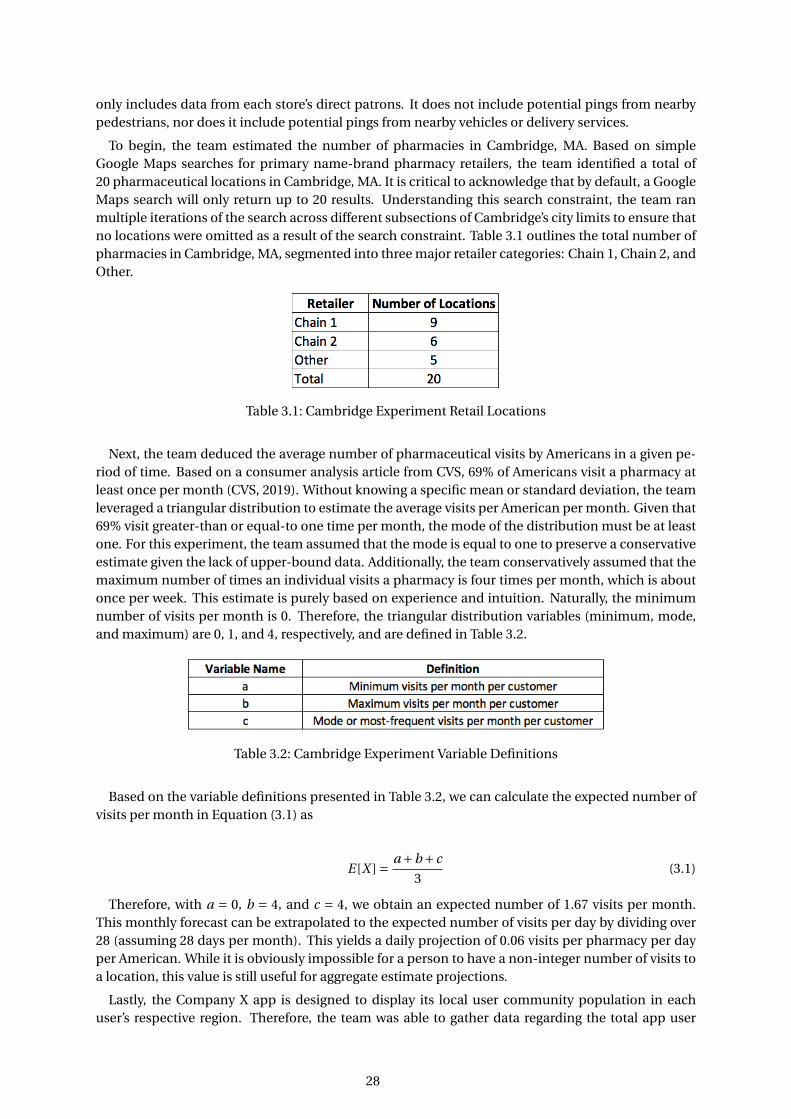
To begin, the team estimated the number of pharmacies in Cambridge, MA. Based on simpleGoogle Maps searches for primary name-brand pharmacy retailers, the team identified a total of20 pharmaceutical locations in Cambridge, MA. It is critical to acknowledge that by default, a GoogleMaps search will only return up to 20 results. Understanding this search constraint, the team ranmultiple iterations of the search across different subsections of Cambridge’s city limits to ensure thatno locations were omitted as a result of the search constraint. Table 3.1 outlines the total number ofpharmacies in Cambridge, MA, segmented into three major retailer categories: Chain 1, Chain 2, andOther.
Table 3.1: Cambridge Experiment Retail Locations
Next, the team deduced the average number of pharmaceutical visits by Americans in a given pe-riod of time. Based on a consumer analysis article from CVS, 69% of Americans visit a pharmacy atleast once per month (CVS, 2019). Without knowing a specific mean or standard deviation, the teamleveraged a triangular distribution to estimate the average visits per American per month. Given that69% visit greater-than or equal-to one time per month, the mode of the distribution must be at leastone. For this experiment, the team assumed that the mode is equal to one to preserve a conservativeestimate given the lack of upper-bound data. Additionally, the team conservatively assumed that themaximum number of times an individual visits a pharmacy is four times per month, which is aboutonce per week. This estimate is purely based on experience and intuition. Naturally, the minimumnumber of visits per month is 0. Therefore, the triangular distribution variables (minimum, mode,and maximum) are 0, 1, and 4, respectively, and are defined in Table 3.2.
Table 3.2: Cambridge Experiment Variable Definitions
Based on the variable definitions presented in Table 3.2, we can calculate the expected number ofvisits per month in Equation (3.1) as
E [X ] = a +b + c
3(3.1)
Therefore, with a = 0, b = 4, and c = 4, we obtain an expected number of 1.67 visits per month.This monthly forecast can be extrapolated to the expected number of visits per day by dividing over28 (assuming 28 days per month). This yields a daily projection of 0.06 visits per pharmacy per dayper American. While it is obviously impossible for a person to have a non-integer number of visits toa location, this value is still useful for aggregate estimate projections.
Lastly, the Company X app is designed to display its local user community population in eachuser’s respective region. Therefore, the team was able to gather data regarding the total app user
28

population in Cambridge, MA in November 2019. In order for this entire population to be consideredas potential mesh network nodes, this data analysis includes a few key assumptions: 1) all CompanyX users have Bluetooth enabled and are sharing their location with the application 2) the CompanyX user figure only includes users who still have the app and not users who have potentially deletedor deactivated the app and 3) all users reside within the Cambridge, MA area (an assumption laterdebunked in Chapter 4). Using the data compiled above, the team projected the number of userpings per pharmacy per day in Cambridge, MA. Equation (3.2) depicts this result, where N is thenumber of Company X users, v is the average customer visits per day, s is the number of pharmaciesin Cambridge, and p is the number of pings per day.
N v
s= p
s(3.2)
This analysis yielded a projected figure of 43.9 pings per day per pharmacy in Cambridge, MA. Thelist below outlines critical assumptions made when created the projected pings per day figure. Theseassumptions were reviewed at the end of the Cambridge Company X Experiment for relevance basedon the results of the study.
• Company X users follow the same pharmaceutical habits and preferences as the average Amer-ican
• The time frame of the Cambridge Company X experiment reflects similar demand patterns ofthe time frame used for the CVS consumer analytics report
• All stores have a physical footprint smaller than a 200 ft. radius; all customers will be closeenough to the inventory to ping the Bluetooth trackers
• No stores were missing from the store data identified
• No pedestrian data was included for pedestrians near stores who could ping trackers
• No vehicle data was included for drivers near stores who could ping trackers
• All days were treated equally; the analysis does no stratify customer visit density based on day-of-the-week or holidays
• All Company X users had the location service and Bluetooth service activated on their phone
• All Company X users still had the app and no users have potentially deleted or deactivated theapp
• All Company X users in the "Cambridge" area resided within Cambridge, MA
3.2.4 PILOT DATA COLLECTION - CAMBRIDGE, MA
At the time of this writing, Company X manufactures and sells numerous products, ranging in charac-teristics such as size, battery life, and cost. Of these models, the "Long" tag has the median detectionrange (200 feet), median battery life (one year), and median size. Based on these characteristics, theteam acquired 20 Long tags for this experiment. Additionally, the MIT and the sponsor companyteams established a working partnership with Company X’s customer support team. This partner-ship included establishment of an API connection into Company X’s database for the 20 specificLong tags the team acquired, allowing the research team to obtain all tracking details and history as-sociated with the acquired tags after activation. Based on sales volume and retailer inventory storageenvironments, the detection and battery range of the Company X Long model is sufficient to simulatean actual use case.
Each tag was designated with a unique identifying number between one and 20, then assigned to aspecific storefront location. Upon deployment, each tracker was physically hidden somewhere inside
29

the retailer within 30 feet of the pharmacy counter. This proximity to the pharmacy was intended tosimulate the sponsor company’s product inventory typically stored behind the pharmacy counter. Inthis case, the deployed tracker mirrors a potential tracker within a sponsor company case, box, or vialstorage container. Considerations for placement included visibility and communication barriers. Forexample, while placing a tag within a metal display rack may keep it hidden, the metal structure mayact as a Faraday cage and prevent transmission of a signal between the tag and user phones. Often,the tags were placed within cardboard or paper end cap displays or greeting card slots where theywould not be discovered and could still transmit a signal. This combination of signal accessibilityand low visibility ensured a longer data collection window without discovery and removal of the tags.
Between November 21 and 22, 2019, the MIT team cascaded and deployed all 20 of the CompanyX Long tags to the 20 targeted retail pharmacy locations within Cambridge, MA. Upon deployment,each tag was tested through the Company X mobile application to ensure it was sending a clear signalfrom its resting point. Unfortunately, one of the tags did not transmit a signal due to either a batteryor technology malfunction. While potential manufacturing defects are important to consider whencalculating large-scale implementation risks, this specific tag was over a few months into its life cycleand believed to be a special-cause outlier. However, this occurrence highlights the importance of thesponsor company evaluating the long-term failure rate of its eventual device provider. Due to thismalfunction, only 19 of the targeted pharmacies produced data over the course of the experiment.
3.2.5 COMPANY X CAMBRIDGE EXPERIMENT: DATA COLLECTION CONSIDERATIONS
With the trackers placed at the selected pharmacies, the team captured consumer ping data betweenNovember 22, 2019 and March 1, 2020 - a total of 100 days. The sample includes multiple majorUnited States holidays (Thanksgiving, Christmas, and New Year’s Day) and an unseasonably warmwinter for the greater Boston, MA area. Given the limited opportunity to collect data over the courseof multiple years, seasonality effects such as these will not be quantified in the data analysis portion.Rather, their influence may or may not be present in the data, which poses forecasting risk for year-round, nationwide implementation moving forward. However, the factors potentially contributing toincreased pharmaceutical sales over this seasonal period should be somewhat offset by the retailers’wide range of products and offerings (food, utilities, photo services, cosmetics, etc.). This diverseproduct portfolio should drive some level of consistent foot traffic regardless of peaks or troughs inpharmaceutical demand.
External factors that will be taken into consideration for the density distribution analysis includeproximity to public transportation, proximity to universities, store brand, and weekday. Other factorsthat will also be analyzed are unique users (potential for a pharmacist to be a Company X user andthus give false-positive readings), time of day, day of week, and any realizable effects of holidays.The broad assumption that all Company X users actively share location, maintain app storage, anduse Bluetooth functionality may also be studied through a density experiment in the Cambridge, MAgeography.
3.3 SUPPLY CHAIN IMPLEMENTATION
Implementing the proposed technology solution requires a deep understanding of the underlyingsupply chain network, stakeholders, and external relationships to ensure a successful outcome. Sec-tion 3.3 outlines the team’s methodology for approaching the implementation planning aspect of theproject from a business perspective and the individual supply chain operations. While interviewswere conducted to gain a deeper understanding of the sponsor company’s specific operations, theinsights obtained will also be generalized to a broader supply chain level. This high-level analysiswill allow the sponsor company to implement a similar approach for future IoT implementations,regardless of device type or network infrastructure.
30

3.3.1 BUSINESS SCOPE
The sponsor company is a multi-billion dollar organization. Its product portfolio consists of dozensof prescription-based and over-the-counter solutions. Therefore, it is impractical to envision imple-menting a novel IoT implementation across the sponsor company’s entire product platform. Rather,a small subset of product(s) needed to be selected to effectively monitor the solution for challengesand improvement opportunities before implementation on a large scale. The MIT team leveragedthe sponsor company’s innovation group to partner with additional sponsor company divisions andidentify a product or brand team suitable for piloting the IoT technology. Ultimately, the sponsorcompany’s preference was to limit the product scope to a specific medication, referred to henceforthas "Product A".
Product A is manufactured, packaged, and shipped in small rectangular boxes. It is sold in mostpharmacy locations, including major retailers, hospitals, and clinics. In addition to previously-reviewedcost mitigation benefits (such as supply chain data acquisition savings), the sponsor company mayleverage Product A inventory visibility to better forecast and respond-to localized demand spikes.Immediate inventory visibility at the customer level would allow the Product A team to accelerateits timeline of meeting demand in highly concentrated regions, capturing revenue that is currentlymissed without IoT tracking. Between the sponsor company’s large appetite for innovation and Prod-uct A’s current size and growth opportunities, Product A is the perfect pilot development product.
3.3.2 SIPOC APPROACH
This capstone leveraged the SIPOC methodology, as outlined in Chapter 2, to define the supply chainimpact and integration strategy for an IoT solution within the sponsor company’s supply chain.Through research, supply chain case studies, and interviews with sponsor company subject matterexperts, the team identified key stakeholders and barriers to the sponsor company’s IoT implemen-tation through the SIPOC framework and methodology.
First, the team identified the core supply chain functions of the sponsor company’s target product.Through an understanding of the sponsor company’s supply chain structure and previous industryknowledge, the team created a high-level list of each supply chain process: procurement, packag-ing, manufacturing, warehousing, inventory, transportation, distribution, customer relations, andreverse logistics. Additionally, after further review, the team added ancillary support groups that arepivotal to the project’s success, albeit not traditional supply chain fields: legal and environmental,health, and safety (EHS). After creating this comprehensive list of Product A supply chain processes,the team calibrated each process with its sponsor company point of contact and verified that all pro-posed processes were relevant and nothing critical was omitted.
Based on the list of key processes, the team scheduled interviews with the sponsor company’s des-ignated SME for each process. The goal of these interviews was to get the team’s functional questionsanswered and, at a higher level, discuss the IoT proposal with each SME to understand their con-cerns. Rather than taking a strictly academic approach to the problem, the team felt that includingthe sponsor company’s internal experts, who would ultimately own the IoT implementation for theirrespective functions, was the best path to understand the true challenges facing the company’s im-plementation. In each interview, the team peppered the sponsor company’s SME with questionspertaining to the cost and complexity of adding a Company X tag to Product A packaging. For exam-ple, questions involving the transportation function focused on shipment methods, transportationmodes, freight capacity, loading and unloading methods, shipping regulations, etc. Given the an-swers to these questions, as well as additional insights through SME conversations, the team wasable to identify the critical suppliers, inputs, outputs, and customers associated with each process ofthe sponsor company’s Product A supply chain. Table 3.3 details each SIPOC interview conducted,including the target process, sponsor company SME, and date the interview was conducted.
31

Table 3.3: SIPOC SME Interview List
After conducting these interviews, the team completed the SIPOC table, identifying the key sup-pliers, inputs, outputs, and customers associated with each supply chain process. This analysis, withdetailed considerations for supply chain risk and implementation, is detailed further in Chapter 4.
32

4 RESULTS AND DISCUSSION
4.1 COMPANY X CAMBRIDGE EXPERIMENT
Between November 22, 2019 and March 1, 2020, the research team collected 9,280 data points over100 days. There was no scientific reason for concluding data collection on March 1. The team simplyceased data collection from its API (Application Programming Interface) into Company X’s databaseon March 1 to draw a clear end to the data collection process, knowing that the 9,280 data pointswere sufficient to draw statistically significant conclusions.
4.1.1 INITIAL PING DATA RESULTS
To gain a high-level overview of the tracker pharmacy locations and their ping frequencies relative toone-another, the team began by mapping the Company X tracking locations. This geographic densityview is shown in Figure 4.1 and is oriented in the traditional N-E-S-W format.
Figure 4.1: Ping Density Map - Cambridge Experiment
The tracker tag’s geographic coordinates, returned by the Company X API database, were mappedthrough Tableau’s geographic plotting feature. Leveraging a density map, where the density of pingdata points is indicated by the intensity of blue, a simple visual analysis is created to interpret track-ing locations and ping frequency. Without conducting thorough analysis, it appears that locationsnear the Northwest quadrant of Cambridge have higher ping frequencies than those in the Southeastquadrant. At first glance, driving forces behind this result may be the presence of Harvard Universitycampus in the Northwest corner and the de-aggregation of shopper volume in the Southeast cornerdue to a higher concentration of retail locations. These, as well as other factors such as shopper de-mographics, retail brand, etc. may be considered moving forward to draw more causal relationships
33

between deployment areas and ping frequency forecasts.
Before conducting rigorous statistical analysis regarding the ping frequency of pharmaceuticaltrackers, the team reviewed the data at a high level using basic summary statistics and various group-ings. To begin, the data was grouped by retail store location. This level of stratification providedinsights into the different characteristics of customers that may drive high or low probabilities ofCompany X consumer access: location, retail brand, operating hours, product variety, etc. Figure 4.2displays a bar chart of the total number of pings per pharmacy location. Dark blue tones are lever-aged as an additional visual tool to indicate higher ping frequencies, while light blue tones indicatelow ping frequencies.
Figure 4.2: Ping Distribution - Cambridge Experiment
As indicated in the graph, the stores can be split into three general groups regarding ping levels:high, medium, and low. This is not done using a formal grouping method (such as k-means clus-tering) but rather by simple visual observation. The "high" group includes three locations: Long 7,Long 13, and Long 17. These stores account for over half of all store ping data combined, followinga Pareto-like pattern. The most obvious shared characteristic among these locations is their retailbrand: Chain 1. Stores 7, 13, and 17 are all Chain 1 retail locations with a high diversity of prod-ucts. Geographically, stores 7 and 17 are both in high foot-traffic areas with minimal surroundingretail competition. They are likely in real-estate properties with high prices per square foot due tothe pedestrian exposure, such as Harvard Square in a bustling intersection of Cambridge. Tracker13 is in a more suburban location with minimal foot traffic. This appears to be an outlier driven byexternal factors.
The medium frequency group appears to include six locations: Long 1, Long 2, Long 5, Long 9, Long12, and Long 16. Unlike the high frequency group, the medium group does not share any obviouscommonalities. Regarding retail brand, these stores are a mixture of national chains such as Chain1 and 2, as well as smaller regional businesses. They also do not share any significant geographicalcommonalities, other than the presumed general Cambridge area.
The small frequency group includes nine different pharmacies: Long 3, Long 4, Long 6, Long 8,
34

Long 11, Long 14, Long 18, Long 19, and Long 20. As previously mentioned, the Company X tagused for Long 14 is believed to be defective after in-app testing, so this result is likely a false negativeand not included in further analysis. Similar to the medium frequency group, the small frequencygroup does not share any immediately-obvious commonalities. Retail brand, geographic location,and product diversity all vary across this group. A more detailed characteristic and distribution anal-ysis will be covered in Subsection 4.1.2.
4.1.2 PING DATA STATISTICAL FITTING
To understand the characteristics of the Cambridge experiment data set, it must first be correlatedto a distribution type. In order to create a histogram of the data for distribution fitting, the ping datamust be characterized. In this case, the data was grouped into a measure called "Pings per Day perStore". With this grouping, the data was separated into each store location, then further grouped intopings per day by summing the total number of pings at each store in each day. Therefore, each datapoint is a number of pings per day per store. With the raw data grouped into calculated data points, itwas separated into buckets based on various ranges of pings per day per store. Based on the range ofdata points in this experiment, the bin range was set to two, meaning that each bin represents a rangeof two pings per day per store. Figure 4.3 depicts the histogram of pings per day per store, groupedby bin widths of two.
Figure 4.3: Daily Ping Distribution - Cambridge Experiment
Clearly, the lack of symmetry and bell-shaped curve proves that the data does not follow a normaldistribution. The distribution has a clear left skew with a long tail to the right. This is traditionallyrepresentative of either a Poisson or exponential distribution. While the values are low, positive in-tegers, the extreme skewedness toward zero does not lend this distribution toward being Poisson.Rather, it is likely an exponential distribution, based on visual observation. Creating a best-fit line of
35

the Cambridge, MA pilot data provides a platform to correlate various attributes of the Cambridgearea (number of Company X users, population density, etc.) to its distribution of pings. Moving for-ward, this type of factorization can be used in other cities to correlate their known unique variablesto a forecasted ping frequency distribution. In order to fit the data to an exponential distribution,its values must be transformed from a linear dataset to an exponential dataset. This was executedusing a log-level regression model. Furthermore, this type of model can be used to predict the distri-bution or likelihood of pings in various geographic regions moving forward. The standard log-levelregression equation is shown in Equation (4.1).
l n(y) =βx +δ (4.1)
Equation (4.2) depicts the best-fit line correlating the number of pings to their likelihood for theCambridge, MA experiment.
ln(y) =−0.405x −1.38 (4.2)
This exponential fit matches the theoretical equation with values β = -0.405 and δ = -1.38. Thesummary statistics produced by the regression are shown in Table 4.1.
Table 4.1: Regression Summary Statistics
Equation (4.2) inputs a given number of pings per day at a store and returns the probability ofgetting that many pings per day per store. For example, there is about a 16.8% chance of storeshaving exactly 1 ping per day. The remaining distribution is shown in Table 4.2.
Table 4.2: Exponential Likelihood of Pings/Day/Store
Ultimately, the purpose of the experiment was to determine the feasibility of the community-basedBluetooth infrastructure. As the customer of this implementation, the sponsor company must deter-mine how to define a "feasible" or worthwhile level of ping frequency. The internal sponsor companyteam determined that a consistent return of at least one ping per day per retail location is "feasible"for this application. Simply stated, if the sponsor company is able to get at least one snapshot ofProduct A inventory per day for a retail location, the data is useful for its business needs. Therefore,using the Cambridge pilot data collected, the team was able to create loose projections regarding thelikelihood of retailers achieving this metric.
36

Rather than summing the discrete probabilities of stores having greater-than or equal-to one pingper day, the team simply evaluated the likelihood of stores having zero per day and subtracted thisfrom one. Given that P (0) = 0.2523, P (≥ 1) = 0.7477. Therefore, about 75% of retailers will have atleast one ping per day. This metric provides a simple gauge of effectiveness for the sponsor com-pany’s implementation moving forward. However, this general metric does not include characteris-tic differences between implementation cities and Cambridge that may lead to discrepancies. Theseconsiderations are outlined in Subsection 4.1.3.
4.1.3 NATIONAL DATA OUTLOOK
To create a practical vision for full-scale Company X implementation, the team needed to extrapolatethe Cambridge pilot results across the United States. Given the lack of Company X user informationand Product A customer demand, the following extrapolation focuses on creating ping frequencyinsights for pharmaceutical retailers in major cities across the United States. To create these projec-tions, the team obtained Company X user populations in other cities. Additionally, the team createda means to correlate the Cambridge Company X user population and results with other cities’ pro-jected results based on their respective Company X user populations.
First, the team identified a way to gather Company X user data in different cities. This is the in-formation that the Company X app provides users in whatever region their cellular device is located.The team leveraged their personal and professional networks in various cities across the country toobtain this information. Each participant downloaded, or used, the Company X application and nav-igated to the screen shown above. After observing the number of users in his or her respective area,each respondent sent his or her location and population report back to the MIT team. Data was gath-ered in late February 2020 and is representative of Company X’s customer population in each area atthat time. This collection of crowd-sourced data gathering for each available city is summed in theTable 4.3.
Table 4.3: Company X User Density by City
In the table, each known city is listed with its associated census population and a field labeled"User Density". The "User Density" field (DC ), is calculated by dividing the "Total Company X Users"(N), by the "Census Population" (P) as shown in Equation (4.3).
DC = N
P(4.3)
This User Density figure gives an indication of Company X user concentration in each city. Whileit does not ultimately determine the likelihood of a Company X user walking into a given pharmacy,it does give insight into the penetration of Company X users into each city. Moreover, the metriccreates a normalized method of comparing Company X user popularity across cities with varyingpopulations.
37

Assuming that the number of retail pharmacies is linearly correlated to the population of each city,the User Density field can be leveraged to project the expected ping frequency. This does not give anindication of the total number of pings in a given city, but rather the likelihood that each store withinthat city will return at least one ping per day. The resulting metric is relative to the number of phar-macies in each city or region, but is sound given the assumption of linearity between city populationand number of pharmaceutical retailers. Ping frequency can be projected on a distribution-level, ormore simply through a binary threshold of zero or non-zero pings per day per store. Due to the sig-nificant number of compounding factors that likely affect the expected ping frequency distributionfor retail pharmacies across each unique city, this capstone evaluates only the likelihood of locationsgenerating zero or non-zero pings per day per store.
For example, the Cambridge experiment yielded a 75% likelihood of stores having greater-than orequal-to one ping per day. Cambridge, a few miles from Boston, can be loosely grouped within theBoston population given its close proximity under Company X’s five mile population radius for userreporting. Therefore, the Cambridge population density is nearly 2%, as indicated in the CompanyX user density table. Equation (4.4) dictates how general, linear projections may be made betweenCambridge and other cities based on the Cambridge pilot. LB is Boston ping likelihood, LC is targetcity ping likelihood, DB is Boston user density, and DC is target city user density.
LB
LC= DB
DC(4.4)
Using Equation (4.4), Boston’s ping likelihood (LB = 0.75), and Boston’s user density (DB = 0.190),the Equations below are deduced, where PC is user density as indicated in Equation (4.3):
0.75
LC= 0.0190
DC
DC
LC= 0.0253
Therefore, the percentage of pharmacies generating at least one ping per day can be calculated foreach city polled. A list of these cities and their associated percentage of stores with greater-than orequal-to one ping per day is shown in Table 4.4.
Table 4.4: Percentage of Stores with at Least One Ping/Day
The distribution of the small city subset above outlines a similar distribution pattern to the dailystore ping data outlined earlier. Four of the cities sampled project less than 25% daily store inven-tories, three of the cities sampled project between 25 and 75% daily store inventories, and two ofthe cities sampled project greater than 75% daily store inventories. Clearly, this distribution of store
38

ping data is skewed to the left. However, this data can only be used as an anecdotal projection. Thenumber of cities sampled and specific sample conditions, constrained by the bootstrap samplingmethod, are too narrow to draw scientific conclusions from this type of projection. Moreover, theping projections calculated directly conflict with Company X’s reported most-populous cities.
Ultimately, the sponsor company must deploy a real-world trial, similar to the trial performed inCambridge, MA, to truly understand the Company X inventory ping projections of each desired city.Despite the lack of scientific conclusions, these projections may provide general indicators of rela-tional pings between different cities. For example, San Francisco and Cambridge both have very highping data projections. Generally speaking, these cities tend to be infused with highly tech-savvy em-ployees or students who may be more likely to have the Company X application. It is reasonable tobelieve that cities like these will have higher daily retail ping rates in comparison to Midwestern cities(such as Columbus, OH) and rural or suburban locations (such as Grand Rapids, MI).
4.1.4 ADDITIONAL CONSIDERATIONS: DETECTION RANGE VARIABILITY
The initial Cambridge experiment was executed with the Company X Long tag model. As outlinedin the Chapter 3, the sensing range of the Long model is 200 ft. To understand the impact of devicesensing range on ping frequency, the team deployed an additional tag model into the field: the Com-pany X "Short". The Short model has a sensing range of 150 ft, 50 ft shorter than the 200 ft range ofthe Company X Long. Additionally, the Company X Short is smaller, includes a non-removable bat-tery, and provides an adhesive backing. Table 4.5 highlights the characteristic differences betweenthe Company X Long and Short tag models.
Table 4.5: Company X Model Comparison: Long vs. Short
On February 1, 2020, the team deployed a total of six Short tags throughout Cambridge. TheseShorts were dropped in the same method as the Long tags across three different stores (correlatingto their respective Tracker numbers): Store 7, Store 13, and Store 17. Stores 7, 13, and 17 were chosenbecause they had the highest frequency of pings under the initial experiment and, therefore, wouldprovide the highest volume of data. Over a period of 30 days between February 1, 2020 and March 1,2020, the team collected data between both the Long tags and Short tags in the three target locations.The average pings per day per store are summarized in Table 4.6 below.
Table 4.6: Company X Tag Ping Frequency Comparison: Long vs. Short
39

At a high level, the Short ping frequencies do not appear to be significantly different. Ultimately,a difference of means hypothesis z-test must be leveraged to statistically determine if there is a dif-ference between the average pings per day of the Long tag and Short tag in each specific store. Thedata provided meets all requirements of a two-sided hypothesis test: the data is independent, thesample size is at least 30, and the sampling distribution is approximately normal. To simplify testing,an average of both Short devices (A and B) will be used to represent each store’s Short ping frequency.Therefore, Equation (4.5) shows the established null hypothesis that there is no difference in pingfrequency between the Long and Short pings for each store. The alternative hypothesis, as indicatedin Equation (4.6), is that the ping frequency averages between tag models are not equal.
Ho :µ1 =µ2 (4.5)
Ha :µ1 6=µ2 (4.6)
where µ1 is the ping frequency average of the Long tag and µ2 is the ping frequency average of theShort tag. Given the practical and low-risk application of this technology, a 90% confidence level isused to determine a sufficiency threshold. In order to reject the null hypothesis, the resulting z scorefor each store must be either in the top 5% of data or in the bottom 5% of data. As shown in Table 4.7,the correlating z values deduced for these values are 1.65 and -1.65, respectively.
Table 4.7: Positive Selection of Standard Z Score Values (Z Table, 2020)
Therefore, if the z score for a store is greater than 1.65 or less than -1.65, the Short data is statisticallysignificantly different than the Long data. Using the population mean (µ), standard deviation (σ),and average pings per day (X ), the associated z-score for each store is calculated using Equation (4.7)and displayed in Table 4.8.
Z = X −µ
σ(4.7)
40

Table 4.8: Short Z Scores
As shown above, one store’s z score falls within the acceptance range, while two do not. Store7, with a z score of -0.95, shows no significant difference between the Long and Short model pingfrequencies. In this case, we fail to reject the null hypothesis that the performance of the Long andShorts are equal. Stores 13 and 17, however, demonstrate statistical significance with z scores of -4.33and -2.25, respectively. For these stores, we reject the null hypothesis that the Long and Short modelsperform equally. Generally, the results are mixed. Due to the diverse results and minimal samples,a definitive conclusion cannot be made regarding whether the 50 ft. smaller read-range of the Shorttag, or any other device, would make a significant change to inventory visibility levels. The sponsorcompany must weigh this uncertainty with other device characteristics and costs when determiningthe final device solution for its Product A retail inventory tracking solution.
4.1.5 ADDITIONAL CONSIDERATIONS: THE DEDICATED BEACON EFFECT
While the inventory ping levels in highly-populated, urban areas appear to be sufficient for the spon-sor company’s needs, there is likely a significant decrease in ping frequency in rural or suburban ar-eas. If capturing higher inventory snapshot levels in these areas is a priority for the sponsor company,one solution is to implement a dedicated beacon at retailer locations. This dedicated beacon, eitheran incremental subsidized cell phone, employee-downloaded Company X account, or other Blue-tooth device, would provide retailers a dedicated resource to connect inventory tags to Company X’sdatabase. Although installing a dedicated beacon within a retail location was outside the scope of theCambridge experiment, the experiment did organically create an opportunity to evaluate how muchof an increase a dedicated beacon may provide retailers.
In evaluating the data for each store, the team reviewed all ping attributes for trends. One of theseattributes was the "Client ID" associated with each ping. The client ID, according to Company X, isthe non-identifying unique alpha-numeric account number associated with the device that createsthe beacon ping between a Company X tag and its database at the time of connection. For example,when fictional Jane Doe downloads the Company X application on her cell phone, she is assigned aunique client ID - in this case we will call it 1234. Every time Jane’s cell phone pings off of a CompanyX tag, that ping data includes her client ID of 1234, signaling that her phone is the one that connectedto the tag. Throughout the data review process, the MIT team found that one client ID in particularhad a significantly high number of pings. Moreover, all of its pings were associated with one location:Store 9. Based on the high ping frequency at one specific store, the team hypothesized that this clientID represented an employee at that location who happened to have the Company X app and waspinging the Company X tag while working. The first step to understand if this client ID was an em-ployee was to map the distribution of its pings against the time of day. A cluster of pings consistentlywithin an 8-10 hour time window may correlate to the user’s shift schedule. This relative distributionis plotted in Figure 4.4 on a 24-hour scale, where 0 refers to the hour between 12AM - 1AM, 1 refersto the hour between 1AM - 2AM, and so on.
41

Figure 4.4: Client ID Time-of-Day Ping Distribution
As shown in Figure 4.4, the user’s pings are clearly clustered during early-evening and nighttimehours. The average ping time is 16.97 (about 5PM) with a standard deviation of 3.36 hours. Assuminga normal distribution (based on visual inspection), 68% of the pings fall within a 6.72 hour range, and86% of the pings fall within a 10 hour range. Additionally, the operating hours of this store are 8AM -8PM, meaning about 20% of the user’s pings occur outside of operating hours.
Furthermore, the individual’s data can be evaluated on a day-of-week basis. Pings on certain daysand not others may indicate an employment pattern, rather than shopping habits of a semi-regulatedschedule with scattered frequencies across all days. The histogram in Figure 4.5 plots the percentageof the user’s pings on each weekday, where 0 indicates Sunday, 1 indicates Monday, and so on.
Figure 4.5: Client ID Day-of-Week Distribution
The histogram above demonstrates that the assumed employee creates pings at Store 9 on Mon-days, Tuesdays, Wednesdays, Fridays, and Saturdays. As seen in Figure 4.5, no pings are seen on
42

Sundays and only one ping on Thursday, which technically stems from a late-night shift Wednes-day night when the store was closed. The user’s clustered time-of-day ping data, high frequency ofafter-hours pings, and defined weekday pattern provide compelling evidence that the user is, in fact,a store employee.
Including the suspected store employee’s data, Store 9 averaged 7.44 pings per day. When excludingthe store employee’s data from the data set, Store 9 drops to an average of 2.80 pings per day. Withoutperforming a hypothesis test, the employee’s affect on Store 9’s ping frequency is undisputed: thepresumptive employee raises the store’s average by nearly five pings per day. Albeit a small sample,this insight demonstrates the importance of the sponsor company’s consideration of a dedicatedping device in low-ping retailer locations. Moreover, in the unlikely event that the studied user wasnot a store employee, the ping discrepancy undermines the fragility of data volume based on a singleuser.
Ultimately, the sponsor company’s cross-functional groups including information technology, in-ventory management, and customer relations must understand what this ping increase is worth tothe organization and appropriately incentivize its retailers to engage in beacon partnership.
4.2 SUPPLY CHAIN IMPLEMENTATION STRATEGY
After evaluating the feasibility and proof-of-concept experimental data generated from the Cam-bridge experiment, the team moved to studying the supply chain implications from the proposedIoT technology solution. While Bluetooth was the main focus of the experiment and recommendedtechnology solution, the following learning and applications are replicable across multiple technol-ogy offerings.
This implementation strategy aims to understand the impact of integrating a technological track-ing solution within the sponsor’s supply chain. The team conducted interviews with experts withineach of the below sections, where applicable, to tailor its recommendations and learnings to thesponsor’s current state supply chain operations. While the capstone was focused on the return oninvestment opportunity of a proposed technology solution for inventory visibility tracking, the find-ings and considerations outlined below are largely qualitative and will help move toward implemen-tation in the near future. The sponsor is currently working on an adhesive application with Bluetoothtechnology similar to that of the Company X Short used in the Cambridge Experiment. While the fi-nal form factor and design is unknown, the below considerations and application recommendationsshould be universal to final device selection.
4.2.1 CUSTOMER RELATIONS AND SALES
Chapter 2 outlined the intricacies and interconnected nature of inventory management principlesfrom hospital pharmacies to retail locations. While independent pharmacies define their own princi-ples of inventory management, the relational aspect of communicating the inventory process impactto retailers is where the sponsor must be succinct and complete. Fully understanding each location’sindividual practices does not equate to the successful roll-out of the Bluetooth technology solution.Ideally, the final IoT solution must minimize or negate any change in the behavior of the end user,in this case the pharmacy employee. With this goal at the forefront of the design and technologyselection, the impact to inventory management and handling principles should be minimal at thefirst stage of implementation. Further into the scaling of the technology, the sponsor may create abipartisan relationship between themselves and their pharmaceutical customers by providing datainsights and suggestions from a supply chain perspective based on inventory usage data.
Subsection 4.1.5 provided insights into the frequency of pings based on a dedicated beacon in a se-lect pharmacy. This strategy to include a dedicated beacon device for a given pharmacy may be partof the implementation solution that the sponsor considers when scaling up its IoT solution. Even
43

with the addition of a dedicated device, the proposed solution does not impact the relationship be-tween the sponsor and the pharmacy. Understanding the current state of the individual customerswill allow the customer relations team to tailor the conversation and impact to the customer to indi-vidual cases. This is a critical aspect of the implementation of an IoT device for inventory tracking.Understanding the customers’ current technology infrastructure is also relevant when consideringthe necessary bandwidth and connectivity needs of the proposed solution and the ability of eachcustomer location to support those needs.
The final aspect of communication that would be handled through the customer relations andsales teams would focus on the end state of the proposed technology. Deactivation, disposal, andother considerations are covered specifically in Subsection 4.2.9, but appropriate communicationon the sponsor’s final processes regarding the product’s sale and end of inventory life will be crucialto consistency in interactions. Although the pharmacy expects no change to current procedures, thesponsor’s plan to deactivate the Bluetooth technology for inventory visibility purposes will be part ofthe customer relation and sales organizations impact to the supply chain implementation success.
4.2.2 PROCUREMENT
With the final form factor of the Bluetooth technology solution still under consideration, multiplesuppliers that currently provide solutions within the NB IoT and low-energy Bluetooth technologyspaces may be considered. The ability of a party to successfully negotiate is significantly higher whenit is far from reaching its deadline (Ishihara et al., 2006). As the sponsor approaches the procurementphase of implementing a new component into its supply chain, negotiation for contracts will be atthe forefront of considering request for proposals (RFPs) developed by potential vendors. The firststep in the procurement process is to assess the need for an RFP. This includes knowing the answer tothree questions: 1) exactly what is needed in full detail, 2) is a current vendor already contracted to dosimilar work, and 3) how capable are the included vendors of resolving the proposed need (Hayhurst,2017).
The sponsor should consider some of the following vendors, in addition to Company X, as it searchesfor Bluetooth devices that could be tailored to its needs: Zebra, DigiKey, and Honeywell. Through re-search and previous industry experience, these companies have the ability to tailor solutions to aclient’s needs and can produce at high volumes once a solution is defined.
After determining what price, discount, and delivery options are available, the sponsor’s next stepshould be to identify the economic order quantity (EOQ) given its forecasted demand and inventoryholding cost. This device will likely be a new stock keeping unit (SKU) and product to facilitate withinthe sponsor’s supply chain operations. The procurement team should work with operations to definethe appropriate level of cycle and safety stock to hold on-site for Product A implementation. Equation(4.8) depicts the standard EOQ formula
EOQ =√
2ct D
ce(4.8)
, where ct is the cost of placing an ordering ($/order), D is the demand of the product in units/time,and ce is the product purchase cost. Cost per order, ct, takes into account the total cost to place anorder including: receiving the shipment, processing the products, processing the invoice, auditing,labor, etc. The demand (D) of the product captures the total expected demand over a given timeinterval. The cost of holding excess inventory (ce) includes the purchase cost of the product andthe carrying or holding cost, which is the holding cost of inventory for a specific time period as apercentage ($/inventory $/time). Excess holding costs are different across industries and companies.Typically, it accounts for the cost required to hold inventory, including: shortage costs (warehouse
44
space), service costs (insurance and taxes), risk costs (lost, stolen, damaged, obsolete), and capitalcosts (opportunity cost of an alternative investment) (Silver et al., 2017).
The integration of product details into the sponsor’s ordering systems should be facilitated by gath-ering all pertinent product information from the selected vendor and developing new stock keepingunit affiliates with the information needed to process orders effectively.
4.2.3 MANUFACTURING
the sponsor company’s Product A manufacturing processes are split into two categories: tablet andpackaging. Tablet manufacturing includes the processes that convert raw materials into a ProductA pill tablets for consumption. Packaging includes the processes that convert the Product A tabletsinto a final packaged good for sale. The final packaged good is commonly referred to as a Product Aunit or finished good. The tablet manufacturing process is operated and controlled by the sponsorcompany. Packaging, on the other hand, is operated by a third party firm referred to in this paperas "Co-Packer". Given the scope of the IoT implementation as a packaging change and not a tabletchange, the only manufacturing process affected by this change is Co-Packer’s packaging operation.The MIT team was unable to obtain a technical interview with a Co-Packer representative regardingspecific costs and considerations associated with adding IoT integration to its Product A packagingprocess. Although the addition of a minor IoT tracker to a box may seem simple, a host of packagingfactors exist that the sponsor company and Co-Packer must consider. These considerations can bedivided into two types: operational and strategic. Operational considerations include changes toCo-Packer’s processes within the four walls of their packaging facility, while strategic considerationsinclude the sponsor company’s general approach to change management with Co-Packer.
Historically, when the sponsor company has proposed product or packaging changes, they havesubmitted formal change requests to the Co-Packer team. At that point, the Co-Packer team eval-uated any incremental manufacturing expenses (labor, capital equipment, etc.) and built the costsinto their pricing agreement with the sponsor company. In this case, there is a wide range of possibil-ities regarding manufacturing solutions for the proposed IoT device. A stand-alone tag, such as theCompany X Long, would be simple to drop into a package and rely primarily on a minor change inlabor spend. An adhesive tracker with built-in technology, however, may require additional automa-tion and capital expenditure. Given the lack of interview and site access to the Co-Packer operationalteam, as well as the device form factor uncertainty, the exact change requirements to the manufac-turing line are uncertain. The MIT team strongly recommends that the sponsor company and Co-Packer teams partner to leverage standard process mapping tools (such as Value Stream Mapping)and cause-and-effect tools (such as Failure Mode Analysis) to identify the technical requirementsassociated with the proposed IoT implementation.
Strategically, the sponsor company team must evaluate all internal stakeholders before proceedingwith any packaging changes. Packaging changes may involve cross-functional teams ranging frommarketing, regulatory, engineering, product operations, finance, and more. The MIT team advisesthe sponsor company to leverage a generally-accepted change management framework or definedinternal process for such packaging changes before proceeding with any IoT device implementa-tions. This type of inclusive approach, when leveraged rigorously, may save the organization signifi-cant time and financial waste in the future.
4.2.4 PACKAGING
Product A’s packaging serves three primary purposes: protect/transport the tablets, advertise theproduct/company, and communicate FDA-required information to the consumer. When adding aforeign element (such as an IoT device) to an existing packaging design, analysis must be performedto forecast the change’s impact on these three elements. In this case, adding a Bluetooth tracker
45

will not reduce the packaging’s ability to protect/transport the tablets nor will it interfere with therequired FDA consumer documentation pamphlet. Rather, the device’s most significant impact islikely to the product’s external graphics.
According to one of the sponsor company’s senior packaging engineers, all modifications to thepackaging’s graphics must be submitted through a formal change control process with the FDA. Foran IoT implementation, this means any type of label or adhered tag must be formally submitted-toand approved-by the FDA before product implementation. Additionally, from an internal perspec-tive, the sponsor company must ensure the consultation and approval of the technical packagingteam. This inclusion will ensure that packaging drawings are updated accordingly and any structuralchanges or concerns are addressed and approved by the packaging experts before IoT go-live.
4.2.5 TRANSPORTATION
As outlined in Chapter 2, the sponsor’s existing supply chain network consists of manufacturing,shipment through the internal distribution center, and lastly to its distributors. According to oneof the sponsor’s Senior Supervisor, nearly all of the sponsor’s Product A inbound shipments to thedistribution center arrive via full truckload (Sponsor company, personal communication, 2020). Ad-ditionally, the sponsor claims that most of the sponsor’s outbound shipments from the distributioncenter to distributors are shipped via full truckload (Sponsor company, personal communication,2020). While parcel modes are leveraged for one-off orders and to meet peak seasonal demand, theyonly consist of about 10% of the distribution center’s outbound shipments. Given the heavy em-phasis of full truckload freight usage for Product A, the following transportation analysis will focusprimarily on the full truckload mode. the sponsor must project the incremental cost of parcel ship-ments with more rigorous parcel data. The primary factors that influence an IoT implementation’seffect on the sponsor’s transportation business are cost and regulatory driven.
Adding an IoT device to Product A packaging will not affect the volume nor orientation of eachProduct A case. Moreover, it will not affect the layer pattern nor pallet configuration of each ProductA pallet. The IoT device will, however, add weight to the finished product. Depending on ProductA’s transportation cost structure, this incremental weight increase may directly correlate to increasedshipping costs to and from the distribution center. According to one of Product A’s Channel Analyt-ics Manager, each full pallet of Product A contains over 2,000 units of Product A. Furthermore, onetruckload of Product A contains 20 - 25 pallets of product and cubes-out before it weighs-out (thetruck’s volume capacity is reached before it’s weight capacity is). Given these figures, each truckloadof Product A product contains over 50,000 units of Product A. If the sponsor company’s truckloadexpenses are weight-dependent, the incremental cost from the IoT addition can be calculated bymultiplying the weight of each IoT device by the total number of units per shipment. If, however, thesponsor company’s shipments are priced independently of their weight, this incremental differencewill not impact transportation costs. Rather, the sponsor company must ensure that the aggregatedincremental weight of the final device does not result in exceeding the maximum weight capacity pershipment.
From a regulatory perspective, the sponsor company must consider the implications of shippingbattery-powered devices with their products. If pursuing a device powered by rechargeable lithium-ion batteries, the sponsor company must ensure that proper labels are included at the case and pal-let level. For example, the International Air Transport Association (IATA) mandates the applicationof a "Lithium Battery Mark and Overpack Statement" on every case shipment containing at leastone lithium battery (IATA, 2019). While the IATA’s title only specifically refers to its influence overair transport, it is also the governing organization of land freight shipment regulations. The IATA’slabeling requirements by battery and shipment type are shown in Table 4.9 below.
46

Table 4.9: Battery Shipment Label Requirements (Energizer, 2017)
At this point, Company X’s Bluetooth trackers all use button cell batteries. This type of battery doesnot require specialized labeling at the time of this writing in 2020. Regardless of the final IoT devicetype, the sponsor company’s supply chain team must evaluate any new labeling requirements for itscases that result from the addition of a battery-operated device.
4.2.6 WAREHOUSING
Aforementioned in Subsection 4.2.5, the addition of a Bluetooth device will not change the orien-tation nor configuration of palleted products for the sponsor’s warehousing operations. Inventoryis currently managed through SAP, an enterprise resource planning and data management software.Through creating a new SKU for the Bluetooth technology, all weight and size information will au-tomatically be associated with the product in SAP. While this doesn’t change any of the manual op-eration flows and procedures of warehousing, it does increase the weight of the pallet. A standard,recycled wooden pallet has a capacity of 2500 lbs or approximately 1134 kg and a standard new woodpallet has a capacity of 3500 lbs or approximately 1588 kg (ULINE, 2020). With the additional weightof the Short tracker included per unit of Product A, the weight of the pallet increases by over 10 kg.This increases the total weight of the pallet of Product A to approximately 15% of the recycle palletcapacity and 11% of a new wood pallet’s capacity. With this in mind, the additional weight would notaffect the integrity of a wooden pallet used for warehousing operations. A consideration that wouldneed to be evaluated is whether or not the pallet exceeds the accepted amount of weight to be movedby hand-truck or physical effort by the employee. The sponsor would then need to consider an er-gonomic assessment of the incrementally heavier pallet with the Bluetooth technology included inthe packaging material to determine appropriate warehouse transportation metrics given the changein the weight.
Given the adhesive application of the Bluetooth technology under consideration, minute impactsshould be considered surrounding the overall size of the package. Additionally, the team’s dimen-sional analysis shows that the technology solution will not impact the width, depth, or height ofa normal pallet configuration of Product A. Warehousing a pallet will be no different operationallythan it is today.
When it comes to warehousing at the wholesaler level, there needs to be a conversation facilitatedaround the changes in weight of the pallet and the addition of batteries to the previously battery-freepallets. Through interviews, it is understood that the sponsor currently ships product with batter-ies. This requirement stems from the need to track temperature for other products. Therefore, thesponsor has the existing infrastructure established internally to include the appropriate labels anddocumentation with Product A’s future IoT devices. The wholesale distributor has also handled thesponsor’s products with batteries included in the packaging, however this would be an additionalproduct that also falls into that category and should be communicated accordingly.
47

4.2.7 INVENTORY
The addition of Bluetooth technology does not impact the current inventory processes that the spon-sor currently follows. With a daily cycle count taking place, the addition of the stock keeping unit ofthe Bluetooth technology will be added to the list of products that are included in the cycle count.The value of the inventory will be increased incrementally by the factor of the increase of the costof goods from the device addition. This increases the value of the inventory being held internallyby the sponsor as well as the value of the inventory being passed through the wholesale distributionnetwork.
To facilitate the addition of a new part to the final Product A product packaging, serializing thefinished product offers the ability for the sponsor to track a specific Bluetooth device to a specificpackage of Product A through the supply chain. This will make the nightly cycle count at the dis-tribution center more efficient. Additionally, there is no easy way to check if all products contain aBluetooth device or not, especially during the transition phase. As product is made and the sponsorswitches from Product A packages without a Bluetooth device to the future state of all packages in-cluding the technology for tracking, serialization of the final product will allow SAP to track this rela-tionship through the entire supply chain from manufacturing to purchase of the product. Within thepharmaceutical industry, serialization of products allows for companies to ensure delivery of qual-ity, genuine product to consumers as well as providing a closed loop end-to-end traceable networkfor all serialized product. This increased trace-ability will help the sponsor tackle its industry-widecounterfeit concerns (Shanley, 2017).
One of the sponsor’s inventory managers mentioned that even though the sponsor’s team gets dailyinventory data from the wholesaler, there isn’t specific detail regarding when, where, and how muchinventory is sold to specific retailers nor hospitals through the wholesaler distribution network. Theaddition of inventory location data via the proposed Bluetooth technology infrastructure would allowfor inventory teams to make strategic decisions regarding the shifting and purchasing of product. Notonly does the inventory information of Product A impact how much and where the sponsor shipsits products, it will ultimately travel upstream to facilitate the organization manage its raw goodsinventory decisions when establishing manufacturing processes.
4.2.8 DISTRIBUTION
Given the underlying distribution network outlined in Subsection 1.2.1, the movement of productfrom the manufacturing facility through the internal DC before heading to the wholesaler networkis sponsor-owned inventory. After being passed through the wholesaler and into the final pharmacylocations, the sponsor is still responsible for the product but has no control of movement nor lo-cation. Its relationships with the wholesaler is a crucial aspect of realizing the full potential of theinventory visibility solution. Managing the relationship at the wholesaler level will unlock learningsand inventory opportunities in the final segment of the sponsor’s supply chain. The communicationsand buy-in to the proposed solution should be managed similarly to the outline in Subsection 4.2.1.The wholesaler should receive the same information about the additional technology that the phar-macies do. This addition of technology does not impact the wholesalers’ operations, and in theory,would give insights into inventory management practices and operations.
The addition of the technology solution is a win-win situation between the sponsor and theirwholesalers as it can help manage the variability of demand and requests from the customer level.This partnership will help the smaller distributors maintain positive relationships with their cus-tomer base, especially those that do not currently use electronic data interchanges (EDI’s).
Each distribution channel requires different levels of involvement based on the size of distributorand current state of the its relationship with the sponsor. As outlined in Subsections 4.2.5, 4.2.6,and 4.2.7, there is no expected disruption to current operation practices and standards for any of
48

the stakeholders involved. One of the benefits of Bluetooth technology is that it does not requirechange in behavior from any of the levels of the supply chain involved, aside from the manufacturer.The mutually beneficial aspects of this technology solution for the sponsor and wholesale distributorshould be at the forefront of the communication moving forward.
4.2.9 POINT OF SALE: REVERSE LOGISTICS VS. END-OF-LIFE DISPOSAL
Oftentimes, supply chain organizations underestimate the reverse logistics impact of new initiatives.For the sponsor company, the prioritization of IoT tag reverse logistics processes is paramount toproject success. Moreover, given the project’s impact on the sponsor company’s retail customers,mitigating pharmaceutical disruptions or headaches is key to maintaining a positive relationshipwith key business partners. When evaluating various reverse logistics solutions, the sponsor com-pany must avoid two critical pitfalls. First, the final solution must minimize the behavioral impactto all business partners involved in the distribution and sale of Product A. Driving change includesan increase in managerial resources and creates failure modes at each level: distribution, delivery,pharmacist behavior, etc. Second, the sponsor company must avoid actively tracking the Product Apackage beyond the point of sale. If a customer purchases a Product A package with an embeddedIoT tracker and leaves the retail location, the sponsor company can no longer track the package. Thisraises serious consumer privacy concerns in addition to data accuracy concerns regarding locationinventory. Additionally, the sponsor company must consider the environmental impact of the IoTtracker’s end-of-life journey, however this consideration is explored in Subsection 4.2.10.
With the above considerations in mind, the sponsor company has three strategic options regardingIoT device handling at the pharmaceutical level. The first option is to have retail pharmacists removethe IoT tracker from the Product A packaging and dispose of the device appropriately. This optionrequires behavior changes by thousands of pharmacists at retail locations across the country, both ininventory handling practices and in tracker disposal infrastructure. Furthermore, the consequencesof human error may result in serious legal ramifications (from tracking consumers with un-removedIoT trackers). Therefore, pharmacist tracker removal and disposal is not a viable option.
The second option is for pharmacists to remove the IoT device and ship it back to the sponsorcompany for product reuse. While the financial and environmental benefits of this option are signif-icant (cost of goods savings and reduced landfill contribution), this strategy also violates one of theproject’s primary concerns: to avoid a change in human behavior. Not only does this strategy requirea change in pharmacist behavior, it would require the establishment of a reverse logistics productflow that does not currently exist. The only flow of goods from pharmacies to the sponsor companyare product returns via parcel shipments. This type of infrastructure is financially and environmen-tally insufficient for hundreds of thousands of IoT devices to be shipped and handled from thousandsof retail locations to the sponsor company.
The third option is for the sponsor company, distributors, and pharmacists to do nothing. In thiscase, the IoT device (embedded in the Product A packaging) would remain in the packaging at thepoint of sale and proceed to follow the consumer as they depart the retail location. Clearly, thissolution raises serious privacy questions: would the sponsor company have visibility to consumerlocation beyond the point of sale? If so, is that legal? Will consumers continue to purchase the spon-sor company’s products if they knew what information the sponsor company had? Do consumerstrust the sponsor company with their location information? In order to mitigate the damaging con-sumer and business ramifications of these questions, the sponsor company must implement a fail-safe method to ensure it does not have consumer location information beyond the point of sale. Tounderstand how this may be accomplished from a technical perspective, the MIT team conductedan interview with a Company X engineering representative. Given the information obtained fromCompany X, the MIT team recommends that the sponsor company pursue one of two options forclearing its IoT device visibility: device geofencing or beacon filtering.
49

With the device geofencing option, the sponsor company may partner with Company X to create adatabase of all of its retail pharmacy locations. Company X’s technology team has the ability to createa geofence around each retail location and only share tag information with the sponsor company forits IoT tags that are within a predetermined range of those addresses. Under this strategy, Company Xwould have all of the tag data stored in its database, but only communicate ping data to the sponsorcompany for its IoT tags at retailers included in the sponsor company’s provided retailer database.The programming algorithms required for this solution are not simple, according to Company X, butare feasible under the right contractual arrangement between the sponsor company and Company X(Company X, personal communication, 2020).
The beacon filtering option, however, is much simpler from a technical perspective (Company X,personal communication, 2020). Under this strategy, the sponsor company must implement a ded-icated ping beacon at each retail location as suggested in Subsection 4.1.5. If the sponsor companywere to implement a dedicated ping beacon at each retail location, Company X could filter the pingdata the sponsor company receives based on the user it comes from. As outlined in Subsection 4.1.5,this field is already collected by Company X and is called the "Client ID". Similar to the device ge-ofencing option, this solution would require a contractual arrangement between the sponsor com-pany and Company X but would likely come at a reduced cost with lower algorithmic complexity(Company X, personal communication, 2020).
The MIT team urges the sponsor company to pursue one of the "third" options listed above. Ulti-mately, the sponsor company must decide whether or not to implement the dedicated retail beaconsolution. Based on its beacon infrastructure decision, the sponsor company can implement the ap-propriate end-of-life tracking solution to protect its brand integrity and consumers’ data.
4.2.10 ENVIRONMENTAL, HEALTH, AND SAFETY
It is critical for the sponsor company to account for the environmental, health, and safety risks asso-ciated with its final end-of-life strategy. In general, IoT tracking devices do not contain a significantamount of hazardous material. At the time of this writing, the only component of Company X tagsthat poses an environmental, health, or safety risk is the battery. As of 2020, the United States has a se-ries of strict regulations regarding proper battery disposal procedures. These measures are designedto protect the environment and the people who handle battery waste streams. The accepted andprohibited disposal methods for batteries are dependent on the type of battery based on the chem-icals it contains: lithium, lithium-ion, lead, etc. Currently, the Company X Long and Short modelsimplement a 3V Lithium battery (Company X, personal communication, 2020). This type of batteryis commonly referred to as a "coin", "watch" (due to its use in wrist watches), or "button cell" battery.A cross-sectional example of this battery type is depicted in Figure 4.6.
Figure 4.6: Coin Battery Cross Section (Energizer, 2017)
50

Given the low levels of lithium and lack of hazardous chemicals in these battery types, they maybe disposed of using standard landfill procedures (Energizer, 2017). Under the current Company Xproduct design, the sponsor company does not need to take any additional measures to ensure itsProduct A packaging, with embedded IoT tracker, is disposed of properly. However, the battery typeand design of the final IoT device must be considered to ensure all battery regulatory procedures arefollowed appropriately.
4.2.11 LEGAL
An underlying assumption throughout the Cambridge experiment was that the sponsor company’scollection and use of inventory location from naive Company X users was legal. This is, in fact, true.Upon download and use of the Company X application, all users must consent to the Company XTerms of Service, which states that users understand Company X’s Privacy Policy (Company X, 2019).Moreover, Company X’s Privacy Policy explicitly states its right to create and use anonymized userdata. As outlined in its Privacy Policy, the sponsor company is a third party between Company X andits customers. However, given the acceleration of technical capabilities and increasing privacy con-cerns from consumers, the sponsor company must continually review Company X’s Privacy Policy forany changes to ensure it is compliant. Additionally, as state and federal governments become moreinvolved in consumer data legislature, the sponsor company’s legal team must continually review theappropriate governmental regulations regarding its inventory data collection processes within all ofits operating states and countries.
4.2.12 INCUBATION TEAM AND OPERATIONS
The sponsor’s operation and innovation teams is where the IoT project originated. The team is oper-ationally responsible for ensuring the proposed technology solution is appropriately integrated anddelivers the results that the sponsor needs. As discussed in the previous sections, the impact to op-erations internally will have to be communicated efficiently and effectively. Another aspect to thedeployment of this solution is identifying changes, if any, to the key business and operations lead-ers’ daily tasks. Bringing them along and providing the support necessary to answer questions andwork through the new-look supply chain processes should be a key focus for the team early on in theroll-out.
Financially, individual line items need to be fully vetted and analyzed against the original planas the project moves through the development stages and into design. Factors such as direct labor,subcontracted work and support services, hardware, software, training, and consultancy support thataffect the overall project success both operationally and financially.
In terms of managing the change aspects that come with a project of this scale, the sponsor mustconsider every aspect of the proposed technology from communication to the business through thelevel of complexity of change needed and execution. The integration of IoT technology in the phar-maceutical space brings about new possibilities for interactions between systems while also devel-oping new options for the business to understand impact to service and customers through newtracking capabilities (Kostál et al., 2019). The steps for turning innovative ideas into realizable so-lutions is creating the environment for adapting, planning for adoption, integrating technology intothe workflow, spreading the understanding, and sustaining the change (Yeole & Kalbande, 2018).
Organizational change involves the ability to respond to internal and external challenges that arisefrom ideation through implementation. Creating an atmosphere of pro-active engagement and posi-tivity will create an environment of fixing, rather than identifying, issues. Understanding the balanceof controllable elements that influence change (internal) and the unidentified challenges (external)allows the business to define realistic goals and formulate recommendations for addressing issuesduring implementation (Nastase et al., 2012).
51

This Bluetooth technology implementation project seems to follow the constructs of a waterfallmodel. Figure 4.7 depicts the categories typically outlined and discussed during the development ofa change management project implementation.
Figure 4.7: Waterfall Model (Hughey, 2009)
The Cambridge Experiment was a small trial version of this methodology up through the testingphase. On a larger scale, the requirements phase has already been developed and should be con-stantly communicated and referred to as the backbone of the rationale behind the project. The spon-sor is currently in the build phase of this approach as the outline for specific design specifications forthe Bluetooth tracker have been previously identified, and tested, in the experiment. Moving intothe implementation phase will require the integration of the aforementioned layers of the sponsor’ssupply chain network. The sponsor will need to evaluate the complexity of implementation but fullyunderstand the change in operations and requirements of impacted stakeholders. Inherently, withthe addition of a new technology, there is a layer of training that has to be created and incorporatedat each level to make sure that expectations are clear and readily accessible. Another key aspect ofthe implementation phase is an appropriate scale-up plan beyond the small trial scenarios that thesponsor can control from start to finish. Using a smaller trial scenario will allow the project to trulybe verified. This is usually a phase that is skipped in real-world applications as projects are imple-mented and companies immediately move into sustaining rather than iterating and improving.
Identifying all of the entities that are interrelated and what connections they have will allow forproblems to be handled accordingly as implementation begins. An example framework can be seenin Figure 4.8.
52

Figure 4.8: IoT Implementation Framework (Zdravkovic et al., 2018)
A strategic project timeline should be at the core of the execution phase to hold the internal teamaccountable to deadlines and keep the project moving at a steady pace. This process rigor will buildmomentum within the organization, and in this scenario, with external stakeholders that are im-pacted by the proposed solution.
53

5 CONCLUSION
In Summer 2019, the sponsor approached MIT with a question: does an economical and practicalIoT inventory-tracking solution exist to mitigate consumer risk and existing corporate financial wastestreams? Over the course of eight months, this study analyzed the technology and supply chain im-plications of various inventory IoT tracking solutions. Beginning with an in-depth technology review,the team identified that Bluetooth technology would provide the sponsor with the most practical andcost-effective solution to meet its pharmaceutical retail needs. In a proof-of-concept study, the teamphysically deployed Company X tags across 19 Cambridge locations to understand the technology’sfeasibility and simulate inventory snapshots of Product A. Through a rigorous analysis of this exper-iment’s results and cross-functional supply chain analysis, the team was able to provide the sponsorwith guidance regarding IoT network design and supply chain implementation. Using this analysis asa springboard, the sponsor’s future implementation of IoT tracking technology can create differentialrevenue and waste reduction opportunities for Product A.
5.1 TECHNOLOGY INSIGHTS AND RECOMMENDATIONS
The sponsor should pursue a Bluetooth-based IoT network for its retail pharmacy inventory trackingneeds. In 2020, Bluetooth devices are the cheapest and smallest type of tracking device that does notmandate a beacon. Moreover, Bluetooth’s low barrier to entry makes the technology accessible tomore business ventures. This accessibility has created a wide range of companies, such as CompanyX, offering Bluetooth tracking devices in various form factors and applications. The array of devicetypes, network infrastructure options, and service providers makes Bluetooth the clear IoT platformchoice.
Regarding the sponsor’s particular application, the Cambridge experiment provides evidence thatBluetooth IoT tracking is feasible in the retail pharmacy environment. Without dedicated beaconassistance, individual stores averaged over 5.1 inventory snapshots per day and 75% of locationsaveraged over 1.0 pings per day. While significant work is left to be done, the experiment’s resultswere positive. Bluetooth’s established community of users and business platforms, along with thesuccessful experiment, support the conclusion that the sponsor company pursue a Bluetooth-basedinventory tracking solution.
5.2 SUPPLY CHAIN MANAGEMENT INSIGHTS AND RECOMMENDATIONS
The sponsor should begin with developing a project timeline before addressing any of the changemanagement principles that are associated with the Bluetooth technology implementation. Devel-oping a schedule with well-coordinated and detailed deadlines will allow for the compelling messageand stakeholder engagement sessions to have an underlying backbone. Key stakeholders and busi-ness leaders need to be integrated as the complexity of the change is evaluated and appropriate mea-sures are defined for defining project success and implementation. Customers and external partnersneed to be brought in at the appropriate time to ensure the requirements for success are met.
In relation to the sponsor’s specific operations and impact, the impacts outlined in the Chapter4 provide a guideline to integrating the proposed Bluetooth technology supported by the experi-ment and research conducted in Chapter 2. While section 4.2.12 provides insights from other IoTimplementation projects found in literature and through past experiences, the specific applicationto the sponsor’s internal business structure will require some manipulation and specific considera-tions outside of what is suggested.
54

5.3 FUTURE RESEARCH
While this study revealed meaningful insights into the possibilities of Bluetooth inventory trackingfor the sponsor, a significant number of questions must be answered before a financial investment ismade into this project.
From a technology perspective, the sponsor must identify the right business partner to provide aBluetooth network and device, or solely a network to support a third party device of its choosing.Additionally, the sponsor must identify a Bluetooth IoT tag that is low-cost, wide read range, andminimally disrupts Product A’s secondary packaging. This device may be either an off-the-shelf item(such as the Company X trackers used in the experiment) or a custom tag created by an engineeringvendor for the sponsor’s unique application. After identifying its tag and network infrastructure,the sponsor must decide if or how to leverage a beacon strategy at retail locations. As evidencedin Section 4.1.5, partnering with retailers to invest in a dedicated beacon solution may significantlyincrease the level of inventory visibility in rural and suburban environments.
Regarding the sponsor’s supply chain considerations, a thorough change management analysismust be performed to capture the project’s impact on each level of the organization. The sponsormust either leverage an existing internal protocol for supply chain change management initiativesor identify a framework that has been successfully implemented for similar projects across otherindustries. Most importantly, this framework must include the impact to the customer and con-sumer. While retailers and consumers are not directly part of the sponsor’s supply chain, they are thelifeblood of its business model. Failure to include these stakeholders would prove catastrophic.
Lastly, the sponsor must consider future applications of this technology before any initial invest-ments are made. While Product A that was used for this experiment may be today’s promising prod-uct, consumer preferences and global health needs may shift future demand. Building flexibility intoits tracking device, network infrastructure, and supply chain system will allow the sponsor to main-tain agility with its final inventory tracking solution. This flexibility will allow the sponsor to sustain,and even increase, its supply chain competitive advantage.
55

REFERENCES
Aigbogun, O., Ghazali, Z., & Razali, R. (2015). Resilience Attributes of Halal Logistics on the Pharma-ceutical Supply Chain. Global Business & Management Research, 7(3): 34-43.
Beier, F. J. (1995). The Management of the Supply Chain for Hospital Pharmacies: A Focus on Inven-tory Management Practices. Journal of Business Logistics, 16(2): 153-173.https://www.scirp.org/(S(i43dyn45teexjx455qlt3d2q))/reference/ReferencesPapers.aspx?ReferenceID=679356
CVS. (2019). By the Numbers: How Do Consumers Interact With Pharmacists? | CVS Health.https://cvshealth.com/thought-leadership/by-the-numbers-how-do-consumers-interact-with-pharmacists
de Campos, E. A. R., de Paule, I. C., Pagani, R. N., & Guarnieri, P. (2017). Reverse logistics for the end-of-life and end-of-use products in the pharmaceutical industry: a systematic literature review.Supply Chain Management, 22(4): 375-392. https://doi.org/10.1108/SCM-01-2017-0040
de Vries, J. (2009). The shaping of inventory systmes in health services: A stakeholder analysis. Inter-national Journal of Production Economics, 133(1): 60-69. https://doi.org/10.1016/j.ijpe.2009.10.029
Energizer. (2017). Lithium Primary/Metal Battery Transportation. https://data.energizer.com/PDFs/lishipmentpolicy.pdf
Harte, L. (2004). Introduction to Bluetooth: Technology, Market, Operations, Profiles, & Services. AL-THOS Publishing Inc., c2004.
Hayhurst, C. (2017). How to Develop an RFP. PT in Motion, 9(7): 24-29. https://www.apta.org/PTinMotion/2017/8/Feature/DevelopAnRFP/
Holdowsky, J., Mahto, M., Raynor, M., & Cotteleer, M. (2015). Inside the Internet of Things (IoT): Aprimer on the technologies building the IoT. Deloitte Insights. https://www2.deloitte.com/us/en/insights/focus/internet-of-things/iot-primer-iot-technologies-applications.html
Huawei. (2016). NarrowBand IoT Wide Range of Opportunities. MWC 2016, Barcelona. https://www-file.huawei.com/-/media/corporate/minisite/mwc2016/pdf/narrowband-iot-wide-range-of-opportunities-en.pdf?la=en
Hughey, D. (2009). The Traditional Waterfall Approach. http://umsl.edu/∼hugheyd/is6840/waterfall.html
Hunt III, L., Murimi, I. B., Segal, J. B., Seamans, M. J., Scharfstein, D. O., & Varadhan, R. (2019). Brandvs. Generic: Addressing Non-Adherence, Secular Trends, and Non-Overlap. ArXiv: 1907.05385[Stat]. http://arxiv.org/abs/1907.05385
Hunt, V. D., Puglia, M., & Puglia, A. (2007). RFID: A Guide to Radio Frequency Identification. J. Wiley,c2007.
Iacocca, K. M., & Mahar, S. (2019). Cooperative partnerships and pricing in the pharmaceutical sup-ply chain. International Journal of Production Research, 57(6): 1724-1740. https://doi.org/10.1080/00207543.2018.1504249
IATA. (2020). 2020 Lithium Battery Guidance Document. https://www.iata.org/en/programs/cargo/dgr/lithium-batteries/
Ishihara, Y., Huang, R., & Ma, J. (2006). A Real Trading Model based Price Negotiation Agents. 20thInternational Conference on Advanced Information Networking and Applications (AINA), Vienna,2006, 1: 597-604. https://doi.org/10.1109/AINA.2006.52
56

Khezr, S., Moniruzzaman, M., Yassine, A., & Benlamri, R. (2019). Blockchain Technology in Health-care: A Comprehensive Review and Directions for Future Researach. Applied Sciences, 9(9): 1736.https://doi.org/10.3390/app9091736
Kostál, K., Helebrandt, P., Bellus, M., Ries, M., & Kotuliak, I. (2019). Management and Monitoring ofIoT Devices Using Blockchain. Sensors, 19(4). https://doi.org/10.3390/s19040856
Krishnamurthy, P., & Prasad, A. (2012). Inventory strategies for patented and generic products for apharmaceutical supply chain [Thesis, Masschusettts Institute of Technology].https://dspace.mit.edu/handle/1721.1/77540
Lapierre, S. D., & Ruiz, A. B. (2007). Scheduling logistics activities to improve hospital supply systems.Computers & Operations Research, 34(3); 624-641. https://doi.org/10.1016/j.cor.2005.03.017
Lewis, S. (2004). A Basic Introduction To RFID Technology And Its Use In The Supply Chain [Whitepaper]. Laran RFID. http://hosteddocs.ittoolbox.com/laran032604.pdf
Liu, Y., Tong, K., Qiu, X., Liu, Y., & Ding, X. (2017). Wireless Mesh Networks in IoT networks. 2017International Workshop on Electromagnetics: Applications and Student Innovation Competition,183-185. https://doi.org/10.1109/iWEM.2017.7968828
Mikulic, M. (2020). Brand vs generic prescription revenue share U.S. 2005-2018. Statista.https://www.statista.com/statistics/205036/proportion-of-brand-to-generic-prescription-sales/
Morris, P. (2019). Responding to disruptions in the pharmaceutical supply chain. the PharmaceuticalJournal, 11(2). https://www.pharmaceutical-journal.com/research/research-article/responding-to-disruptions-in-the-pharmaceutical-supply-chain/20206058.article
Nastase, M., Giuclea, M., & Bold, O. (2012). The Impact of Change Management in Organizaitons–ASurvey of Methods and Techniques for a Successful Change. Review of International ComparativeManagement, 13(1): 5-16.https://pdfs.semanticscholar.org/67fe/c9841b7cceaf6ebd43ba7456c8a87e5ab9da.pdf
Papanagnou, C. I., & Matthews-Amune, O. (2018). Coping with demand volatility in retail pharmacieswith the aid of big data exploration. Computers & Operations Research, 98: 343-354.https://doi.org/10.1016/j.cor.2017.08.009
Rasmusson, D. (2006). SIPOC Picture Book: A Visual Guide to SIPOC/DMAIC Relationship. Oriel In-corporated.
Rivard-Royer, H., Landry, S., & Beaulieu, M. (2002). Hybrid stockless: a case study: Lessongs forhealth-care supply chain integration. International Journal of Operations & Production Manage-ment, 22(4): 412-424. https://www.emerald.com/insight/content/doi/10.1108/01443570210420412/full/html
Schneller, E., & Smeltzer, L. (2006). Strategic Management of the Health Care Supply Chain. Journal ofPurchasing and Supply Management, 12(5): 296-297. https://www.sciencedirect.com/science/article/abs/pii/S1478409206000859?via%3Dihub
Shah, N. (2004). Pharmaceutical supply chains: Key issues and strategies for optimisation. Comput-ers & Chemical Engineering, 28(6): 929-941. https://doi.org/10.1016/j.compchemeng.2003.09.022
Shanley, A. (2017). Serialization Hits the Home Stretch. BioPharm International, 30(3): 36-39.http://www.biopharminternational.com/serialization-hits-home-stretch
Sigfox. (2020). Coverage | Sigfox. https://www.sigfox.com/en/coverage
Silicon Labs. (2019). The Many Flavors of Bluetooth IoT Connectivity [White paper]. https://www.silabs.com/documents/referenced/white-papers/the-many-flavors-of-bluetooth-iot-connectivity.pdf
57

Silver, E. A., Pyke, D. F., & Thomas, D. J. (2017). Inventory and production management in supplychains. Boca Raton: CRC Press, Taylor & Francis Group, c2017.
Singh, M. P. (2005) The Pharmaceutical Supply Chain: A Diagnosis of the State-of-the-Art [Thesis,Massachusetts Institute of Technology]. https://dspace.mit.edu/handle/1721.1/33354
SIPOC Diagrams. (2020). SIPOC Templates – SIPOC Diagrams. https://sipoc.info/templates/
Statista. (2019). U.S. pharmaceutical industry. Statista. https://www.statista.com/study/10708/us-pharmaceutical-industry-statista-dossier/
ULINE. (2020). Pallets, Plastic Pallets, Shipping Pallets in Stock-Uline. ULINE.https://www.uline.com/GRP_147/Pallets
Watanabe, J. H. (2019). Examining the Pharmacist Labor Supply in the United States: Increasing Med-ication Use, Aging Society, and Evolution of Pharmacy Practice. Journal of Pharmacy Educationand Practice, 7(3). https://doi.org/10.3390/pharmacy7030137
Yeole, A., & Kalbande, D. R. (2018). Change Management Approach for Integrating IoT Technologyin Healthcare System. 2018 International Conference on Smart City and Emerging Technology(ICSCET), Mumbai, 2018, 1-4. https://doi.org/10.1109/ICSCET.2018.8537335
Z Table. (2020). Z Score Table-Z Table and Z score calculation. http://www.z-table.com/
Zdravkovic, M., Zdravkovic, J., Aubry, A., Moalla, N., Guedria, W., & Sarraipa, J. (2018). Domain frame-works for implementation of open IoT ecosystems. International Journal of Production Research,56(7): 25-52. https://doi.org/10.1080/00207543.2017.1385870
58