ionospheric research issues for sbas – a white...
TRANSCRIPT

Ionospheric Research Issues for SBAS – A White Paper
SBAS Ionospheric Working Group February 2003
OUTLINE Executive Summary 1. Introduction 2. Ionospheric Regions
2.1. Mid-latitude Regions 2.2. Equatorial Region – TEC Effects 2.3. Equatorial Region – Scintillation Effects
3. Auroral and Polar Cap Region – TEC and Scintillation Effects 4. Summary of Ionospheric Effects by Region and Phenomena 5. Mitigation Techniques Against Ionospheric Effects 6. Other SBAS Concerns – Geography 7. Conclusions 8. Recommendations and Suggestions for Future Work 9. References Appendix A, Signal-In-Space Performance Requirements for SBAS Appendix B, Scintillation Effects in the Equatorial Region
2
EXECUTIVE SUMMARY
• SBAS precision approach services require ionospheric range delay corrections. Other services do not, although receivers may use ionospheric corrections when they are available. The uncertainties on these corrections are the primary limiting factor for precision approach availability of currently planned systems.
• The ionosphere over mid-latitude regions (e.g., CONUS and most of Europe) normally
has small spatial gradients, with resulting high range delay correction capability. Infrequent instances of large, non-planar ionospheric spatial gradients may be observed during major geomagnetic storms that occur less than 0.5% of the time, with smaller non-planar gradients occurring during moderate geomagnetic storms that can occur up to approximately 7% of the time. Only the large storms have been shown to require significantly increased GIVEs in the CONUS region. The occurrence of geomagnetic storms tends to peak during the declining phase of the 11 year solar cycle. The ionosphere in the mid-latitudes permits a high availability of precision approach services such as Level –I of the approaches with vertical guidance (APV-I). . Further investigation is necessary to allow increased availability for better levels of service (lower decision heights), such as APV-II.
• The near-equatorial ionosphere is characterized by the world’s highest ionospheric range
delays, and with large temporal and spatial gradients in the daytime and early evening hours. These large, non-planar gradients exist during normal geomagnetically quiet conditions, and are a regular feature of the near-equatorial ionosphere. Additionally, there are large, rapid drops in range delay, associated with deep amplitude scintillation fading, during the post-sunset hours for a few years near the maximum of the 11-year solar cycle. The existing SBAS 5° x 5° ionospheric correction grid likely will NOT be able to adequately correct for these very high absolute range delays under conditions of large non-planar spatial and temporal gradients. The reference station density necessary to adequately observe these effects may be prohibitive, independent of grid limitations.
• A full constellation of dual frequency civilian GNSS satellites addresses all ionospheric
range delay issues, except for those times when the user loses access to one or more frequencies. This could happen during severe scintillation periods or in a RF interference environment. During these times, the user must revert to the SBAS ionospheric corrections.
• Amplitude fading due to scintillation can cause intermittent loss of SBAS geostationary
satellite augmentation signals, as well as loss of GNSS signals. The loss of both frequencies may lead to the inability to form a trusted position fix. The loss of one frequency requires reliance on the SBAS ionospheric corrections broadcast on the other frequency. Scintillation effects are somewhat different in the near-equatorial and auroral regions of the world, but, in both those regions, the phenomenon can significantly affect SBAS availability.
3
• The SBAS ionospheric research group recommends that: • Each regional SBAS provider place their geostationary satellites with a minimum
longitudinal separation of at least 45°, if possible, • Broadcast the ionospheric corrections for single-frequency users on all available
civil frequencies, such as on both L1, and L5, • Develop better methods for correcting for ionospheric range delay, • Better characterize the effects of scintillation on GNSS signals, • Work with receiver developers to minimize impact of scintillation effects. • Countries in the equatorial region can develop their SBAS systems for use in
enroute to nonprecision approaches and wait until dual frequency capability is available on GNSS satellites to then use SBAS for precision approaches. However, research on solving the major TEC and scintillation problems in the equatorial regions is encouraged by all ionospheric research groups.
• Assist in writing minimum scintillation requirements, including test procedures for the airborne SBAS receivers in the ICAO SARP and RTCA MOPS
• The SBAS ionosphere working group also recommends that an early implementation step
for new SBAS services should be to field a set of reference station prototypes that can gather TEC data continuously in the coverage region of interest. This enables early assessment of system performance in the region, as well as providing valuable data useful in tuning the system implementation. If possible, multiple receivers (three is nominal) should be collocated at a site to collect redundant ionospheric information that can be used to remove spurious measurements that can affect the assessments. In particular, data from the coverage region of interest has proved to be invaluable for demonstrating the integrity of the system.
1. Introduction The uncorrected propagation delays to GNSS satellite L-band signals caused by the ionosphere may significantly limit the performance of a Satellite Based Augmentation System (SBAS) for precision approach (PA), especially in the equatorial and auroral regions. These potential limitations are discussed in this white paper, along with suggestions for additional measurements and analyses required to address these issues. Propagation delays are caused by the presence of free electrons (ionization) in the upper atmosphere along the propagation path of the wave. The total electron content (TEC) of the ionosphere along a path is directly proportional to the ionospheric range delay, and much research has been conducted on the worldwide behavior of TEC. SBAS performance can be affected by the ionosphere through (1) rapid changes in TEC that cause estimates of range delays to be less accurate, (2) spatial gradients in TEC that cannot be resolved by the 5° by 5° ionospheric grid, (3) amplitude scintillation fading, that, in the worst case, can result in the continual intermittent loss of the signal, and (4) phase scintillation effects that can cause signal outages on semi-codeless receivers operating on the GPS L2 frequency. All of these ionospheric effects are related to geography, season, and time-of-day, as well as
4
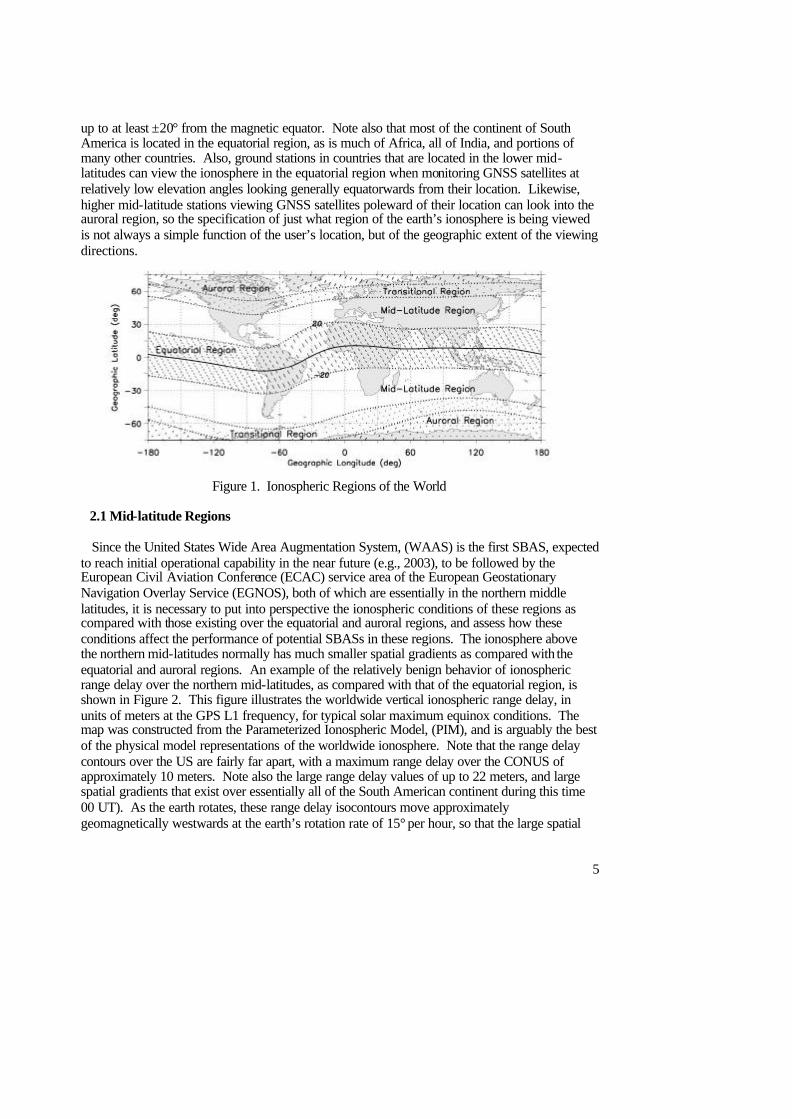
solar activity level and geomagnetic activity. Dual-frequency receivers can measure ionospheric delays directly, but until GNSS satellites broadcast on two civil frequencies and dual-frequency receivers become commonplace, estimates of such delays must be made on the ground and broadcast to the users through geostationary satellites. (Dual-frequency receivers may not help in overcoming scintillation fading effects as the fading may be highly correlated over the L1 to L5 bandwidth.) Because many SBAS technical details were developed on the basis of observations made in a mid-latitude region that normally has relatively low spatial and temporal gradients, at least under geomagnetic ally quiet conditions, a thin-shell model of the ionosphere was thought to be adequate for SBAS purposes. According to this model, propagation delays are determined when an electromagnetic wave crosses a spherical shell 350 km above the surface of the earth at a point called an Ionospheric Pierce Point (IPP). Ground stations measure the actual slant delays along their lines of sight to the satellites (using L1-C/A code and L2 semi-codeless receivers) and convert them to vertical delays at the corresponding IPPs using a standard obliquity factor formula. These vertical delays are then interpolated to form vertical delays on a 5 by 5-degree grid, which are broadcast to users. Users then reverse the process and interpolate these vertical grid delays to the coordinates of their IPPs and reconvert the interpolated vertical delays to slant delays. Future SBAS designs are free to experiment with new ways to calculate more accurate vertical grid delays, but the calculations from grid to user using a specified method of interpolation and obliquity conversion have been standardized in order to design a system that can be used world-wide. This fundamental constraint means that, no matter how well an SBAS ground system can estimate grid vertical delays, there will always be limits on the accuracy achievable by single-frequency users resulting from the required user interpolation and obliquity processes standardized in the International Standards And Recommended Practices (SARPs) of the International Civil Aviation Organization (ICAO). 2. Ionospheric Regions The world can be divided basically into three regions insofar as the ionosphere is concerned. They are: 1) the mid-latitudes, 2) the equatorial and equatorial “anomaly” regions, and 3) the auroral and polar caps. Each of these major ionospheric regions can be further broken down into sub-regions, but, for the purposes of this paper, this distinction is adequate. Figure 1 illustrates the approximate geographic extent of each of these regions. During geomagnetically quiet periods the transitional regions are part of the mid-latitude regions, but during geomagnetically disturbed periods the auroral regions expand and move equatorwards, thus expanding the size of the auroral regions, and shrinking the size of the mid-latitude regions. Thus these regions are called transitional regions. Note also, that many map projections tend to overemphasize the extent of the high latitudes. The polar region is generally thought of as being at geomagnetic latitudes greater than ≈ 75° and is not illustrated in Figure 1 due to the nature of the Mercator map projection. The largest region is the equatorial and so-called equatorial anomaly region, the effects of which can be measured
5
up to at least ±20° from the magnetic equator. Note also that most of the continent of South America is located in the equatorial region, as is much of Africa, all of India, and portions of many other countries. Also, ground stations in countries that are located in the lower mid-latitudes can view the ionosphere in the equatorial region when monitoring GNSS satellites at relatively low elevation angles looking generally equatorwards from their location. Likewise, higher mid-latitude stations viewing GNSS satellites poleward of their location can look into the auroral region, so the specification of just what region of the earth’s ionosphere is being viewed is not always a simple function of the user’s location, but of the geographic extent of the viewing directions.
Figure 1. Ionospheric Regions of the World
2.1 Mid-latitude Regions
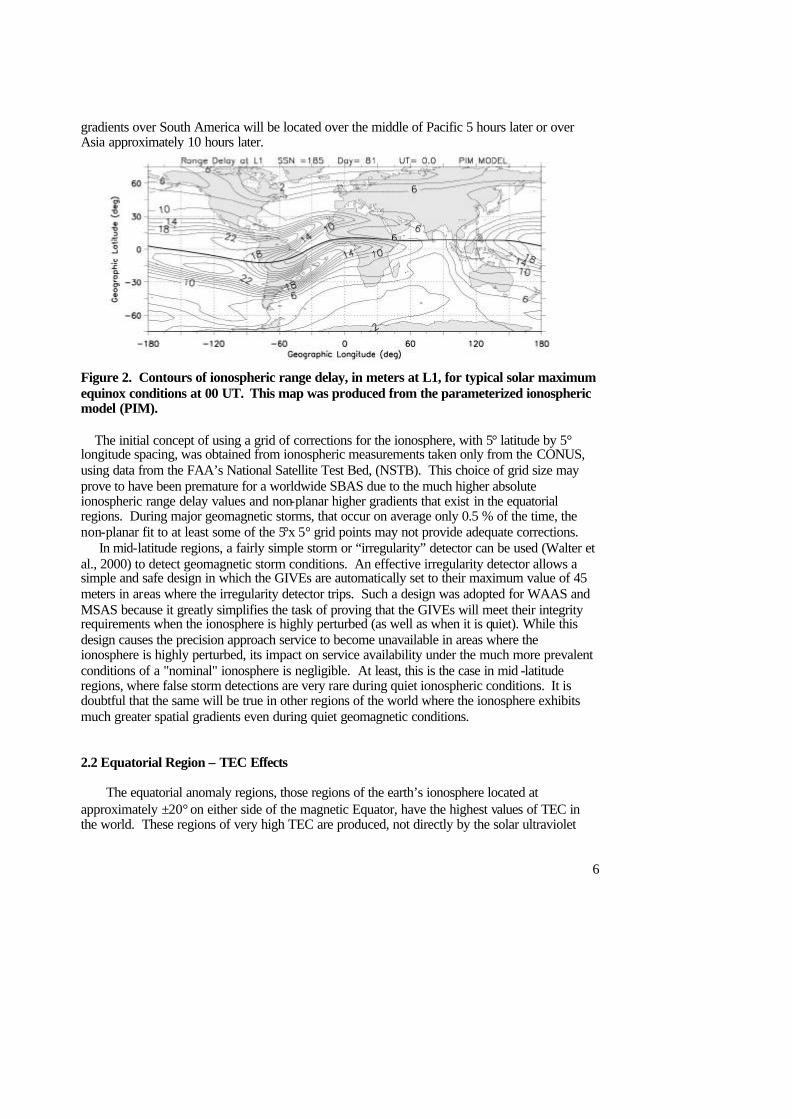
Since the United States Wide Area Augmentation System, (WAAS) is the first SBAS, expected to reach initial operational capability in the near future (e.g., 2003), to be followed by the European Civil Aviation Conference (ECAC) service area of the European Geostationary Navigation Overlay Service (EGNOS), both of which are essentially in the northern middle latitudes, it is necessary to put into perspective the ionospheric conditions of these regions as compared with those existing over the equatorial and auroral regions, and assess how these conditions affect the performance of potential SBASs in these regions. The ionosphere above the northern mid-latitudes normally has much smaller spatial gradients as compared with the equatorial and auroral regions. An example of the relatively benign behavior of ionospheric range delay over the northern mid-latitudes, as compared with that of the equatorial region, is shown in Figure 2. This figure illustrates the worldwide vertical ionospheric range delay, in units of meters at the GPS L1 frequency, for typical solar maximum equinox conditions. The map was constructed from the Parameterized Ionospheric Model, (PIM), and is arguably the best of the physical model representations of the worldwide ionosphere. Note that the range delay contours over the US are fairly far apart, with a maximum range delay over the CONUS of approximately 10 meters. Note also the large range delay values of up to 22 meters, and large spatial gradients that exist over essentially all of the South American continent during this time 00 UT). As the earth rotates, these range delay isocontours move approximately geomagnetically westwards at the earth’s rotation rate of 15° per hour, so that the large spatial
6
gradients over South America will be located over the middle of Pacific 5 hours later or over Asia approximately 10 hours later.
Figure 2. Contours of ionospheric range delay, in meters at L1, for typical solar maximum equinox conditions at 00 UT. This map was produced from the parameterized ionospheric model (PIM). The initial concept of using a grid of corrections for the ionosphere, with 5° latitude by 5° longitude spacing, was obtained from ionospheric measurements taken only from the CONUS, using data from the FAA’s National Satellite Test Bed, (NSTB). This choice of grid size may prove to have been premature for a worldwide SBAS due to the much higher absolute ionospheric range delay values and non-planar higher gradients that exist in the equatorial regions. During major geomagnetic storms, that occur on average only 0.5 % of the time, the non-planar fit to at least some of the 5°x 5° grid points may not provide adequate corrections. In mid-latitude regions, a fairly simple storm or “irregularity” detector can be used (Walter et al., 2000) to detect geomagnetic storm conditions. An effective irregularity detector allows a simple and safe design in which the GIVEs are automatically set to their maximum value of 45 meters in areas where the irregularity detector trips. Such a design was adopted for WAAS and MSAS because it greatly simplifies the task of proving that the GIVEs will meet their integrity requirements when the ionosphere is highly perturbed (as well as when it is quiet). While this design causes the precision approach service to become unavailable in areas where the ionosphere is highly perturbed, its impact on service availability under the much more prevalent conditions of a "nominal" ionosphere is negligible. At least, this is the case in mid -latitude regions, where false storm detections are very rare during quiet ionospheric conditions. It is doubtful that the same will be true in other regions of the world where the ionosphere exhibits much greater spatial gradients even during quiet geomagnetic conditions. 2.2 Equatorial Region – TEC Effects The equatorial anomaly regions, those regions of the earth’s ionosphere located at approximately ±20° on either side of the magnetic Equator, have the highest values of TEC in the world. These regions of very high TEC are produced, not directly by the solar ultraviolet
7
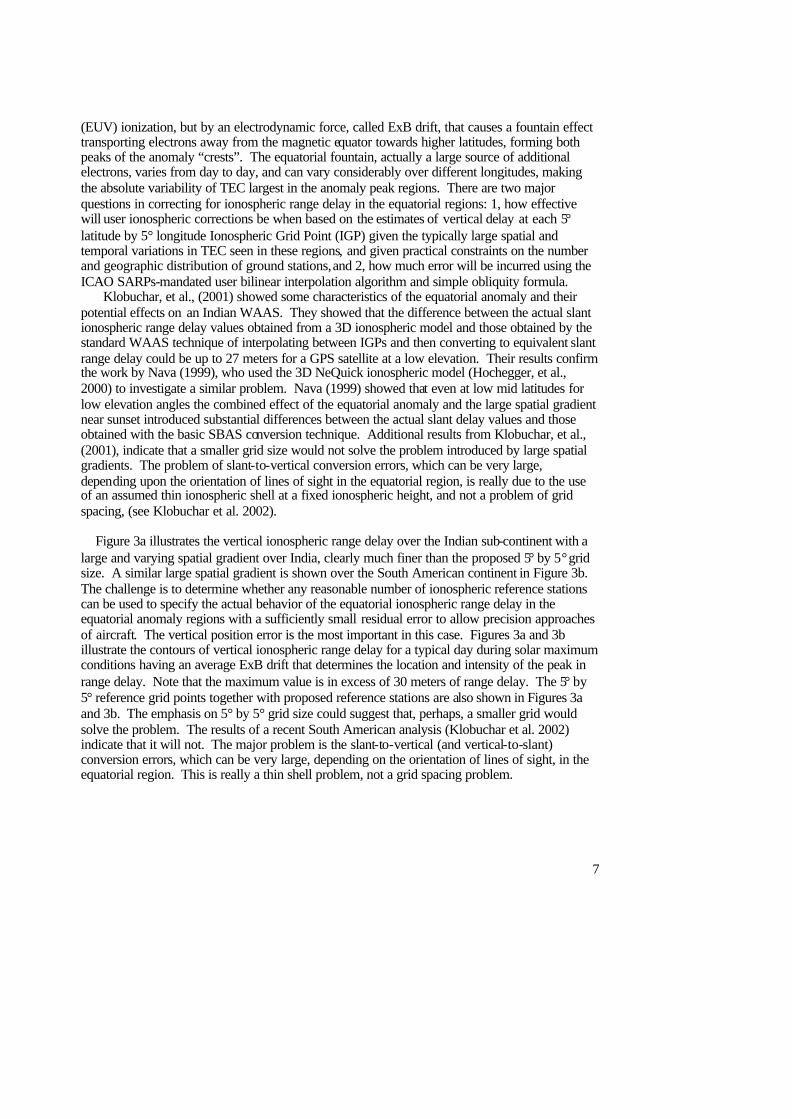
(EUV) ionization, but by an electrodynamic force, called ExB drift, that causes a fountain effect transporting electrons away from the magnetic equator towards higher latitudes, forming both peaks of the anomaly “crests”. The equatorial fountain, actually a large source of additional electrons, varies from day to day, and can vary considerably over different longitudes, making the absolute variability of TEC largest in the anomaly peak regions. There are two major questions in correcting for ionospheric range delay in the equatorial regions: 1, how effective will user ionospheric corrections be when based on the estimates of vertical delay at each 5° latitude by 5° longitude Ionospheric Grid Point (IGP) given the typically large spatial and temporal variations in TEC seen in these regions, and given practical constraints on the number and geographic distribution of ground stations, and 2, how much error will be incurred using the ICAO SARPs-mandated user bilinear interpolation algorithm and simple obliquity formula. Klobuchar, et al., (2001) showed some characteristics of the equatorial anomaly and their potential effects on an Indian WAAS. They showed that the difference between the actual slant ionospheric range delay values obtained from a 3D ionospheric model and those obtained by the standard WAAS technique of interpolating between IGPs and then converting to equivalent slant range delay could be up to 27 meters for a GPS satellite at a low elevation. Their results confirm the work by Nava (1999), who used the 3D NeQuick ionospheric model (Hochegger, et al., 2000) to investigate a similar problem. Nava (1999) showed that even at low mid latitudes for low elevation angles the combined effect of the equatorial anomaly and the large spatial gradient near sunset introduced substantial differences between the actual slant delay values and those obtained with the basic SBAS conversion technique. Additional results from Klobuchar, et al., (2001), indicate that a smaller grid size would not solve the problem introduced by large spatial gradients. The problem of slant-to-vertical conversion errors, which can be very large, depending upon the orientation of lines of sight in the equatorial region, is really due to the use of an assumed thin ionospheric shell at a fixed ionospheric height, and not a problem of grid spacing, (see Klobuchar et al. 2002). Figure 3a illustrates the vertical ionospheric range delay over the Indian sub-continent with a large and varying spatial gradient over India, clearly much finer than the proposed 5° by 5° grid size. A similar large spatial gradient is shown over the South American continent in Figure 3b. The challenge is to determine whether any reasonable number of ionospheric reference stations can be used to specify the actual behavior of the equatorial ionospheric range delay in the equatorial anomaly regions with a sufficiently small residual error to allow precision approaches of aircraft. The vertical position error is the most important in this case. Figures 3a and 3b illustrate the contours of vertical ionospheric range delay for a typical day during solar maximum conditions having an average ExB drift that determines the location and intensity of the peak in range delay. Note that the maximum value is in excess of 30 meters of range delay. The 5° by 5° reference grid points together with proposed reference stations are also shown in Figures 3a and 3b. The emphasis on 5° by 5° grid size could suggest that, perhaps, a smaller grid would solve the problem. The results of a recent South American analysis (Klobuchar et al. 2002) indicate that it will not. The major problem is the slant-to-vertical (and vertical-to-slant) conversion errors, which can be very large, depending on the orientation of lines of sight, in the equatorial region. This is really a thin shell problem, not a grid spacing problem.
8
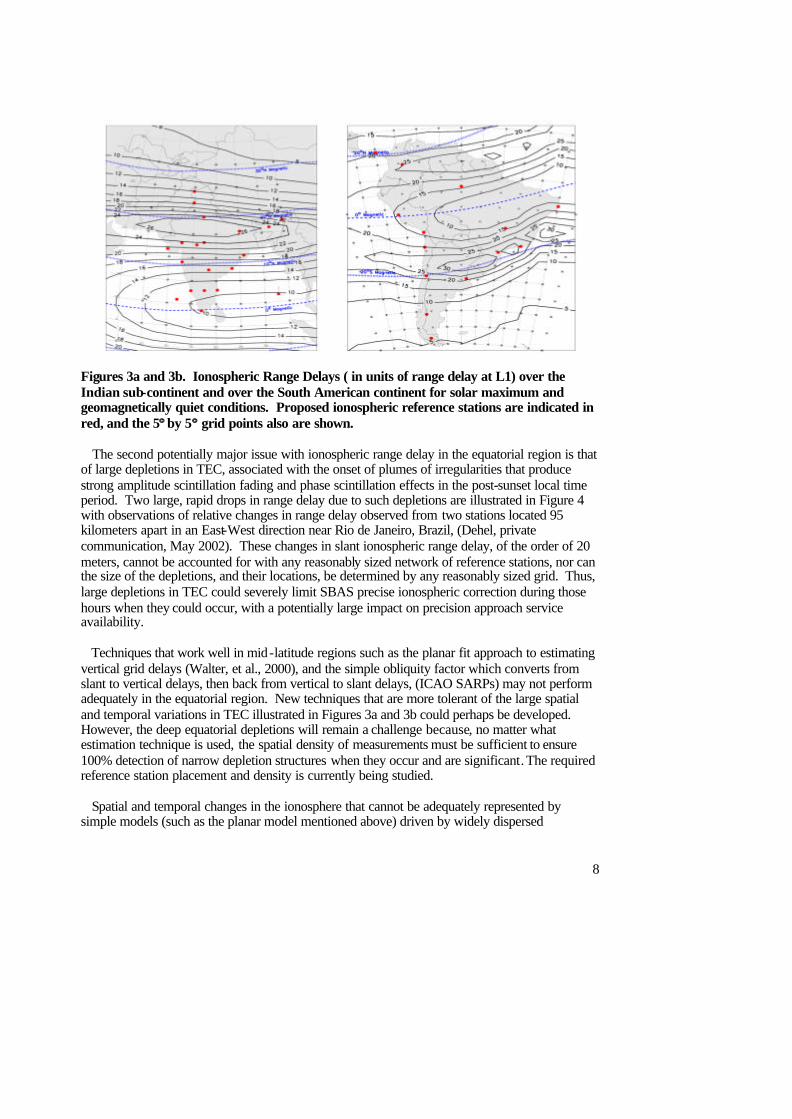
Figures 3a and 3b. Ionospheric Range Delays ( in units of range delay at L1) over the Indian sub-continent and over the South American continent for solar maximum and geomagnetically quiet conditions. Proposed ionospheric reference stations are indicated in red, and the 5°° by 5°° grid points also are shown. The second potentially major issue with ionospheric range delay in the equatorial region is that of large depletions in TEC, associated with the onset of plumes of irregularities that produce strong amplitude scintillation fading and phase scintillation effects in the post-sunset local time period. Two large, rapid drops in range delay due to such depletions are illustrated in Figure 4 with observations of relative changes in range delay observed from two stations located 95 kilometers apart in an East-West direction near Rio de Janeiro, Brazil, (Dehel, private communication, May 2002). These changes in slant ionospheric range delay, of the order of 20 meters, cannot be accounted for with any reasonably sized network of reference stations, nor can the size of the depletions, and their locations, be determined by any reasonably sized grid. Thus, large depletions in TEC could severely limit SBAS precise ionospheric correction during those hours when they could occur, with a potentially large impact on precision approach service availability. Techniques that work well in mid-latitude regions such as the planar fit approach to estimating vertical grid delays (Walter, et al., 2000), and the simple obliquity factor which converts from slant to vertical delays, then back from vertical to slant delays, (ICAO SARPs) may not perform adequately in the equatorial region. New techniques that are more tolerant of the large spatial and temporal variations in TEC illustrated in Figures 3a and 3b could perhaps be developed. However, the deep equatorial depletions will remain a challenge because, no matter what estimation technique is used, the spatial density of measurements must be sufficient to ensure 100% detection of narrow depletion structures when they occur and are significant. The required reference station placement and density is currently being studied. Spatial and temporal changes in the ionosphere that cannot be adequately represented by simple models (such as the planar model mentioned above) driven by widely dispersed
9
measurements, and the possible presence of narrow ionospheric structures that may develop between those measurements, will unavoidably limit the accuracy of the ionospheric delay corrections broadcast to the users. An SBAS faced with these problems will have to generate and broadcast large ionospheric error bounds, or Grid Ionospheric Vertical Errors (GIVEs), which, at various times and places, will be large enough to be incompatible with the requirements of a precision approach service. The integrity requirements imposed on SBAS are very stringent. Designing ionospheric algorithms that can be shown to meet these integrity requirements is a difficult task. Such a task requires a detailed analysis of the various integrity threats, including those that cannot be addressed by the real-time estimation algorithm, and sufficient padding has to be built into the GIVE formulation to ensure that the broadcast GIVE will protect all users against the effects of all ionospheric threats with the required level of confidence.
Figure 4. Slant ionospheric range delay on a night in October 2001, from two stations located near Rio de Janeiro, Brazil, separated by approximately 95 Km in the East-West direction. Note the nearly identical depletions observed in ionospheric range delay occurring later along the eastward path, clearly indicating the eastward direction of motion of the depletions. (Dehel, SBAS Iono Meeting No. 5, McLean, VA, May 10-11, 2002.)
2.3 Equatorial Region – Scintillation Effects Amplitude scintillation fading on the GNSS satellite signals, and on the SBAS correction message, can be a serious concern for aircraft receivers, but likely not for SBAS reference stations, (SRS). This is because the aircraft may lose the ability to perform a particular operation (e.g., a precision approach) if it loses the signals of a few satellites that are critical to maintaining the protection levels below the appropriate alert limits. In contrast, the SRSs must only receive a sufficient number of measurements to meet the requirements of the grid delay estimation
10
function. SRS data can tolerate interruptions in some of the signals and still perform its function. During a recent observation campaign in Rio de Janeiro, Brazil, the number of satellites available for an L1-only solution of an airborne experimental WAAS receiver dropped down to only two satellites for a few seconds and the number of satellites available for a full L1-L2 solution actually went to zero, due to L2 signal loss from rapid phase scintillation (Dehel, private communication, 2001). Significant receiver loss of lock events have also been observed using a modified JPL TurboRogue dual-frequency receiver at an equatorial anomaly site at Santiago (Pi, et al., 2002). However, an FAA certified GPS receiver never had less than 6 satellites in track during the same period, indicating that receiver design is a very important factor in susceptibility to amplitude scintillation fading effects. The remaining questions for equatorial scintillation include answering how much of the visible sky is covered with irregularities in the ionosphere so that a minimum number of GNSS satellites will be received at each SRS. Also, measurements should be made to determine the statistics of simultaneous fading on more than one GNSS satellite at one time affecting airborne receivers, and to characterize the resultant apparent changes in position with a continually changing “mix” of satellites available for the position solution. These points have been raised by Forte, et al., (2001) from their analysis of experimental data, and by Conker, et al., using model calculations. An even more important question concerning scintillation is with the loss of data from the geostationary satellites that provide real-time corrections and integrity information to the aircraft receiver. SBAS corrections are packed in SBAS messages. Each SBAS message1 is only one second long, but the system specifications require a very low loss rate (Message Error Rate of 10-3) for this short correction message, likely impossible to achieve during periods of deep, slow amplitude scintillation fading. The redundancy of having two geostationary satellites with sufficient longitudinal separation (≥ 46.3 degrees according to DasGupta, private communication, 2002) can greatly improve signal availability and continuity of service, but the exact improvement is still being addressed. 3. Auroral and Polar Cap Regions – TEC and Scintillation Effects The Polar Cap region can at times exhibit ionospheric delays considerably in excess of what would be seen in the mid-latitude regions, (e. g., Klobuchar, et al., 1985). However, since the polar cap regions are not large areas, and there is little need for a civilian SBAS precision approach in the polar cap regions, they will not be discussed further. In the auroral regions, Skone and Cannon, (1998), have shown that during periods of major geomagnetic storm activity the spatial gradients in equivalent vertical ionospheric range delay are much larger than can be expected to be corrected by using an ionospheric grid size of 5° by 5°. They also showed a maximum ionospheric range delay change of almost one meter over a 30 second sampling interval, indicating that the usual SBAS update period should be smaller during those periods They suggest that the ionospheric grid size be reduced from the current 5° by 5° to 3° by 3°, or less, but they also stated that: “It must be emphasized, however, that intense storms do not occur all the time, even during solar maximum, and such periods of significantly degraded accuracy will be rare.” A summary of the probability distribution function of scintillation fading, and of 1 Each message contains 250 bits and is convolutionally encoded to 500 symbols. The transmission data rate is 250 bits per second (or 500 symbols per second).
11
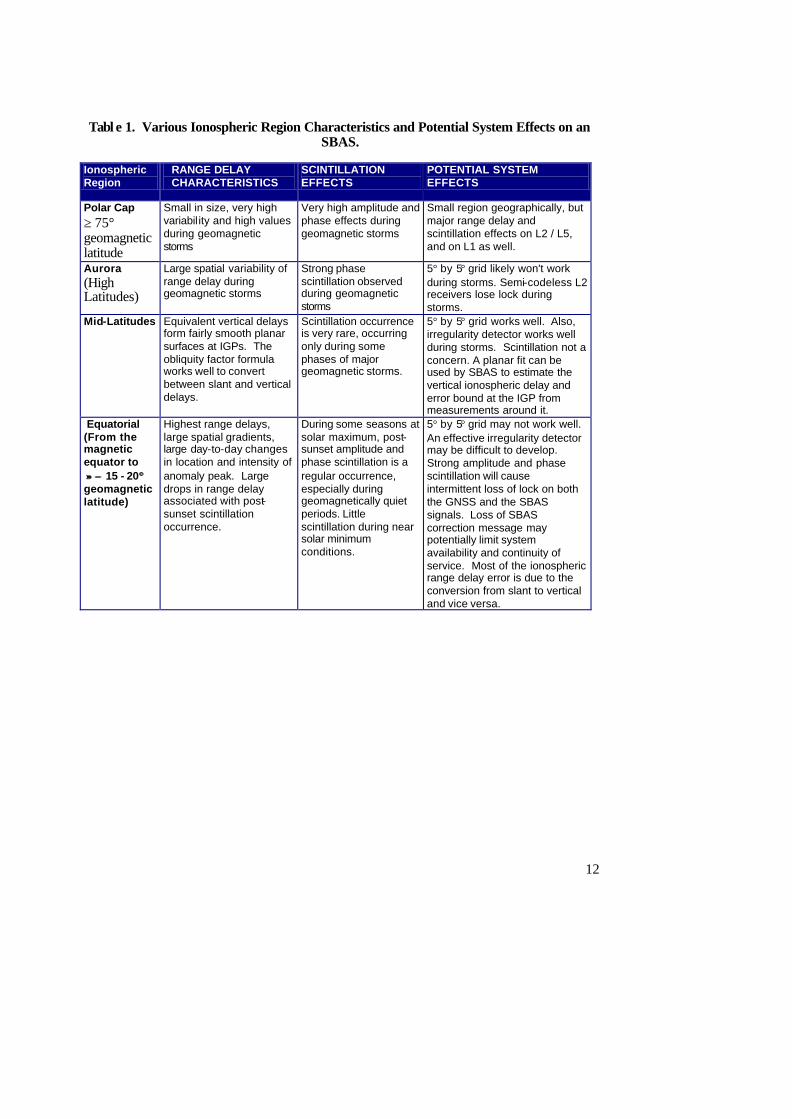
the correlation of amplitude fading between the L1 and L2 frequencies is given in Appendix B of this report. Amplitude scintillation on the L-band GPS L1 signals has not been a significant concern in the disturbed auroral ionosphere, but only in the equatorial regions. This has been assessed based on statistics of GPS L1 scintillation measurements during the recent solar maximum years (Pi, et al., 2002). Phase scintillation, on the other hand, has been shown to cause loss of lock on the semi-codeless L2 reference station receivers for periods of up to tens of minutes, and on many of the available GPS satellite directions at the same time, (Dehel, et al., 1999a and b; Pi, et al., 2002) in the high latitude regions. During periods of severe geomagnetic storm activity the loss of signal on the semi-codeless L2 signals at the SRSs could be a significant limitation in specifying IGP values in the auroral regions (Pi et al., 2002). During thes e times it is likely that the GIVEs will be set to their maximum value of 45 meters by the irregularity detector that is part of the GIVE monitor in WAAS and MSAS. 4. Summary of Ionospheric Effects by Region and Phenomena Table 1 tabulates the various ionospheric regions, their primary range delay characteristics, scintillation effects and the potential effects on an SBAS. Scintillation effects on GPS in the mid-latitude regions are in general insignificant, according to the statistical assessment based on L1 scintillation measurements made during the recent solar maximum (Pi, et al., 2002). During severe geomagnetic and ionospheric storms under solar maximum conditions, strong phase scintillation may occur in the mid-latitude regions associated with the activities of storm-related electrodynamical perturbations and auroral oval expansion (Pi, et al., 2002). Such extreme conditions have been taken into account in the WAAS algorithms and WAAS irregularity detector. Note from Table 1 that the mid-latitude ionosphere normally has the smallest temporal and spatial gradients, has a rare scintillation occurrence, and the 5° by 5° grid of ionospheric corrections has already been shown to work well in this region. The other world regions, however, have larger range delays as well as larger spatial and temporal gradients, a large occurrence of scintillation effects, and, in some cases, a larger day-to-day variability in range delay than the mid-latitude ionosphere, as has been previously discussed.
12
Tabl e 1. Various Ionospheric Region Characteristics and Potential System Effects on an SBAS.
Ionospheric Region
RANGE DELAY CHARACTERISTICS
SCINTILLATION EFFECTS
POTENTIAL SYSTEM EFFECTS
Polar Cap ≥ 75° geomagnetic latitude
Small in size, very high variabil ity and high values during geomagnetic storms
Very high amplitude and phase effects during geomagnetic storms
Small region geographically, but major range delay and scintillation effects on L2 / L5, and on L1 as well.
Aurora (High Latitudes)
Large spatial variability of range delay during geomagnetic storms
Strong phase scintillation observed during geomagnetic storms
5° by 5° grid likely won't work during storms. Semi-codeless L2 receivers lose lock during storms.
Mid-Latitudes Equivalent vertical delays form fairly smooth planar surfaces at IGPs. The obliquity factor formula works well to convert between slant and vertical delays.
Scintillation occurrence is very rare, occurring only during some phases of major geomagnetic storms.
5° by 5° grid works well. Also, irregularity detector works well during storms. Scintillation not a concern. A planar fit can be used by SBAS to estimate the vertical ionospheric delay and error bound at the IGP from measurements around it.
Equatorial (From the magnetic equator to ≈≈ ±± 15 - 20°° geomagnetic latitude)
Highest range delays, large spatial gradients, large day-to-day changes in location and intensity of anomaly peak. Large drops in range delay associated with post-sunset scintillation occurrence.
During some seasons at solar maximum, post-sunset amplitude and phase scintillation is a regular occurrence, especially during geomagnetically quiet periods. Little scintillation during near solar minimum conditions.
5° by 5° grid may not work well. An effective irregularity detector may be difficult to develop. Strong amplitude and phase scintillation will cause intermittent loss of lock on both the GNSS and the SBAS signals. Loss of SBAS correction message may potentially limit system availability and continuity of service. Most of the ionospheric range delay error is due to the conversion from slant to vertical and vice versa.
13
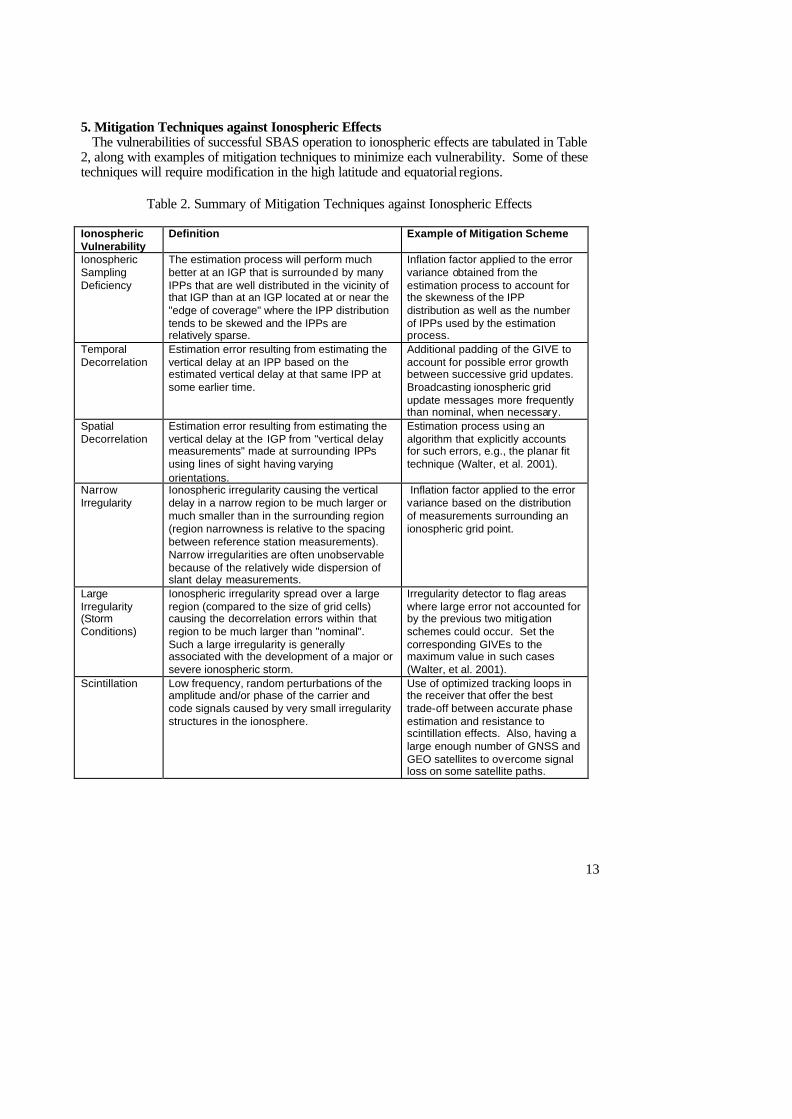
5. Mitigation Techniques against Ionospheric Effects The vulnerabilities of successful SBAS operation to ionospheric effects are tabulated in Table 2, along with examples of mitigation techniques to minimize each vulnerability. Some of these techniques will require modification in the high latitude and equatorial regions.
Table 2. Summary of Mitigation Techniques against Ionospheric Effects
Ionospheric Vulnerability
Definition Example of Mitigation Scheme
Ionospheric Sampling Deficiency
The estimation process will perform much better at an IGP that is surrounded by many IPPs that are well distributed in the vicinity of that IGP than at an IGP located at or near the "edge of coverage" where the IPP distribution tends to be skewed and the IPPs are relatively sparse.
Inflation factor applied to the error variance obtained from the estimation process to account for the skewness of the IPP distribution as well as the number of IPPs used by the estimation process.
Temporal Decorrelation
Estimation error resulting from estimating the vertical delay at an IPP based on the estimated vertical delay at that same IPP at some earlier time.
Additional padding of the GIVE to account for possible error growth between successive grid updates. Broadcasting ionospheric grid update messages more frequently than nominal, when necessary.
Spatial Decorrelation
Estimation error resulting from estimating the vertical delay at the IGP from "vertical delay measurements" made at surrounding IPPs using lines of sight having varying orientations.
Estimation process using an algorithm that explicitly accounts for such errors, e.g., the planar fit technique (Walter, et al. 2001).
Narrow Irregularity
Ionospheric irregularity causing the vertical delay in a narrow region to be much larger or much smaller than in the surrounding region (region narrowness is relative to the spacing between reference station measurements). Narrow irregularities are often unobservable because of the relatively wide dispersion of slant delay measurements.
Inflation factor applied to the error variance based on the distribution of measurements surrounding an ionospheric grid point.
Large Irregularity (Storm Conditions)
Ionospheric irregularity spread over a large region (compared to the size of grid cells) causing the decorrelation errors within that region to be much larger than "nominal". Such a large irregularity is generally associated with the development of a major or severe ionospheric storm.
Irregularity detector to flag areas where large error not accounted for by the previous two mitigation schemes could occur. Set the corresponding GIVEs to the maximum value in such cases (Walter, et al. 2001).
Scintillation Low frequency, random perturbations of the amplitude and/or phase of the carrier and code signals caused by very small irregularity structures in the ionosphere.
Use of optimized tracking loops in the receiver that offer the best trade-off between accurate phase estimation and resistance to scintillation effects. Also, having a large enough number of GNSS and GEO satellites to overcome signal loss on some satellite paths.
14
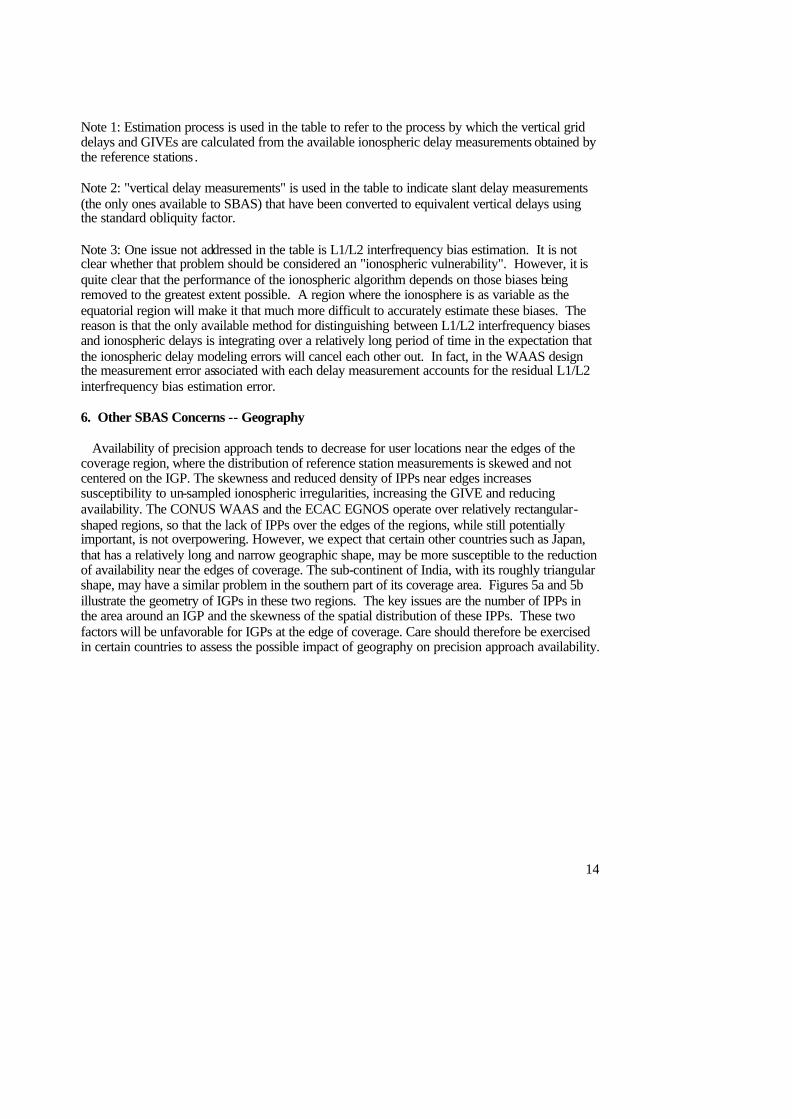
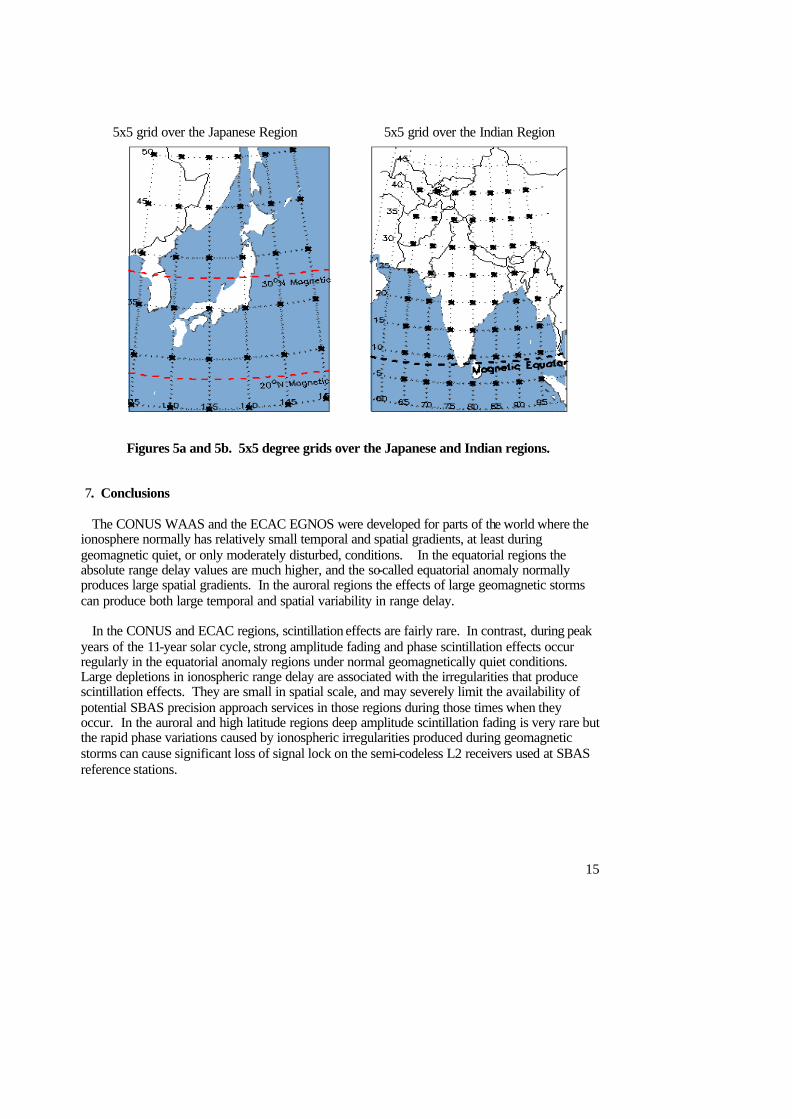
Note 1: Estimation process is used in the table to refer to the process by which the vertical grid delays and GIVEs are calculated from the available ionospheric delay measurements obtained by the reference stations . Note 2: "vertical delay measurements" is used in the table to indicate slant delay measurements (the only ones available to SBAS) that have been converted to equivalent vertical delays using the standard obliquity factor. Note 3: One issue not addressed in the table is L1/L2 interfrequency bias estimation. It is not clear whether that problem should be considered an "ionospheric vulnerability". However, it is quite clear that the performance of the ionospheric algorithm depends on those biases being removed to the greatest extent possible. A region where the ionosphere is as variable as the equatorial region will make it that much more difficult to accurately estimate these biases. The reason is that the only available method for distinguishing between L1/L2 interfrequency biases and ionospheric delays is integrating over a relatively long period of time in the expectation that the ionospheric delay modeling errors will cancel each other out. In fact, in the WAAS design the measurement error associated with each delay measurement accounts for the residual L1/L2 interfrequency bias estimation error. 6. Other SBAS Concerns -- Geography Availability of precision approach tends to decrease for user locations near the edges of the coverage region, where the distribution of reference station measurements is skewed and not centered on the IGP. The skewness and reduced density of IPPs near edges increases susceptibility to un-sampled ionospheric irregularities, increasing the GIVE and reducing availability. The CONUS WAAS and the ECAC EGNOS operate over relatively rectangular-shaped regions, so that the lack of IPPs over the edges of the regions, while still potentially important, is not overpowering. However, we expect that certain other countries such as Japan, that has a relatively long and narrow geographic shape, may be more susceptible to the reduction of availability near the edges of coverage. The sub-continent of India, with its roughly triangular shape, may have a similar problem in the southern part of its coverage area. Figures 5a and 5b illustrate the geometry of IGPs in these two regions. The key issues are the number of IPPs in the area around an IGP and the skewness of the spatial distribution of these IPPs. These two factors will be unfavorable for IGPs at the edge of coverage. Care should therefore be exercised in certain countries to assess the possible impact of geography on precision approach availability.
15
Figures 5a and 5b. 5x5 degree grids over the Japanese and Indian regions. 7. Conclusions The CONUS WAAS and the ECAC EGNOS were developed for parts of the world where the ionosphere normally has relatively small temporal and spatial gradients, at least during geomagnetic quiet, or only moderately disturbed, conditions. In the equatorial regions the absolute range delay values are much higher, and the so-called equatorial anomaly normally produces large spatial gradients. In the auroral regions the effects of large geomagnetic storms can produce both large temporal and spatial variability in range delay. In the CONUS and ECAC regions, scintillation effects are fairly rare. In contrast, during peak years of the 11-year solar cycle, strong amplitude fading and phase scintillation effects occur regularly in the equatorial anomaly regions under normal geomagnetically quiet conditions. Large depletions in ionospheric range delay are associated with the irregularities that produce scintillation effects. They are small in spatial scale, and may severely limit the availability of potential SBAS precision approach services in those regions during those times when they occur. In the auroral and high latitude regions deep amplitude scintillation fading is very rare but the rapid phase variations caused by ionospheric irregularities produced during geomagnetic storms can cause significant loss of signal lock on the semi-codeless L2 receivers used at SBAS reference stations.
5x5 grid over the Japanese Region 5x5 grid over the Indian Region
16
8. Recommendations and Suggestions for Future Work
• More work needs to be done in developing and testing SBAS ionospheric correction models for use in equatorial regions. The high level of ionospheric non-planar behavior in these regions makes it likely that the precision approach capability of an SBAS based on the current WAAS LNAV/VNAV ionospheric algorithms would be unavailable during significant periods of time. This could limit service during evening hours over the equatorial region and other nearby regions that rely on ranging signals that pass through the equatorial region. These potential limitations should be addressed by studies to improve the modeling of ionospheric delays.
• Within the next 6-10 years a full constellation of GNSS satellites transmitting dual
frequencies for civilian use should be in orbit and operational. Dual frequency capability allows direct measurement of io nospheric range delay directly along the path to each GNSS satellite, obviating the need for SBAS ionospheric correction models, except for those (hopefully rare) times when one of the transmitted frequencies is not available due to interference, or other outage. In the meantime, SBASs can be used in the equatorial region to provide an effective means to facilitate enroute and terminal area navigation, as well as NPAs for single frequency GNSS users over wide service areas. Additional studies ar e required to determine the level of availability in equatorial regions of precision approach service.
• The SBAS ionospheric working group proposes to make, and to expand, measurements
of ionospheric effects in order to specify the severity, and the spat ial, temporal, seasonal, and solar cycle characteristics of the effects. The following phenomena have been identified as requiring particular attention.
1. TEC depletions. Due to the significant potential impact on PA service, it should be a high priority to characterize these events in terms of their geographic size, their severity, and how long they persist.
2. Slant to vertical and vertical to slant conversion errors. Separate studies should be completed to determine the impact to service regions within and outside the equatorial anomaly region. In the latter case it should be determined whether the restricted range of viewing angles passing through the anomaly region reduces the severity of such errors for the user.
3. Scintillation. Impact on ground station and airborne receivers, in terms of signal and message data reception in both equatorial and auroral regions should be studied in detail. The impact on future dual frequency users should be considered.
4. Non-planar spatial gradients and temporal gradients in TEC. Spatial gradients of TEC in the equatorial regions should be evaluated against the 5° by 5° grid for impact to user interpolation accuracy. Also, temporal gradients in TEC should be evaluated against the GIS broadcast schedule. Actual range delay data will be used where available, supplemented by realistic ionospheric model data, where necessary.
• The SBAS ionospheric working group also proposes to make appropriate
measurements of scintillation effects on both SBAS and geostationary satellite
17
correction message data in order to specify the severity, and the spatial, temporal, seasonal and solar cycle characteristics, of scintillation effects on airborne and SRS receivers, and to propose potential methods to mitigate these effects.
9. References
Basu, S., Mackenzie, E., and Basu, Su., "Ionospheric constraints on VHF/UHF communications links during solar maximum and minimum periods", Radio Science, Vol. 23, No. 3, pp 363-378, May-June 1988. Conker, R., M. Bakry El-Arini, C. H. Hegarty, T. Shiao, “Modeling the Effects of Ionospheric Scintillation on GPS/SBAS Availability”, to be published in Radio Science, 2002. Dehel, T., Pham, K., Sheftic, J, and Nelthropp, D., “National Satellite Test Bed (NSTB) Observations of the Effects of Ionospheric Storms on a Prototype Wide Area Augmentation System”, Proceedings of the 1999 National Technical Meeting, Institute of Navigation, pp. 779-788, January 25-27, 1999. Available from The Institute of Navigation, Alexandria, VA 22314. Dehel, T., Pham, K., Sheftic, J, and Nelthropp, D., “National Satellite Test Bed (NSTB) Recent Observations of the Effects of Ionospheric Storms on a Prototype Wide Area Augmentation System”, pp. 239-246, Proceedings of the 1999 Ionospheric Effects Symposium, 4-6 May 1999, available from JMG Associates, Alexandria, VA 22308, 1999. Dehel, T., “Ionospheric Scintillation Effects on SBAS at the Geomagnetic Equator,” presented at the SBAS Iono Meeting, McLean, VA, May 10-11, 2002. Dehel, T., presented at the SBAS Ionospheric working group meeting No. 5, McLean, VA, May 10-11, 2002. Forte, B., Radicella, S. M. and Ezquer, R. G., “A Different Approach to the Analysis of GPS Scintillations Data”, Adbus Salam ICTP, IC/2001/29, 2001 Forte, B., and S. M. Radicella, “Analysis of Problems That Could Arise with GPS Ionospheric Scintillation Measurements”, presented at the URSI XXNII General Assembly, Maastricht, August 2002. Hochegger, G., Nava, B., Radicella, S., Leitinger, R., “A Family of Ionospheric Models for Different Uses”, Physics and Chemistry of the Earth, Part C, Volume 25, Number 4, pp 307-310, 2000. International Civil Aviation Organization (ICAO), International Standards And Recommended Practices (SARPS), Aeronautical Communications, Annex 10, Vol. I, Appendix B, Section 3.5.5.5, Montreal, Canada, 5th Edition, July 1996.
18
Klobuchar, J. A., G. J. Bishop, P. H. Doherty, “Total Electron Content and L-Band Amplitude and Phase Scintillation Measurements in the Polar Cap Ionosphere”, AGARD Conference Proceedings AGARD-CPP-382, May 1985. Klobuchar, J. A., P. H. Doherty, A. Das Gupta, M. R. Sivaraman and A. D. Sarma, “Equatorial Anomaly Gradient Effects on a Space-Based Augmentation System”, presented at the Beacon Satellite Studies Symposium, BSS-2001, available from Boston College Institute for Scientific Research, Newton, MA, 2001. Klobuchar, J. A., P. H. Doherty, M. Bakry El-Arini, R. Lejeune, T. Dehel, E. R. de Paula, F. S. Rodrigues, “Ionospheric Issues for a SBAS in the Equatorial Region,” presented at the Ionospheric Effect Symposium (IES) held at Alexandria, VA, USA, May 6-9, 2002. Nava, B. “Modello di Densita Elettronica della Ionosfera Applicato alla Navigazione Satellitare”, Thesis at the Universita degli Studi di Trieste, 1999. Pi, X., S. Nandi, B. M. Boulat, D. A. Stowers, and A. J. Mannucci, “Development of Ionospheric Scintillation Monitoring System Using IGS GPS Receivers and Analysis of Effects of Scintillation on GPS Signals”, JPL Technical Report to the FAA, Pasadena, CA, April 2002. RTCA, Inc., “Minimum Operational Performance Standards for Global Positioning System/Wide Area Augmentation System Airborne Equipment,” SC159 DO-229C, Washington, D.C., November 28, 2001. Skone, S. and Cannon, M. E., “Auroral Zone Ionospheric Considerations for WADGPS, pp. 117-127, NAVIGATION, Journal of The Institute of Navigation, Vol. 45, No., 2, Summer 1998. Walter, T. et al, “Robust Detection of Ionospheric Irregularities,” presented at the ION-GPS-2000 Meeting, Salt Lakes City, UT, September 2001. (copy can be obtained from: http://waas.stanford.edu/~wwu/walter/papers/irregularity_detector.pdf).
19
Appendix A
Signal-In-Space Performance Requirements for SBAS
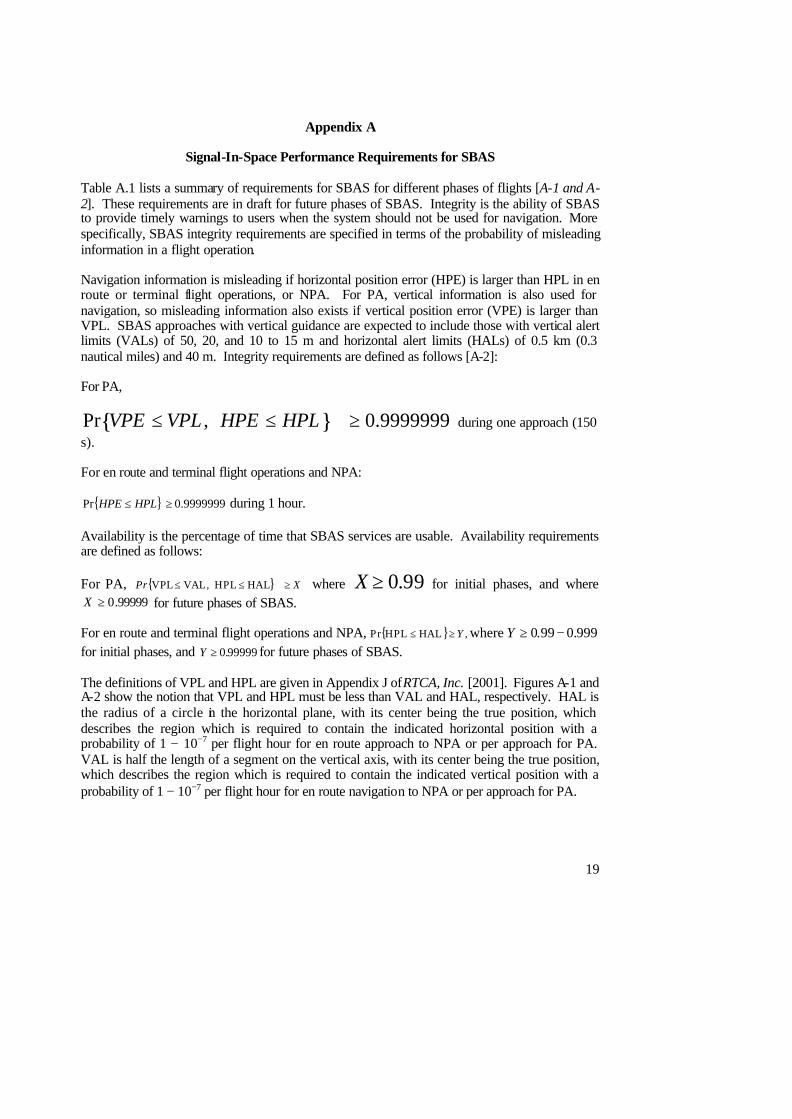
Table A.1 lists a summary of requirements for SBAS for different phases of flights [A-1 and A-2]. These requirements are in draft for future phases of SBAS. Integrity is the ability of SBAS to provide timely warnings to users when the system should not be used for navigation. More specifically, SBAS integrity requirements are specified in terms of the probability of misleading information in a flight operation. Navigation information is misleading if horizontal position error (HPE) is larger than HPL in en route or terminal flight operations, or NPA. For PA, vertical information is also used for navigation, so misleading information also exists if vertical position error (VPE) is larger than VPL. SBAS approaches with vertical guidance are expected to include those with vertical alert limits (VALs) of 50, 20, and 10 to 15 m and horizontal alert limits (HALs) of 0.5 km (0.3 nautical miles) and 40 m. Integrity requirements are defined as follows [A-2]: For PA, Pr VPE ≤ VPL , HPE ≤ HPL{ } ≥ 0.9999999 during one approach (150 s). For en route and terminal flight operations and NPA:
{ }HPLHPE ≤Pr 9999999.0≥ during 1 hour. Availability is the percentage of time that SBAS services are usable. Availability requirements are defined as follows: For PA, { } X Pr ≥≤≤ HALHPL,VALVPL where X ≥ 0.99 for initial phases, and where
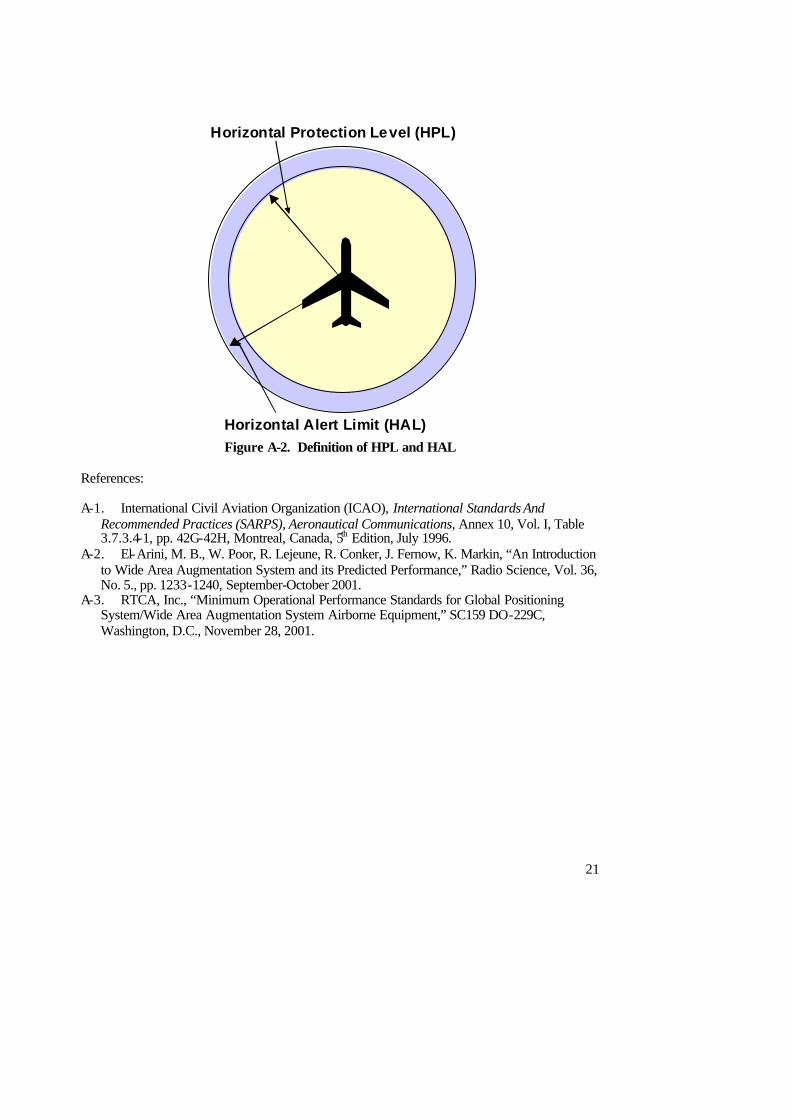
99999.0≥X for future phases of SBAS. For en route and terminal flight operations and NPA, { } ,HALHPLPr Y≥≤ where 999.099.0 −≥Y for initial phases, and 99999.0≥Y for future phases of SBAS. The definitions of VPL and HPL are given in Appendix J of RTCA, Inc. [2001]. Figures A-1 and A-2 show the notion that VPL and HPL must be less than VAL and HAL, respectively. HAL is the radius of a circle in the horizontal plane, with its center being the true position, which describes the region which is required to contain the indicated horizontal position with a probability of 1 − 10−7 per flight hour for en route approach to NPA or per approach for PA. VAL is half the length of a segment on the vertical axis, with its center being the true position, which describes the region which is required to contain the indicated vertical position with a probability of 1 − 10−7 per flight hour for en route navigation to NPA or per approach for PA.
20
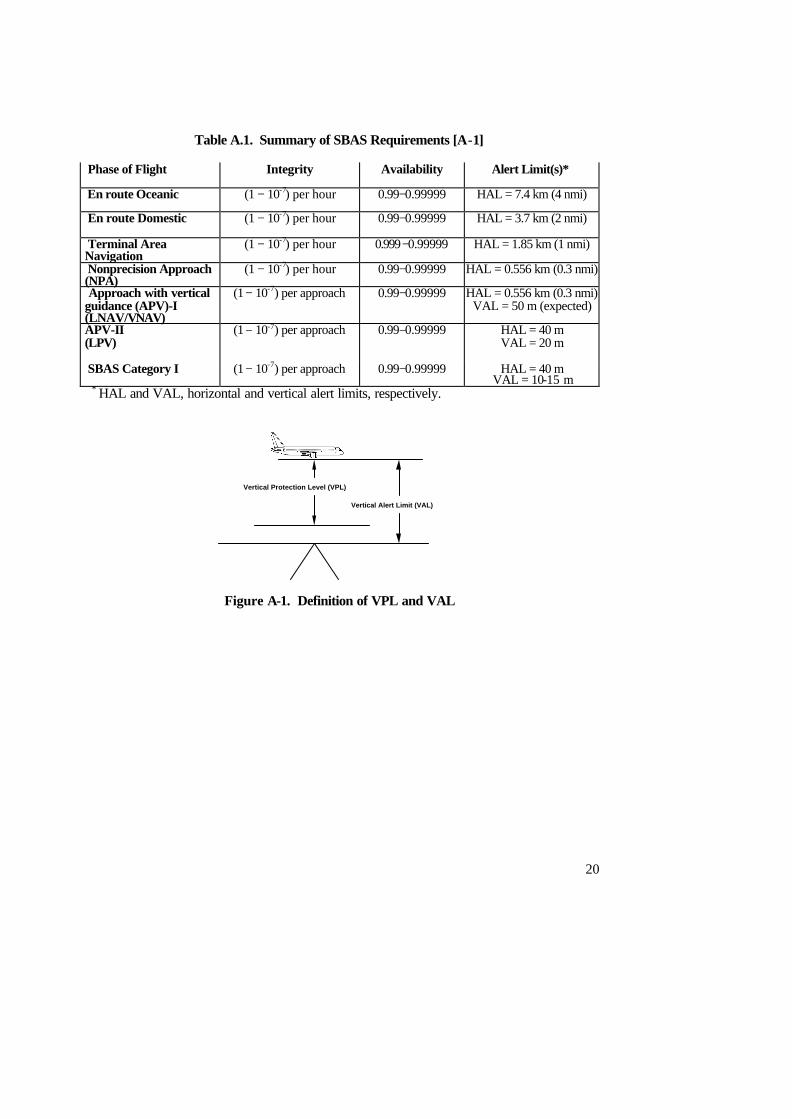
Table A.1. Summary of SBAS Requirements [A-1]
Phase of Flight Integrity Availability Alert Limit(s)*
En route Oceanic (1 − 10-7) per hour 0.99−0.99999 HAL = 7.4 km (4 nmi)
En route Domestic (1 − 10-7) per hour 0.99−0.99999 HAL = 3.7 km (2 nmi)
Terminal Area Navigation
(1 − 10-7) per hour 0.999−0.99999 HAL = 1.85 km (1 nmi)
Nonprecision Approach (NPA)
(1 − 10-7) per hour 0.99−0.99999 HAL = 0.556 km (0.3 nmi)
Approach with vertical guidance (APV)-I (LNAV/VNAV)
(1 − 10-7) per approach 0.99−0.99999 HAL = 0.556 km (0.3 nmi) VAL = 50 m (expected)
APV-II (LPV)
(1 − 10-7) per approach 0.99−0.99999 HAL = 40 m VAL = 20 m
SBAS Category I (1 − 10-7) per approach 0.99−0.99999 HAL = 40 m
VAL = 10-15 m * HAL and VAL, horizontal and vertical alert limits, respectively.
Vertical Protection Level (VPL)
Vertical Alert Limit (VAL)
Figure A-1. Definition of VPL and VAL
21
Horizontal Alert Limit (HAL)
Horizontal Protection Level (HPL)
Figure A-2. Definition of HPL and HAL
References: A-1. International Civil Aviation Organization (ICAO), International Standards And
Recommended Practices (SARPS), Aeronautical Communications, Annex 10, Vol. I, Table 3.7.3.4-1, pp. 42G-42H, Montreal, Canada, 5th Edition, July 1996.
A-2. El-Arini, M. B., W. Poor, R. Lejeune, R. Conker, J. Fernow, K. Markin, “An Introduction to Wide Area Augmentation System and its Predicted Performance,” Radio Science, Vol. 36, No. 5., pp. 1233-1240, September-October 2001.
A-3. RTCA, Inc., “Minimum Operational Performance Standards for Global Positioning System/Wide Area Augmentation System Airborne Equipment,” SC159 DO-229C, Washington, D.C., November 28, 2001.
22
Appendix B
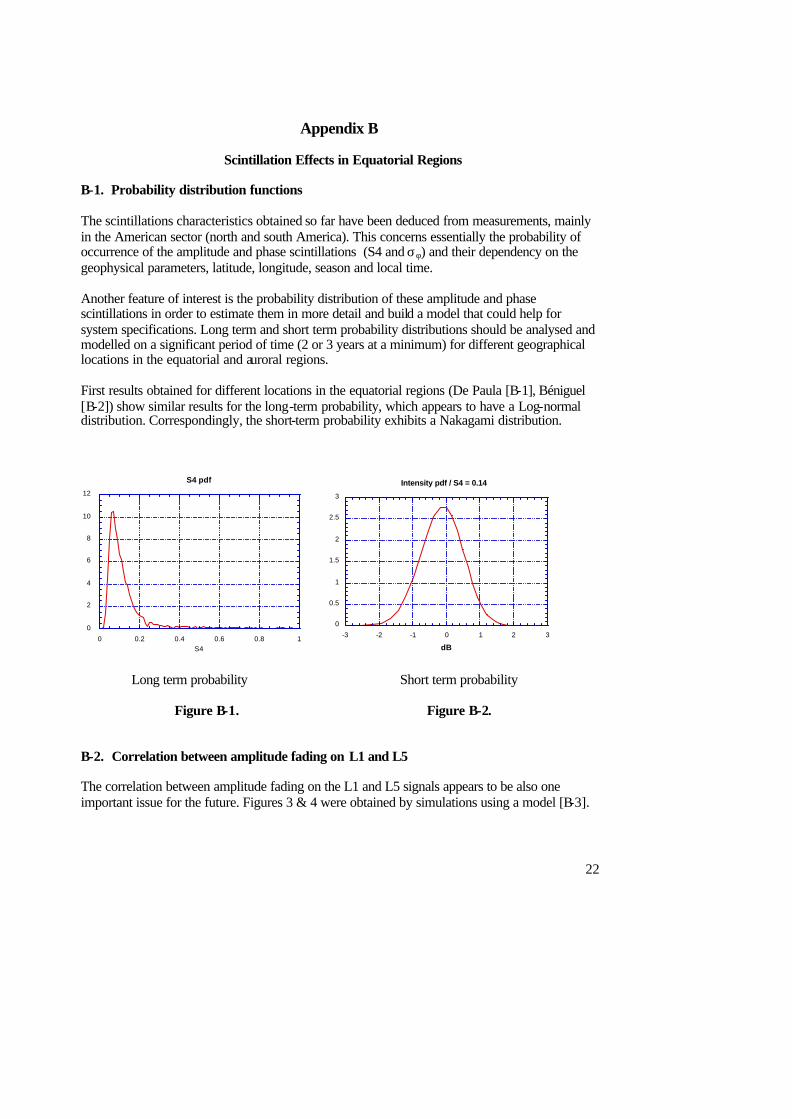
Scintillation Effects in Equatorial Regions B-1. Probability distribution functions The scintillations characteristics obtained so far have been deduced from measurements, mainly in the American sector (north and south America). This concerns essentially the probability of occurrence of the amplitude and phase scintillations (S4 and σφ) and their dependency on the geophysical parameters, latitude, longitude, season and local time. Another feature of interest is the probability distribution of these amplitude and phase scintillations in order to estimate them in more detail and build a model that could help for system specifications. Long term and short term probability distributions should be analysed and modelled on a significant period of time (2 or 3 years at a minimum) for different geographical locations in the equatorial and auroral regions. First results obtained for different locations in the equatorial regions (De Paula [B-1], Béniguel [B-2]) show similar results for the long-term probability, which appears to have a Log-normal distribution. Correspondingly, the short-term probability exhibits a Nakagami distribution.
0
2
4
6
8
10
12
0 0.2 0.4 0.6 0.8 1
S4 pdf
S4
0
0.5
1
1.5
2
2.5
3
-3 -2 -1 0 1 2 3
Intensity pdf / S4 = 0.14
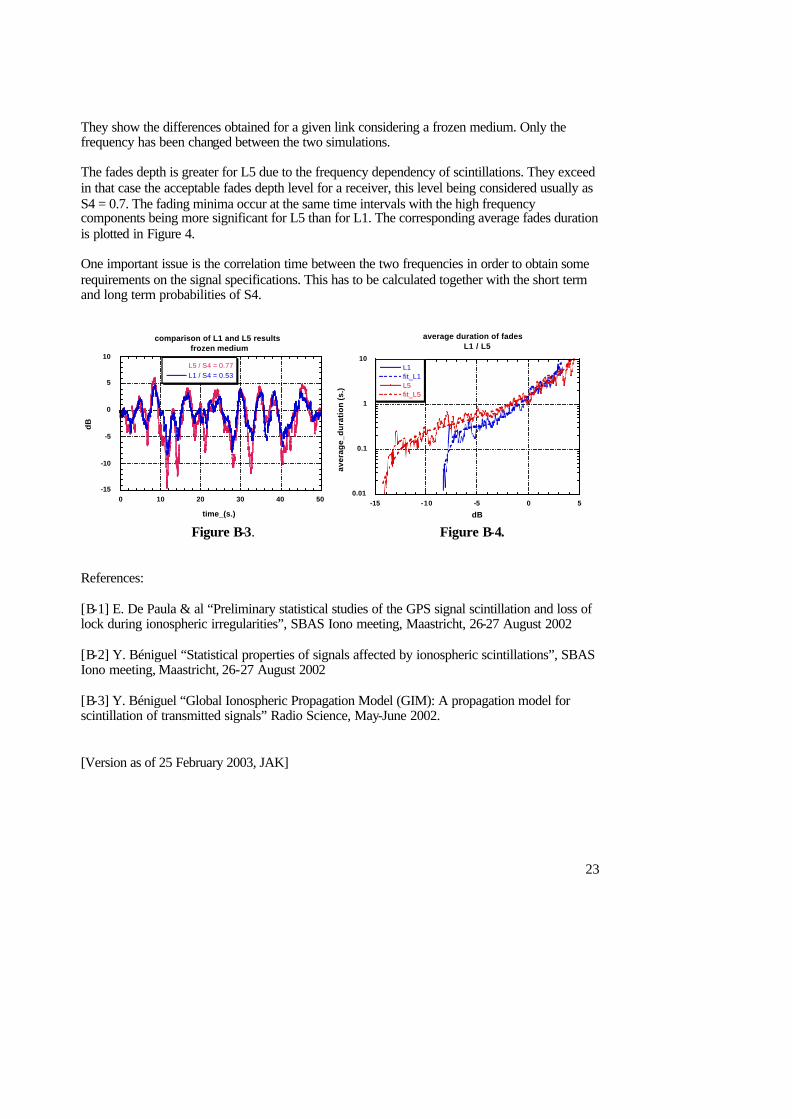
dB Long term probability Short term probability Figure B-1. Figure B-2. B-2. Correlation between amplitude fading on L1 and L5 The correlation between amplitude fading on the L1 and L5 signals appears to be also one important issue for the future. Figures 3 & 4 were obtained by simulations using a model [B-3].
23
They show the differences obtained for a given link considering a frozen medium. Only the frequency has been changed between the two simulations. The fades depth is greater for L5 due to the frequency dependency of scintillations. They exceed in that case the acceptable fades depth level for a receiver, this level being considered usually as S4 = 0.7. The fading minima occur at the same time intervals with the high frequency components being more significant for L5 than for L1. The corresponding average fades duration is plotted in Figure 4. One important issue is the correlation time between the two frequencies in order to obtain some requirements on the signal specifications. This has to be calculated together with the short term and long term probabilities of S4.
-15
-10
-5
0
5
10
0 10 20 30 40 50
comparison of L1 and L5 resultsfrozen medium
L5 / S4 = 0.77L1 / S4 = 0.53
dB
time_(s.)
0.01
0.1
1
10
-15 -10 -5 0 5
average duration of fadesL1 / L5
L1fit_L1L5fit_L5
aver
age_
dura
tion
(s.)
dB
Figure B-3. Figure B-4. References: [B-1] E. De Paula & al “Preliminary statistical studies of the GPS signal scintillation and loss of lock during ionospheric irregularities”, SBAS Iono meeting, Maastricht, 26-27 August 2002 [B-2] Y. Béniguel “Statistical properties of signals affected by ionospheric scintillations”, SBAS Iono meeting, Maastricht, 26-27 August 2002 [B-3] Y. Béniguel “Global Ionospheric Propagation Model (GIM): A propagation model for scintillation of transmitted signals” Radio Science, May-June 2002. [Version as of 25 February 2003, JAK]