ion mobility–mass spectrometry: a new paradigm for … mobility–mass spectrometry: a new...
TRANSCRIPT

International Journal of Mass Spectrometry 240 (2005) 301–315
Ion mobility–mass spectrometry: a new paradigm for proteomics
John A. McLean, Brandon T. Ruotolo, Kent J. Gillig, David H. Russell∗
Department of Chemistry, Laboratory for Biological Mass Spectrometry, Texas A&M University, 3255 TAMU, College Station, TX 77843, USA
Received 30 August 2004; accepted 1 October 2004Available online 13 November 2004
Abstract
Matrix-assisted laser desorption/ionization (MALDI) coupled with ion mobility–mass spectrometry (IM–MS) provides a rapid (�s–ms)means for the two-dimensional (2D) separation of complex biological samples (e.g., peptides, oligonucleotides, glycoconjugates, lipids,etc.), elucidation of solvent-free secondary structural elements (e.g., helices,�-hairpins, random coils, etc.), rapid identification of post-translational modifications (e.g., phosphorylation, glycosylation, etc.) or ligation of small molecules, and simultaneous and comprehensivesequencing information of biopolymers. In IM–MS, protein-identification information is complemented by structural characterization data,which is difficult to obtain using conventional proteomic techniques. New avenues for enhancing the figures of merit (e.g., sensitivity, limitso of derivingn©
K
1a
aoMrbsid[itvfst
gra-MSre-
duce
um-t andmod-ein
esigh, es-chpingersl).
iza-rift(byt oc-
1d
f detection, dynamic range, and analyte selectivity) and optimizing IM–MS experimental parameters are described in the contextew information at the forefront of proteomics research.2004 Elsevier B.V. All rights reserved.
eywords: Ion mobility; Mass spectrometry; Ion mobility-mass spectrometry; Proteomics; Biopolymers
. Contemporary proteomics by mass spectrometrynd the ion mobility–mass spectrometry method
Advances in the field of proteomics parallel technologicaldvances in mass spectrometry techniques for the purposesf protein separation, identification, and characterization[1].ass spectrometry-based protein identification has advanced
apidly over the past decade through the development ofottom–up MS[2] and top–down MS[3] techniques. Con-iderable developmental research is still focused on improv-ng the sensitivity, dynamic range, information content, andata-interpretation algorithms in these types of experiments
4]. Recent developments in instrumentation for ion mobil-ty spectrometry (IMS), a gas-phase post-ionization separa-ion method, coupled with mass spectrometry (IM–MS) re-eals potential applications of this relatively new techniqueor rapid, high-resolution separations of analytes based ontructure (ion conformation) and mass-to-charge (m/z) ra-ios. Although IM–MS separations can be achieved at reso-
∗ Corresponding author. Tel.: +1 979 845 3345; fax: +1 979 845 9485.
lutions comparable to high-performance liquid chromatophy (HPLC) and capillary electrophoresis (CE), most IM–instruments are operated at relatively low IM resolution toduce analysis time, maximize sample throughput, and rethe complexity of interfacing IM with MS[5–8].
Typical proteomic-scale questions require a large nber of measurements (determination of molecular weighamino acid sequence, screening for post-translationalifications, etc.[9]) and broad dynamic range (e.g., protconcentrations ranging from 1× 10⁻³ to 1× 10⁻²⁴ mol L−1
for human plasma proteins[10]); therefore, such techniqumust afford high throughput at low limits of detection, hsensitivity, and wide dynamic range. Mass spectrometrypecially time-of-flight MS (TOFMS), provides many sucapabilities, but the fundamental challenge in developroteomics IM–TOFMS instrumentation is that IMS sufffrom poor sensitivity and limits of detection (nmol–pmoThis is attributed to several factors including poor iontion efficiency, reduced ion transmission into the IM dcell, ion losses in the uniform electrostatic-field drift celldiffusion and scattering processes), and ion losses tha
E-mail address:[email protected] (D.H. Russell). cur between the differential aperture and the TOF source as
387-3806/$ – see front matter © 2004 Elsevier B.V. All rights reserved.oi:10.1016/j.ijms.2004.10.003

302 J.A. McLean et al. / International Journal of Mass Spectrometry 240 (2005) 301–315
Fig. 1. Diagram illustrating the relationship between the three target areasfor instrumental design efforts in IM for proteomic applications. Advancesin each area complement or enhance the capabilities of each of the othertarget areas.
discussed below. Current instrumental advances are aimedat overcoming these challenges, and these efforts are mo-tivated by the unique capabilities afforded by IM–MS andIM–MS/MS such as suppression or elimination of chemicalnoise, rapid (�s–ms) separation of complex biological mix-tures, and nearly simultaneous biopolymer sequencing.
Instrument design efforts aimed at applications in pro-teomics are conceived within the context of often competingexperimental objectives. For example, the overall ion trans-mission efficiency, and thus, sensitivity and limits of detec-tion, of a mass spectrometer are often sacrificed to obtain nar-rower ion energy distributions or spatial positions for higherresolution measurements. To mitigate the effects of compet-ing experimental goals, we have focused IM–MS instrumentdesign on three complementary areas of peptide and proteinanalysis as illustrated inFig. 1. Note that IM–MS separationparameters, throughput and sensitivity, and IM–MS/MS, areconnected. Thus, advances in one of these areas often benefitthe other two. For instance, an increased ability to dispersepeptide ion signals in the ion mobility dimension facilitatesparallel tandem mass spectrometry experiments on mobility-separated peptide ions.
Fig. 1 lists several experiments and instrument configu-rations used to address the three main areas of interest. Al-though most of the points listed inFig. 1have been discussedelsewhere, the topic of MS-resolution modes has receivedc -c ) andm olu-t ctiona mente ed in
a single channel rather than being dispersed across the entireisotope cluster. For protein identification experiments, it isoften desirable to observe a larger number of low-resolutionpeptide ion signals (or peptide fragment ion signals in a tan-dem mass spectrometry experiment), rather than a lower num-ber of high-resolution peptide isotope cluster ion signals.However, mass measurement accuracy on peptide ion sig-nals where the isotope cluster is not resolved, is limited to∼50 ppm and may be insufficient for high confidence levelprotein identification[12]. In IM–MS peptide mass-mappingexperiments (e.g., bottom–up MS), the resolutions of both theIM and MS dimensions are tailored to provide an optimal bal-ance between sensitivity and resolution for high confidencelevel protein identification.
1.1. Liquid chromatography–mass spectrometry versusion mobility–mass spectrometry
Separations of complex biological mixtures using com-binations of liquid chromatography (e.g., HPLC, CE, etc.)coupled with MS detection have addressed several of theanalytical challenges encountered in proteomics[13–15].An important attribute of LC–MS is the ability to increasethe dynamic range of the analysis by attenuating chemicalnoise/instrumental background[4]. However, coupling LCto MS imposes significant limitations on both experimen-t MSs n thett t veryhs sam-p -t usedt tion-a asisf fica-t di-m s oft d an-a lipidv s ex-a withh fromt so asst n as e ofp ara-t aly-s uid-p oresis(
esu tlinedh tic
omparatively little attention[11]. Similar to the above disussion of balance between ion transmission (sensitivityass spectral resolution, intentional lowering of the res
ion of the mass measurement enhances limits of detend sensitivity relative to high-resolution mass measurexperiments, because all of the analyte signal is contain
s
al design and independent optimization of the LC andeparation conditions. Further, there is a large disparity iimescales of the two-analyte dispersive dimensions[16]. Al-hough modern TOF mass analyzers can acquire data aigh rates (e.g., 4× 10⁴ to 5× 10⁴ spectra s−1), liquid-phaseeparations can require minutes to hours, which limitsle throughput of LC–MS instrumentation[16]. In many pro
eomic applications, the chromatography dimension iso decrease the complexity of the sample, i.e., to fracte the analytes prior to MS analysis, which forms the b
or techniques such as multidimensional protein identiion technology[17,18]. Seldom is the chromatographicension used to provide reliable qualitative descriptor
he analyte, e.g., to distinguish between background anlyte components or molecular type (peptide versusersus surfactant, etc.). Recently, Smith and co-workermined chromatographic retention time in combinationigh mass measurement accuracy to identify proteins
heir constituent tryptic peptides[19]. This approach relien the combination of retention time and molecular m
o uniquely (or near-uniquely) identify an analyte withiample having well-defined composition (i.e., a mixtureptides), rather than the qualitative utility of the sep
ion method. Examples of such LC–MS correlation anes in proteomics are rare, but are fundamental to 2D liqhase separations such as polyacrylamide gel electrophPAGE).
In contrast, correlation analysis in 2D IM–MS providnique advantages in proteomic research, which are ouerein. A typical 2D IM–MS separation of a model tryp

J.A. McLean et al. / International Journal of Mass Spectrometry 240 (2005) 301–315 303
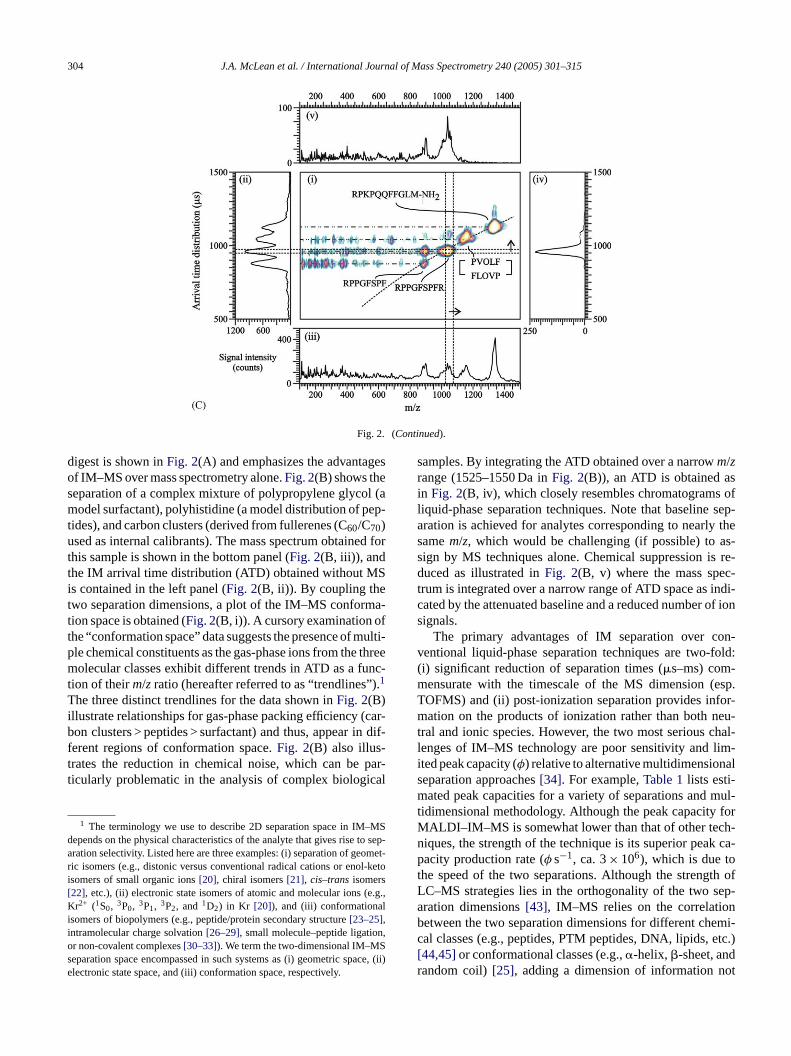
Fig. 2. (A): (i) Two-dimensional IM–MS plot of conformation space illustrating the separation of peptides obtained from a tryptic digest of bovine hemoglobin(adapted from Ref.[108]). (ii) The ion mobility ATD integrated over allm/zspace. (iii) The mass spectrum obtained by integrating over all ATD space. (iv) TheATD integrated over them/z range of 1525–1550 and (v) the mass spectrum obtained by integrating over the ATD of 1300–1400�s (regions outlined by dashedlines). (B): (i) Two-dimensional IM–MS plot of conformation space showing the separation of a complex mixture of polypropylene glycol, polyhistidine, andcarbon clusters (derived from C60/C70, which are used as both mass and mobility internal standards). (ii) The ion mobility ATD integrated over allm/zspace. (iii)The mass spectrum obtained by integrating over all ATD space. (iv) The ATD integrated over them/z range of 1525–1550 and (v) the mass spectrum obtainedby integrating over the ATD of 550–600�s (regions outlined by dashed lines). (C): (i) Two-dimensional IM–MS/MS plot of conformation space illustratingthe separation of precursor peptides and their fragment ions from substance P, gramicidin S, bradykinin, and des[Arg9]-bradykinin using SID ion activation(65 eV lab frame energy). (ii) The ion mobility ATD integrated over allm/zspace. (iii) The mass spectrum obtained by integrating over all ATD space. (iv) TheATD integrated over them/z range of 1025–1075 and (v) the mass spectrum obtained by integrating over the ATD of 950–975�s (regions outlined by dashedlines). The drift cell was operated at 50 V cm−1 Torr−1 with helium gas (A), 80 V cm−1 Torr−1 with nitrogen gas (B), and 73 V cm−1 Torr−1 with helium gas(C), respectively. MALDI was performed using�-cyano-4-hydroxycinnamic acid (CHCA) matrix with a frequency-tripled Nd:YAG laser (355 nm) operatedat a repetition rate of 200 and 100 Hz in (A) and (B), respectively, and using a nitrogen laser (337 nm) operated at 30 Hz in (C).
304 J.A. McLean et al. / International Journal of Mass Spectrometry 240 (2005) 301–315
Fig. 2. (Continued).
digest is shown inFig. 2(A) and emphasizes the advantagesof IM–MS over mass spectrometry alone.Fig. 2(B) shows theseparation of a complex mixture of polypropylene glycol (amodel surfactant), polyhistidine (a model distribution of pep-tides), and carbon clusters (derived from fullerenes (C60/C70)used as internal calibrants). The mass spectrum obtained forthis sample is shown in the bottom panel (Fig. 2(B, iii)), andthe IM arrival time distribution (ATD) obtained without MSis contained in the left panel (Fig. 2(B, ii)). By coupling thetwo separation dimensions, a plot of the IM–MS conforma-tion space is obtained (Fig. 2(B, i)). A cursory examination ofthe “conformation space” data suggests the presence of multi-ple chemical constituents as the gas-phase ions from the threemolecular classes exhibit different trends in ATD as a func-tion of theirm/z ratio (hereafter referred to as “trendlines”).1
The three distinct trendlines for the data shown inFig. 2(B)illustrate relationships for gas-phase packing efficiency (car-bon clusters > peptides > surfactant) and thus, appear in dif-ferent regions of conformation space.Fig. 2(B) also illus-trates the reduction in chemical noise, which can be par-ticularly problematic in the analysis of complex biological
1 The terminology we use to describe 2D separation space in IM–MSdepends on the physical characteristics of the analyte that gives rise to sep-aration selectivity. Listed here are three examples: (i) separation of geomet-r l-ketoi[ (e.g.,K lii n,o Ss ace, (ie
samples. By integrating the ATD obtained over a narrowm/zrange (1525–1550 Da inFig. 2(B)), an ATD is obtained asin Fig. 2(B, iv), which closely resembles chromatograms ofliquid-phase separation techniques. Note that baseline sep-aration is achieved for analytes corresponding to nearly thesamem/z, which would be challenging (if possible) to as-sign by MS techniques alone. Chemical suppression is re-duced as illustrated inFig. 2(B, v) where the mass spec-trum is integrated over a narrow range of ATD space as indi-cated by the attenuated baseline and a reduced number of ionsignals.
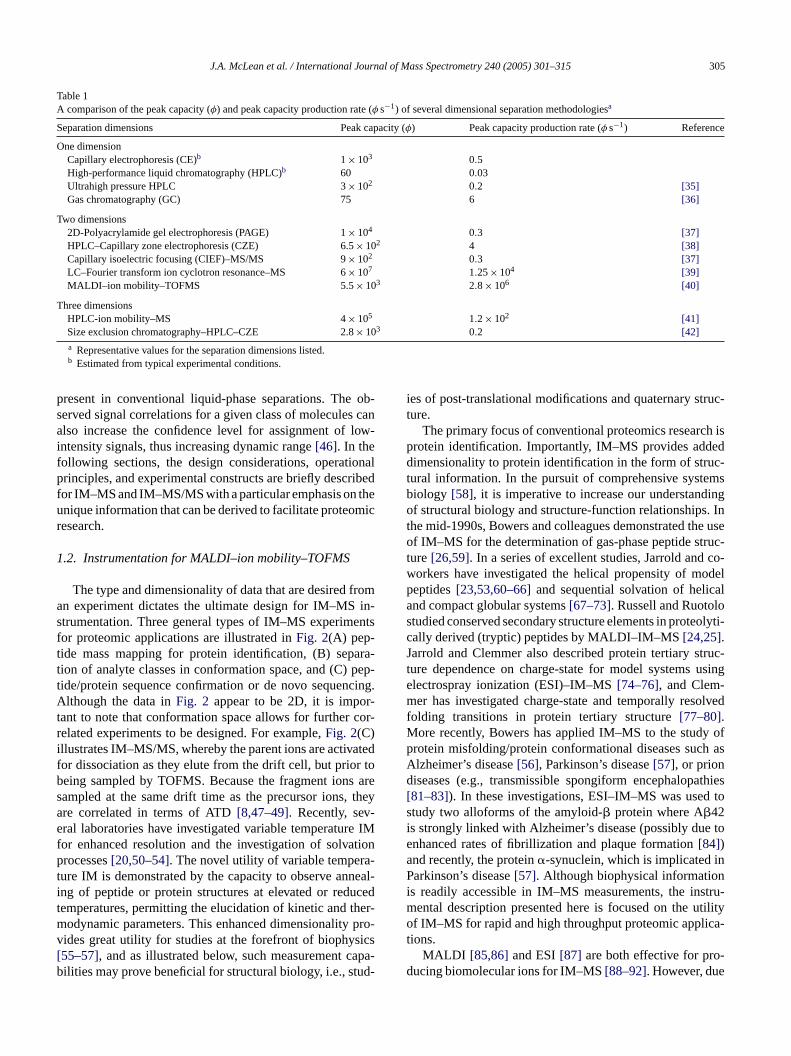
The primary advantages of IM separation over con-ventional liquid-phase separation techniques are two-fold:(i) significant reduction of separation times (�s–ms) com-mensurate with the timescale of the MS dimension (esp.TOFMS) and (ii) post-ionization separation provides infor-mation on the products of ionization rather than both neu-tral and ionic species. However, the two most serious chal-lenges of IM–MS technology are poor sensitivity and lim-ited peak capacity (φ) relative to alternative multidimensionalseparation approaches[34]. For example,Table 1lists esti-mated peak capacities for a variety of separations and mul-tidimensional methodology. Although the peak capacity forMALDI–IM–MS is somewhat lower than that of other tech-niques, the strength of the technique is its superior peak ca-pacity production rate (φ s−1, ca. 3× 10⁶), which is due tot th ofL ep-a nb emi-c etc.)[ dr ot
ic isomers (e.g., distonic versus conventional radical cations or enosomers of small organic ions[20], chiral isomers[21], cis–trans isomers22], etc.), (ii) electronic state isomers of atomic and molecular ionsr2+ (1S0, 3P0, 3P1, 3P2, and 1D2) in Kr [20]), and (iii) conformationa
somers of biopolymers (e.g., peptide/protein secondary structure[23–25],ntramolecular charge solvation[26–29], small molecule–peptide ligatior non-covalent complexes[30–33]). We term the two-dimensional IM–Meparation space encompassed in such systems as (i) geometric splectronic state space, and (iii) conformation space, respectively.
i)
he speed of the two separations. Although the strengC–MS strategies lies in the orthogonality of the two sration dimensions[43], IM–MS relies on the correlatioetween the two separation dimensions for different chal classes (e.g., peptides, PTM peptides, DNA, lipids,44,45]or conformational classes (e.g.,�-helix,�-sheet, anandom coil)[25], adding a dimension of information n
J.A. McLean et al. / International Journal of Mass Spectrometry 240 (2005) 301–315 305
Table 1A comparison of the peak capacity (φ) and peak capacity production rate (φ s−1) of several dimensional separation methodologiesa
Separation dimensions Peak capacity (φ) Peak capacity production rate (φ s−1) Reference
One dimensionCapillary electrophoresis (CE)b 1× 10³ 0.5High-performance liquid chromatography (HPLC)b 60 0.03Ultrahigh pressure HPLC 3× 10² 0.2 [35]Gas chromatography (GC) 75 6 [36]
Two dimensions2D-Polyacrylamide gel electrophoresis (PAGE) 1× 10⁴ 0.3 [37]HPLC–Capillary zone electrophoresis (CZE) 6.5× 10² 4 [38]Capillary isoelectric focusing (CIEF)–MS/MS 9× 10² 0.3 [37]LC–Fourier transform ion cyclotron resonance–MS 6× 10⁷ 1.25× 10⁴ [39]MALDI–ion mobility–TOFMS 5.5× 10³ 2.8× 10⁶ [40]
Three dimensionsHPLC-ion mobility–MS 4× 10⁵ 1.2× 10² [41]Size exclusion chromatography–HPLC–CZE 2.8× 10³ 0.2 [42]a Representative values for the separation dimensions listed.b Estimated from typical experimental conditions.
present in conventional liquid-phase separations. The ob-served signal correlations for a given class of molecules canalso increase the confidence level for assignment of low-intensity signals, thus increasing dynamic range[46]. In thefollowing sections, the design considerations, operationalprinciples, and experimental constructs are briefly describedfor IM–MS and IM–MS/MS with a particular emphasis on theunique information that can be derived to facilitate proteomicresearch.
1.2. Instrumentation for MALDI–ion mobility–TOFMS
The type and dimensionality of data that are desired froman experiment dictates the ultimate design for IM–MS in-strumentation. Three general types of IM–MS experimentsfor proteomic applications are illustrated inFig. 2(A) pep-tide mass mapping for protein identification, (B) separa-tion of analyte classes in conformation space, and (C) pep-tide/protein sequence confirmation or de novo sequencing.Although the data inFig. 2 appear to be 2D, it is impor-tant to note that conformation space allows for further cor-related experiments to be designed. For example,Fig. 2(C)illustrates IM–MS/MS, whereby the parent ions are activatedfor dissociation as they elute from the drift cell, but prior tobeing sampled by TOFMS. Because the fragment ions aresampled at the same drift time as the precursor ions, theya -e e IMf tionp a-t neal-i ucedt her-m pro-v ics[ apa-b ud-
ies of post-translational modifications and quaternary struc-ture.
The primary focus of conventional proteomics research isprotein identification. Importantly, IM–MS provides addeddimensionality to protein identification in the form of struc-tural information. In the pursuit of comprehensive systemsbiology [58], it is imperative to increase our understandingof structural biology and structure-function relationships. Inthe mid-1990s, Bowers and colleagues demonstrated the useof IM–MS for the determination of gas-phase peptide struc-ture[26,59]. In a series of excellent studies, Jarrold and co-workers have investigated the helical propensity of modelpeptides[23,53,60–66]and sequential solvation of helicaland compact globular systems[67–73]. Russell and Ruotolostudied conserved secondary structure elements in proteolyti-cally derived (tryptic) peptides by MALDI–IM–MS[24,25].Jarrold and Clemmer also described protein tertiary struc-ture dependence on charge-state for model systems usingelectrospray ionization (ESI)–IM–MS[74–76], and Clem-mer has investigated charge-state and temporally resolvedfolding transitions in protein tertiary structure[77–80].More recently, Bowers has applied IM–MS to the study ofprotein misfolding/protein conformational diseases such asAlzheimer’s disease[56], Parkinson’s disease[57], or priondiseases (e.g., transmissible spongiform encephalopathies[81–83]). In these investigations, ESI–IM–MS was used tosi e toea inP ni stru-m tilityo ca-t
-d
re correlated in terms of ATD[8,47–49]. Recently, sevral laboratories have investigated variable temperatur
or enhanced resolution and the investigation of solvarocesses[20,50–54]. The novel utility of variable temper
ure IM is demonstrated by the capacity to observe anng of peptide or protein structures at elevated or redemperatures, permitting the elucidation of kinetic and todynamic parameters. This enhanced dimensionality
ides great utility for studies at the forefront of biophys55–57], and as illustrated below, such measurement cilities may prove beneficial for structural biology, i.e., st
tudy two alloforms of the amyloid-� protein where A�42s strongly linked with Alzheimer’s disease (possibly dunhanced rates of fibrillization and plaque formation[84])nd recently, the protein�-synuclein, which is implicatedarkinson’s disease[57]. Although biophysical informatio
s readily accessible in IM–MS measurements, the inental description presented here is focused on the uf IM–MS for rapid and high throughput proteomic appli
ions.MALDI [85,86] and ESI[87] are both effective for pro
ucing biomolecular ions for IM–MS[88–92]. However, due

306 J.A. McLean et al. / International Journal of Mass Spectrometry 240 (2005) 301–315
to differences in the types of ions formed and ionization effi-ciency, the source selected will depend on the aim of the ex-periment. The designs presented here utilize MALDI as theionization source for peptides and proteins rather than ESIand therefore differ from the majority of other IM–MS in-strument platforms described in the literature[52,53,93–95].Our choice of MALDI is based-on four considerations. First,MALDI produces predominantly singly charged ions, whichincrease sensitivity and reduces spectral congestion by notpartitioning ions into several charge-state channels. Sec-ond, MALDI is an inherently pulsed source of ions definingt0 for both time-dispersive separation dimensions (IM andTOFMS). Third, MALDI produces ions in both a temporally-(ns–ps) and spatially focused region (�m2). Under these con-ditions, resolution is not limited by temporally gating the ioninjection [54,96–98], and ion transmission efficiency is en-hanced by better projection of the ion source onto the apertureplate defining the end of the drift cell analogous to ion pro-jection in sector-field instrumentation[99]. Finally, MALDIis relatively tolerant to detergents and salts commonly usedin biochemistry. One criticism of MALDI is that potentiallytime consuming and contaminating sample preparation pro-cedures are often necessary, but these concerns are mitigatedby the recent availability of robotic sample handling systems,which can be used to construct “proteomics analyzers” ofvirtually complete automation replete with sample archivingc
ies,m ectsi rces.T as-p ucesg at arer n thems ticals teini con-f -e s inp min-i zedi ruc-t e theM ry.
ofM b-of t ist , He,N iffer-e entlys onalT ts ofs . Tof drift
cell, we use a so-called “periodic-focusing” drift cell design[103]. These drift cells are analogous to dc-only ion guideswhereby radial diffusion of the ions is limited. By confiningthe ion beam to the central axis of the drift cell, ion trans-port efficiency can be increased by factors of ca. 10–1000over uniform electrostatic field designs without a concomi-tant degradation in IM resolving power (i.e., the ion guidesuperimposes a small confining field on a large uniform elec-trostatic field).
An important aspect of the IM–MS experiment is the treat-ment of 2D data acquisition. The typical timescale for IMdrift times range from ca. 500 to 2000�s, while the flighttime of ions in the TOFMS range from ca. 5 to 40�s. Se-quentially initiating TOFMS at a rate of 25–200 kHz andsubsequently stitching the spectra to construct a compositeplot of conformation space would limit the time resolutionin the IM dimension to the sampling rate of the TOFMS.For example, in order to achieve the necessary TOF sam-pling frequency (8–10 TOFMS spectra per IM peak) fora typical IM elution profile (25–75�s wide at baseline),the TOF sampling frequency would range up to 400 kHzand result in poor sampling efficiency for analytes exhibit-ing either high IM resolution or fast IM drift times. Thus,real-time sampling of all IM elution profiles would requireflight times in the mass analyzer of a few microseconds(e.g., 2.5�s at 400 kHz) to retain time correlation. Thisc tionT
solu-t dataa -l Sa nitiali lotot ateda 5F -t redt tedi hs byat c-ts r-l then dl ved.A g toI ch-n ilityt tiond
s inc MS
apabilities[100].Complementary to high-throughput proteomic stud
ost IM–MS instrument platforms are devoted to projnvestigating gas-phase ion structure and utilize ESI souhis preference for ESI over MALDI for studies of ghase structure is due to the perception that ESI prodas-phase ions having three-dimensional structures thepresentative of the solution-phase forces that act oolecule prior to desolvation/ionization[101]. Although this
upposition is based on a relatively small number of critudies on conformations of ESI formed peptide and proons, there are even fewer examples of studies on theormations of MALDI-formed ions[102]. There are, howver, many similarities between crystal growth conditionrotein crystallography (the standard method of deter
ng protein structures) and the solution conditions utilin MALDI sample deposition. Further studies on the stures of peptide/protein ions and how solvents influencALDI ionization are currently underway in our laboratoA schematic diagram of the general features
ALDI–IM–TOFMS instrumentation developed in our laratory is presented inFig. 3(A). Briefly, MALDI ions are
ormed at the entrance aperture of the IM drift cell thaypically operated at 1–10 Torr of background gas (e.g.
2, CH4, Ar, etc.). The ion beam then passes through a dntially pumped TOFMS interface region and subsequampled in the source of a two-stage reflectron orthogOFMS. This design was chosen to combine the elemenimplicity, ease-of-use, and high ion transport efficiencyurther enhance the ion transport efficiency through the
onstraint is incompatible with conventional high-resoluOFMS[104].
To overcome this challenge and decouple the time reion in both separation dimensions, a time interleavingcquisition scheme was developed[105]. This concept is il
ustrated inFig. 3(B) whereby a series of interleaved TOFMcquisition sequences are sequentially offset from the i
onization laser pulse (tIMo ) and recombined to generate a pf conformation space. For example, as shown inFig. 3(B),
he first TOF acquisition sequence (interleave #1) is initit tIMo and contains 2000 TOF mass spectra each of 2�s.or each successive laser pulse (tIMo ), the initial TOFMS ex
raction (tTOFo ) is offset by an amount equal to the desi
ime resolution in the IM dimension. For the case illustran Fig. 3(B), the desired IM time resolution is 2.5�s, so eacuccessivetTOF
o is offset from the previous laser pulsen increment of 2.5�s (i.e.,tTOF
o interleave #2 =tIMo + 2.5�s,TOFo interleave #3 =tIMo + 5�s, etc.). For a TOFMS extraion frequency of 40 kHz (one extraction every 25�s), theequence illustrated inFig. 3(B) is completed in 10 inteeaves, at which point the acquisition program returns toon-delayed sequence (tTOF
o = tIMo ) and iterates until a desireevel of signal averaging in conformation space is achielthough this approach adds a limited amount of scannin
M–TOFMS data acquisition (ideally a non-scanning teology), the primary advantage of this method is the ab
o independently define time resolution in both separaimensions.
It is also important to recognize that parallel advanceontemporary TOFMS are readily transferred to IM–TOF

J.A. McLean et al. / International Journal of Mass Spectrometry 240 (2005) 301–315 307
Fig. 3. (A) Schematic diagram of the MALDI–IM–TOFMS arrangement typically used in our laboratories. (B) Timing sequence diagram illustrating theinterleaved data acquisition methodology used to independently define time resolution in the IM dimension, which is achieved by varying the interleave timeoffset and number of interleaves. Subsequently, all interleaves are stitched together to provide 2D IM–MS plots of conformation space (adapted fromreference[105]). (C) (left) Integrated mass spectra over all ATD space of a mixture of 1.2 fmol human angiotensin II (DRVYIHPF,Mr = 1045.54 Da) and 0.96 fmol humanangiotensin I (DRVYIHPFHL,Mr = 1295.69 Da) as deposited on the MALDI target. MALDI was performed using a frequency-tripled Nd:YAG laser (355 nm)at a laser repetition rate of 150 Hz. (B) Integrated mass spectrum of a mixture of 30 fmol angiotensin II and 24 fmol angiotensin I deposited on the MALDItarget. MALDI was performed using a nitrogen laser (337 nm) at a laser repetition rate of 20 Hz. In both cases, the drift cell was operated at 62 V cm−1 Torr−1
with helium gas (adapted from Ref.[108]).
instrumentation, and several directions are actively beingpursued by a number of groups to enhance the sensitivityand dynamic range obtained in IM–TOFMS instrumenta-tion. For example, advances in pulsed ion funnels[52] andpulsed ion traps[106] as ion transmission and storage de-vices can significantly improve sensitivity when coupling acontinuous ion source such as ESI with IM–MS. Comple-mentary advances are also realized in MALDI–TOFMS byincreasing the instrumental duty cycle through the use of highrepetition rate laser technology[107]. Recently, moderateenergy (10–30�J/pulse) high repetition rate (0.5–100 kHz),
solid-state, frequency-tripled Nd:YAG and Nd:YLF (355 nmand 349 (or 351) nm, respectively) lasers have becomeavailable. Importantly, these lasers exhibit significantly im-proved primary beam characteristics (e.g., TEM00, Gaussian∼0.25–1 mm diameter (1/e2), divergence ca. 1–4 mrad) overconventional lasers used for MALDI (e.g., cartridge-type ni-trogen) while retaining similar temporal attributes (0.5–20 nsversus 4–5 ns pulse widths, respectively). By using high repe-tition rate (150 Hz) MALDI, sub-fmol absolute detection lim-its (ca. 0.1 fmol, 3σ) were obtained in the analysis of modelpeptides by MALDI–IM–TOFMS as illustrated inFig. 3(C)

308 J.A. McLean et al. / International Journal of Mass Spectrometry 240 (2005) 301–315
[108]. Owing to the improved beam characteristics and higherrepetition rate operation, this represents nearly a factor of60–80 improvement in sample throughput over low repeti-tion rate MALDI operation. Conceptually, two decades ofhigher sample throughput increases the sample load that canbe analyzed from 100 s to >1000 s per day, which is bet-ter suited for addressing proteomic-scale experiments wherethroughput and sensitivity are the central dogma.
1.3. Qualitative and quantitative utility of conformationspace in ion mobility–mass spectrometry
One of the primary advantages of conformation space inIM–MS is the separation of molecules of different molecu-lar class as illustrated inFig. 2(B). Clearly, very high massmeasurement accuracy is required to assign the peaks ina mass spectrum to specific classes of compounds basedsolely on mass spectral data (Fig. 2(B, iii)). For example,there are no mass resolved signals corresponding to polyhis-tidine ions having S/N ratios greater than 3:1 owing to thelarge background from chemical noise making identificationof the sample constituents impossible by mass spectrome-try alone (at this resolution). In addition to the separation ofdifferent molecular classes, structural information can be ex-tracted from a detailed analysis of the individual trendlines.The spread of ions in conformation space is much differentf ep-t otht hasec nits[ pep-t neart tiona -d ea-s lecu-l ive top para-b gnalsof veds n ofPE encyg
iedd d too .,he ran-d -f ret forca ed toe -
mates a cube-root function (collision cross-section scales asd2 (apparent surface area) and mass scales asd3 (apparentvolume)). Thus, packing efficiency for roughly sphericallyshaped peptide ions increases with increasingm/z, whereassignals associated with helical peptides are predicted to havea linear relationship removed from that of random coil pep-tides by as much as 20% in ATD (over the typical trypticpeptide mass range of 500–3000m/z). Fig. 4(A) contains datafor two peptides LLGNVLVVLAR and LLVVYPWTQRfrom a tryptic digest of hemoglobin. Although both peptidesare nearly of the same mass (1266.61 and 1275.54 Da, re-spectively), they differ by ca. 5% in experimentally deter-mined collision cross-section. Molecular dynamic simula-tions suggest that this difference is commensurate with LL-GNVLVVLAR exhibiting helical structure versus randomcoil for LLVVYPWTQR. Note that in most cases, the de-gree of divergence for helical versus random coil trendlinespredicted by theory is not observed, indicating that the con-formations observed are not “pure”, i.e., that helical trendsmay contain partial helices and that lower trends may containrandom coils that are loosely packed. More detailed experi-ments, involving chemical modification and extensive molec-ular dynamics simulations, suggest that the former hypothesis(involving partial helices) is highly probable in most IM–MSmeasurements[24].
The conformation space of gas-phase peptide ions is alsoi latedp culest jor-i( gestt atest cturetr per-f n ofp ap-p d byn ioni
rseh icalc (i.e.,C -Qh ortert emew ede tionMc ingh ts inI ouldr g ofp eresti
or biopolymers with non-uniform repeat units (e.g., pides, oligonucleotides, lipids, etc.), due to variability in bhe packing efficiency of different repeat units and gas-ponformations relative to polymers with regular repeat u109]. An analysis of a large peptide dataset (>1200ides) shows that most peptide ion signals are clusteredhe center of a trendline, and the edges of the distribure sparsely populated (±1–3 and±10–15% relative stanard deviation (RSD), respectively). Although critical murements have not yet been made, it is likely that moar classes having greater chemical heterogeneity relateptides, e.g., branched carbohydrates, will have comle or greater spread in conformation space. Peptide siccurring at the edges of a trendline (i.e.,±10–15% RSD
rom a best-fit relationship) correspond with: (A) conserecondary structural motifs, (B) intramolecular solvatioTMs, and/or (C) small molecule–peptide ligation (Fig. 4).ach of these modifications in gas-phase packing efficiive rise to increased utilization of conformation space.
For example,�-helices have been extensively studue to the relative stability of peptide helices comparether non-close-packed random coil conformations (e.g�-airpin)[65]. Most gas-phase peptide ions that are�-helicalxhibit a substantially larger collision cross-section thanom coil peptides of the same mass (∼10–20% relative dif
erence in ATD)[25,62]. Molecular modeling techniques aypically utilized to obtain detailed structural informationomparison with measured collision cross-sections (Fig. 4(And B)). Close-packed random coil peptides are predictxhibit a relationship between ATD andm/z that approxi
nfluenced by PTM peptides. For example, phosphoryeptides and peptides covalently attached to small mole
end to pack more tightly per unit mass than the maty of unmodified protonated peptide ions (Fig. 4(B) andC), respectively). Molecular dynamics simulations sughat in the case of phosphorylation, the peptide solvhe phosphate moiety resulting in a more compact struhan observed for non-phosphorylated peptides (Fig. 4(B),ight). These data suggest that IM–MS can be used toorm data-dependent screening for the rapid identificatioost-translational modifications in contrast to MS-onlyroaches where data interpretation can be complicateeutral loss or the limited or non-existent PTM informat
n genomic or proteomic databases.Fig. 4(C) illustrates data for a tryptic digest of ho
eart cytochromec. Signals corresponding to heme radation (616.18 Da) and heme-containing peptidesAQCHTVEK + heme, CAQCHTVEKGGK + heme, IFVKCAQCHTVEK + heme, KIFVQKCAQCHTVEK +eme) are observed at arrival times substantially sh
han unmodified peptides. Covalent attachment of hith CAQCHTVEK and peptides arising from missnzymatic cleavage was confirmed by high-resoluALDI–TOFMS as illustrated inFig. 4(C, right) and
omparison with the theoretical isotope cluster involveme[110]. Such results suggest that future developmen
M–MS technology and conformation space analyses cesult in a general methodology for the rapid screenineptide or protein drug interactions that are of keen int
n pharmaceuticals research.

J.A. McLean et al. / International Journal of Mass Spectrometry 240 (2005) 301–315 309
Fig. 4. Two-dimensional IM–MS plots of conformation space illustrating thre gndeviating (positively or negatively) from the apparent peptide ATD–m/ztrendline for tionalmodifications, and (C) evaluation of peptide-small molecule interactions. (A y stelements (e.g., helical,�-hairpin, etc.). (Left): A tryptic digest of bovine hemoglo sa collision cross-section ca. 5% larger than a protonated peptide of slightly onfor LLGNVLVVLAR versus LLVVYPWTQR is attributed to conserved helical c mined bmolecular dynamics simulations (adapted from Ref.[25]). (B) (left): A proteolytic ngin a negative deviation for the peptide (FQpSEEQQQTEDELQDK, position 4 (B) (right):Molecular dynamics simulation for human angiotensin II with both Tyr phosp VYIHPbottom) illustrating intramolecular solvation of the phosphate group accomp f.A tryptic digest of horse heart cytochromec as a model for peptide–ligand int scovalently attached to14Cys and17Cys. The three higher mass heme-containing products.In all cases, the identification of heme-containing peptides is confirmed by r for Feshown in (C, right).
2. Ion mobility for proteomic applications
High-throughput proteomic studies are generally aimedat protein identification based on peptide mass mapping andsearching against genomic/proteomic databases[2,111,112].
I thata ob-s pec-t alf over-
e situations in which conformation space is populated with signals siificantly(A) determination of secondary structure, (B) screening for post-transla) The increase in ATD deviation is indicative of conserved secondarructuralbin where the protonated peptide LLGNVLVVLAR (Mr = 1266.61 Da) exhibithigher mass (LLVVYPWTQR,Mr = 1275.54 Da). (Right): The positive deviatiharacter in the gas-phase in contrast to typically random coil as deterydigest (tryptic) of bovine�-casein where50Ser is phosphorylated resulti8–60 in the protein, MW = 2062.99 Da) as indicated by a dashed line.horylation (DRVpYIHPF, top) and the non-phosphorylated analog (DRF,anied by a reduction in the collison cross-section (adapted from Re[27]). (C)eractions. The heme porphyrin group (C34H30O4N4Fe, MW = 616.18 Da) i
peptides indicated on the lower trendline are proteolytic miscleavagehigh-resolution MALDI–TOFMS and inspection of the isotope clusteas
nitial IM–MS data for peptide mass mapping indicatesgreater number of proteolytically derived peptides are
erved by using ion mobility separation prior to mass srometry than by MALDI–MS alone[7]. There are severactors that influence the increase in protein sequence c
310 J.A. McLean et al. / International Journal of Mass Spectrometry 240 (2005) 301–315
age, and primary among these is the ability of IM–MS to con-fidently identify low-abundance ion signals in the presence ofchemical and/or instrumental noise. By knowing the trend-line slope and appearance area for peptide ions in IM–MSconformation space, even peptide ions with a S/N < 3 can beconfidently identified and searched against a database for pro-tein identification. Further, there is an apparent decrease inthe suppression of Lys-terminated tryptic digest products rel-ative to standard MALDI–TOF analysis, which is attributedto the combination of high-pressure ionization and IM sep-aration prior to sampling in the TOFMS[7]. Hill and co-workers have recently described the utility of using differentdrift gases to affect the selectivity for peptide ions observedin IM–MS experiments[98]. Complementary to this work,we have observed a larger number of peptide ion signalswhen using nitrogen or methane as a drift gas as comparedto argon or helium separations[40]. In addition, combiningthe peptide signals observed in different drift gases signifi-cantly enhances protein sequence coverage over conventionalMALDI–TOFMS alone[113]. The mechanisms for the ap-parent change in the number of observable peptide ion signalsas a function of drift gas are still unclear and are a topic ofactive research.
In parallel with peptide mass-mapping techniques, tandemmass spectrometry (MS/MS) technology has become an in-dispensable tool for proteome analysis by providing sequencet hanaI ningm ass( .g., byc ni-m ativef sec-o for ac me-v phics , i.e.“ a-t oint,a plish.T e si-m withs ent,e ,I af-t s-sb od fop tan-d per-i tra ina ex-p put,s can-n
Although the ability to perform multiple tandem massspectrometry experiments in parallel is the primary advantageof IM–MS/MS methods, there are other advantageous as-pects of IM–MS/MS that are pertinent to peptide sequencing.Fig. 5(B) shows a typical MALDI–IM–MS/MS experimentutilizing SID for a mixture of the two tryptic peptides shownin Fig. 4(A) (LLGNVLVVVLAR and LLVVYPWTQR).Note the temporal correlation of fragment ions (horizontaltrends in the data) with respect to the parent ions (Fig. 5(B,iii and iv)). The individual fragment ion spectra for each pep-tide can be acquired by integrating across the ATD profile foreach peptide (from 1450 to 1525�s and 1375 to 1440�s for(iii) and (iv), respectively). In this example, the two trypticpeptides are separated by∼9 Da, a mass difference that isdifficult to resolve using available timed-ion selection withstate-of-the-art TOF–TOF instrumentation[117], where themass window for typical proteolytically derived peptides isca. 10 Da. Conversely, these two peptides can be easily sep-arated and fragmented to obtain sequence informative frag-ment ion information using IM–MS/MS due to differencesin gas-phase conformation where [LLGNVLVVVLAR + H]+
is partially helical and [LLVYPWTQR + H]+ is randomcoil in the gas-phase (seeFig. 4(A)); this results in a∼10% difference between the two signals in IM drift time[24,25]. Note that in conformation space, fragmentation datacan also be acquired for multiple conformational forms oft ssi-b aches[
anb e ionsv nsw i)a enti de-c e ioniot -l ita-t nons assrsu a rel-a ativef p-t nu itha thed n“ tlyc p-t 5r tronT
ags for higher-confidence level protein identification tre capable by only peptide mass-mapping strategies[112].
n most cases, MS/MS technology is operated in a scanode, i.e., a mass filter is set to transmit a particular m
or range of masses), the selected ions are activated (eollision-induced dissociation (CID)) and fragment via uolecular decay processes to produce sequence-inform
ragment ions, which are subsequently analyzed by and mass spectrometer. This approach, while effectiveontinuous source of ions, is typically less efficient for a tiarying ion population, e.g., the output of a chromatograeparation, unless a means for stopping the separationpeak parking” is used[114,115]. This scanning configurion is also undesirable from a high-throughput standps each iterative scan takes additional time to accomhe ideal tandem mass spectrometer would allow for thultaneous acquisition of parent ions and fragment ions
patial or temporal correlation, to retain information cont.g., that derived in the separation dimension[116]. Recently
M–MS/MS separations utilizing an ion activation regioner the IM drift cell (e.g., by CID[48], surface induced diociation (SID)[8,47], or photodissociation[49]) followedy mass analysis have been demonstrated as a methroviding a series of temporally correlated and parallelem mass spectrometry experiments. The IM–MS/MS ex
ment is capable of providing several tandem mass specddition to the complete peptide mass map in a singleeriment, thus providing advantages in terms of throughample consumption, and instrumental duty cycle over sing tandem mass spectrometry.
,
r
he same analyte using IM–MS/MS, which is not pole by conventional tandem mass spectrometry appro
29,118].Although a variety of means for post-IM ion activation c
e used, there are several advantages to activating thia a collision with a surface rather than multiple collisioith inert gas molecules[47]. For example, SID provides (narrow velocity distribution of post-dissociation fragm
ons[119], (ii) a relatively high abundance of amino acid sihain cleavage products to unambiguously assign peptidsobars (e.g., Ile versus Leu) similar to high-energy CID[120]r single photon photodissociation[49,121,122], (iii) rela-
ively short dissociation times (<10�s) owing to unimolecuar decay, and (iv) instrumental simplicity. Reported limions of SID include a propensity to form low mass andequence-informative fragment ions and generally low mesolution for SID fragment ion spectra[119]. However, theequencing data shown inFig. 5(B, iii and iv) are sufficient tonambiguously identify both parent species. In general,tively high abundance of high-mass sequence-inform
ragment ions using IM–MS/MS with SID-activated peides is observed[47]. This IM–SID–MS/MS configuratiotilized a linear TOFMS that allowed SID fragments wwide kinetic energy distribution to be sampled in
irection of the TOF analyzer[47]. A second generatioZ-configuration” IM–SID–MS/MS instrument was recenonstructed (Fig. 5(A)) and can routinely provide higher peide mass resolution (∼4000) by positioning the surface 4◦elative to the orthogonal extraction source of a reflecOF and in-line with the primary ion beam[123].

J.A. McLean et al. / International Journal of Mass Spectrometry 240 (2005) 301–315 311
Fig. 5. (A) Schematic diagram of the third-generation MALDI–IM–SID–TOFMS arrangement used in our laboratories for IM–MS/MS determinations. (B):(i) Two-dimensional IM–MS/MS plot of conformation space showing the separation of precursor and corresponding fragment ion spectra of two peptidesfrom bovine hemoglobin (LLGNVLVVVLAR and LLVVTPWTQR, respectively, designated as helical (i) and random coil (ii) inFig. 4A). (ii) The ionmobility ATD integrated over allm/z space. (iii) and (iv) The integrated mass spectra over ATD space corresponding to the correlated fragment ions fromthese two peptides (1375–1440�s (iv) and 1450–1525�s (iii), regions outlined by dashed-lines) are shown with several abundanty- andb-type fragment ionslabeled.
3. The new paradigm for proteomics: emergingavenues for IM–MS
This report illustrates several examples of the unique at-tributes inherent in coupling IM–MS or IM–MS/MS withproteomic applications, for example: (i) rapid 2D separations(�s–ms) in comparison with LC or CE–MS (min–h), (ii) re-duction of chemical noise and ion suppression effects, (iii)fast separation of molecules of different molecular and/orconformational class, and (iv) nearly simultaneous acqui-sition of both parent and fragment ion spectra. Although
IM–MS is not a routine technique for proteomic studies, thissituation will likely change as commercial instrumentationbecomes available. Our group and others are developing in-strumentation to overcome several of the challenges that ex-ist with contemporary instrumental designs. For proteomicapplications, the specific challenge with IM–MS instrumen-tation is sensitivity and consequently throughput. In the sec-tions above, several means are described to assist in alleviat-ing this limitation.
We began development of MALDI–IM–TOFMS[89] af-ter several years of experience in developing high-resolution

312 J.A. McLean et al. / International Journal of Mass Spectrometry 240 (2005) 301–315
Fig. 6. Chart illustrating present and future IM–MS instrument and proteomic applications development efforts in our laboratory and collaboratinginstitutions.
TOFMS instrumentation[12,124]; this venture was moti-vated by the desire to transform data into information andbiochemical understanding. Specific innovations developedin our laboratory and with our collaborators are shown inFig. 6. These advances are generally classified by (i) dif-ferent experimental arrangements, (ii) methodology for en-hancing the figures of merit for existing configurations, (iii)techniques for optimizing the IM–MS experiment, and (iv)the types of information that can be acquired for proteomicstudies. The specific motivation for these advances is to betterfacilitate the rapid dissemination of proteomic data to resolvequestions at the forefront of chemical biology. In this vein,instrumental advances are aimed at providing higher sensi-tivity, faster analysis times, higher information content, andtunable selectivity. Analogous to contemporary advances inTOFMS, both sensitivity and dynamic range can be signif-icantly improved in IM–TOFMS by using multiplex data-acquisition methods[125,126]and position-sensitive detec-tion strategies[105]. By multiplexing ion injection into thedrift cell (MALDI or ESI), throughput can be enhanced byfactors of 102 to 104 and combined with multiplexed TOFMS[127,128]these factors can be increased further to 103 to 106.By utilizing position sensitive detection with IM–TOFMS,dynamic range can be improved from ca. 104 to 105 to po-tentially greater than seven decades. Furthermore, advancesin MALDI are directly transferable to MALDI–IM–TOFMSi
ingM (ca.
15�m) tissue sections[129]. The practical implementationof MALDI imaging-mode MS is illustrated inFig. 7, wherebythe MALDI laser is rastered with respect to the sample in aspatially resolved manner and particularm/z ions are subse-quently interrogated in a matrix format (Fig. 7(A)). However,the challenges associated with characterizing analytes of in-terest become more difficult as the complexity of the sam-ple increases. In particular, the spectra can be further con-gested due to peak overlap by concomitant species of differ-ent molecular class (derived from e.g., salts, detergents, tissuefixing agents, lipids, oligonucleotides, glycoconjugates, etc.).Several of these challenges can be overcome by performingpost-ionization IM–MS and separating the analytes in con-formation space (Fig. 7(B)). A further challenge in imaging-mode MS experiments is the difficulty in performing scan-ning MS/MS analyses for complementary sequence tag infor-mation. This arises because of the limited amount of sample ateach spatial position. By using imaging-mode IM–MS/MS,virtually all of the analytes present can be activated priorto mass analysis (rather than scanning), which provides aFellgett advantage that is well suited to the analysis of lim-ited samples. New dynamic light patterning for MALDI–MSimaging applications will also advance the speed and spatialresolution available in imaging-mode applications, which arereadily interfaced to IM–MS and IM–MS/MS instrumenta-tion [134,135]. Further advances in imaging-mode operationc ons.
con-d
nstrumentation (see for example, Refs.[129–133]).Caprioli and colleagues first described MALDI imag
S for the direct imaging of peptides and proteins in thin
an be obtained by innovations in both, IM or MS dimensiEnhancing separations based on changing the IM
itions such as using reactive background gases[136,137],

J.A. McLean et al. / International Journal of Mass Spectrometry 240 (2005) 301–315 313
Fig. 7. (Left): a conceptual flowchart of contemporary imaging MS. (A) The molecular information gained in a conventional imaging MS experiment in aspatially-resolved manner. (B) Two-dimensional molecular information obtained in conformation space utilizing imaging IM–MS in a matrix format.
mixed gases[40,98], non-linear electric field gradients[103],and altering electric field strengths[54,138], provides a rela-tively non-intrusive means for altering selectivity, separationtime, and ion transmission efficiency. Alternatively, selectivechemical methods for changing the ultimate collision cross-section by using mobility tags, photoaffinity labeling[139],or addition of an affinity mass tag can provide an additionalmeans for selectively identifying biomolecules exhibiting aparticular function or conformation. This is in contrast to MS-only methods, which are typically only sensitive to changesin mass (e.g., isotope tagging or isotope-coded affinity tag-ging [140]) unless additional means are used to first isolateand subsequently probe the reacted products (at the conse-quence of analysis time). Importantly, each of these methodsfor optimizing IM separation conditions is commensuratewith IM–MS/MS methodologies and the use of alternativeion activation techniques such as photodissociation[49] andangle-resolved SID[123].
Parallel to new techniques for proteomic applications, ionmobility also provides a unique means for probing the bio-physical attributes of gas-phase ion structures and confor-mations. Variable temperature IM can provide kinetic andthermodynamic insight into gas-phase protein folding andunfolding processes[50–53]. Moreover, IM–MS provides awell-controlled environment for investigating solvation ef-fects by allowing the stepwise addition of solvent[67]. Fur-t ningd xes,w bi-o evel-o tiona nti-
fication. In IM–MS, this is afforded by structural dimension-ality in conformation space and an ability to perform parallelcorrelated experiments with limited samples. In tandem withinstrumental advances, IM methodology will certainly play asignificant role in the modern proteomics laboratory and of-fers new horizons for addressing proteomic and biophysicalquestions.
Acknowledgements
Financial support for this work was provided by the Na-tional Institutes of Health (1R01 RR01958701), the Na-tional Science Foundation (MRI-0116685), the Departmentof Energy Division of Chemical Sciences, BES (DE-FG03-95ER14505), the Texas Advance Research Program/ Ad-vanced Technology Program (TARP/TDT, 010366-0064-2001), and Ionwerks Inc.
References
[1] R. Aebersold, M. Mann, Nature 422 (2003) 198.[2] W.J. Henzel, C. Watanabe, J.T. Stults, J. Am. Soc. Mass Spectrom.
14 (2003) 931.[3] E.K. Fridriksson, A. Beavil, D. Holowka, H.J. Gould, B. Baird,
Sci.
70
M.
hermore, IM–MS provides a unique means of determiissociation constants of non-covalent protein complehich is of considerable utility in functional and structurallogy. The new paradigm in proteomic research is the dpment of methodology to derive biochemical informand understanding in addition to conventional protein ide
F.W. McLafferty, Biochemistry 39 (2000) 3369.[4] W. Mo, B.L. Karger, Curr. Opin. Chem. Biol. 6 (2002) 666.[5] Ph. Dugourd, R.R. Hudgins, D.E. Clemmer, M.F. Jarrold, Rev.
Inst. 68 (1997) 1122.[6] C. Wu, W.F. Siems, G.R. Asbury, H.H. Hill Jr., Anal. Chem.
(1998) 4929.[7] B.T. Ruotolo, K.J. Gillig, E.G. Stone, D.H. Russell, K. Fuhrer,
Gonin, J.A. Schultz, Int. J. Mass Spectrom. 219 (2002) 253.

314 J.A. McLean et al. / International Journal of Mass Spectrometry 240 (2005) 301–315
[8] E. Stone, K.J. Gillig, B. Ruotolo, K. Fuhrer, M. Gonin, A. Schultz,D.H. Russell, Anal. Chem. 73 (2001) 2233.
[9] C. O’Donovan, R. Apweiler, A. Bairoch, Trends Biotechnol. 19(2001) 178.
[10] R.F. Service, Science 302 (2003) 1316.[11] B.P.Y. Lau, D. Weber, J.J. Ryan, Instrum. Trace Org. Monit. (1992)
155.[12] R.D. Edmondson, D.H. Russell, J. Am. Soc. Mass Spectrom. 7
(1996) 995.[13] R. Bischoff, Anal. Bioanal. Chem. 376 (2003) 289.[14] T. Manabe, J. Chromatogr. B 787 (2003) 29.[15] H. Wang, S. Hanash, J. Chromatogr. B 787 (2003) 11.[16] J.F. Holland, C.G. Enke, J. Allison, J.T. Stults, J.D. Pinkston, B.
Newcome, J.T. Watson, Anal. Chem. 55 (1983) 997A.[17] A.J. Link, J. Eng, D.M. Schieltz, E. Carmack, G.J. Mize, D.R.
Morris, B.M. Garvik, J.R. Yates III, Nat. Biotech. 17 (1999)676.
[18] D.A. Wolters, M.P. Washburn, J.R. Yates III, Anal. Chem. 73(2001) 5683.
[19] E.F. Strittmatter, P.L. Ferguson, K. Tang, R.D. Smith, J. Am. Soc.Mass Spectrom. 14 (2003) 980.
[20] G.F. Verbeck, K.J. Gillig, D.H. Russell, Eur. J. Mass Spectrom. 9(2003) 579.
[21] M. Karas, Separation of Components of an Analysis Sample in anIon Mobility Spectrometer Using a Supply of Selectively InteractiveGaseous Particles, (Int. patent #WO02096805, December 5, 2002).
[22] A.E. Counterman, D.E. Clemmer, Anal. Chem. 74 (2002) 1946.[23] R.R. Hudgins, M.A. Ratner, M.F. Jarrold, J. Am. Chem. Soc. 120
(1998) 12974.[24] B.T. Ruotolo, D.H. Russell, J. Phys. Chem. B 108 (2004) 15321.[25] B.T. Ruotolo, G.F. Verbeck, L.M. Thomson, K.J. Gillig, D.H. Rus-
Soc.
.J.
trom.
ell,.ell,ass
.9.em.
, K..D.
999)
35..
, R.m.
ss
mer,
.
s-ltz,
[45] A.S. Woods, M. Ugarov, T. Egan, J. Koomen, K.J. Gillig, K. Fuhrer,M. Gonin, J.A. Schultz, Anal. Chem. 76 (2004) 2187.
[46] B.T. Ruotolo, K.J. Gillig, D.H. Russell, J. Proteome Res. (2004)submitted for publication.
[47] E.G. Stone, K.J. Gillig, B.T. Ruotolo, D.H. Russell, Int. J. MassSpectrom. 212 (2001) 519.
[48] C.S. Hoaglund-Hyzer, J. Li, D.E. Clemmer, Anal. Chem. 72 (2000)2737.
[49] J.A. McLean, K.J. Gillig, B.T. Ruotolo, M. Ugarov, H. Bensaoula,T. Egan, J.A. Schultz, D.H. Russell, Proceedings of the 51st Con-ference of the American Society for Mass Spectrometry, Montreal,Canada, 2003.
[50] T. Wyttenbach, M.T. Bowers, Top. Curr. Chem. 225 (2003) 207.[51] P.R. Kemper, M.T. Bowers, J. Am. Soc. Mass Spectrom. 1 (1990)
197.[52] T. Wyttenbach, P.R. Kemper, M.T. Bowers, Int. J. Mass Spectrom.
212 (2001) 13.[53] B.S. Kinnear, M.R. Hartings, M.F. Jarrold, J. Am. Chem. Soc. 123
(2001) 5660.[54] G.F. Verbeck, B.T. Ruotolo, K.J. Gillig, D.H. Russell, J. Am. Soc.
Mass Spectrom. 15 (2004) 1320.[55] M.F. Jarrold, Annu. Rev. Phys. Chem. 51 (2000) 179.[56] T. Wyttenbach, E.S. Baker, S.L. Bernstein, A. Ferzoco, J. Gidden,
D. Liu, M.T. Bowers, in: A.E. Ashcroft, G. Breton, J.J. Monaghan(Eds.), Advances in Mass Spectrometry, vol. 16, Elsevier, Amster-dam, 2004, p. 189, Chapter 11.
[57] S.L. Bernstein, D. Liu, T. Wyttenbach, M.T. Bowers, J.C. Lee, H.B.Gray, J.R. Winkler, J. Am. Soc. Mass Spectrom. 15 (2004) 1435.
[58] T. Ideker, T. Galitski, L. Hood, Annu. Rev. Genom. Hum. Gen. 2(2001) 343.
[59] G. von Helden, T. Wyttenbach, M.T. Bowers, Science 267 (1995)
494..124
4.6.740.em.
997)
Soc.
120
00)
48.126
117
313.m.
558.hys.
em.
m. A
sell, J. Am. Chem. Soc. 124 (2002) 4214.[26] T. Wyttenbach, G. von Helden, M.T. Bowers, J. Am. Chem.
118 (1996) 8355.[27] B.T. Ruotolo, G.F. Verbeck, L.M. Thomson, A.S. Woods, K
Gillig, D.H. Russell, J. Proteome Res. 1 (2002) 303.[28] B.T. Ruotolo, C.C. Tate, D.H. Russell, J. Am. Soc. Mass Spec
15 (2004) 870.[29] H.A. Sawyer, J.T. Marini, B.T. Ruotolo, K.J. Gillig, D.H. Russ
J. Am. Soc. Mass Spectrom. (2004) submitted for publication[30] A.S. Woods, J.M. Koomen, B.T. Ruotolo, K.J. Gillig, D.H. Russ
K. Fuhrer, M. Gonin, T.F. Egan, J.A. Schultz, J. Am. Soc. MSpectrom. 13 (2002) 166.
[31] D.T. Kaleta, M.F. Jarrold, J. Phys. Chem. A 106 (2002) 9655[32] D.T. Kaleta, M.F. Jarrold, J. Phys. Chem. B 107 (2003) 1452[33] D. Liu, T. Wyttenbach, C.J. Carpenter, M.T. Bowers, J. Am. Ch
Soc. 126 (2004) 3261.[34] Y. Shen, R. Zhao, M.E. Belov, T.P. Conrads, G.A. Anderson
Tang, L. Pasa-Tolic, T.D. Veenstra, M.S. Lipton, H.R. Udseth, RSmith, Anal. Chem. 73 (2001) 1766.
[35] J.E. MacNair, K.D. Patel, J.W. Jorgenson, Anal. Chem. 71 (1700.
[36] A. Grall, C. Leonard, R. Sacks, Anal. Chem. 72 (2000) 591.[37] J.M. Hille, A.L. Freed, H. Watzig, Electrophoresis 22 (2001) 40[38] A.W. Moore Jr., J.W. Jorgenson, Anal. Chem. 67 (1995) 3448[39] Y. Shen, N. Tolic, R. Zhao, L. Pasa-Tolic, L. Li, S.J. Berger
Harkewicz, G.A. Anderson, M.E. Belov, R.D. Smith, Anal. Che73 (2001) 3011.
[40] B.T. Ruotolo, J.A. McLean, K.J. Gillig, D.H. Russell, J. MaSpectrom. 39 (2004) 361.
[41] S.J. Valentine, M. Kulchania, C.A. Srebalus Barnes, D.E. ClemInt. J. Mass Spectrom. 212 (2001) 97.
[42] A.W. Moore Jr., J.W. Jorgenson, Anal. Chem. 67 (1995) 3456[43] J.C. Giddings, Anal. Chem. 56 (1984) 1258A.[44] J.M. Koomen, B.T. Ruotolo, K.J. Gillig, J.A. McLean, D.H. Ru
sell, M. Kang, K.R. Dunbar, K. Fuhrer, M. Gonin, J.A. SchuAnal. Bioanal. Chem. 373 (2002) 612.
1483.[60] R.R. Hudgins, M.F. Jarrold, J. Am. Chem. Soc. 121 (1999) 3[61] D.T. Kaleta, M.F. Jarrold, J. Phys. Chem. B 105 (2001) 4436[62] B.S. Kinnear, M.R. Hartings, M.F. Jarrold, J. Am. Chem. Soc.
(2002) 4422.[63] D.T. Kaleta, M.F. Jarrold, J. Am. Chem. Soc. 124 (2002) 115[64] D.T. Kaleta, M.F. Jarrold, J. Am. Chem. Soc. 125 (2003) 718[65] G.A. Breaux, M.F. Jarrold, J. Am. Chem. Soc. 125 (2003) 10[66] R. Sudha, M. Kohtani, G.A. Breaux, M.F. Jarrold, J. Am. Ch
Soc. 126 (2004) 2777.[67] J. Woenckhaus, Y. Mao, M.F. Jarrold, J. Phys. Chem. B 101 (1
847.[68] J. Woenckhaus, R.R. Hudgins, M.F. Jarrold, J. Am. Chem.
119 (1997) 9586.[69] J.L. Fye, J. Woenckhaus, M.F. Jarrold, J. Am. Chem. Soc.
(1998) 1327.[70] M.F. Jarrold, Acc. Chem. Res. 32 (1999) 360.[71] Y. Mao, M.A. Ratner, M.F. Jarrold, J. Am. Chem. Soc. 122 (20
2950.[72] M. Kohtani, M.F. Jarrold, J. Am. Chem. Soc. 124 (2002) 111[73] M. Kohtani, G.A. Breaux, M.F. Jarrold, J. Am. Chem. Soc.
(2004) 1206.[74] D.E. Clemmer, R.R. Hudgins, M.F. Jarrold, J. Am. Chem. Soc.
(1995) 10141.[75] K.B. Shelimov, M.F. Jarrold, J. Am. Chem. Soc. 118 (1996) 10[76] K.B. Shelimov, D.E. Clemmer, R.R. Hudgins, M.F. Jarrold, J. A
Chem. Soc. 119 (1997) 2240.[77] S.J. Valentine, D.E. Clemmer, J. Am. Chem. Soc. 119 (1997) 3[78] S.J. Valentine, J. Anderson, A.E. Ellington, D.E. Clemmer, J. P
Chem. B 101 (1997) 3891.[79] E.R. Badman, C.S. Hoaglund-Hyzer, D.E. Clemmer, Anal. Ch
73 (2001) 6000.[80] S. Myung, E. Badman, Y.J. Lee, D.E. Clemmer, J. Phys. Che
106 (2002) 9976.[81] S.B. Prusiner, Annu. Rev. Med. 38 (1987) 381.[82] S.B. Prusiner, M.R. Scott, Annu. Rev. Genet. 31 (1997) 139.

J.A. McLean et al. / International Journal of Mass Spectrometry 240 (2005) 301–315 315
[83] J. Collinge, Annu. Rev. Neurosci. 24 (2001) 519.[84] C.J. Barrow, M.G. Zagorski, Science 253 (1991) 179.[85] K. Tanaka, H. Waki, Y. Ido, S. Akita, Y. Yoshida, T. Yohida, Rapid
Commun. Mass Spectrom. 2 (1988) 151.[86] M. Karas, F. Hillenkamp, Anal. Chem. 60 (1988) 2299.[87] J.B. Fenn, M. Mann, C.K. Meng, S.F. Wong, C.M. Whitehouse,
Science 246 (1989) 64.[88] G. von Helden, T. Wyttenbach, M.T. Bowers, Int. J. Mass Spectrom.
Ion Proc. 146–147 (1995) 349.[89] K.J. Gillig, B.T. Ruotolo, E.G. Stone, D.H. Russell, K. Fuhrer, M.
Gonin, J.A. Schultz, Anal. Chem. 72 (2000) 3965.[90] W.E. Steiner, B.H. Clowers, W.A. English, H.H. Hill Jr., Rap. Com-
mun. Mass Spectrom. 18 (2004) 882.[91] G. von Helden, M.-T. Hsu, P.R. Kemper, M.T. Bowers, J. Chem.
Phys. 95 (1991) 3835.[92] D.E. Clemmer, M.F. Jarrold, J. Mass Spectrom. 32 (1997) 577.[93] E.A. Mason, E.W. McDaniel, Transport Properties of Ions in Gases,
John Wiley and Sons, New York, 1988, p. 31, Chapter 2.[94] C.B. Shumate, H.H. Hill Jr., Anal. Chem. 61 (1989) 601.[95] C.S. Hoaglund-Hyzer, Y.J. Lee, A.E. Counterman, D.E. Clemmer,
Anal. Chem. 74 (2002) 992.[96] S. Rokushika, H. Hatano, M.A. Baim, H.H. Hill Jr., Anal. Chem.
57 (1985) 1902.[97] P. Watts, A. Wilder, Int. J. Mass Spectrom. Ion Proc. 112 (1992)
179.[98] G.R. Ashbury, H.H. Hill Jr., Anal. Chem. 72 (2000) 580.[99] C.E. Berry, Rev. Sci. Instrum. 27 (1956) 849.
[100] A. Graber, P.S. Juhasz, N. Khainovski, K.C. Parker, D.H. Patterson,S.A. Martin, Proteomics 4 (2004) 474.
[101] J.A. Loo, Int. J. Mass Spectrom. 200 (2000) 175.[102] R.L. Winston, M.C. Fitzgerald, Mass Spectrom. Rev. 16 (1997)
ass
andiety,
.ro-
ass
. 69
03)
ogr.
263.C.
ngsille,
m.
[115] B. Gallis, G.L. Corthals, D.R. Goodlett, H. Ueba, F. Kim, S.R.Presnell, D. Figeys, D.G. Harrison, B.C. Berk, R. Aebersold, M.A.Corson, J. Bio. Chem. (1999) 30101.
[116] F.W. McLafferty (Ed.), Tandem Mass Spectrometry, Plenum Press,New York, 1983.
[117] K.F. Medzihradszky, J.F. Campbell, M.A. Baldwin, A.M. Falick,P. Juhasz, M.L. Vestal, A.L. Burlingame, Anal. Chem. 72 (2000)552.
[118] E.R. Badman, C.S. Hoaglund-Hyzer, D.E. Clemmer, J. Am. Soc.Mass Spectrom. 13 (2002) 719.
[119] V. Grill, J. Shen, C. Evans, R.G. Cooks, Rev. Sci. Inst. 72 (2001)3149.
[120] R.S. Johnson, S.A. Martin, K. Biemann, Int. J. Mass Spectrom.Ion Proc. 86 (1988) 137.
[121] M.E. Gimon-Kinsel, G.R. Kinsel, R.D. Edmondson, D.H. Russell,J. Am. Soc. Mass Spectrom. 6 (1995) 578.
[122] D.C. Barbacci, D.H. Russell, J. Am. Soc. Mass Spectrom. 10(1999) 1038.
[123] W. Sun, K.J. Gillig, D.H. Russell, Proceedings of the 52nd Con-ference of the American Society for Mass Spectrometry, Nashville,TN, 2004.
[124] D.C. Barbacci, R.D. Edmonson, D.H. Russell, Int. J. Mass Spec-trom. 165–166 (1997) 221.
[125] J.A. McLean, D.H. Russell, T.F. Egan, M.V. Ugarov, J.A. Schultz,Multiplex Data Acquisition Modes for Ion Mobility–Mass Spec-trometry (US Prov. Patent Filed July 27, 2004).
[126] J.A. McLean, D.H. Russell, Int. J. Ion Mobility Spectrom. (2004)in press.
[127] F.J. Knorr, M. Ajami, D.A. Chatfield, Anal. Chem. 58 (1986) 690.[128] A. Brock, N. Rodriguez, R.N. Zare, Anal. Chem. 70 (1998) 3735.[129] R.M. Caprioli, T.B. Farmer, J. Gile, Anal. Chem. 69 (1997)
.-is 19
2
rat,ods,
rnedtent
theome-
,
.
oc.
107
ber-
165.[103] K.J. Gillig, B.T. Ruotolo, E.G. Stone, D.H. Russell, Int. J. M
Spectrom. 239 (2004) 43.[104] R.J. Cotter, Time-of-Flight Mass Spectrometry: Instrumentation
Applications in Biological Research, American Chemical SocWashington, DC, 1997.
[105] K. Fuhrer, M. Gonin, M.I. McCully, T. Egan, S.R. Ulrich, V.WVaughn, W.D. Burton, J.A. Schultz, K. Gillig, D.H. Russell, Pceedings of the 49th Conference of the American Society for MSpectrometry, Chicago, IL, 2001.
[106] C.S. Hoaglund, S.J. Valentine, D.E. Clemmer, Anal. Chem(1997) 4156.
[107] J.A. McLean, W.K. Russell, D.H. Russell, Anal. Chem. 75 (20648.
[108] J.A. McLean, D.H. Russell, J. Proteome Res. 2 (2003) 427.[109] B.T. Ruotolo, K.J. Gillig, E.G. Stone, D.H. Russell, J. Chromat
B 782 (2002) 385.[110] D.H. Russell, R.D. Edmondson, J. Mass Spectrom. 32 (1997)[111] W.J. Henzel, T.M. Billeci, J.T. Stults, S.C. Wong, C. Grimley,
Watanabe, Proc. Natl. Acad. Sci. U.S.A. 90 (1993) 5011.[112] J.R. Yates III, Electrophoresis 19 (1998) 893.[113] J.A. McLean, B.T. Ruotolo, K.J. Gillig, D.H. Russell, Proceedi
of the 2002 Lost Pines Molecular Biology Conference, SmithvTX, 2002.
[114] R.E. Moore, L. Licklider, D. Schumann, T.D. Lee, Anal. Che70 (1998) 4879.
4751.[130] M. Traini, A.A. Gooley, K. Ou, M.R. Wilkins, L. Tonella, J
C. Sanchez, D.F. Hochstrasser, K.L. Williams, Electrophores(1998) 1941.
[131] J. Wei, J.M. Buriak, G. Siuzdak, Nature 399 (1999) 243.[132] V.V. Laiko, M.A. Baldwin, A.L. Burlingame, Anal. Chem. 7
(2000) 652.[133] A. Novikov, M. Caroff, S. Della-Negra, Y. Lebeyec, M. Paut
J.A. Schultz, A. Tempez, H.-W.J. Wang, S.N. Jackson, A.S. WoAnal. Chem. (2004) in press.
[134] J.A. McLean, D.H. Russell, Advanced Optics for Rapidly PatteLaser Profiles in Analytical Mass Spectrometry (US Prov. Pafiled February 12, 2004).
[135] S.D. Sherrod, J.A. McLean, D.H. Russell, Proceedings of52nd Conference of the American Society for Mass Spectrtry, Nashville, TN, 2004.
[136] G.W. Griffin, I. Dzidic, D.I. Carroll, R.N. Stillwell, E.C. HorningAnal. Chem. 45 (1973) 1204.
[137] D.I. Carroll, I. Dzidic, R.N. Stillwell, E.C. Horning, Anal. Chem47 (1975) 1956.
[138] B.T. Ruotolo, J.A. McLean, K.J. Gillig, D.H. Russell, J. Am. SMass Spectrom., 2004, submitted for publication.
[139] R.E. Bossio, R.R. Hudgins, A.G. Marshall, J. Phys. Chem. B(2003) 3284.
[140] S.P. Gygi, B. Rist, S.A. Gerber, F. Turecek, M.H. Gelb, R. Aesold, Nat. Biotech. 17 (1999) 994.