ion induced beam disruption mechanism - cerncern.ch/clic-meeting/2003/03_21cv.pdf ·...
TRANSCRIPT

21 march 2003CEA/DAM/DCRE/SREF/LEER – C. Vermare 1
Ion Induced Beam disruption Mechanism
C. VermareCEA, Polygone d’Expérimentation de Moronvilliers, France
H. Davis, D.C. Moir, R. OlsonLos Alamos National Laboratory, NM, USA
T. HughesMission Research Corporation, Albuquerque, NM, USA
DARHT / AIRIX projects:
Linear Induction Accelerator for Flash X-rays Radiography
Flash X-rays source500 rad@1m, 2 mm
single pulse electron beam2-4 kA, 20 MeV, 60 ns High Z material target
multiple pulse electron beam2-4 kA, 20 MeV, 2000 ns Active component of the transport
The ion creation process is the focus of this study:
- evaluation of the primary current density threshold
- evaluation of the starting time

21 march 2003CEA/DAM/DCRE/SREF/LEER – C. Vermare 2
Ion Induced Beam disruption MechanismSpatial view:
Electronbeam Ez target Positive ions
accelerated
Er Er
current current
Vz x BθVz x Bθ
Intense (kA) electron beam (few MeV)Time line:
Longitudinal electric field near the foil
ebeam disruptiontime
positive ions creation
ions propagation

21 march 2003CEA/DAM/DCRE/SREF/LEER – C. Vermare 3
Time sequence before beam disruption
The number of positive ions needed to disrupt the primary electron beam is very small
~ 1/200 of a mono-layer
ION LIBERATION PROCESS
Electron impact induced desorption of ions and neutrals
- Thermal desorption of impurities from the surface when the temperature reaches 400°C [Stanford(1989)] and ionization.
- Melting (or sublimation for carbon) followed by ionization[Kwan(2000)]
Emission of H+, H2+,
CnHm+, H2O+, CO+, OH+,
etc…
Sensitive to target material
IONS PROPAGATION inside the beam
- analytic models [Welch(1998), Chen(1998), Vermare(1999)]
- PIC code (LSP…)
EXPERIMENTAL DELAY = LIBERATION + PROPAGATION
21 march 2003CEA/DAM/DCRE/SREF/LEER – C. Vermare 4
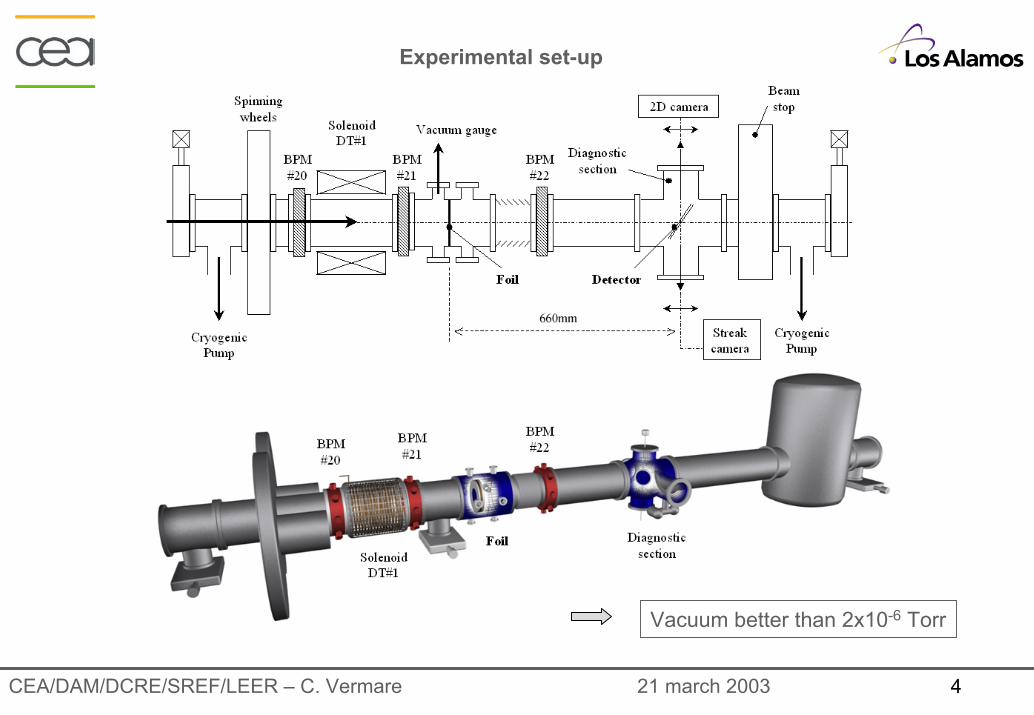
Experimental set-up
Vacuum better than 2x10⁻⁶ Torr
21 march 2003CEA/DAM/DCRE/SREF/LEER – C. Vermare 5
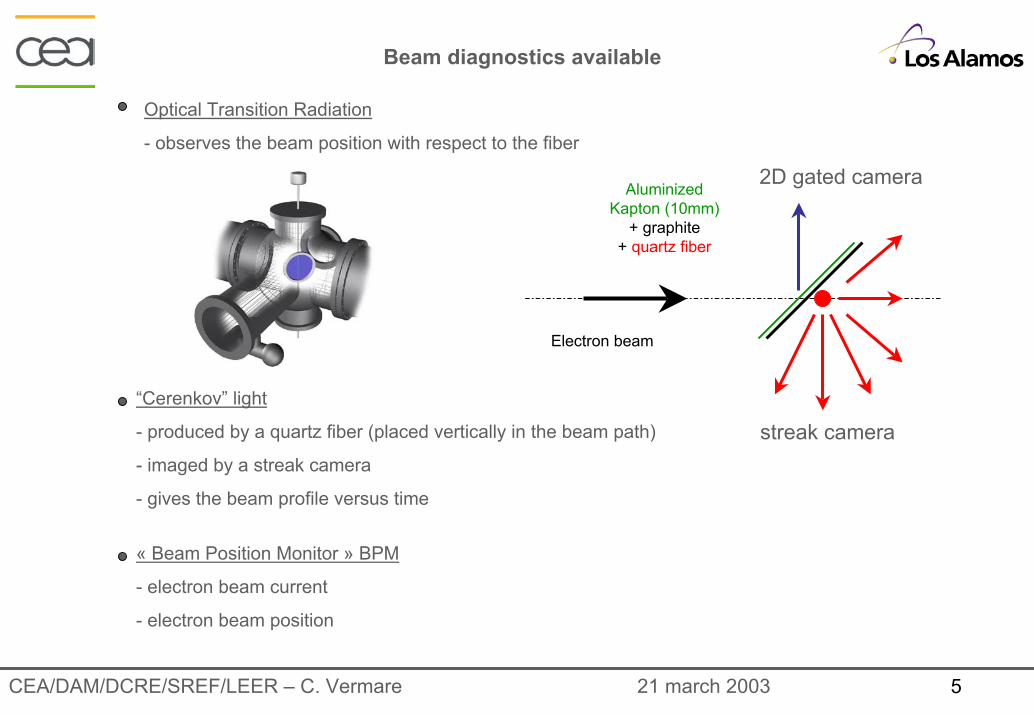
Beam diagnostics available
Optical Transition Radiation
- observes the beam position with respect to the fiber
2D gated cameraAluminizedKapton (10mm)
+ graphite+ quartz fiber
Electron beam
“Cerenkov” light
- produced by a quartz fiber (placed vertically in the beam path)
- imaged by a streak camera
- gives the beam profile versus time
streak camera
« Beam Position Monitor » BPM
- electron beam current
- electron beam position
21 march 2003CEA/DAM/DCRE/SREF/LEER – C. Vermare 6
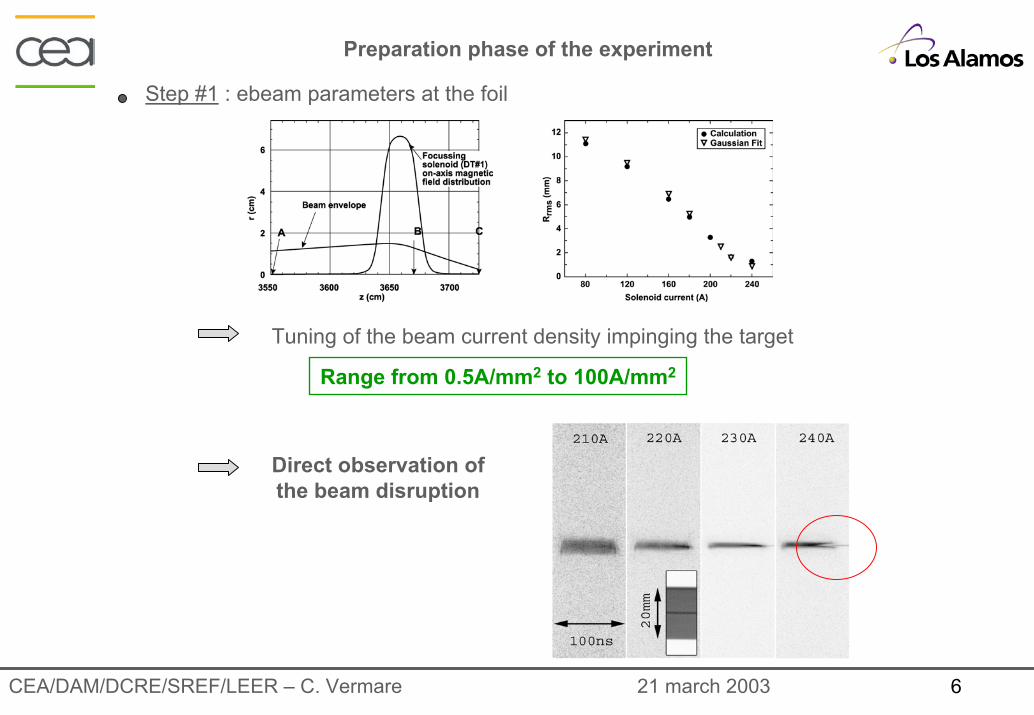
Preparation phase of the experiment
Step #1 : ebeam parameters at the foil
Tuning of the beam current density impinging the target
Range from 0.5A/mm2 to 100A/mm2
Direct observation ofthe beam disruption

21 march 2003CEA/DAM/DCRE/SREF/LEER – C. Vermare 7
Preparation phase of the experiment
Step #2 : temperature rise of the target surface – Thermal imaging (Dave Simmons and Mark Wilke, LANL)
Image IntensityBlack body

21 march 2003CEA/DAM/DCRE/SREF/LEER – C. Vermare 8
Example of Beam disruption results
Constant parts: - consistent with the scattering / electrostatic effects
Variations versus time: - clear effects starting sooner with higher beam current densities- delays to reach the melting are not consistent with the experiment- delays to reach 400°C are compatible- growing oscillation after beam expansion
21 march 2003CEA/DAM/DCRE/SREF/LEER – C. Vermare 9
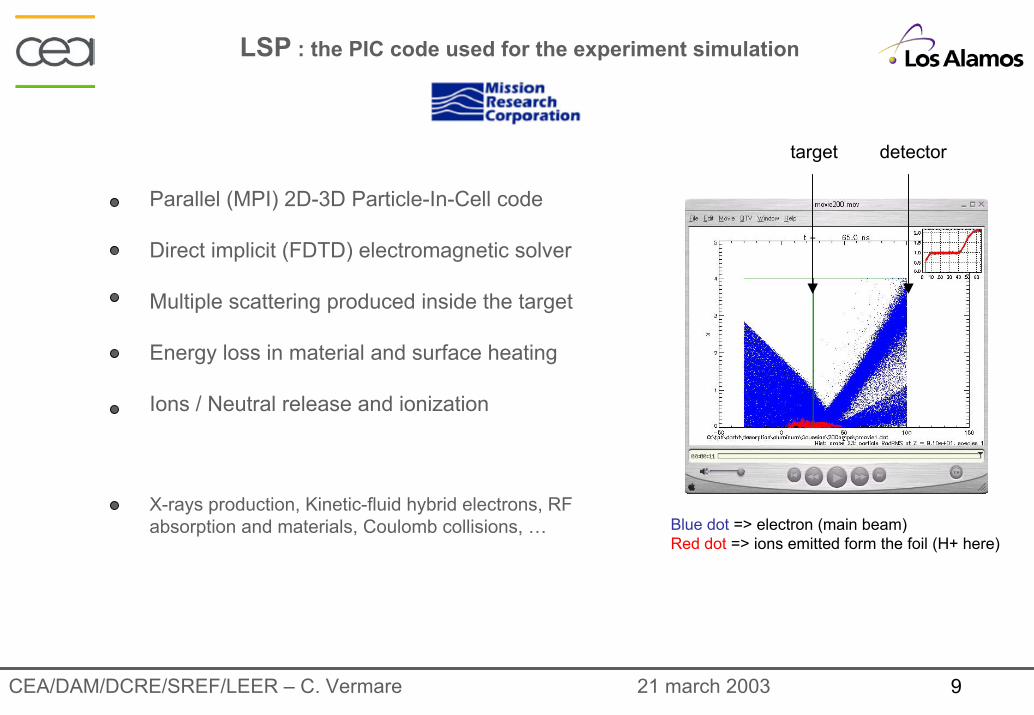
LSP : the PIC code used for the experiment simulation
Blue dot => electron (main beam)Red dot => ions emitted form the foil (H+ here)
target detector
Parallel (MPI) 2D-3D Particle-In-Cell code
Direct implicit (FDTD) electromagnetic solver
Multiple scattering produced inside the target
Energy loss in material and surface heating
Ions / Neutral release and ionization
X-rays production, Kinetic-fluid hybrid electrons, RF absorption and materials, Coulomb collisions, …

21 march 2003CEA/DAM/DCRE/SREF/LEER – C. Vermare 10
Comparison Experiment - Simulation
DT#1 = 180A DT#1 = 200A DT#1 = 220A
Space charge limited emission of positive ions from cracked water (H+, H2O+, HO+, O+)
From cracking/ionization cross section @20 MeV (9% of H+)
40% of the ion current is due to the H+

21 march 2003CEA/DAM/DCRE/SREF/LEER – C. Vermare 11
Difference between plain surface and 90% open meshes
Scattering effect smaller with the meshesNo significant difference in the time dependenceEnough ions available for space-charge limited current with a surface 10 times reduced

21 march 2003CEA/DAM/DCRE/SREF/LEER – C. Vermare 12
Late transverse oscillations of the beam
0 10 20 30 40 50 60 70 80 90 100
-2
0
2
4
6
8 BPM#22 X BPM#22 Y Streak camera Y
cent
roid
mot
ion
(mm
)
time (ns)
Frequency = 125 +/- 10 MHzAmplitude = 6 ±3 mm peak-to-peak
Consistent results from the BPM (electric) and the streak (optical)
Agrees with PIC simulation with H+ ! Frequency = 140 MHzAmplitude = 2 mm peak-to-peak
21 march 2003CEA/DAM/DCRE/SREF/LEER – C. Vermare 13
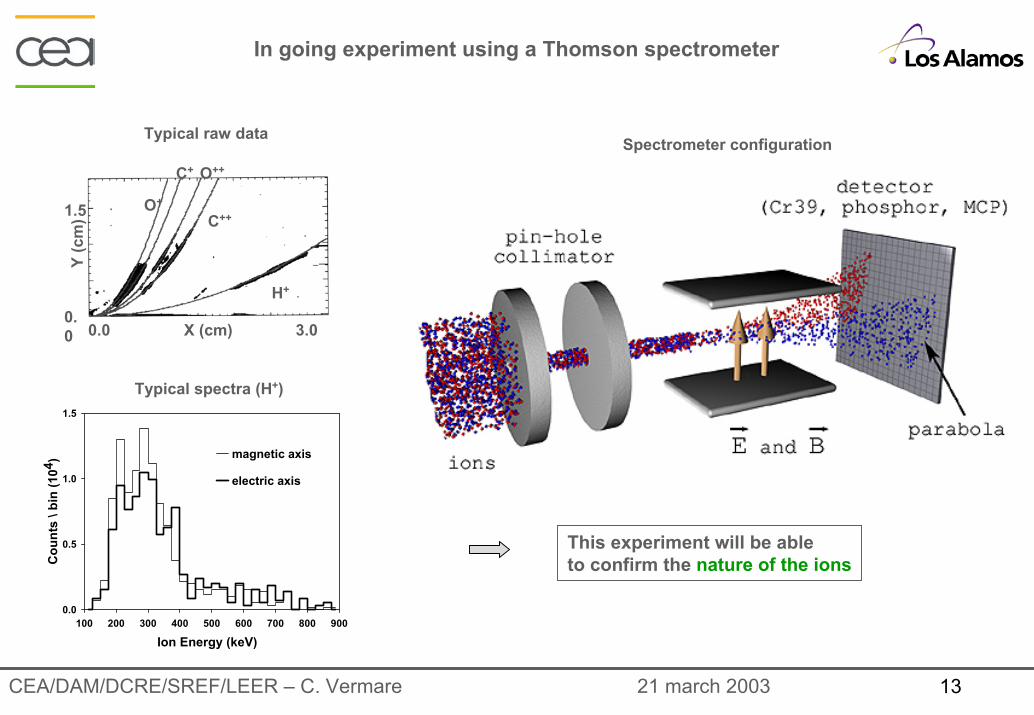
In going experiment using a Thomson spectrometer
Typical raw data Spectrometer configuration
H+
C++O+
O++C+
X (cm)
Y (c
m)
0.00.0 3.0
1.5
Typical spectra (H+)
Ion Energy (keV)100 200 300 400 500 600 700 800 900
Cou
nts
\ bin
(104
)
0.0
0.5
1.0
1.5
magnetic axis
electric axis
This experiment will be ableto confirm the nature of the ions

21 march 2003CEA/DAM/DCRE/SREF/LEER – C. Vermare 14
Conclusion
The experiment set-up using the two foils techniques is well adapted
- large effect on the beam dynamic
- time-resolved beam size measurement
Simulations using LSP reproduced the observation made on the beam dynamic
- the radial profile behavior is comparable
- the transverse oscillation is confirmed
Information on the ion creation process:
- the melting temperature doesn’t need to be reached !
- the induced neutral desorption and following ionization exist
- but only a thermal threshold can explain the abrupt change !
- Cracked water molecule seems to be the main source of ions
- Presence of a significant part of H+