ioc market summary april 2011
DESCRIPTION
IOC Market Summary April 2011TRANSCRIPT
MARKET NEWSLETTER No 49 – April 2011
Source: International Olive Council page 1
Provisional figures for 2010/11: crop year performance
a) Olive oil production
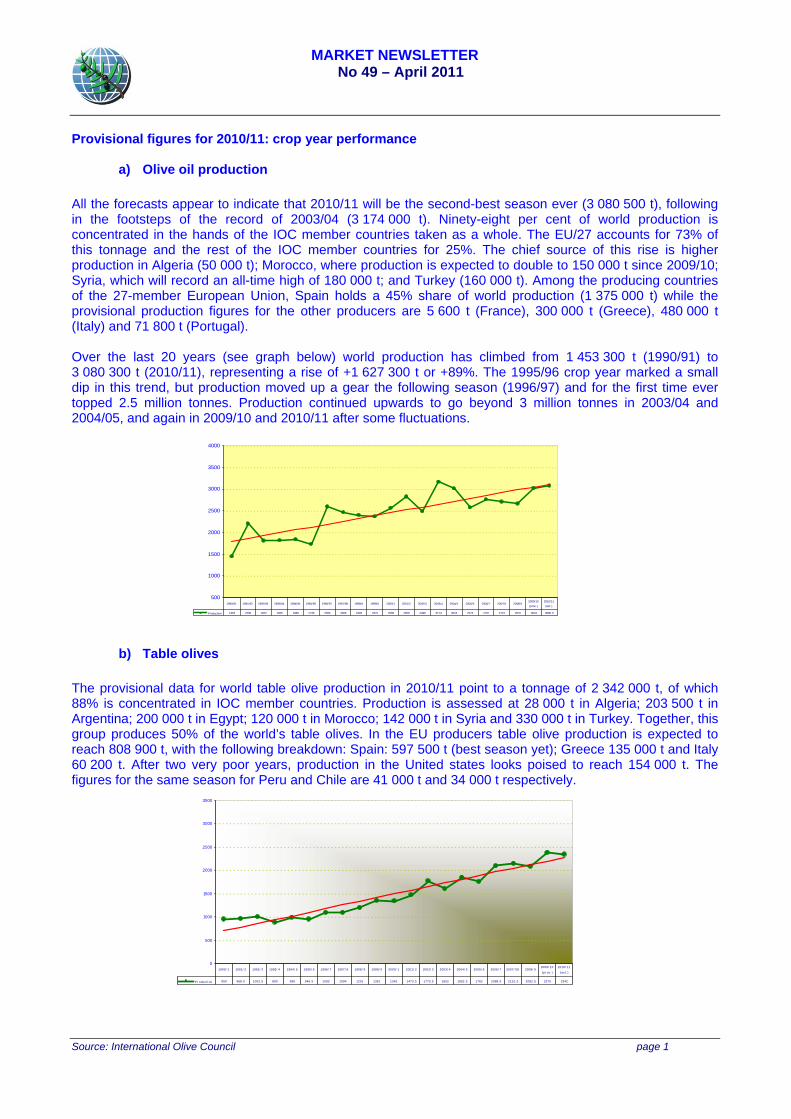
All the forecasts appear to indicate that 2010/11 will be the second-best season ever (3 080 500 t), following in the footsteps of the record of 2003/04 (3 174 000 t). Ninety-eight per cent of world production is concentrated in the hands of the IOC member countries taken as a whole. The EU/27 accounts for 73% of this tonnage and the rest of the IOC member countries for 25%. The chief source of this rise is higher production in Algeria (50 000 t); Morocco, where production is expected to double to 150 000 t since 2009/10; Syria, which will record an all-time high of 180 000 t; and Turkey (160 000 t). Among the producing countries of the 27-member European Union, Spain holds a 45% share of world production (1 375 000 t) while the provisional production figures for the other producers are 5 600 t (France), 300 000 t (Greece), 480 000 t (Italy) and 71 800 t (Portugal). Over the last 20 years (see graph below) world production has climbed from 1 453 300 t (1990/91) to 3 080 300 t (2010/11), representing a rise of +1 627 300 t or +89%. The 1995/96 crop year marked a small dip in this trend, but production moved up a gear the following season (1996/97) and for the first time ever topped 2.5 million tonnes. Production continued upwards to go beyond 3 million tonnes in 2003/04 and 2004/05, and again in 2009/10 and 2010/11 after some fluctuations.
b) Table olives The provisional data for world table olive production in 2010/11 point to a tonnage of 2 342 000 t, of which 88% is concentrated in IOC member countries. Production is assessed at 28 000 t in Algeria; 203 500 t in Argentina; 200 000 t in Egypt; 120 000 t in Morocco; 142 000 t in Syria and 330 000 t in Turkey. Together, this group produces 50% of the world’s table olives. In the EU producers table olive production is expected to reach 808 900 t, with the following breakdown: Spain: 597 500 t (best season yet); Greece 135 000 t and Italy 60 200 t. After two very poor years, production in the United states looks poised to reach 154 000 t. The figures for the same season for Peru and Chile are 41 000 t and 34 000 t respectively.
500
1000
1500
2000
2500
3000
3500
4000
Production 1453 2206 1812 1825 1846 1736 2595 2466 2403 2375 2566 2826 2496 3174 3013 2573 2767 2713 2670 3024 3080.3
1990/91 1991/92 1992/93 1993/94 1994/95 1995/96 1996/97 1997/98 1998/9 1999/0 2000/1 2001/2 2002/3 2003/4 2004/5 2005/6 2006/7 2007/8 2008/92009/10 (prov.)
2010/11 (est.)
0
500
1000
1500
2000
2500
3000
3500
Pr oduct i on 950 968.5 1002. 5 890 990 946.5 1093 1094 1201 1351 1343 1473.5 1773.5 1602 1852.5 1762 2088.5 2151. 5 2082.5 2375 2342
1990/ 1 1991/ 2 1992/ 3 1993/ 4 1994/ 5 1995/ 6 1996/ 7 1997/ 8 1998/ 9 1999/ 0 2000/ 1 2001/ 2 2002/ 3 2003/ 4 2004/ 5 2005/ 6 2006/ 7 2007/ 08 2008/ 92009/ 10
(pr ov. )
2010/ 11
(est . )

MARKET NEWSLETTER No 49 – April 2011
Source: International Olive Council page 2
Between 1990/91 and 2010/11 world production of table olives has soared from 850 000 t to 2 342 000 t, reflecting growth of +1 392 000 t or +147%. In the last decade it has experienced growth of 77% compared with the preceding ten-year period.
1. INTERNATIONAL TRADE: 2010/11 OPENS WITH +17% IN FIRST THREE MONTHS OF SEASON
In the first three months of 2010/11 aggregate imports by the six countries listed in the next table climbed by (60 045.6), up 17% compared with the same period the season before. Over the first five cumulative months of the season (October–February), imports increased into Australia (+2%), Brazil (+21%) Canada (+16%) and the USA (+9%) while they decreased by -6% into Japan from November onwards. EU data were not available for January and February at the time of publishing this newsletter, but the figures for the first three months of the crop year show a big increase (22%) compared with the season before.
MOVEMENTS IN PRODUCER PRICES Graphs 1 and 3 track the weekly movements in the producer prices paid for extra virgin olive oil and refined olive oil in the top EU producing countries. The monthly price movements for the same two grades of oil and refined olive-pomace oils are shown in Graphs 2, 4 and 5 respectively. Extra virgin olive oil: Comparison with the same period of the year before reveals that current prices have dropped by 5% in Spain (€2.01/kg) and 5% in Greece (€1.94/kg) while in Italy they moved in the opposite direction, going up by 44% to €3.90/kg – Graph 1. Recent weeks have seen a steep rise in prices in Italy, contrasting with a small drop in Greece and stability in Spain. This tends to confirm the growing distance between the prices paid to producers in Italy and those paid in Spain and Greece. Although data are not available on the volumes of product sold at these prices in Italy, what these prices do show is that buyers looking to buy in Italy have to pay more for the product than in Spain or Greece.
Graph 1

Source: Interna
Refi
(to €levecontrecothe ssma
ational Olive Cou
Graph 2
ned olive oil€1.76/kg) in ls. No data tinued througovery appearsummer. Co
all (€0.15/kg)
Graph 3
uncil
: The same Spain and are availabl
gh to mid-Ders to have beompared with, showing tha
MARKENo
comparison have droppee for Greec
ecember, sineen lost althoh extra virginat the produc
ET NEWSL49 – April
for refined oed by -1% (€e. The very
nce when theough there han olive oil, thct is position
LETTER 2011
olive oil show€1.91/kg) in mild price r
e trend seemave continue
he gap in priced at quite a
ws that priceItaly (Graph
recovery thams to have reed to be minoces between
a similar leve
pa
es have increh 3) from se
at began in Aeversed. Theor price fluctun Italy and Sl in both mar
age 3
eased by 1%eason-beforeAugust 2010e bulk of thisuations since
Spain is quiterkets.
% e 0 s e e

MARKET NEWSLETTER No 49 – April 2011
Source: International Olive Council page 4
Graph 4
Graph 5