investors’ call presentation full year 2016 … · investors’ call presentation full year 2016...
TRANSCRIPT

INVESTORS’ CALL PRESENTATION
FULL YEAR 2016 AND
Q1 2017 RESULTS
POSITIONED FOR RECOVERY
AND GROWTH
2
This presentation contains or incorporates by reference
‘forward-looking statements’ regarding the belief or current
expectations of Diamond Bank, the Directors and other
members of its senior management about the Group’s
businesses and the transactions described in this presentation.
Generally, words such as ‘‘could’’, ‘‘will’’, ‘‘expect’’, ‘‘intend’’,
‘‘anticipate’’, ‘‘believe’’, ‘‘plan’’, ‘‘seek’’ or similar expressions
identify forward-looking statements.
These forward-looking statements are not guarantees of future
performance. Rather, they are based on current views and
assumptions and involve known and unknown risks,
uncertainties and other factors, many of which are outside the
control of the Company and/or its Group and are difficult to
predict, that may cause actual results to differ materially from
any future results or developments expressed or implied from
the forward-looking statements. Such risks and uncertainties
include, but are not limited to, regulatory developments,
competitive conditions, technological developments and
general economic conditions. The Bank assumes no
responsibility to update any of the forward looking statements
contained in this presentation.
Any forward-looking statement contained in this presentation
based on past or current trends and/or activities of Diamond
Bank should not be taken as a representation that such trends
or activities will continue in the future. No statement in this
presentation is intended to be a profit forecast or to imply that
the earnings of the Company for the current year or future
years will necessarily match or exceed the historical or
published earnings of the Company. Each forward-looking
statement speaks only as of the date of the particular
statement. Diamond Bank expressly disclaims any obligation
or undertaking to release publicly any updates or revisions to
any forward-looking statements contained herein to reflect any
change in Diamond Bank’s expectations with regard thereto or
any change in events, conditions or circumstances on which
any such statement is based.
3
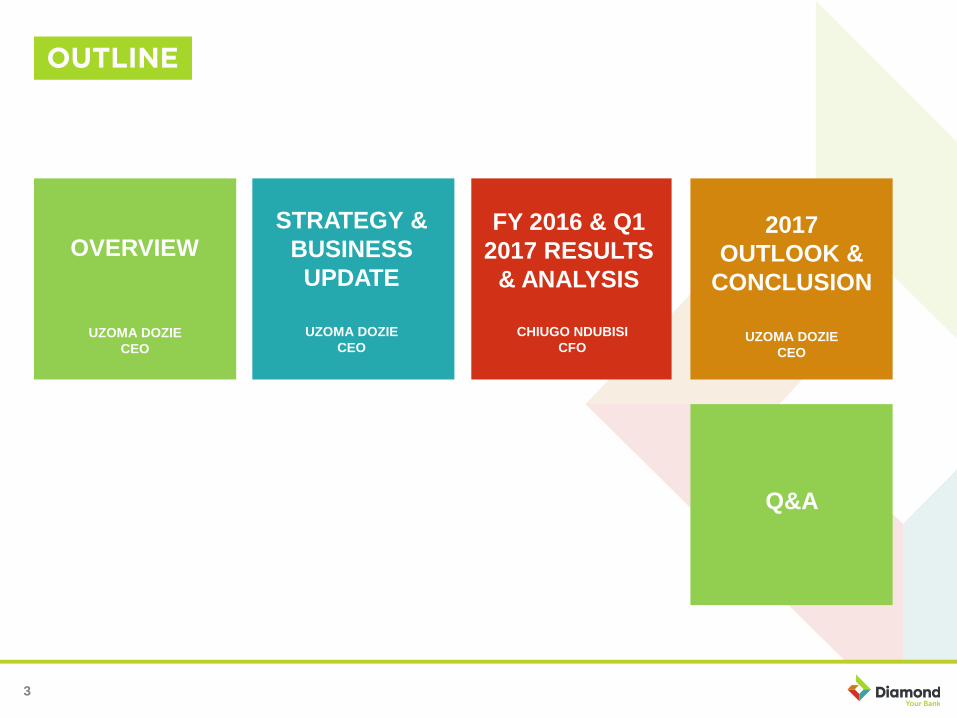
OVERVIEW
UZOMA DOZIE
CEO
STRATEGY &
BUSINESS
UPDATE
UZOMA DOZIE
CEO
FY 2016 & Q1
2017 RESULTS
& ANALYSIS
CHIUGO NDUBISI
CFO
2017
OUTLOOK &
CONCLUSION
UZOMA DOZIE
CEO
Q&A

5
Key strengths:
- Technology and innovation to provide beyond banking lifestyle
solutions for customers.
- Leading digital transformation in response to changing
consumer lifestyles.
- New and existing partnerships with third parties to broaden
access to financial services
- Setting new governance benchmarks.
Key partnerships:
MTN – Diamond Y’ello
WWB – BETA Banking
USAID – Mediloan
Countries where
we operate (number of
branches)
Nigeria (277), West Africa (47), UK (1)
Total Assets N2.0 trillion
Total Equity N226.7 billion
ATMs/POS 1,054/15,092
Ratings S&P: B-; Fitch: BB+; GCR: BBB+
Group Head Count 3,557
Market Capitalization* N20.4bn
Listing
Nigerian Stock Exchange (2005)
Ticker (Bloomberg) – DIAMONDBNK:NL
London Stock Exchange (2008)
Ticker (Bloomberg) – DBPA:LI
Auditors KPMG Professional Services
IFC – MSME Banking
Interswitch – Payments
Visa – Debit & Credit Cards
Gates Foundation – Financial
inclusion
17.75%
9.25%
4.95%
6.10%61.95%
Share Holding (%)
Carlyle Kunoch Mr and Mrs. Dozie Diamond Partners Free Float
* Bank, As at December 31, 2016
6
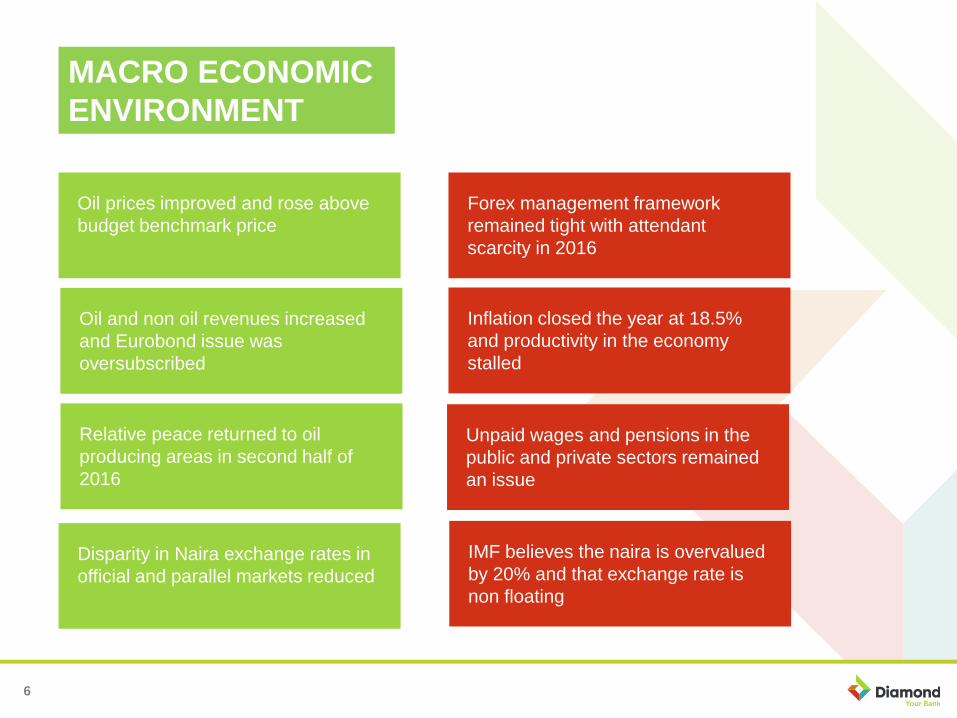
Oil prices improved and rose above
budget benchmark price
Oil and non oil revenues increased
and Eurobond issue was
oversubscribed
Relative peace returned to oil
producing areas in second half of
2016
Forex management framework
remained tight with attendant
scarcity in 2016
Inflation closed the year at 18.5%
and productivity in the economy
stalled
Unpaid wages and pensions in the
public and private sectors remained
an issue
IMF believes the naira is overvalued
by 20% and that exchange rate is
non floating
Disparity in Naira exchange rates in
official and parallel markets reduced
MACRO ECONOMIC
ENVIRONMENT
7
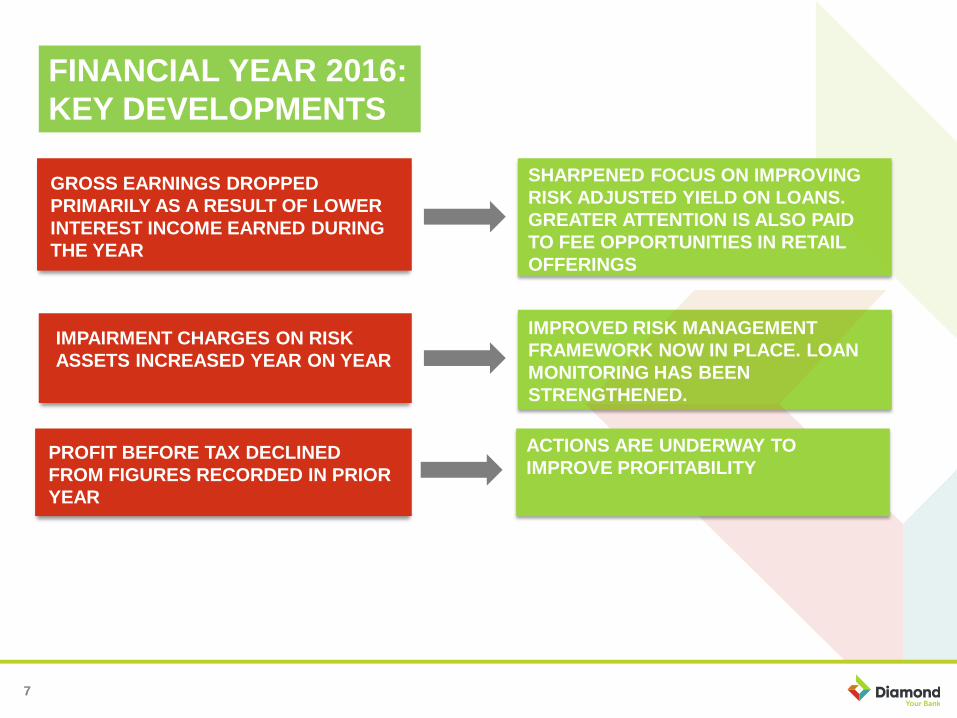
GROSS EARNINGS DROPPED
PRIMARILY AS A RESULT OF LOWER
INTEREST INCOME EARNED DURING
THE YEAR
SHARPENED FOCUS ON IMPROVING
RISK ADJUSTED YIELD ON LOANS.
GREATER ATTENTION IS ALSO PAID
TO FEE OPPORTUNITIES IN RETAIL
OFFERINGS
IMPAIRMENT CHARGES ON RISK
ASSETS INCREASED YEAR ON YEAR
IMPROVED RISK MANAGEMENT
FRAMEWORK NOW IN PLACE. LOAN
MONITORING HAS BEEN
STRENGTHENED.
FINANCIAL YEAR 2016:
KEY DEVELOPMENTS
PROFIT BEFORE TAX DECLINED
FROM FIGURES RECORDED IN PRIOR
YEAR
ACTIONS ARE UNDERWAY TO
IMPROVE PROFITABILITY
8
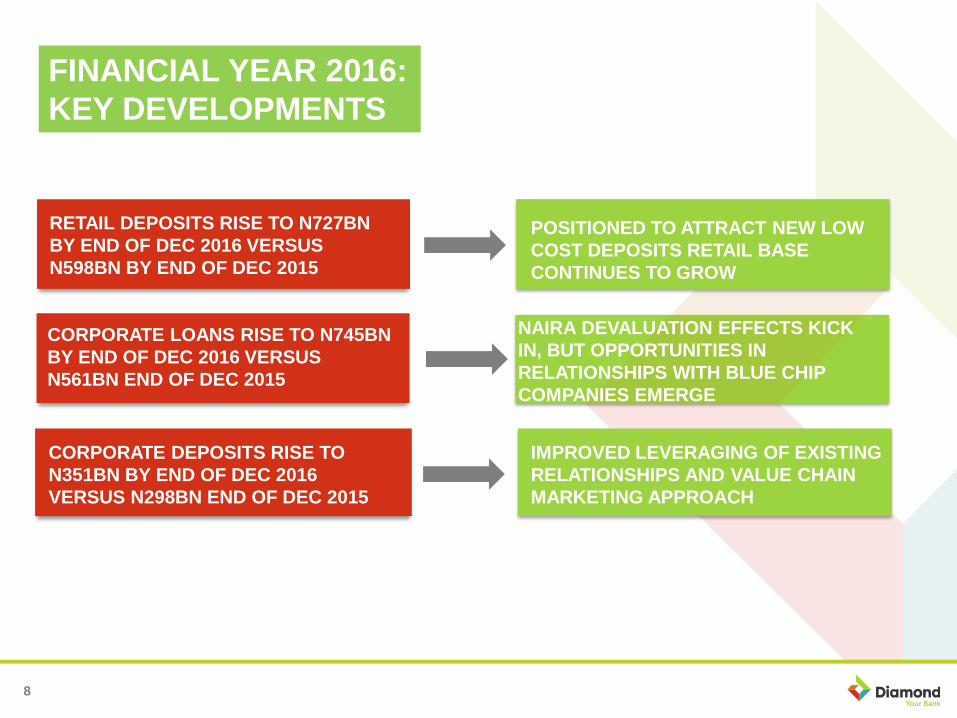
CORPORATE LOANS RISE TO N745BN
BY END OF DEC 2016 VERSUS
N561BN END OF DEC 2015
NAIRA DEVALUATION EFFECTS KICK
IN, BUT OPPORTUNITIES IN
RELATIONSHIPS WITH BLUE CHIP
COMPANIES EMERGE
FINANCIAL YEAR 2016:
KEY DEVELOPMENTS
CORPORATE DEPOSITS RISE TO
N351BN BY END OF DEC 2016
VERSUS N298BN END OF DEC 2015
IMPROVED LEVERAGING OF EXISTING
RELATIONSHIPS AND VALUE CHAIN
MARKETING APPROACH
RETAIL DEPOSITS RISE TO N727BN
BY END OF DEC 2016 VERSUS
N598BN BY END OF DEC 2015
POSITIONED TO ATTRACT NEW LOW
COST DEPOSITS RETAIL BASE
CONTINUES TO GROW
9
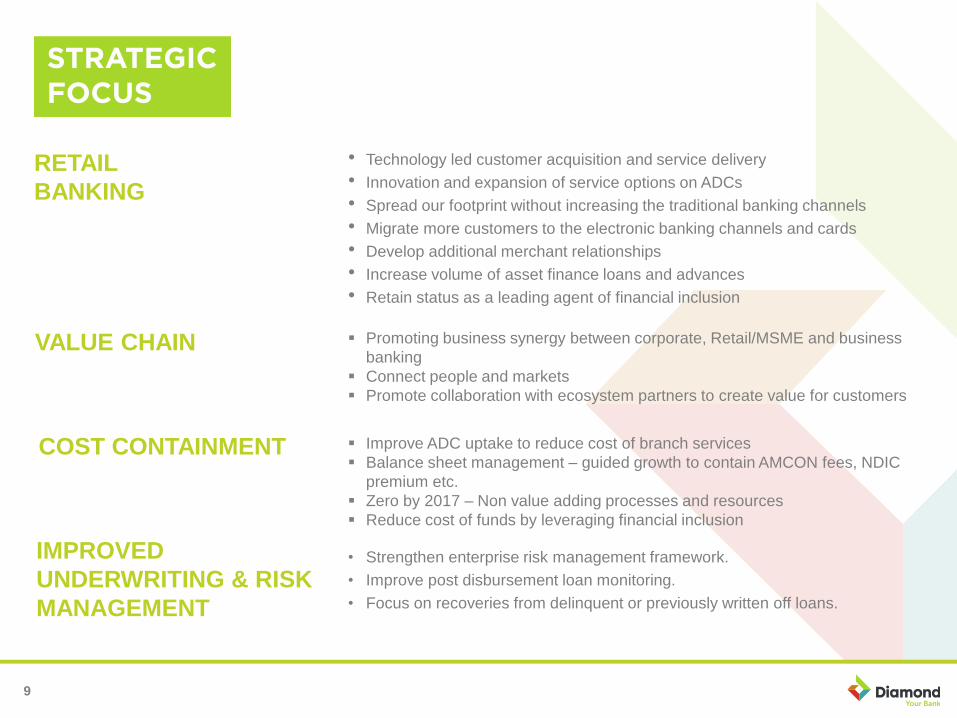
RETAIL
BANKING
• Technology led customer acquisition and service delivery
• Innovation and expansion of service options on ADCs
• Spread our footprint without increasing the traditional banking channels
• Migrate more customers to the electronic banking channels and cards
• Develop additional merchant relationships
• Increase volume of asset finance loans and advances
• Retain status as a leading agent of financial inclusion
VALUE CHAIN Promoting business synergy between corporate, Retail/MSME and business
banking
Connect people and markets
Promote collaboration with ecosystem partners to create value for customers
COST CONTAINMENT Improve ADC uptake to reduce cost of branch services
Balance sheet management – guided growth to contain AMCON fees, NDIC
premium etc.
Zero by 2017 – Non value adding processes and resources
Reduce cost of funds by leveraging financial inclusion
IMPROVED
UNDERWRITING & RISK
MANAGEMENT
• Strengthen enterprise risk management framework.
• Improve post disbursement loan monitoring.
• Focus on recoveries from delinquent or previously written off loans.
STRATEGY AND
BUSINESS UPDATEUZOMA DOZIE, CEO
11
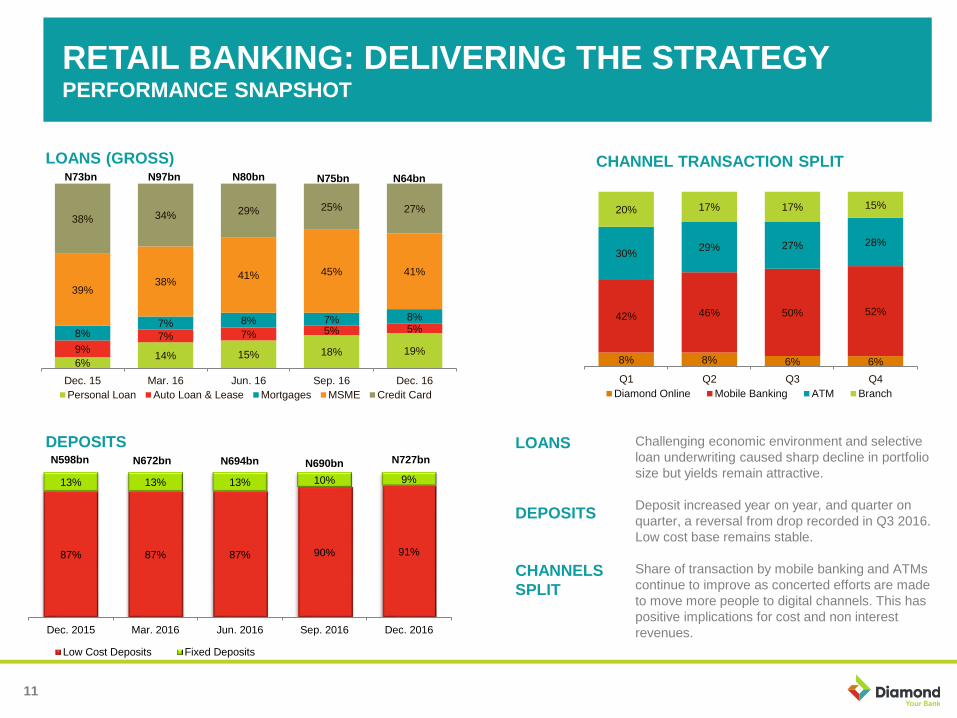
LOANS
DEPOSITS
CHANNELS
SPLIT
Challenging economic environment and selective
loan underwriting caused sharp decline in portfolio
size but yields remain attractive.
Deposit increased year on year, and quarter on
quarter, a reversal from drop recorded in Q3 2016.
Low cost base remains stable.
Share of transaction by mobile banking and ATMs
continue to improve as concerted efforts are made
to move more people to digital channels. This has
positive implications for cost and non interest
revenues.
LOANS (GROSS)
DEPOSITS
8% 8% 6% 6%
42% 46% 50% 52%
30%29% 27% 28%
20% 17% 17% 15%
Q1 Q2 Q3 Q4
Diamond Online Mobile Banking ATM Branch
CHANNEL TRANSACTION SPLIT
RETAIL BANKING: DELIVERING THE STRATEGYPERFORMANCE SNAPSHOT
6%14% 15% 18% 19%9%
7% 7% 5% 5%8%7% 8% 7% 8%
39%38%
41% 45% 41%
38% 34% 29% 25% 27%
Dec. 15 Mar. 16 Jun. 16 Sep. 16 Dec. 16
Personal Loan Auto Loan & Lease Mortgages MSME Credit Card
N73bn N80bnN97bn N75bn N64bn
87% 87% 87% 90% 91%
13% 13% 13% 10% 9%
Dec. 2015 Mar. 2016 Jun. 2016 Sep. 2016 Dec. 2016
Low Cost Deposits Fixed Deposits
N598bn N672bn N694bn N690bn N727bn
12
5,282,912
6,303,532
Dec. 2015 Dec. 2016
6,436,349
8,601,345
Dec. 2015 Dec. 2016
154,240
285,000
Dec. 2015 Dec. 2016
24,745
36,106
Dec. 2015 Dec. 2016
5,342,898
6,642,584
Dec. 2015 Dec. 2016
FINANCIAL INCLUSION
CUSTOMERS
MSME
CUSTOMERS
OTHER RETAIL
CUSTOMERS
AGENT
NETWORKNO. OF DEBIT & CREDIT CARDS
IN ISSUE
ATM
STATISTCS
Number of Active ATMs – 1,054
ATM transaction count – 58 m
ATM income earned – N1,050m
FUTURE
FOCUS
Access new people and connect
markets;
Increase channel footprint;
Improve fees and income by
encouraging more transactions
on ADCs;
Expand service offerings on our
e-payment solutions;
Drive financial inclusion; attract
first time bank account owners.
FASTEST GROWING RETAIL
BANK IN NIGERIA
13
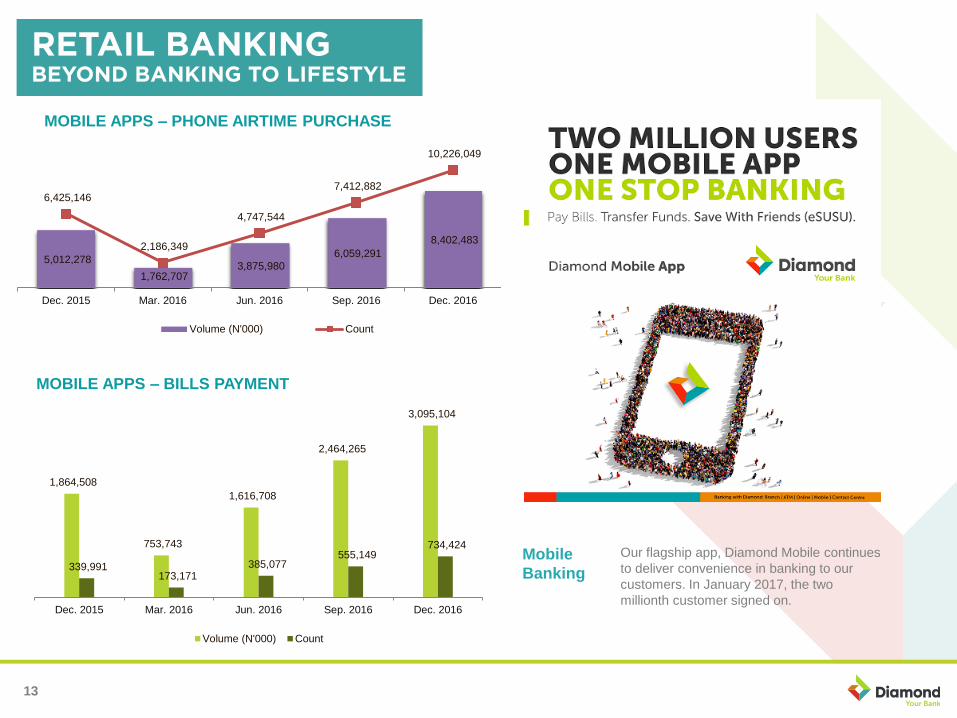
MOBILE APPS – PHONE AIRTIME PURCHASE
MOBILE APPS – BILLS PAYMENT
Our flagship app, Diamond Mobile continues
to deliver convenience in banking to our
customers. In January 2017, the two
millionth customer signed on.
Mobile
Banking
5,012,278
1,762,707 3,875,980
6,059,291
8,402,483
6,425,146
2,186,349
4,747,544
7,412,882
10,226,049
Dec. 2015 Mar. 2016 Jun. 2016 Sep. 2016 Dec. 2016
Volume (N'000) Count
1,864,508
753,743
1,616,708
2,464,265
3,095,104
339,991 173,171
385,077 555,149
734,424
Dec. 2015 Mar. 2016 Jun. 2016 Sep. 2016 Dec. 2016
Volume (N'000) Count
14
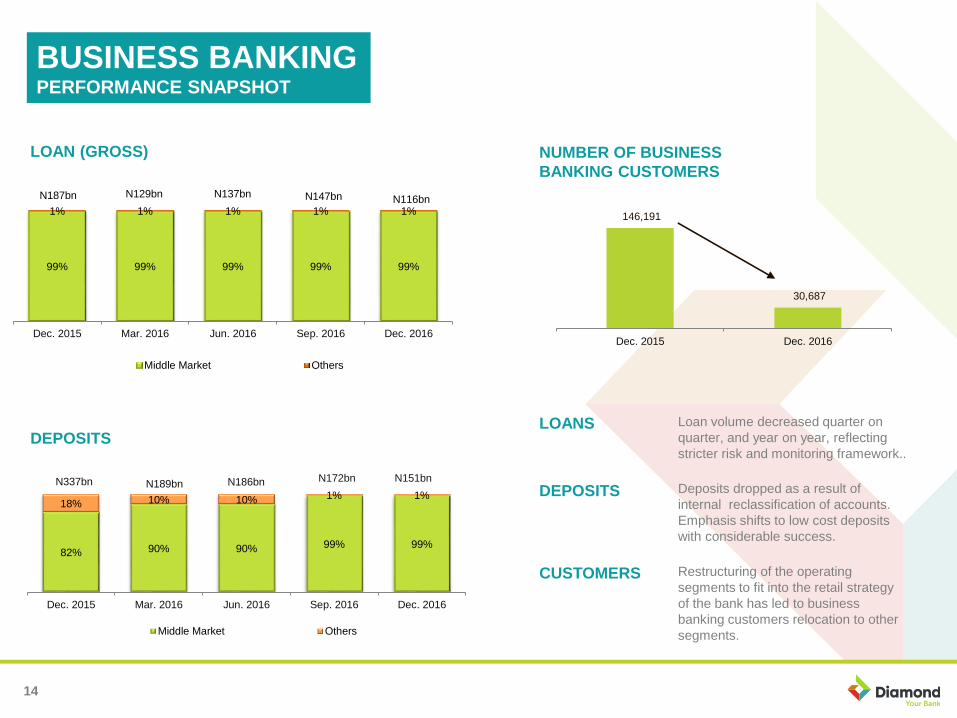
146,191
30,687
Dec. 2015 Dec. 2016
LOAN (GROSS)
DEPOSITS
NUMBER OF BUSINESS
BANKING CUSTOMERS
LOANS Loan volume decreased quarter on
quarter, and year on year, reflecting
stricter risk and monitoring framework..
DEPOSITS Deposits dropped as a result of
internal reclassification of accounts.
Emphasis shifts to low cost deposits
with considerable success.
CUSTOMERS Restructuring of the operating
segments to fit into the retail strategy
of the bank has led to business
banking customers relocation to other
segments.
BUSINESS BANKINGPERFORMANCE SNAPSHOT
99% 99% 99% 99% 99%
1% 1% 1% 1% 1%
Dec. 2015 Mar. 2016 Jun. 2016 Sep. 2016 Dec. 2016
Middle Market Others
N147bnN187bn N137bnN129bnN116bn
82% 90% 90% 99% 99%
18% 10% 10% 1% 1%
Dec. 2015 Mar. 2016 Jun. 2016 Sep. 2016 Dec. 2016
Middle Market Others
N172bnN337bn N186bnN189bnN151bn
15
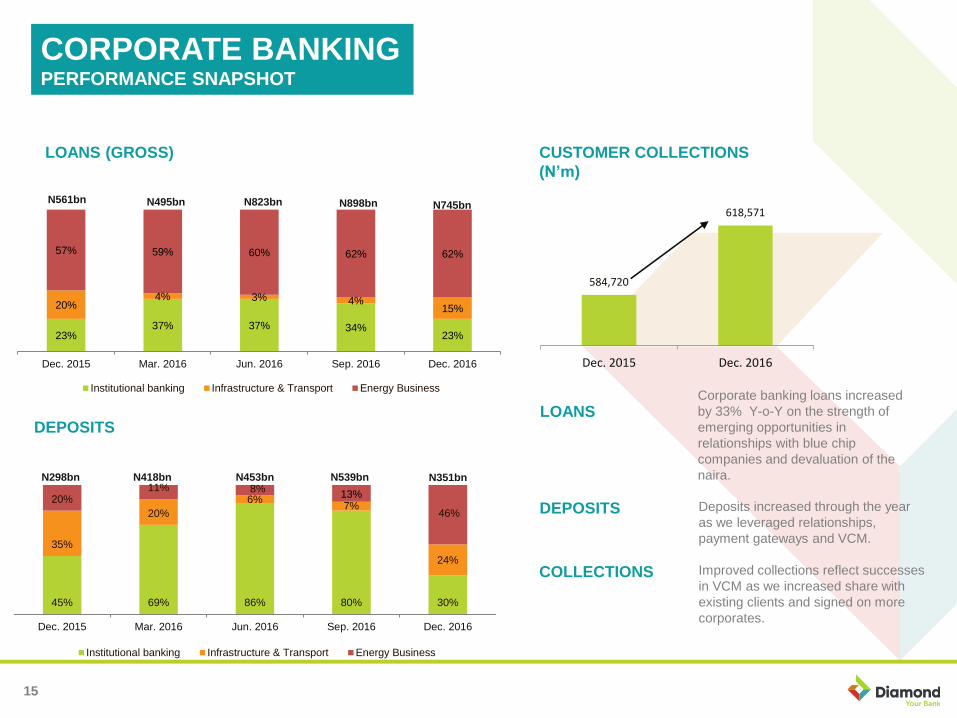
LOANS (GROSS)
DEPOSITS
CUSTOMER COLLECTIONS
(N’m)
LOANSCorporate banking loans increased
by 33% Y-o-Y on the strength of
emerging opportunities in
relationships with blue chip
companies and devaluation of the
naira.
DEPOSITS Deposits increased through the year
as we leveraged relationships,
payment gateways and VCM.
COLLECTIONS Improved collections reflect successes
in VCM as we increased share with
existing clients and signed on more
corporates.
CORPORATE BANKINGPERFORMANCE SNAPSHOT
584,720
618,571
Dec. 2015 Dec. 2016
23%37% 37% 34%
23%
20%4% 3% 4%
15%
57% 59% 60% 62% 62%
Dec. 2015 Mar. 2016 Jun. 2016 Sep. 2016 Dec. 2016
Institutional banking Infrastructure & Transport Energy Business
N561bn N823bnN495bn N898bn N745bn
45% 69% 86% 80% 30%
35%
20%
6%7%
24%
20%11% 8%
13%
46%
Dec. 2015 Mar. 2016 Jun. 2016 Sep. 2016 Dec. 2016
Institutional banking Infrastructure & Transport Energy Business
N298bn N453bnN418bn N539bn N351bn
FY 2016 RESULTS
& ANALYSISCHIUGO NDUBISI, CFO
17
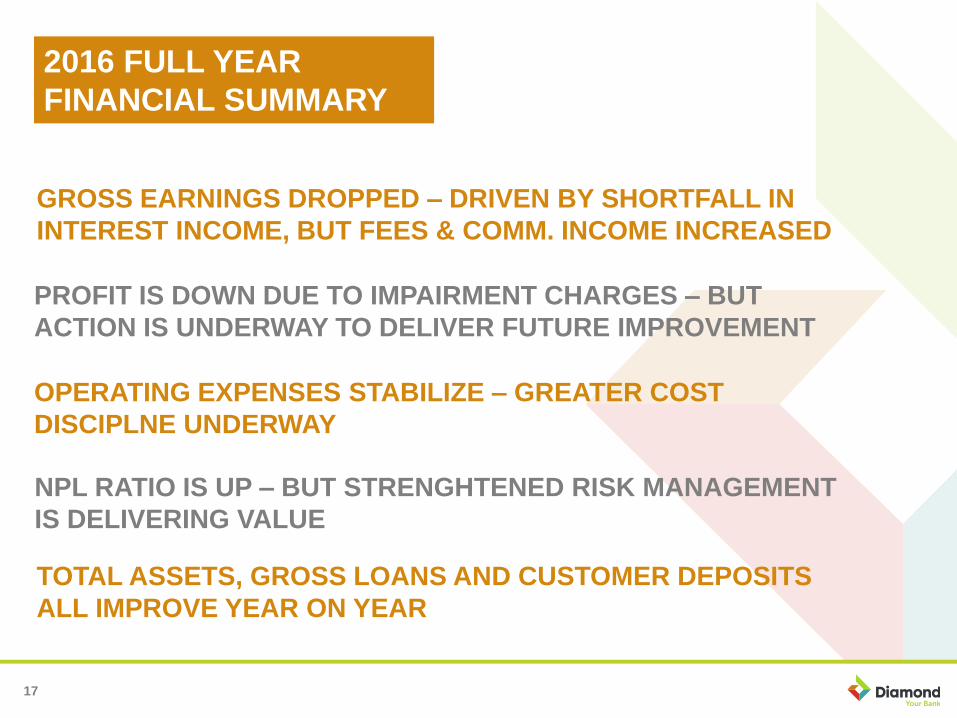
GROSS EARNINGS DROPPED – DRIVEN BY SHORTFALL IN
INTEREST INCOME, BUT FEES & COMM. INCOME INCREASED
PROFIT IS DOWN DUE TO IMPAIRMENT CHARGES – BUT
ACTION IS UNDERWAY TO DELIVER FUTURE IMPROVEMENT
OPERATING EXPENSES STABILIZE – GREATER COST
DISCIPLNE UNDERWAY
2016 FULL YEAR
FINANCIAL SUMMARY
NPL RATIO IS UP – BUT STRENGHTENED RISK MANAGEMENT
IS DELIVERING VALUE
TOTAL ASSETS, GROSS LOANS AND CUSTOMER DEPOSITS
ALL IMPROVE YEAR ON YEAR
18
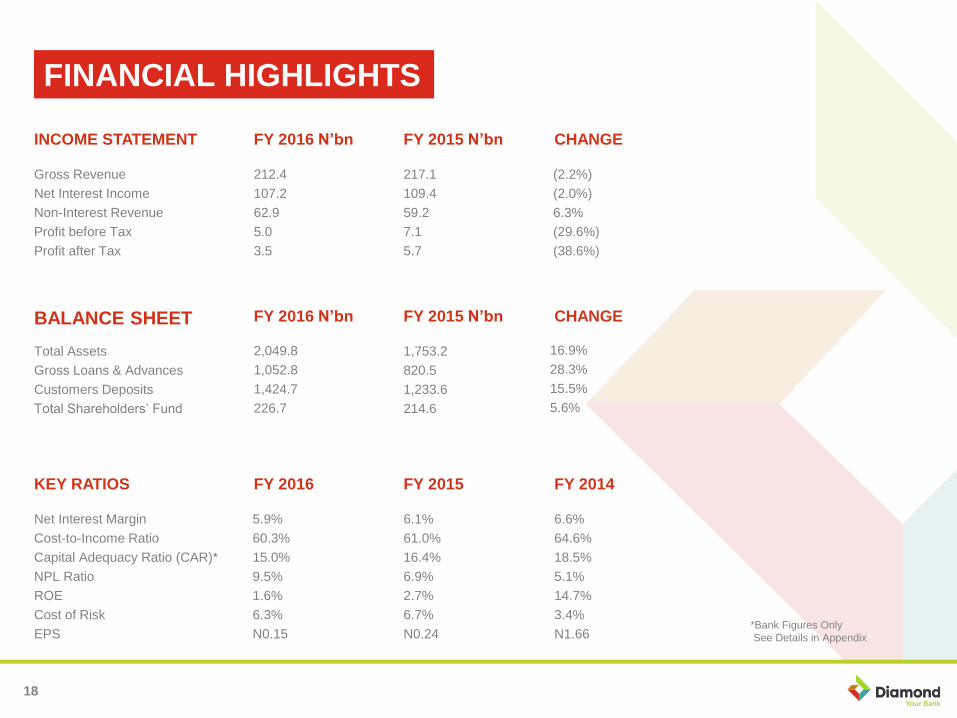
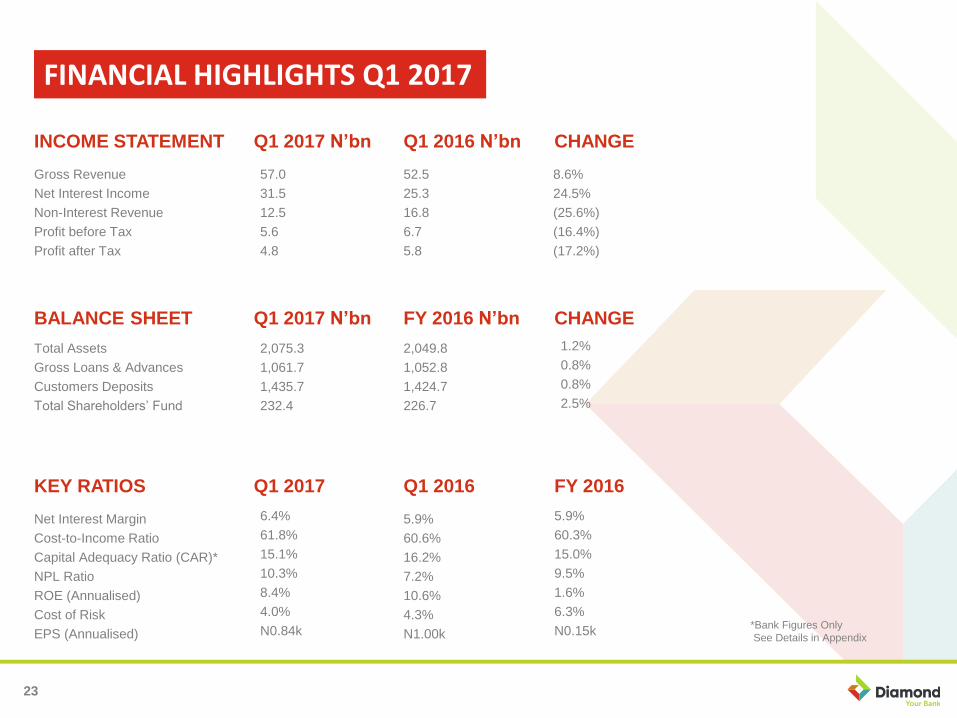
INCOME STATEMENT
Gross Revenue
Net Interest Income
Non-Interest Revenue
Profit before Tax
Profit after Tax
FY 2016 N’bn FY 2015 N’bn
217.1
109.4
59.2
7.1
5.7
CHANGE
BALANCE SHEET
Total Assets
Gross Loans & Advances
Customers Deposits
Total Shareholders’ Fund
FY 2016 N’bn FY 2015 N’bn
1,753.2
820.5
1,233.6
214.6
CHANGE
KEY RATIOS
Net Interest Margin
Cost-to-Income Ratio
Capital Adequacy Ratio (CAR)*
NPL Ratio
ROE
Cost of Risk
EPS
FY 2016 FY 2015
6.1%
61.0%
16.4%
6.9%
2.7%
6.7%
N0.24
FY 2014
6.6%
64.6%
18.5%
5.1%
14.7%
3.4%
N1.66*Bank Figures Only
See Details in Appendix
FINANCIAL HIGHLIGHTS
212.4
107.2
62.9
5.0
3.5
2,049.8
1,052.8
1,424.7
226.7
5.9%
60.3%
15.0%
9.5%
1.6%
6.3%
N0.15
(2.2%)
(2.0%)
6.3%
(29.6%)
(38.6%)
16.9%
28.3%
15.5%
5.6%
19
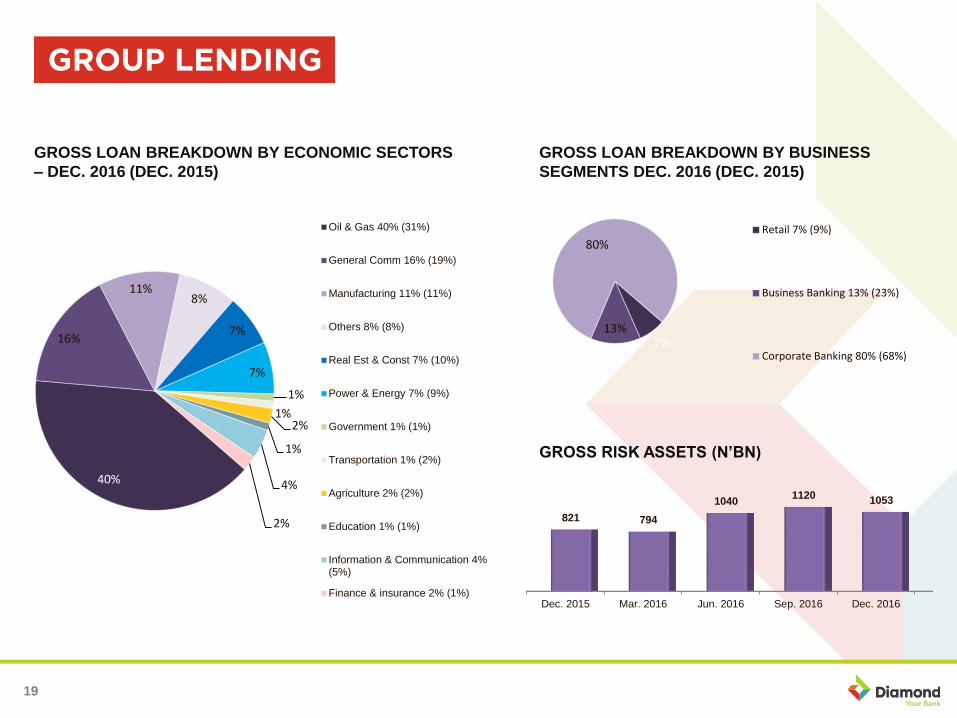
40%
16%
11%8%
7%
7%
1%
1%2%
1%
4%
2%
Oil & Gas 40% (31%)
General Comm 16% (19%)
Manufacturing 11% (11%)
Others 8% (8%)
Real Est & Const 7% (10%)
Power & Energy 7% (9%)
Government 1% (1%)
Transportation 1% (2%)
Agriculture 2% (2%)
Education 1% (1%)
Information & Communication 4%(5%)
Finance & insurance 2% (1%)
7%13%
80%Retail 7% (9%)
Business Banking 13% (23%)
Corporate Banking 80% (68%)
GROSS LOAN BREAKDOWN BY ECONOMIC SECTORS
– DEC. 2016 (DEC. 2015)
GROSS LOAN BREAKDOWN BY BUSINESS
SEGMENTS DEC. 2016 (DEC. 2015)
GROSS RISK ASSETS (N’BN)
Dec. 2015 Mar. 2016 Jun. 2016 Sep. 2016 Dec. 2016
821 794
10401120
1053
20
11%
36%5%
1%
10%
24%13%
General Commerce 11%
Oil & Gas 36%
Real Estate & Construction 5%
Finance & Insurance 1%
Manufacturing 10%
Information & Communication 24%
Others 13%
NPL BY SECTOR (DEC.2016) NPL BY CLASSIFICATION
NPL BY SECTOR (DEC. 2015) NON PERFORMING LOANS
& PROVISIONS (N’BN)
22%
14% 9%2%
17%
7%
29%
General Commerce 22%
Oil & Gas 14%
Real Estate & Construction 9%
Finance & Insurance 2%
Manufacturing 17%
Information & Communication 7%
Others 29%
Dec. 2015 Mar.2016 Jun. 2016 Sep. 2016 Dec. 2016
16% 11%
55%40% 40%
47% 53%
40%
42%57%
37% 36%
5%18%
3%
Substandard Doubtful Lost
N56.7bn N60.0bn N93.0bn N116.1bn N100.4bn
57 60 93 116 100
5764
58
7965
Dec. 2015 Mar. 2016 Jun. 2016 Sep. 2016 Dec. 2016
Non Performing Loans Provisions
Q1 2017 RESULTS
& ANALYSISCHIUGO NDUBISI, CFO
22
PROFIT DOWN YEAR ON YEAR DUE TO ADDITIONAL
IMPAIRMENT CHARGES – THIS WILL ABATE SOON
NET INTEREST INCOME UP 25% YEAR ON YEAR –
HIGHLIGHTING INCREASING MARGINS FROM LENDING
COMMISSION AND FEES INCOME INCREASE YEAR ON YEAR
LEVERAGING OUR LIFESTYLE APPROACH TO BANKING
Q1 2017 FINANCIAL
SNAPSHOT
TOTAL ASSETS CONTINUE TO GROW AS WE CONTINUE TO
EXPLORE NEW FRONTIERS
23
INCOME STATEMENT
Gross Revenue
Net Interest Income
Non-Interest Revenue
Profit before Tax
Profit after Tax
Q1 2017 N’bn Q1 2016 N’bn
52.5
25.3
16.8
6.7
5.8
CHANGE
BALANCE SHEET
Total Assets
Gross Loans & Advances
Customers Deposits
Total Shareholders’ Fund
Q1 2017 N’bn FY 2016 N’bn CHANGE
KEY RATIOS
Net Interest Margin
Cost-to-Income Ratio
Capital Adequacy Ratio (CAR)*
NPL Ratio
ROE (Annualised)
Cost of Risk
EPS (Annualised)
Q1 2017 Q1 2016
5.9%
60.6%
16.2%
7.2%
10.6%
4.3%
N1.00k
FY 2016
*Bank Figures Only
See Details in Appendix
FINANCIAL HIGHLIGHTS Q1 2017
5.9%
60.3%
15.0%
9.5%
1.6%
6.3%
N0.15k
6.4%
61.8%
15.1%
10.3%
8.4%
4.0%
N0.84k
57.0
31.5
12.5
5.6
4.8
2,049.8
1,052.8
1,424.7
226.7
2,075.3
1,061.7
1,435.7
232.4
8.6%
24.5%
(25.6%)
(16.4%)
(17.2%)
1.2%
0.8%
0.8%
2.5%
24
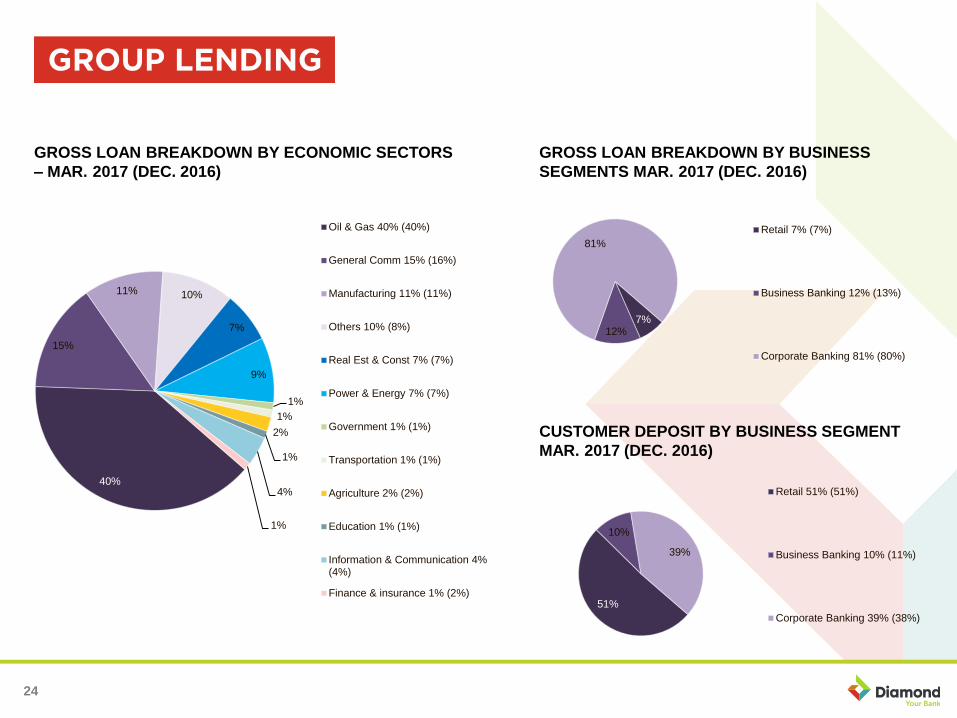
40%
15%
11% 10%
7%
9%
1%
1%
2%
1%
4%
1%
Oil & Gas 40% (40%)
General Comm 15% (16%)
Manufacturing 11% (11%)
Others 10% (8%)
Real Est & Const 7% (7%)
Power & Energy 7% (7%)
Government 1% (1%)
Transportation 1% (1%)
Agriculture 2% (2%)
Education 1% (1%)
Information & Communication 4%(4%)
Finance & insurance 1% (2%)
7%12%
81%
Retail 7% (7%)
Business Banking 12% (13%)
Corporate Banking 81% (80%)
GROSS LOAN BREAKDOWN BY ECONOMIC SECTORS
– MAR. 2017 (DEC. 2016)
GROSS LOAN BREAKDOWN BY BUSINESS
SEGMENTS MAR. 2017 (DEC. 2016)
CUSTOMER DEPOSIT BY BUSINESS SEGMENT
MAR. 2017 (DEC. 2016)
51%
10%
39%
Retail 51% (51%)
Business Banking 10% (11%)
Corporate Banking 39% (38%)
25
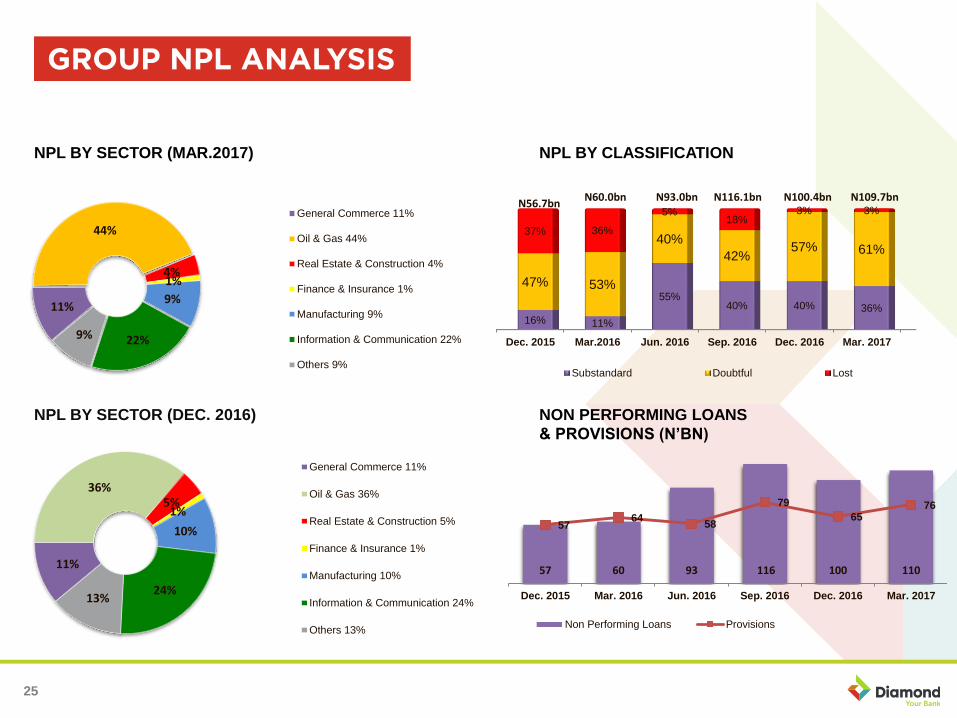
Dec. 2015 Mar.2016 Jun. 2016 Sep. 2016 Dec. 2016 Mar. 2017
16% 11%
55%40% 40% 36%
47% 53%
40%
42%57% 61%
37% 36%
5%18%
3% 3%
Substandard Doubtful Lost
N93.0bnN60.0bn N116.1bnN56.7bn
N100.4bn N109.7bn
11%
44%
4%1%
9%
22%9%
General Commerce 11%
Oil & Gas 44%
Real Estate & Construction 4%
Finance & Insurance 1%
Manufacturing 9%
Information & Communication 22%
Others 9%
11%
36%5%
1%
10%
24%13%
General Commerce 11%
Oil & Gas 36%
Real Estate & Construction 5%
Finance & Insurance 1%
Manufacturing 10%
Information & Communication 24%
Others 13%
57 60 93 116 100 110
5764
58
79
6576
Dec. 2015 Mar. 2016 Jun. 2016 Sep. 2016 Dec. 2016 Mar. 2017
Non Performing Loans Provisions
NPL BY SECTOR (MAR.2017) NPL BY CLASSIFICATION
NPL BY SECTOR (DEC. 2016) NON PERFORMING LOANS
& PROVISIONS (N’BN)

2017 OUTLOOK &
CONCLUSIONUZOMA DOZIE, CEO
27
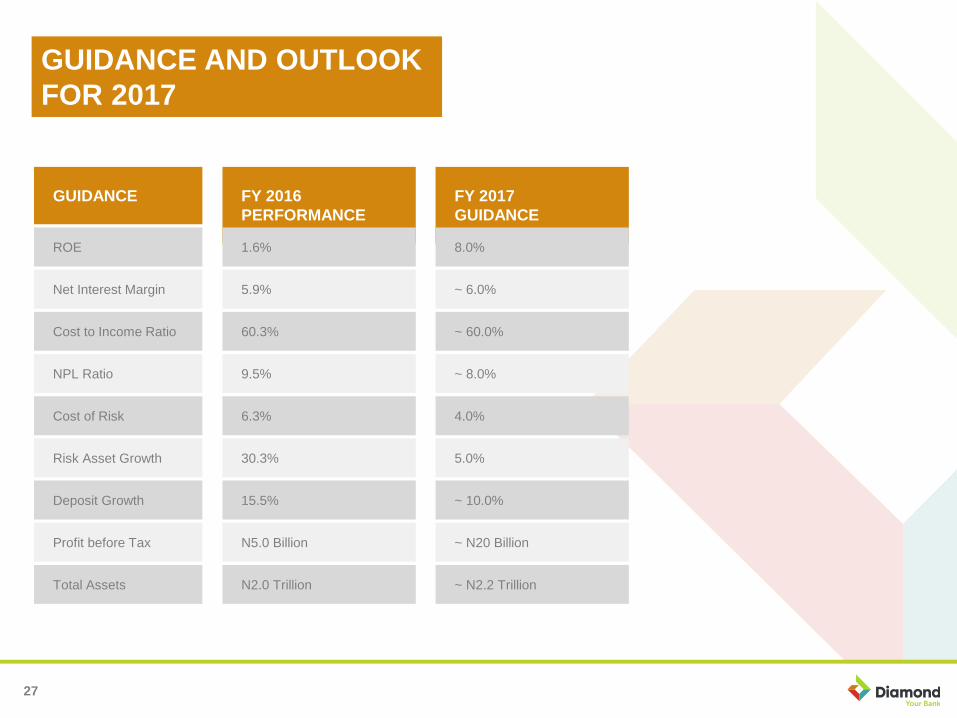
GUIDANCE FY 2016
PERFORMANCE
FY 2017
GUIDANCE
ROE
Net Interest Margin
Cost to Income Ratio
NPL Ratio
Cost of Risk
Risk Asset Growth
Deposit Growth
Profit before Tax
Total Assets
1.6%
5.9%
60.3%
9.5%
6.3%
30.3%
15.5%
N5.0 Billion
N2.0 Trillion
8.0%
~ 6.0%
~ 60.0%
~ 8.0%
4.0%
5.0%
~ 10.0%
~ N20 Billion
~ N2.2 Trillion
GUIDANCE AND OUTLOOK
FOR 2017
28
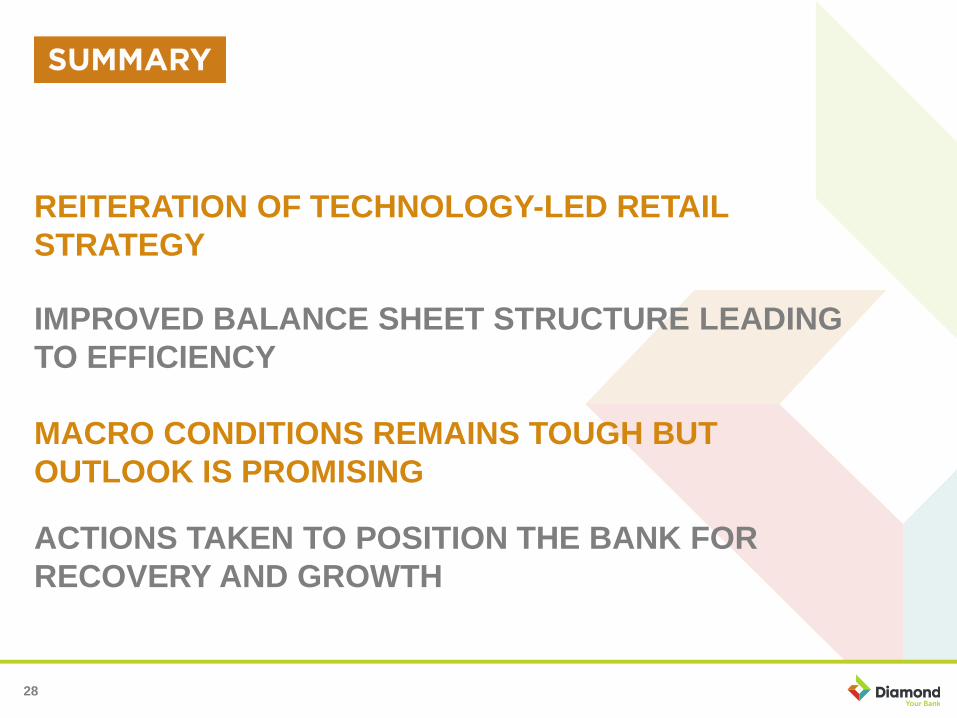
REITERATION OF TECHNOLOGY-LED RETAIL
STRATEGY
IMPROVED BALANCE SHEET STRUCTURE LEADING
TO EFFICIENCY
MACRO CONDITIONS REMAINS TOUGH BUT
OUTLOOK IS PROMISING
ACTIONS TAKEN TO POSITION THE BANK FOR
RECOVERY AND GROWTH

Q&A


31
FY 2016
ACTUAL
N’BILLION
212.4GROSS EARNINGS
FY 2015
ACTUAL
N’BILLION
217.1
Y-o-Y
% Δ
(2.2)
149.6INTEREST INCOME 157.9 (5.3)
(42.3)INTEREST EXPENSE (48.5) 12.8
107.2NET INTEREST INCOME 109.4 (2.0)
(59.0)IMPAIRMENT CHARGE (55.2) (6.9)
48.2NET INTEREST INCOME (AFTER IMPAIRMENT CHARGE) 54.2 (11.1)
53.9OTHER INCOME (NET) 50.4 6.9
102.1OPERATING INCOME 104.6 (2.4)
(97.1)OPERATING EXPENSES (97.5) 0.4
5.0PROFIT BEFORE TAX 7.1 (29.6)
3.5PROFIT AFTER TAX 5.7 (38.6)
8.6OTHER COMPREHENSIVE INCOME 2.2 290.9
12.1TOTAL COMPREHENSIVE INCOME 7.9 53.2
32
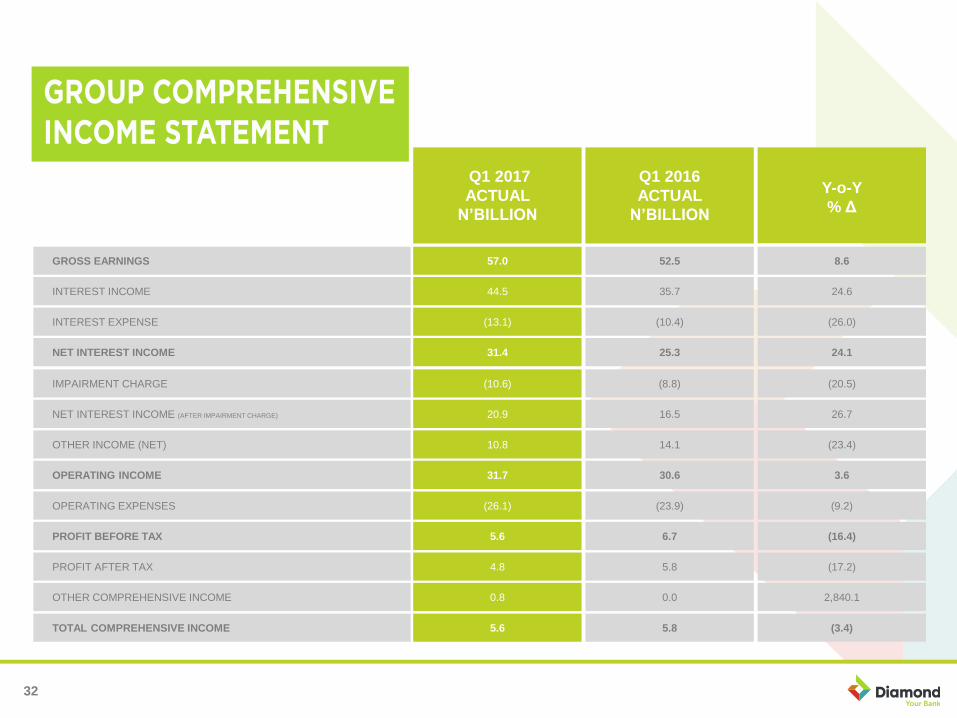
Q1 2017
ACTUAL
N’BILLION
57.0GROSS EARNINGS
Q1 2016
ACTUAL
N’BILLION
52.5
Y-o-Y
% Δ
8.6
44.5INTEREST INCOME 35.7 24.6
(13.1)INTEREST EXPENSE (10.4) (26.0)
31.4NET INTEREST INCOME 25.3 24.1
(10.6)IMPAIRMENT CHARGE (8.8) (20.5)
20.9NET INTEREST INCOME (AFTER IMPAIRMENT CHARGE) 16.5 26.7
10.8OTHER INCOME (NET) 14.1 (23.4)
31.7OPERATING INCOME 30.6 3.6
(26.1)OPERATING EXPENSES (23.9) (9.2)
5.6PROFIT BEFORE TAX 6.7 (16.4)
4.8PROFIT AFTER TAX 5.8 (17.2)
0.8OTHER COMPREHENSIVE INCOME 0.0 2,840.1
5.6TOTAL COMPREHENSIVE INCOME 5.8 (3.4)
33
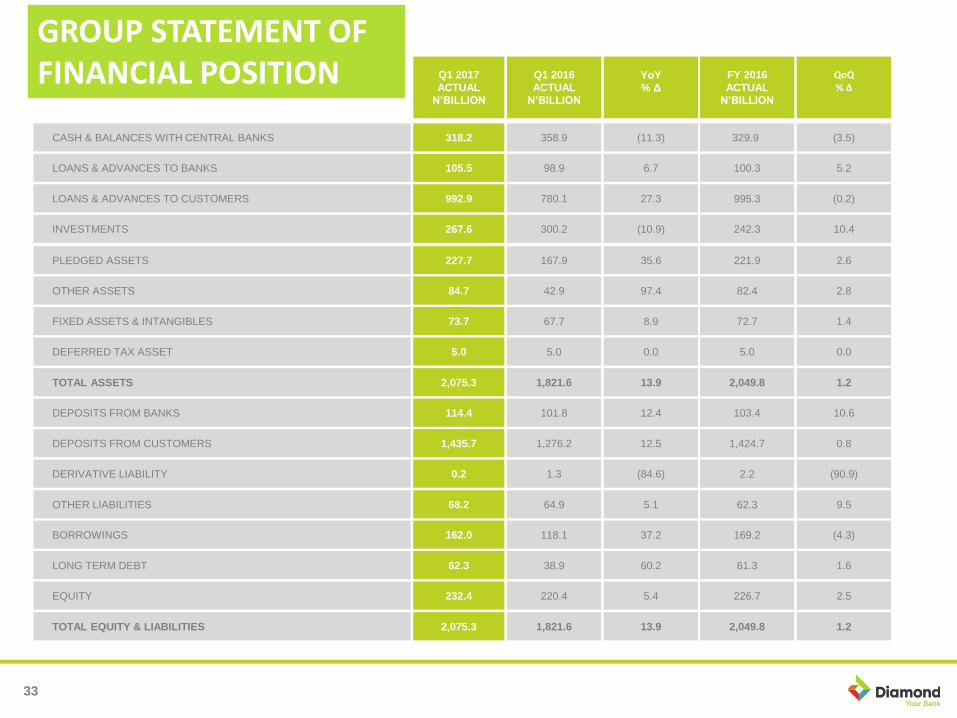
Q1 2017
ACTUAL
N’BILLION
318.2CASH & BALANCES WITH CENTRAL BANKS
Q1 2016
ACTUAL
N’BILLION
358.9
YoY
% Δ
(11.3)
105.5LOANS & ADVANCES TO BANKS 98.9 6.7
992.9LOANS & ADVANCES TO CUSTOMERS 780.1 27.3
267.6INVESTMENTS 300.2 (10.9)
227.7PLEDGED ASSETS 167.9 35.6
84.7OTHER ASSETS 42.9 97.4
73.7FIXED ASSETS & INTANGIBLES 67.7 8.9
5.0DEFERRED TAX ASSET 5.0 0.0
2,075.3TOTAL ASSETS 1,821.6 13.9
114.4DEPOSITS FROM BANKS 101.8 12.4
1,435.7DEPOSITS FROM CUSTOMERS 1,276.2 12.5
0.2DERIVATIVE LIABILITY 1.3 (84.6)
68.2OTHER LIABILITIES 64.9 5.1
FY 2016
ACTUAL
N’BILLION
329.9
QoQ% Δ
(3.5)
100.3 5.2
995.3 (0.2)
242.3 10.4
221.9 2.6
82.4 2.8
72.7 1.4
5.0 0.0
2,049.8 1.2
103.4 10.6
1,424.7 0.8
2.2 (90.9)
62.3 9.5
162.0BORROWINGS 118.1 37.2
62.3LONG TERM DEBT 38.9 60.2
232.4EQUITY 220.4 5.4
2,075.3TOTAL EQUITY & LIABILITIES 1,821.6 13.9
169.2 (4.3)
61.3 1.6
226.7 2.5
2,049.8 1.2
GROUP STATEMENT OF FINANCIAL POSITION
34
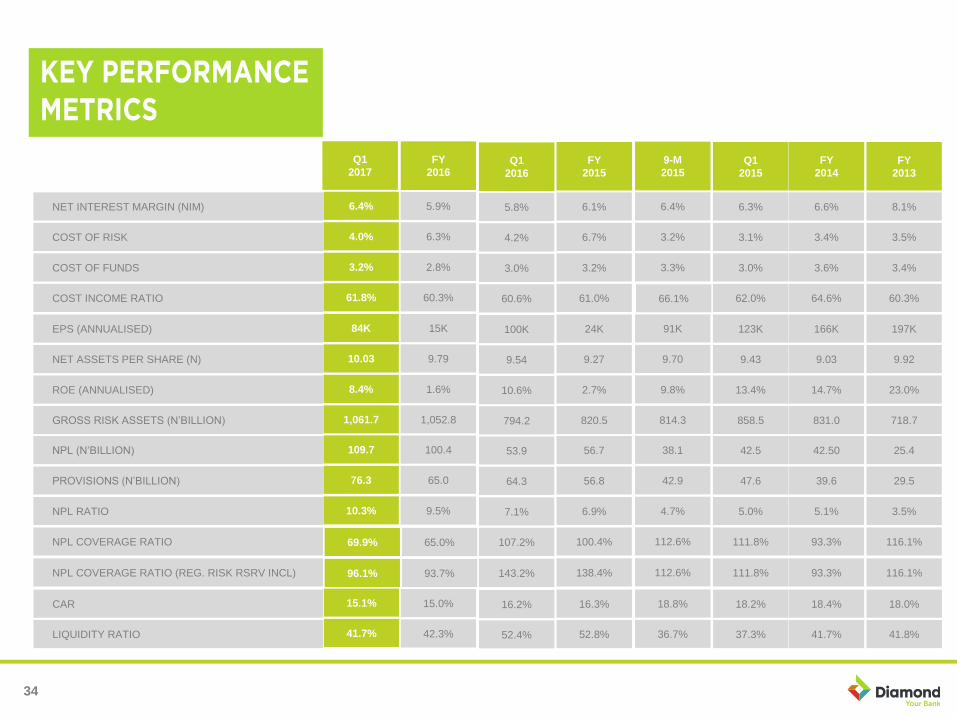
NET INTEREST MARGIN (NIM)
COST OF RISK
COST OF FUNDS
COST INCOME RATIO
EPS (ANNUALISED)
NET ASSETS PER SHARE (N)
ROE (ANNUALISED)
GROSS RISK ASSETS (N’BILLION)
NPL (N’BILLION)
PROVISIONS (N’BILLION)
NPL RATIO
FY
2015
6.1%
6.7%
3.2%
61.0%
24K
9.27
2.7%
820.5
56.7
56.8
6.9%
Q1
2015
6.3%
3.1%
3.0%
62.0%
123K
9.43
13.4%
858.5
42.5
47.6
5.0%
FY
2014
6.6%
3.4%
3.6%
64.6%
166K
9.03
14.7%
831.0
42.50
39.6
5.1%
FY
2013
8.1%
3.5%
3.4%
60.3%
197K
9.92
23.0%
718.7
25.4
29.5
3.5%
9-M
2015
6.4%
3.2%
3.3%
91K
9.70
9.8%
814.3
38.1
42.9
4.7%
66.1%
FY
2016
5.9%
6.3%
2.8%
60.3%
15K
9.79
1.6%
1,052.8
100.4
65.0
9.5%
Q1
2017
6.4%
4.0%
3.2%
61.8%
84K
10.03
8.4%
1,061.7
109.7
76.3
10.3%
Q1
2016
5.8%
4.2%
3.0%
60.6%
100K
9.54
10.6%
794.2
53.9
64.3
7.1%
NPL COVERAGE RATIO 100.4% 111.8% 93.3% 116.1%112.6%65.0%69.9% 107.2%
15.1%
41.7%
CAR
LIQUIDITY RATIO
16.3%
52.8%
18.2%
37.3%
18.4%
41.7%
18.0%
41.8%
18.8%
36.7%
15.0%
42.3%
16.2%
52.4%
NPL COVERAGE RATIO (REG. RISK RSRV INCL) 138.4% 111.8% 93.3% 116.1%112.6%93.7%96.1% 143.2%