investor update - lic housing finance · home loans continue to dominate loan book of hfcs...
TRANSCRIPT

Investor UpdateMarch 2018

Population(cr)
2
Section
80C IT Act
Deduction on account of principal
repayment of up to Rs.1.5 lakh on home
loans from the borrowers gross total
income
Section 24,
IT Act
Deduction on account of annual interest
payment of up to Rs. 2 lakh on home
loans, where the house is self-occupied.
Section 54,
IT Act
Capital gains from transfer of residential
property, if invested is acquiring a
residential house, exempt from income tax
Urb
an p
opula
tion (
cr)
Urb
aniz
ation R
ate
%
Pro
pert
y c
ost (r
s lac)
&
Aff
ord
abili
ty
Indian housing industry: Strong growth drivers
Rising population Growing urbanization
Improvement in affordability Favorable tax legislations
1 Crore (cr)=10 million

Several initiatives to promote housing
3
• Real Estate Regulatory Authority ‘RERA” Bill in 2016: 24 out of 35 States &
Union Territories have notified RERA
• Incentives for Builders in Affordable Housing-Union Budget 2016
• Budget 2017: “Infrastructure Status” for Affordable Housing
• Budget 2018: Affordable Housing Fund to be created

Several initiatives to promote housing
4
• “Housing For All” by 2022
• Launch of Pradhan Mantri Awas Yojana in 2015
• 100 “Smart Cities” notified
• Announcement of Interest Subsidy for Loans upto Rs 9 lacs & Rs12 lacs by
Hon’ble Prime Minister on 31.12.2016 (MIG-I & MIG-II)
5
No
. of
citi
es
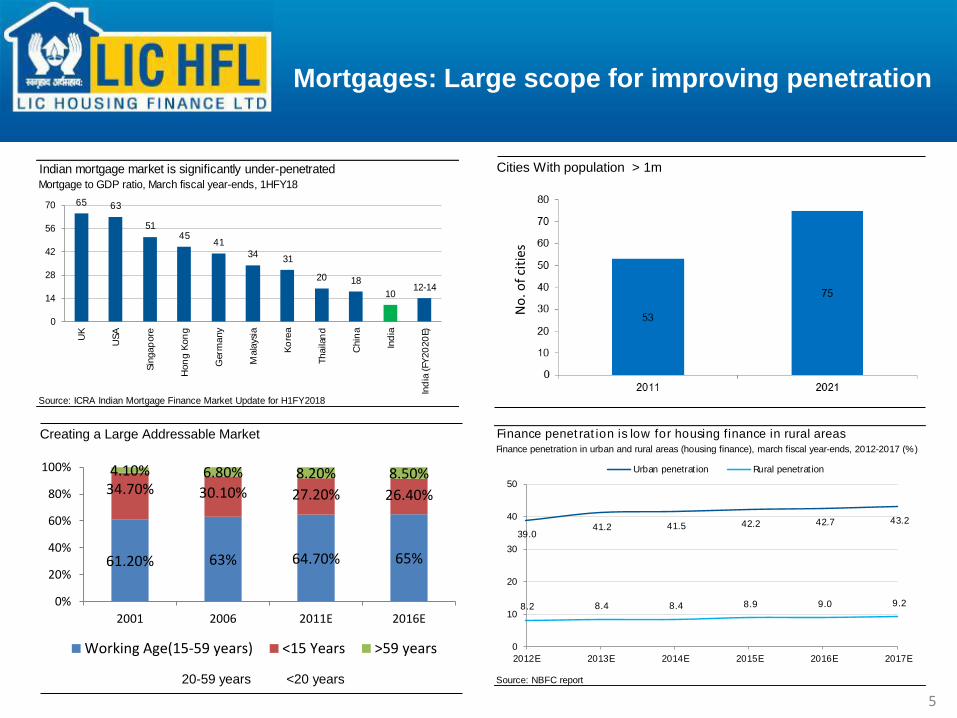
61.20% 63% 64.70% 65%
34.70% 30.10% 27.20% 26.40%
4.10% 6.80% 8.20% 8.50%
0%
20%
40%
60%
80%
100%
2001 2006 2011E 2016E
Working Age(15-59 years) <15 Years >59 years
20-59 years <20 years
Mortgages: Large scope for improving penetration
Finance penet rat ion is low for housing finance in rural areas
Finance penetration in urban and rural areas (housing finance), march fiscal year-ends, 2012-2017 (%)
Source: NBFC report
39.0 41.2 41.5 42.2 42.7 43.2
8.2 8.4 8.4 8.9 9.0 9.2
0
10
20
30
40
50
2012E 2013E 2014E 2015E 2016E 2017E
Urban penetrat ion Rural penetrat ion
Indian mortgage market is significantly under-penetrated
Mortgage to GDP ratio, March fiscal year-ends, 1HFY18
Source: ICRA Indian Mortgage Finance Market Update for H1FY2018
65 63
5145
41
3431
20 18
1012-14
0
14
28
42
56
70
UK
USA
Sin
gap
ore
Hon
g K
on
g
Germ
any
Mala
ysi
a
Ko
rea
Thailan
d
Chin
a
Ind
ia
Ind
ia (
FY
20
20
E)
Cities With population > 1m
Creating a Large Addressable Market

Mortgage book to witness strong growth going ahead
March fiscal year-ends, 2011-2019P
Note:
1) Includes the overall portfolio of HFCs and only developer and housing loans of banks.
Source: NBFC report
7.4 8.6 10.4
12.4 14.7
17.3 19.9
22.8 26.6
17.0
20.9
19.2 18.5
17.7
15.0 14.6
16.7
0
5
10
15
20
25
0
6
12
18
24
30
2011 2012 2013 2014 2015 2016 2017E 2018P 2019P
(%)(Rs tn) Mortgage loan book LHS) YoY (RHS)
Housing loans to witness strong traction as impact of GST and RERA fade away
March fiscal year-ends, 2012-2019P
Source: NBFC report
6.2 7.5 8.9 10.5
12.4 14.4
16.6 19.6
20.6 19.0 18.6 18.1
16.1 15.0
18.0
0
5
10
15
20
25
0
5
10
15
20
25
2012 2013 2014 2015E 2016E 2017E 2018P 2019P
(%)(Rs tn)Housing f inance (LHS) YoY (RHS)
Mortgages: High growth trajectory
LAP market to pick pace post lowering in last two years
March fiscal year-ends, 2013-2019P
Source: NBFC report
1.3 1.7 2.3 2.9 3.2 3.7 4.3
34.4
30.1 28.8
12.0 13.5
15.5
0
7
14
21
28
35
0
1
2
3
4
5
2013E 2014E 2015E 2016E 2017E 2018P 2019P
(%)(Rs tn) LAP loan book (LHS) YoY (RHS)
6

HFCs cont inue to dominate mortgage market
March fiscal year-ends. 2012-2019P (%)
Source: NBFC report
66 63 63 62 62 60 60 59
34 37 37 38 38 40 40 41
0
20
40
60
80
100
2012 2013 2014 2015 2016 2017E 2018P 2019P
Banks HFC
Mortgages: HFCs play a key role
HFC cont inue to dominate home loan market
YoY increase in home loan portfolio of banks and HFCs
Source: ICRA Indian Mortgage Finance Market Update for H1FY2018
15
1817
18
1513
26
2021
1918
19
0
6
12
18
24
30
2013 2014 2015 2016 2017 1HFY18
Banks HFC
7

HFCs: Home loans dominate mortgage book
Home loans continue to dominate loan book of HFCs
Portfolio composition of HFCs, March fiscal year-ends, 2017 (%)
Source: CRA Indian Mortgage Finance Market Update for H1FY2018
Home loan,
67
LAP, 15
Construction
finance, 10
LRD, 5Others, 3
HFCs are growing their non-housing loan portfolio at a fast pace
YoY increase in loans, March fiscal year-ends, 2014-1HFY18 (%)
Source: CRA Indian Mortgage Finance Market Update for H1FY2018
20 22 21 20 23
1921
1918
19
21
26 2627
30
15
17
19
21
23
25
0
7
14
21
28
35
2014 2015 2016 2017 1HFY18
Overall port folio Home loans Other loans
8

1989
1994
2002
2004
2009
2011
2012
2013
Incorporated
IPO
AAA Rating
GDR Issue
Crossed Rs. 500 crs profit
Crossed Rs. 50,000 Cr loan portfolio
• Best HFC by CNBC TV 18
• Construction Industry Award
•Crossed Rs. 1000 cr profit &
Rs 75,000 Cr assets
20152014
• Best HFC by
ABP News
•Crosses Rs 1
lakh cr in portfolio
•Best Housing
Finance Co. by
BFSI Awards
• Best data quality
in HFC
by CIBIL
LICHFL: A Journey of 29 Years…
•Business Today-
Best CEO Award
• Business World -
Most Respected Co
Award
•Outlook Money-Best
HFC
•Best HFC by ABP
News
•Best Data Quality by
CIBIL
•Asia Pacific
Entrepreneurship
Award
•Power Brands
Awards by Franchise
India
2016
2017
•Crosses 150,000 cr in assets
•Outlook Money-Best HFC
•Business Today BFSI Best
CEO
•NSE for highest Debt
Issuance
9

• Highest ratings (AAA) since 2002
• More than 22 lakh customers serviced till date
• Total assets more than Rs 150,000 cr
• 96% of loan assets in retail category
• Cumulative Disbursements > Rs 2,60,000 cr since
inception
• Gross NPAs in retail loans amongst lowest in Industry
LICHFL: Key highlights
Shareholding Pattern
10

LICHFL: Key highlights
24359 2527130327
3615141541
0
10000
20000
30000
40000
50000
2013 2014 2015 2016 2017
Disbursement (Rs. Cr) CAGR 14% Loan Portfolio (Rs.cr) CAGR 17%
Income (Rs. cr) CAGR 16% Profit After Tax (Rs. cr) CAGR 17%
11

* Provisions Including Provisions on Std. Assets & Teaser Loans
LICHFL: Key highlights
Gross & Net NPAs Total Provisions* (Rs cr)
Operating Expense to Total Income Profit per employee (Rs. lacs)
12

LICHFL: Key highlights
EPS (Rs) (Rs 2/- pd up) Book Value (Rs)(Rs 2/- pd up)
Return on Avg Equity Return on Avg Loan Assets
13

Trends in retail disbursements
14
23,230 24,289 29,255 34,529 38,334 29,976
21.51
4.56
20.45
18.03
11.02
22.98
0
5
10
15
20
25
-
9,000
18,000
27,000
36,000
45,000
2013 2014 2015 2016 2017 9MFY18
(%)(Rs cr) Disbursements (LHS) YoY (RHS)
16.08 17.21 18.08 19.95 21.41 21.32
7.03
5.06
10.34
7.32
0.0
2.5
5.0
7.5
10.0
12.5
-
5
10
15
20
25
2013 2014 2015 2016 2017 9MFY18
(%)(Rs lacs) Average ticket size (LHS) YoY (RHS)
96 96 92 79 77 82 -
20
40
60
80
100
2013 2014 2015 2016 2017 9MFY18
(%) Share of home loans

Low NPLs in retail segment over the years
15
239 240 253 246 284 710
0.32
0.270.24
0.2 0.2
0.47
0.0
0.2
0.4
0.6
0.8
1.0
-
200
400
600
800
1,000
2013 2014 2015 2016 2017 9MFY18
(%)(Rs cr) Retail GNPA (LHS) Retail GNPA ratio (RHS)
Amongst the lowest GNPAs in the sector with Net Credit losses since inception less than 7 bps

23 New Marketing Offices proposed to be opened in FY 2019
• 9 Regional Offices
• 23 Back Offices
• 249 Marketing Offices
• Rep offices in Dubai & Kuwait
• Coverage of more than 450 centres
• 2095 Employees
Back offices
Operating offices
Regional offices
Corporate office
Nagercoil
ThiruvananthapuramKottayam
Ernakulam
Kozhikode
Thrissur
Tirumangalam
Madurai
Thanjavur
Pondicherry
Tiruchirapalli
Coimbatore
Salem
Vellore
ChennaiHosurMysore
Mangalore
Bengaluru
Panjim
Vashi
Mumbai
NelloreHubliTirupati
Bellary
Anantapur
Kurnool
Guntur
Kakinada
Vijayawada
Hyderabad Rajahmundry
Visakapatnam
Warangal
Bhubaneshwar
Kolkata
Silchar
Guwahati
Siliguri
Gangtok
Patna
ShimlaJalandharAmritsar
LudhianaChandigarh
Dehradun
HaldwaniKarnal
Bareilly
Ghaziabad
New Delhi
AgraLucknow
Kanpur
JaipurAjmer
Gwalior
Bikaner
Jodhpur
Rajkot
Udaipur
Ahmedabad
Vadodara Indore
Bhopal
Allahabad
Jabalpur
Varanasi
Ranchi
Jamshedpur
RourkelaBilaspur
RaipurNagpurJalgaonSurat
Vapi
AurangabadNasik
Kalyan
ThaneJogeshwari
Pune
Kolhapur
Belgaum
Gulburga
Nallasopara
Kota
Hassan
Erode
Kannur
Kollam
Palghat
Gandhidham
Satara
Durg-Bhilai
Gorakhpur
Meerut
Behrampur
Cuttack
Dhanbad
Durgapur
Jorhat
Malda
GurgaonFaridabad
Noida
AmbalaBhatinda
HisarPatiala
Large geographic presence
Year No of
Marketing
Offices
No of Back
offices
No of
Regional
Offices
No of
Employees
Lon
Portfolio
Rs cr
2003 105 - 6 870 7772
2008 125 14 6 985 21936
2013 194 16 7 1446 77812
2018 249 23 9 2095 156176 * (Dec 2017)
Widening footprint…improved efficiencies
16

HOME LOAN AGENTS (HLAs)
(Agents of LIC)
DIRECT SALES AGENTS (DSAs)
(Small Firms/Companies etc)
CUSTOMER RELATIONS
ASSOCIATES (CRAs)
(Individual Agents of the Company)
249Marketing Offices
49 branches of
LICHFL Financial Services(100% subsidiary of LICHFL)
Distribution Network
Total No of Agents > 12300:
growth of over 20% y-o-y
17

Loan Book Composition
31.12.2017
O/s Portfolio Rs156176 cr
30.09.2017
O/s Portfolio Rs151417 cr
31.3.2017
O/s Portfolio Rs144534 cr
18

Installment to Net Income RatioOn Incremental Sanctions
For FY16 33.25%
For FY17 32.12%
For Q2FY18 30.28%
For Q3FY18 30.74%
Loan To Value RatioOn Incremental Sanctions
For FY16 47%
For FY17 45%
For Q2FY18 45%
For Q3FY18 44%
Pure Floating Rate LoansTo Outstanding Portfolio
As of FY16 47%
As of FY17 70%
As of Q2FY18 78%
As of Q3FY18 76%
PrepaymentLump Sum/ opening book
For FY16 11.9%
For FY17 10.9%
As of Q2FY18 10.9%
As of Q3FY18 10.9%
Individual Loans – Portfolio Stats
19

Origination Pattern & Average Ticket Size
Data for 9M FY 2018 20

9M FY2018 9M FY 2017
Return on Average Equity (%) 17% 19%
Return on Average Assets (%) 1.3% 1.5%
Earnings per share (on Rs 2 pd up) 28.74 27.78
Capital Adequacy Ratio
Tier I
Tier II
Total
Sept 2017
13.36
2.68
16.04
Sept 2016
13.99
2.65
16.63
Financial Highlights – Q3FY18
21

Q3 FY18 PAT at Rs 491.07 cr as against Rs 499.26 cr for Q3FY17
Q3 FY18 Revenue from operations up by 6 % to Rs 3738 cr
Outstanding Loan portfolio up by 15% to Rs.156176 cr
Individual Loan Portfolio up by 15% to Rs 149986 cr
Q3FY18 Disbursements Rs 12301 cr against Rs 9685 cr up by 27 %
Individual Loan Disbursements Rs 11323 cr against Rs 8555 cr, up by 32%
Net Interest Income Rs 898 cr against Rs 915 cr
Net Interest Margins 2.33% for Q3 FY18 as against 2.75% for Q3FY17
Gross NPAs at 0.87% as against 0.56% as on 31.12.2016
Net NPAs 0.49% as against 0.27% on corresponding dates
Individual Loans Gross NPAs at 0.47% as against 0.32% on 31.12.2016
Total Provisions at Rs 1227 cr as against total Gross NPAs of Rs 1360 cr
Executive Summary – Q3/FY18
22

Executive Summary – Q3/9MFY18
Var Q3
FY18
Q3
FY17
Var 9M
FY18
9M
FY17
Interest Income on Individual Loans 4% 3525.78 3384.81 6% 10461.38 9905.04
Interest Income on Project Loans 46% 186.63 127.72 43% 517.88 362.12
Total 6% 3712.41 3512.53 7% 10979.26 10267.16
Processing Fees & Other Fees 67% 25.68 15.41 3% 79.45 76.90
Other Income 42% 29.48 20.79 8% 80.08 74.43
Gross Income 6% 3767.57 3548.73 7% 11138.79 10418.49
Interest Expenses 8% 2814.81 2597.15 8% 8281.60 7661.57
Net Interest Income (2%) 897.60 915.38 4% 2697.66 2605.59
Salary & Other Establishment Exp. 5% 147.73 140.70 2% 423.32 415.22
Net Provisions & Diminutions 7% 48.45 45.27 10% 210.74 192.03
Profit before Tax (1%) 756.58 765.60 3% 2223.13 2149.67
Income Tax Provision including Deferred Tax (1%) 265.51 266.34 3% 772.87 747.81
Net Profit (2%) 491.07 499.26 3% 1450.26 1401.86
Rs cr

Executive Summary – Q3/9MFY18
Var Q3
FY18
Q3
FY17
Var 9M
FY18
9M
FY17
Disbursements
Individual 32% 11323 8555 23% 29976 24374
Project (13%) 978 1129 11% 2000 1975
Total 27% 12301 9684 21% 31976 26349
Outstanding Portfolio
Individual 15% 149986 130878
Project 38% 6189 4488
Total 15% 156175 135366
Net Interest Margins(%) 2.33% 2.75% 2.39% 2.67%
Borrowings during the Qtr 16430 13967
Incremental Cost/ytd 7.42% 8.19%
Incremental Yield(overall, annualised
YTD)
9.86% 10.69%
Incremental Spreads (YTD) 2.44% 2.50%
Rs cr

Yield & Cost of Funds on portfolio
25

Outstanding Borrowings – Rs. 137629 cr
Source Wtd
Avg
Cost
(%)
Banks & Institutions 8.18%
Non Convertible Debenture 8.41%
National Housing Bank 8.20%
Sub. Bonds & Upper Tier II 9.18%
Commercial Paper 6.44%
Deposits* 8.09%
Total 8.32%
as on 31.12.2017
Liability Profile
During Q3FY18, Borrowings were Rs 16430 cr @ 7.38%
* Includes Corporate Deposits of Rs 2749 cr26

Change in Liability Mix
Wtd. Avg. cost
of Funds
Bank funding has
reduced from
32% in FY12 to
25% in FY14.
Retail Deposits
increased to 2.2%
8.32% 8.37% 8.50% 8.59% 9.14% 9.48%
* Includes Corporate Deposits of Rs 2749 cr 27

Net Interest Margins
28

31.12.2017 31.12.2016
Gross NPA (Rs. cr) 1360 759
Gross NPA (%) 0.87% 0.56%
Provisions for NPA (Rs. cr)* 598 398
Net NPA(%) 0.49% 0.27%
Provisions including standard asset
provisions
1227 969
Gross & Net NPAs
*Excluding provisions on standard assets
Provisions cover including standard asset
provisions
90% 128%
29

Gross & Net NPAs
30

DISCLAIMER
This presentation is made purely for information. We have attempted to provide relevantinformation which we believe will help in knowing the Company. The users may use their ownjudgment and are advised to make their own calculations before deciding on any matter basedon the information given herein.
While every care is taken to verify the accuracy of the information given in this presentation,neither the Company nor its officials would in any way be liable for any action taken or nottaken by the viewers or the users of this presentation or for any claims, losses etc.
Thank you
31