investor update - amazon s3 · 4q’17 investor update march 1, 2018 ... half of the increase...
TRANSCRIPT

EP E
nerg
y Corp
ora
tion
1
INVESTOR UPDATE
Improving Results
4Q’17 Investor Update
March 1, 2018
EP ENERGY CORPORATION
EP E
nerg
y Corp
ora
tion
2
CAUTIONARY STATEMENT REGARDING FORWARD LOOKING STATEMENTSThis presentation includes certain forward-looking statements and projections of EP Energy. EP Energy has made every reasonable effort to ensure that the information and assumptions on which these statements and projections are based are current, reasonable, and complete. However, a variety of factors could cause actual results to differ materially from the projections, anticipated results or other expectations expressed, including, without limitation, the volatility of, and sustained low oil, natural gas, and NGL prices; the supply and demand for oil, natural gas and NGLs; changes in commodity prices and basis differentials for oil and natural gas; EP Energy’s ability to meet production volume targets; the uncertainty of estimating proved reserves and unproved resources; the future level of service and capital costs; the availability and cost of financing to fund future exploration and production operations; the success of drilling programs with regard to proved undeveloped reserves and unproved resources; EP Energy’s ability to comply with the covenants in various financing documents; EP Energy’s ability to obtain necessary governmental approvals for proposed E&P projects and to successfully construct and operate such projects; actions by the credit rating agencies; credit and performance risks of EP Energy’s lenders, trading counterparties, customers, vendors, suppliers, and third party operators; general economic and weather conditions in geographic regions or markets served by EP Energy, or where operations of EP Energy are located, including the risk of a global recession and negative impact on oil and natural gas demand; the uncertainties associated with governmental regulation, including any potential changes in federal and state tax laws and regulation; competition; and other factors described in EP Energy’s Securities and Exchange Commission filings. While EP Energy makes these statements and projections in good faith, neither EP Energy nor its management can guarantee that anticipated future results will be achieved. Reference must be made to those filings for additional important factors that may affect actual results. EP Energy assumes no obligation to publicly update or revise any forward-looking statements made herein or any other forward-looking statements made by EP Energy, whether as a result of new information, future events, or otherwise.
This presentation presents certain production and reserves-related information on an "equivalency" basis. Equivalent volumes are computed with natural gas converted to barrels at a ratio of six Mcf to one Bbl. These conversions are based on energy equivalency conversion methods primarily applicable at the burner tip and do not represent value equivalencies at the wellhead. Although these conversion factors are industry accepted norms, they are not reflective of price or market value differentials between product types.
This presentation refers to certain non-GAAP financial measures such as “Adjusted Cash Operating Costs”, “Adjusted EBITDAX” and “Adjusted General and Administrative Expenses”. Definitions of these measures and reconciliation between U.S. GAAP and non-GAAP financial measures are included in the Fourth Quarter 2017 Financial and Operational Reporting Package at epenergy.com.
EP E
nerg
y Corp
ora
tion
3
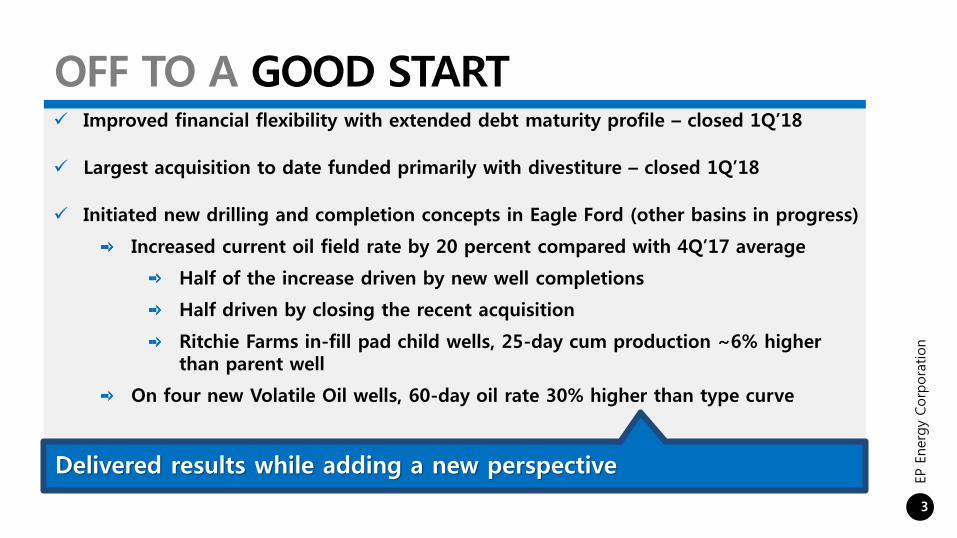
OFF TO A GOOD START
Delivered results while adding a new perspective
Improved financial flexibility with extended debt maturity profile – closed 1Q’18
Largest acquisition to date funded primarily with divestiture – closed 1Q’18
Initiated new drilling and completion concepts in Eagle Ford (other basins in progress)
Increased current oil field rate by 20 percent compared with 4Q’17 average
Half of the increase driven by new well completions
Half driven by closing the recent acquisition
Ritchie Farms in-fill pad child wells, 25-day cum production ~6% higher than parent well
On four new Volatile Oil wells, 60-day oil rate 30% higher than type curve

EP E
nerg
y Corp
ora
tion
4
PRIOR FOCUS
Designed to improve asset performance and capture opportunities
A DIFFERENTAPPROACH
Capital allocation by basin
Primarily divestiture focused
Static approach to new ideas
Mass manufacturing–style development
Project focused, basin agnostic
Focused on accretive A&D
Approximately 10% of capital used for new projects and concepts
Engineering each pad for optimal resource recovery and returns

EP E
nerg
y Corp
ora
tion
5
2018 OUTLOOKVOLUMES 1Q’18 FY’18
Oil Production (MBbls/d) 43 –44 46 - 50
Equivalent Production (MBoe/d) 77 –79 81 - 87
OIL & GAS EXPENDITURES ($ million)1,2 $210 -$220 $600 -$650
Eagle Ford ~50%
Permian ~30%
Altamont ~20%
AVERAGE GROSS DRILLING RIGS
Eagle Ford 1 - 2
Permian 1
Altamont 2
OPERATING COSTS
Lease operating expense ($/Boe) $5.00 - $5.70
G&A expense ($/Boe) $2.90 - $3.25
Adjusted G&A expense ($/Boe)3 $2.30 - $2.60
Transportation and commodity purchases ($/Boe) $3.15 - $3.45
Taxes, other than income ($/Boe)4 $2.50 - $2.60
DD&A ($/Boe) $16.50 - $17.50
1 Includes ~$135MM of non-drill capital; ~$55 million for general equipment, ~$30 million for capitalized G&A and interest, ~$25 million for enhanced facility projects, ~$10 million for enhanced oil recovery projects, and ~$15 million for leasing and seismic, and excludes net acquisition costs and divestiture proceeds of ~$57 million.2 Altamont capital includes ~100 recompletions.3 See the Fourth Quarter 2017 Financial and Operational Reporting Package, available at epenergy.com, for the Company’s non-GAAP reconciliations and definitions4 Severance taxes are based on $55/Bbl WTI.
EP E
nerg
y Corp
ora
tion
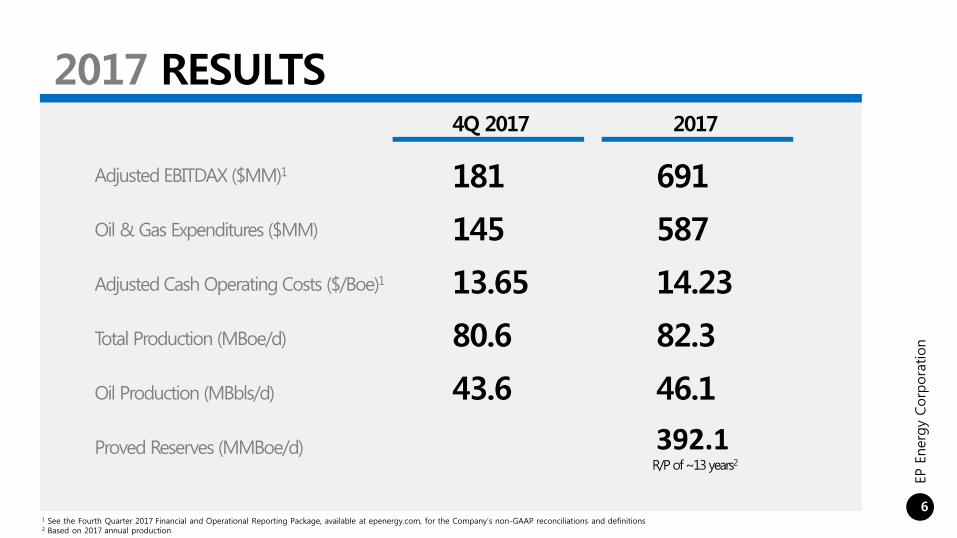
6
2017
691
587
82.3
46.1
Proved Reserves (MMBoe/d) 392.1R/P of ~13 years2
1 See the Fourth Quarter 2017 Financial and Operational Reporting Package, available at epenergy.com, for the Company’s non-GAAP reconciliations and definitions2 Based on 2017 annual production
Adjusted EBITDAX ($MM)1 181
Oil & Gas Expenditures ($MM) 145
Total Production (MBoe/d) 80.6
Oil Production (MBbls/d) 43.6
4Q 2017
2017 RESULTS
Adjusted Cash Operating Costs ($/Boe)1 13.65 14.23

EP E
nerg
y Corp
ora
tion
7
2017 CASH COSTS RESULTS
Lease Operating Expense
$5.42Adjusted G&A2
$2.62Transportation
$3.83Taxes Other Than Income
$2.19
2017 FY RESULTS
Lease Operating Expense
$5.35Adjusted G&A2
$2.45Transportation
$3.30Taxes Other Than Income
$2.55
2018 GUIDANCE1
1 Represents midpoint of 2018 Guidance2 See the Fourth Quarter 2017 Financial and Operational Reporting Package, available at epenergy.com, for the Company’s non-GAAP reconciliations and definitions
($/Boe)
Focused on improving cost efficiency
EP E
nerg
y Corp
ora
tion
8
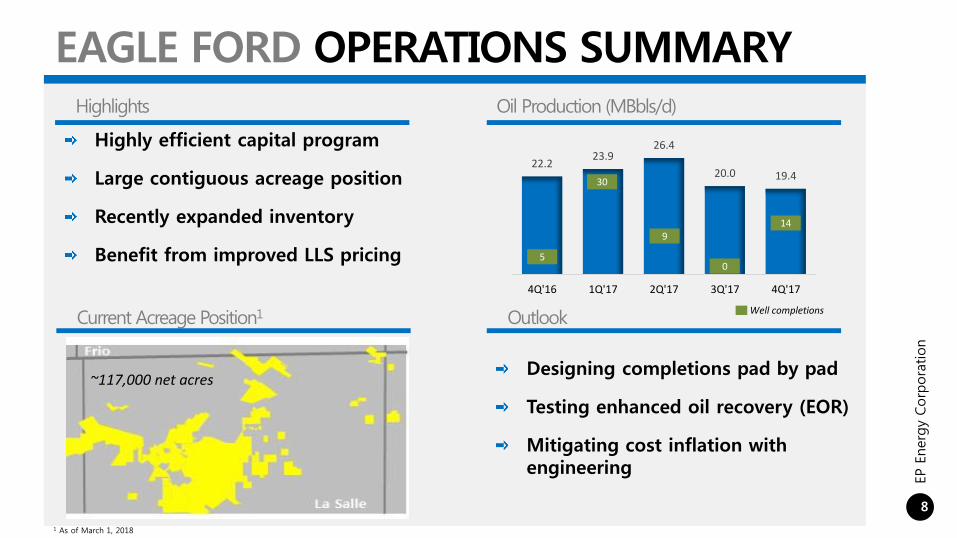
EAGLE FORD OPERATIONS SUMMARY
Highly efficient capital program
Large contiguous acreage position
Recently expanded inventory
Benefit from improved LLS pricing
Highlights Oil Production (MBbls/d)
Current Acreage Position1 Outlook
22.223.9
26.4
20.0 19.4
4Q'16 1Q'17 2Q'17 3Q'17 4Q'17
1 As of March 1, 2018
~117,000 net acres
Well completions
30
5
9
0
14
Designing completions pad by pad
Testing enhanced oil recovery (EOR)
Mitigating cost inflation with engineering

EP E
nerg
y Corp
ora
tion
9
PERMIAN OPERATIONS SUMMARYHighlights Oil Production (MBbls/d)
Current Acreage Position1 Outlook
11.4 11.19.9
12.6 12.0
4Q'16 1Q'17 2Q'17 3Q'17 4Q'17
Multiple zone opportunities
Large contiguous acreage position
Well positioned for increased operational efficiencies
1 As of March 1, 2018
~182,000 net acres
Well completions
11
21 21
32
7
Mitigating cost inflation with design changes
Further reduce operating costs
Water handling facilities
Natural gas-fired frac fleet
Test new zones
New completion techniques
EP E
nerg
y Corp
ora
tion
10
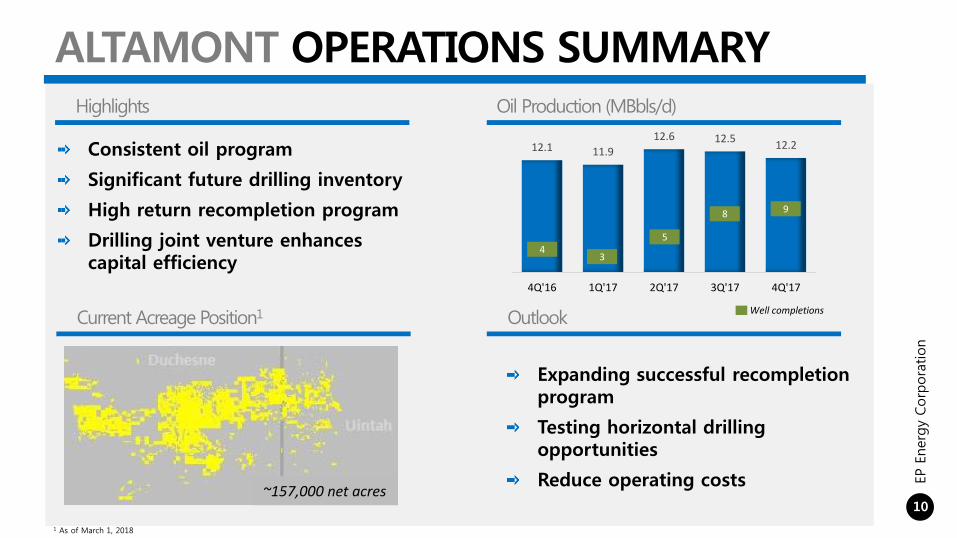
ALTAMONT OPERATIONS SUMMARY
Consistent oil program
Significant future drilling inventory
High return recompletion program
Drilling joint venture enhances capital efficiency
Highlights Oil Production (MBbls/d)
Current Acreage Position1 Outlook
12.1 11.9
12.6 12.512.2
4Q'16 1Q'17 2Q'17 3Q'17 4Q'17
1 As of March 1, 2018
~157,000 net acres
Expanding successful recompletion program
Testing horizontal drilling opportunities
Reduce operating costs
Well completions
34
5
8 9
EP E
nerg
y Corp
ora
tion
11
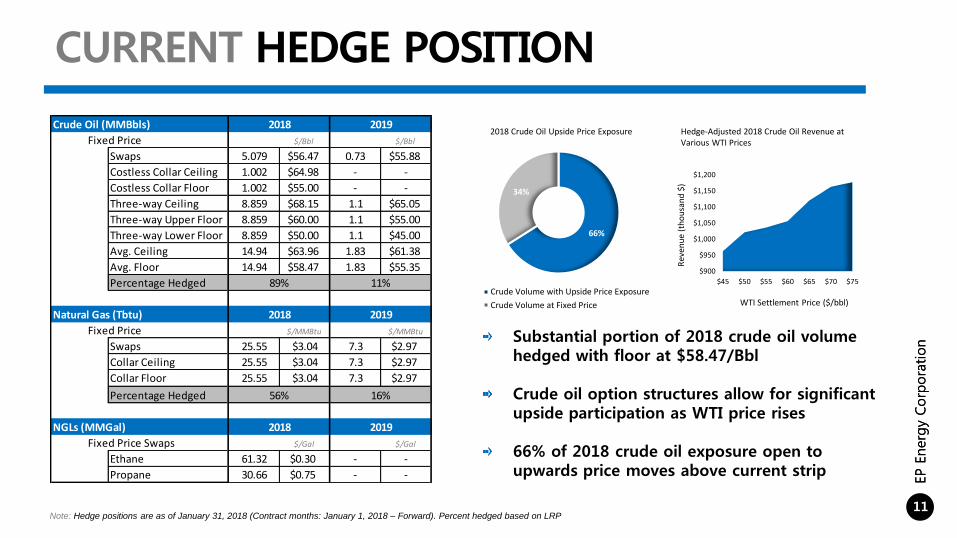
CURRENT HEDGE POSITION
EP E
nerg
y Corp
ora
tion
Note: Hedge positions are as of January 31, 2018 (Contract months: January 1, 2018 – Forward). Percent hedged based on LRP
Substantial portion of 2018 crude oil volume hedged with floor at $58.47/Bbl
Crude oil option structures allow for significant upside participation as WTI price rises
66% of 2018 crude oil exposure open to upwards price moves above current strip
Hedge-Adjusted 2018 Crude Oil Revenue at Various WTI Prices
Rev
enu
e (t
ho
usa
nd
$)
WTI Settlement Price ($/bbl)
2018 Crude Oil Upside Price Exposure
$900
$950
$1,000
$1,050
$1,100
$1,150
$1,200
$45 $50 $55 $60 $65 $70 $75
66%
34%
Crude Volume with Upside Price Exposure
Crude Volume at Fixed Price
Crude Oil (MMBbls)
Fixed Price $/Bbl $/Bbl
Swaps 5.079 $56.47 0.73 $55.88
Costless Collar Ceiling 1.002 $64.98 - -
Costless Collar Floor 1.002 $55.00 - -
Three-way Ceiling 8.859 $68.15 1.1 $65.05
Three-way Upper Floor 8.859 $60.00 1.1 $55.00
Three-way Lower Floor 8.859 $50.00 1.1 $45.00
Avg. Ceiling 14.94 $63.96 1.83 $61.38
Avg. Floor 14.94 $58.47 1.83 $55.35
Percentage Hedged
Natural Gas (Tbtu)
Fixed Price $/MMBtu $/MMBtu
Swaps 25.55 $3.04 7.3 $2.97
Collar Ceiling 25.55 $3.04 7.3 $2.97
Collar Floor 25.55 $3.04 7.3 $2.97
Percentage Hedged
NGLs (MMGal)
Fixed Price Swaps $/Gal $/Gal
Ethane 61.32 $0.30 - -
Propane 30.66 $0.75 - -
2018 2019
89% 11%
2018 2019
2018 2019
56% 16%

EP E
nerg
y Corp
ora
tion
12
INVESTOR UPDATE
Improving Results
4Q’17 Investor Update
March 1, 2018
EP ENERGY CORPORATION