investor relations 3q 2016 -...
TRANSCRIPT
Investor Relations 3Q 2016

History
1
“Leading Authentic Sports Brand Inspired by
the Style, Elegance and Passion of our Italian Heritage”
Founded by FILA
brothers in Biella, Italy
1911
1973
1991
2005
2007
2010
2011
First sports apparel
market (Tennis)
Established FILA Korea
FILA Korea MBO
FILA Korea purchased FILA
trademark and global assets
(USD 400M LBO)
FILA Korea IPO (081660:KS)
FILA Korea & Mirae Asset Global
Investments Consortium acquired
Acushnet Company (USD 1.2B LBO)

2
100% 100%
100%
100%
15%
100%
GLBH Holdings (Acquisition Vehicle)
FILA Luxembourg (Trademark Owner)
FILA Korea (Controlling Shareholder)
Acushnet Holdings
Corp.
Full Prospect (JV with ANTA)
FILA Sport HK (In-house Sourcing)
FILA USA (USA, Canada, Mexico)
Licensee (Global Royalty)
Group Structure
Magnus Holdings
*59.1% (Pre-diluted base)
* On diluted base, Magnus Holdings owns 33.1% of Acushnet Holdings Corp. as of September 30, 2016(common stocks)
51% GLBH Korea

FILA USA
FILA Licensee
FILA China
FILA Korea
FILA Group Business Overview
North America (U.S.A., Canada, Mexico)
Footwear based wholesale distributor
Despite the competitive market condition, FILA USA continued to grow
both the revenue and operating profit on a dollar basis since its turnaround in 2010
Apparel and footwear based retail distributor
Total number of stores: 645 (as of September 30, 2016)
Multi-brand: FILA, FILA GOLF, FILA KIDS, FILA UNDERWEAR
FILA brand renewal began in early 2016 by overhauling its product,
distribution and marketing with a new management team
Joint venture with ANTA Sports from 2009.
Offering premium sports & lifestyle products in China, Hong Kong, and Macau
Contributes 3% of its revenue as Design Service Fee to FILA
Fast growth in revenue since its launching year (CAGR 43%: 2009-2015)
Total 33 licensees in EMEA, North America, Latin America and Asia
Stable contribution by each regional licensees
Direct
Indirect
3
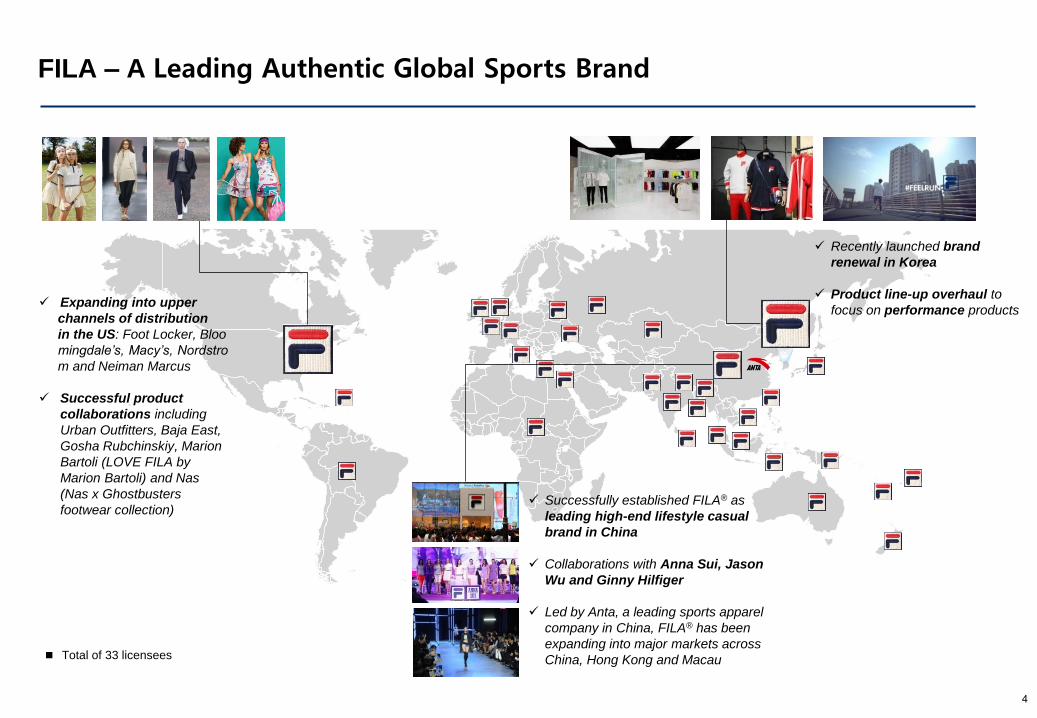
Recently launched brand
renewal in Korea
Product line-up overhaul to
focus on performance products Expanding into upper
channels of distribution
in the US: Foot Locker, Bloo
mingdale’s, Macy’s, Nordstro
m and Neiman Marcus
Successful product
collaborations including
Urban Outfitters, Baja East,
Gosha Rubchinskiy, Marion
Bartoli (LOVE FILA by
Marion Bartoli) and Nas
(Nas x Ghostbusters
footwear collection) Successfully established FILA® as
leading high-end lifestyle casual
brand in China
Collaborations with Anna Sui, Jason
Wu and Ginny Hilfiger
Led by Anta, a leading sports apparel
company in China, FILA® has been
expanding into major markets across
China, Hong Kong and Macau Total of 33 licensees
4
FILA – A Leading Authentic Global Sports Brand

5
Global License Structure (33 licensees)
Global License Business
License period is 5 years (10 years for master licensees)
Based on the wholesale revenue from each licensee
Avg. 6-7% of FILA’s wholesale revenue
Each licensee has minimum guaranteed royalty (MGR) based
on the forecasted revenue
Semi-annual Global Collaboration Meetings (GCM) held to set broad, global
strategic guidelines among all licensees
FILA Luxembourg
(Trademark owner)
EMEA South
America Asia
Global
Product
9 regional
licensees
5 regional
licensees
1 master
licensee
9 global
product
licensee
North
America
1 master
licensees
8 regional
licensees
General License Conditions

13.5% 11.8%
6.8%
13% 14% 10%
38% 44% 50%
49% 42% 40%
3Q YTD 2014 3Q YTD 2015 3Q YTD 2016
FILA Korea FILA USA Royalty & Others OPM
10% 16%
11%
44%
45% 48%
46% 39% 41%
11.0% 9.8%
3.5%
3Q 2014 3Q 2015 3Q 2016
FILA Korea FILA USA Royalty & Others OPM
3Q Revenue Breakdown / OPM (Consol.)
(KRW M)
Consolidated Financial Summary
6
3Q YTD Revenue Breakdown / OPM (Consol.)
(KRW M)
189,347 196,383 175,537 584,030 612,253 552,967

285,259
256,133
223,911
4.6%
1.1%
3Q YTD 2014 3Q YTD 2015 3Q YTD 2016
Revenue OPM
FILA Korea
7
From 2012 Korean economic turmoil created rough environment for many consumer businesses and FILA Korea has started brand restructuring to
overcome economic recession in early 2016
3Q Revenue Breakdown / OPM
3Q YTD Revenue Breakdown / OPM
(KRW M) (KRW M)
deficit(-7.8%)
87,587
76,485 72,401
1.9%
3Q 2014 3Q 2015 3Q 2016
Revenue OPM
deficit(-2.2%) deficit(-13.2%)

F I L A U S A FILA USA Consolidated (Canada and Mexico)
8
Despite the competitive market conditions in the US, FILA USA is continuously penetrating into the upper distribution channel to build broader brand presence
3Q Revenue Breakdown / OPM
3Q YTD Revenue Breakdown / OPM
(USD K) (USD K)
5.9% 5.4% 6.0%
70,855
75,984
75,237
3Q 2014 3Q 2015 3Q 2016
Revenue OPM
7.8% 7.1% 6.7%
212,792
242,251
237,100
3Q YTD 2014 3Q YTD 2015 3Q YTD 2016
Revenue OPM

24% 23% 26%
26% 27%
23%
8% 8%
2%
39%
38%
43%
3%
4%
6%
3Q YTD 2014 3Q YTD 2015 3Q YTD 2016
ASIA N. America S. America EMEA Others
9
Global Royalty
Stable revenue and profit contribution from 33 licensee partners that operate the FILA branded products globally
3Q Royalty Breakdown 3Q YTD Royalty Breakdown
(USD K) (USD K)
29,119
26,770
24,365
23% 22% 22%
26% 30% 25%
9% 6%
5%
39%
39% 43%
2%
3% 4%
3Q 2014 3Q 2015 3Q 2016
ASIA N. America S. America EMEA Others
9,898
9,220 9,219

10
Appendix
3Q 2016 FY 2015 FY 2014
Assets 873,574 978,932 1,043,405
Current Assets 380,292 413,786 371,767
Cash and cash equivalents 54,927 46,938 60,093
Trade and other receivables 107,833 131,500 108,196
Inventories 207,358 222,208 185,846
Other current assets 10,174 13,140 17,632
Non-current Assets 493,282 565,146 671,638
Property and equipment 57,948 44,531 39,523
Intangible assets 373,377 396,637 381,498
Other non-current assets 61,956 123,978 250,617
Liabilities 504,293 499,830 475,018
Current Liabilities 255,979 271,629 197,260
Trade and other payables 94,826 105,402 92,292
Borrowings 144,554 146,037 86,486
Other current liabilities 16,599 20,190 18,482
Non-current Liabilities 248,314 228,200 277,758
Borrowings 125,980 92,572 206,747
Bonds 70,749 75,363 -
Other non-current liabilities 51,585 60,265 71,011
Total Equity 369,281 479,102 568,387
Consolidated Balance Sheet (K-IFRS) (KRW M)

11
Appendix
Consolidated Profit & Loss Summary
FILA Korea Profit & Loss Summary
(KRW M)
(KRW M)
1Q 2014 2Q 2014 3Q 2014 4Q 2014 FY 2014 1Q 2015 2Q 2015 3Q 2015 4Q 2015 FY 2015 1Q 2016 2Q 2016 3Q 2016 YTD 2016
Revenue 89,110 108,562 87,587 112,231 397,490 79,164 100,484 76,485 90,672 346,805 65,458 86,052 72,401 223,911
Gross Profit 50,919 64,918 47,317 57,516 220,669 45,078 58,391 42,080 47,142 192,692 31,459 50,553 34,660 116,672
G.P.(%) 57.10% 59.80% 54.00% 51.20% 55.50% 56.90% 58.10% 55.00% 52.00% 55.60% 48.06% 58.75% 47.87% 52.11%
Operating Profit 2,899 8,605 1,696 (1,345) 11,853 (550) 4,937 (1,670) (6,738) (4,020) (8,057) 229 (9,584) (17,412)
O.P.(%) 3.30% 7.90% 1.90% N/A 3.00% N/A 4.90% N/A N/A N/A N/A 0.27% N/A N/A
Net Income 2,590 2,954 2,505 1,556 9,603 (577) 3,759 213 (3,826) (430) (7,523) 3,547 (18,679) (22,655)
1Q 2014 2Q 2014 3Q 2014 4Q 2014 FY 2014 1Q 2015 2Q 2015 3Q 2015 4Q 2015 FY 2015 1Q 2016 2Q 2016 3Q 2016 YTD 2016
Revenue 199,264 195,419 189,347 213,446 797,476 215,172 200,698 196,383 203,497 815,750 168,202 209,229 175,537 552,968
Gross Profit 95,693 100,454 85,714 95,135 376,996 96,541 97,871 86,219 88,247 368,878 71,985 99,263 74,830 246,078
G.P.(%) 48.00% 51.40% 45.30% 44.60% 47.30% 44.90% 48.80% 43.90% 43.40% 45.20% 42.80% 47.44% 42.63% 44.50%
Operating Profit 29,603 28,564 20,864 14,518 93,549 27,657 25,200 19,158 8,546 80,562 6,305 24,807 6,226 37,338
O.P.(%) 14.90% 14.60% 11.00% 6.80% 11.70% 12.90% 12.60% 9.80% 4.20% 9.90% 3.75% 11.86% 3.55% 6.75%
Net Income 20,827 29,457 21,390 (12,168) 57,590 (30,609) (31,692) (19,883) (53,144) (133,328) 7,340 16,009 (69,536) (46,187)

12
Appendix
FILA USA Consolidated Profit & Loss Summary
Global Royalty Summary
(USD K)
(USD K)
1Q 2014 2Q 2014 3Q 2014 4Q 2014 FY 2014 1Q 2015 2Q 2015 3Q 2015 4Q 2015 FY 2015 1Q 2016 2Q 2016 3Q 2016 YTD 2016
Revenue 77,995 63,942 70,855 66,439 279,231 94,957 71,310 75,984 78,739 320,990 71,436 90,427 75,237 237,100
Gross Profit 26,336 18,379 20,916 16,851 82,482 29,892 20,054 22,618 21,842 94,406 22,529 28,951 22,892 74,372
G.P.(%) 33.80% 28.70% 29.50% 25.40% 29.50% 31.50% 28.10% 29.80% 27.70% 29.40% 31.54% 32.02% 30.43% 31.37%
Operating Profit 8,537 3,796 4,173 719 17,225 8,833 4,299 4,130 2,682 19,944 4,495 6,804 4,542 15,841
O.P.(%) 10.90% 5.90% 5.90% 1.10% 6.20% 9.30% 6.00% 5.40% 3.40% 6.20% 6.29% 7.52% 6.04% 6.68%
Net Income 4,851 1,991 2,163 (223) 8,782 5,164 2,375 1,945 1,406 10,890 2,409 3,924 2,508 8,841
1Q 2014 2Q 2014 3Q 2014 4Q 2014 FY 2014 1Q 2015 2Q 2015 3Q 2015 4Q 2015 FY 2015 1Q 2016 2Q 2016 3Q 2016 YTD 2016
FILA Korea 1,862 2,433 1,967 2,371 8,634 1,508 1,898 1,386 1,616 6,408 1,148 1,540 1,342 4,030
FILA Subsidiary 4,871 2,390 2,645 1,161 11,070 5,417 2,638 3,176 1,558 12,927 2,465 5,411 1,971 9,847
Asia 2,315 2,244 2,314 2,513 9,384 2,110 2,133 2,027 3,206 9,478 2,118 2,128 2,057 6,303
North America 2,195 2,821 2,586 2,905 10,506 2,170 2,223 2,749 2,303 9,427 1,279 1,961 2,346 5,586
South America 664 863 855 812 3,194 707 739 587 678 2,710 -224 330 456 562
EMEA 3,642 3,799 3,901 3,406 14,751 3,227 3,363 3,553 3,504 13,645 3,243 3,354 3,977 10,574
Category 353 325 242 306 1,226 344 534 322 282 1,483 466 493 384 1,343
15,902 14,875 14,510 13,474 58,765 15,483 13,528 13,800 13,147 56,078 10,495 15,217 12,533 38,245
Total
(Adjusted) 9,169 10,053 9,898 9,941 39,061 8,558 8,992 9,219 9,973 36,743 6,882 8,266 9,220 24,368

Disclaimer
13
This document has been prepared for presentation, illustration and discussion purpose only and is not legally binding. Whilst complied from sources FILA Korea believes to
be accurate, no representation, warranty, assurance or inducement express or implied as to the accuracy, completeness or adequacy of freedom from defect of any kind is
made, and the division, group or subsidiary or affiliate of FILA Korea which produced this document shall not be liable to the recipient or controlling shareholders of the
recipient resulting from its use. Nothing herein contains shall be construed as granting the recipient whether directly or indirectly or by implication, any license or right, under
any copy right or intellectual property rights to use the information herein. FILA Korea accepts no liability for any loss or damage of any kind resulting out of the unauthorized
use of this document. Investment involves risk. Past performance figures are not indicative of future performance. Please carefully read through the documents and seek
independent professional advice before you make any investment decision.