investor presentation - vakıfbank · the other shareholders consist of individual or legal...
TRANSCRIPT

1
Investor PresentationBRSA figures as of September 30, 2005
January 2006

2
Following successful IPO in November 2005, c. 25% of Vakifbank of is now listed
Main Shareholders General Directorate of Foundations The GDF manages foundations owning 58.45% of the shares in the Bank (43.0% in the form of Class A shares and 15.45% in the form of Class B shares). The GDF was established in 1924 to administer and regulate existing and future Turkish charitable foundations as a state entity directly reporting to the Prime Minister. Non-Affiliated Foundations The non-affiliated foundations are independent foundations with separate boards of trustees. They currently hold Class B shares, constituting 0.19% of the Bank’s equity. Vakifbank Pension Fund The Vakifbank Pension Fund has a 16.10% stake in the Bank’s capital as a Class C shareholder. The Bank’s employees contribute to the Vakifbank Pension Fund as opposed to the mandatory social security coverage provided by the state Social Insurance Institution. Other Shareholders The other shareholders consist of individual or legal entities that together own 0.08% of the Bank’s equity as Class C Shareholders. Free Float Public domestic and international shareholders.
Ownership structure
General Directorate
of Foundations58,45%
VakifBankEmployee
Pension fund16,10%
Other0,27%
Free float25,18%
3
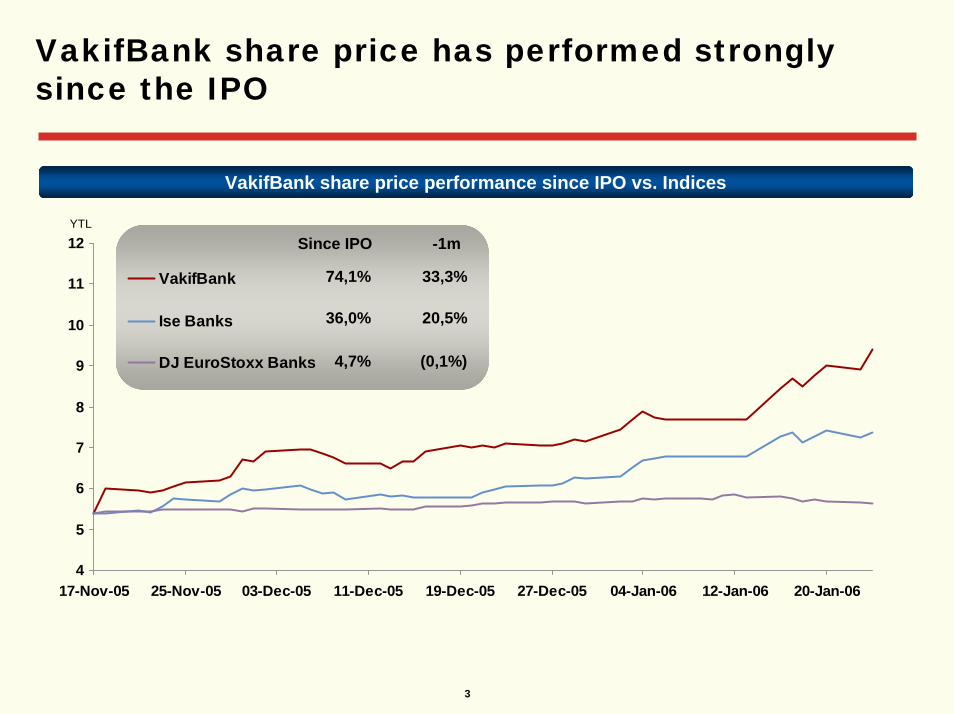
VakifBank share price has performed strongly since the IPO
VakifBank share price performance since IPO vs. Indices
4
5
6
7
8
9
10
11
12
17-Nov-05 25-Nov-05 03-Dec-05 11-Dec-05 19-Dec-05 27-Dec-05 04-Jan-06 12-Jan-06 20-Jan-06
VakifBank
Ise Banks
DJ EuroStoxx Banks
YTL
74,1%
Since IPO -1m
33,3%
36,0% 20,5%
4,7% (0,1%)
4
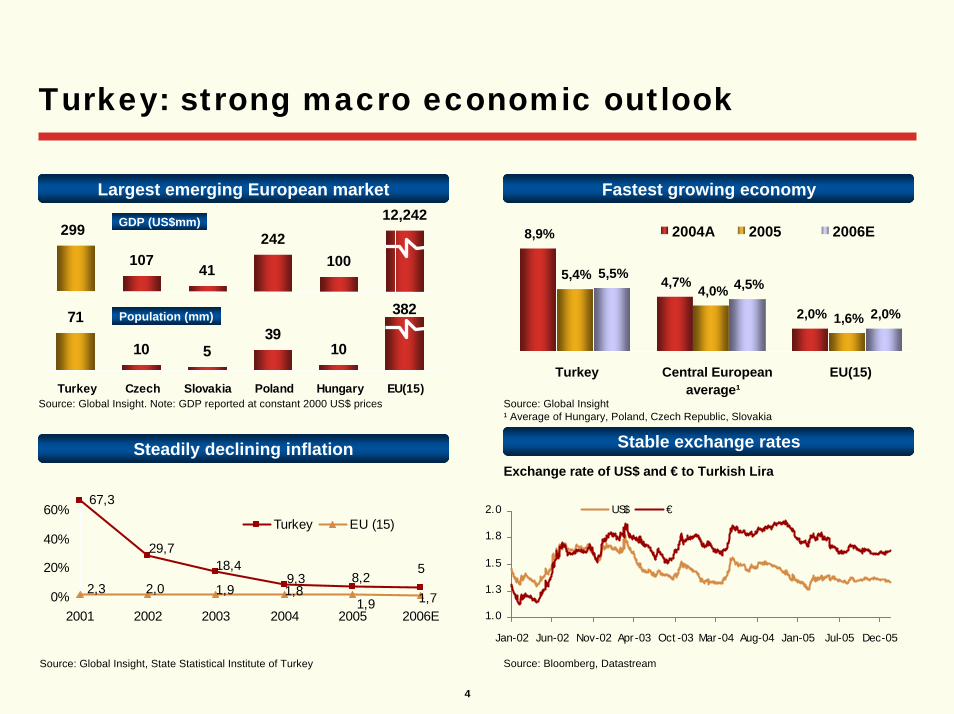
Turkey: strong macro economic outlook
Largest emerging European market Fastest growing economy
71
10 539
10
382
Turkey Czech Slovakia Poland Hungary EU(15)
10741
242100
29912,242
8,9%
4,7%
2,0%4,0%
5,5%4,5%
2,0%
5,4%
1,6%
Turkey Central Europeanaverage¹
EU(15)
2004A 2005 2006E
Steadily declining inflation
Source: Global Insight. Note: GDP reported at constant 2000 US$ prices
Source: Global Insight, State Statistical Institute of Turkey
GDP (US$mm)
Population (mm)
67,3
8,25
9,318,4
29,7
2,3 2,0 1,9 1,81,9 1,70%
20%
40%
60%
2001 2002 2003 2004 2005 2006E
Turkey EU (15)
Source: Global Insight¹ Average of Hungary, Poland, Czech Republic, Slovakia
Stable exchange rates
Source: Bloomberg, Datastream
Exchange rate of US$ and € to Turkish Lira
1.0
1.3
1.5
1.8
2.0
Jan-02 Jun-02 Nov-02 Apr-03 Oct-03 Mar-04 Aug-04 Jan-05 Jul-05 Dec-05
US$ €

5
Banking sector: rapid and profitable growth
Strong recovery following 2001 Low penetration ratios (2004)
• Strong lending and deposit growth• Good regulatory environment and reporting
standards• Good asset quality• Still high interest margins, though declining trend• Strong capitalization• High foreign strategic investor interest
48%
111%
60%42%
56%42%34%
88%
36%
16%
37%50%
TurkeyCzech RepSloveniaHungaryPolandEurozone
Deposits/GDP Loans/GDP
Source: Central Bank of Turkey; Central Banks of respective countries
Untapped mortgage market Improved loan quality
35%
17%6% 5% 2% 2,5%
EU
Hun
gary
Cro
atia
Pol
and
Cze
chR
epub
lic
Turk
ey
Mortgage loans/GDP
5.480 4.997
9.599
4.756 6.193 6.361
5,1%5,8%11,1% 5,3%
27,2%16,5%
2001 2002 2003 2004 1H05 3Q05
NPLs (US$mm) NPLs/loans
5,1%
Source: Central Banks Source: Turkish Banks Association reports under BRSA standards

6
VakıfBank at a glance
7.8% market share in assets with over 5.8mm customers and 10mm debit cards302 branches and 114 satellite branches nationwideStrong alternative distribution channels (1,812 ATMs)Strong balance sheet growth and profitability
Strong balance sheet growth (YTLbn) Impressive profitability (YTLmm)
1.444,4
975,6
Operating income(before provisioning)20,4
10,0
8,1
5,4
17,6
14,5
2003 2004 3Q05
Loans Deposits
1.188,1
3Q03 3Q04 3Q05
(YTLmm) 2003 2004 3Q05
Total assets 19.487 24.199 28.580Shareholders’ equity 1.335 2.012 2.528CAR 14,9% 17,3% 18,5%
1
1
Source: Annual and Interim reports, BRSA- Bank-only financials
2003 3Q04 3Q05Cost/income 52,4% 45,7% 36,5%RoAE 19,8% 27,6% 21,7%
Source: Annual and Interim reports, BRSA bank only financials1 2003 numbers restated to 2004 according to inflation accounting

7
Superior growth and profitability prospects
5th largest bank in the fast growing Turkish market
Strengths in fastest growing segments and well developed distribution network• Leading consumer and SME products• Extensive nationwide branch network and well developed alternative channels
Excellent client relationships and cross-selling potential to large customer base• 5.6mm retail customers, of which 1.9mm payroll customers • Leading long-lasting SME franchise with over 105,000 customers • Unique access and understanding of State related companies • Significant recent investment is unlocking important cross-selling potential
Superior financial performance• Solid balance sheet with diversified sources of funding
• Cost conscious culture with focus on profitability instead of market share

8
Balance sheet is supported by a strong TL deposit base
Deposits/liabilities and equity
Total TL deposits¹(YTLmm) (3Q05)
Total FX deposits¹(YTLmm) (3Q05)
Excellent deposit franchise to fund a significant portion of its liabilitiesStrong TL deposit franchise – Third largest among Turkish private banks in terms of TL deposits• Particular strength has been establishment of relationships with companies and public sector
entities in order to obtain employees’ salary accounts, contributing toward maintenance of a stable source of deposit funding
Relatively lower FX deposit base
6,366
14,769 14,145
7,635
9,701
Vakif IS AK YKB GAR
71.5
%
58.9
%
63.2
%
67.4
%
62.1
%
63.1
%
72.7
%
67.0
%
57.1
%
58.0
%
Vakif IS AK YKB GAR20043Q05
14,060
17,98416,615
7,903
10,382
Vakif IS AK YKB GAR
Source: BRSA Bank Only financials¹ Time and demand split based on BRSA financials, Deposit figures exclude Interbank deposits

9
VakıfBank is a market leader, particularly in retail and SME finance…
Total market share (%) (3Q05)
8.8%
29.0% *
13.8%
4.8%
12.4%
4.9%
22%
TotalDeposits
TL deposits ATMs Debit Card #Public Salary
accounts
Mutual funds Branches
7.4%6.8%
16.4%
HousingLoans4
CommercialInstalment
Loans
Creditcards
7.3%10.4%
Retailloans³
Total loans
Deposits / Funding Credits Distribution
Source: Turkish Banks Association reports under bank-only BRSA standards as of September 30, 2005, Capital Markets Board* VakıfBank estimates, MIS
² Total banking system loans = Short term + Medium and Long Term + Loans under Follow up - Specific Provisions³ Includes home, auto and other. Credit card loans, overdrafts, and State Mass Housing Authority (TOKI) loans not included4 Including TOKI housing loans

10
... moving today to a strong position among top Turkish banks
14,3%
13,7%
10,8%
9,1%
7,3%
7,3%
5,0%
4,1%
3,5%
2,6%
Akbank
Isbank
Garanti
Ziraat
Yapi Kredi
VakifBank
Finansbank
Kocbank
Halkbank
Fortis Bank
Ranking by total loans Ranking by total deposits Ranking by branches
20,3%
13,3%
14,2%
8,8%
8,5%
8,7%
6,7%
3,4%
2,5%
1,6%
Ziraat
Akbank
Isbank
VakifBank
Halkbank
Garanti
Yapi Kredi
Kocbank
Finansbank
Fortis Bank
18,6%
14,1%
10,6%
9,6%
6,6%
6,8%
4,9%
3,1%
2,8%
2,8%
Ziraat
Isbank
Akbank
Halkbank
Yapi Kredi
Garanti
VakifBank
Finansbank
Fortis Bank
Kocbank
Total banking system: USD 271 bn
Total banking system: USD 172 bn
Total banking system: 6,053 branches
State owned banksSource: Turkish Banks AssociationAs at 3Q05

11
VakıfBank’s vision: on the path to becoming a top three private bank
Targetprofitable
growth
Focus onretail and
SMEs
Becomeprimary
bank for itscustomers
Becomeone of
Turkey’s top 3 private banks
Where is the potential? Evidence of future potential
Leverage key strengths
Very large existing SME & retail customer base that is still untapped
Improving cross-selling, which is significantly below that of peer banks• limited sales effort in the past• low historic advertising spend
Grow network in under-penetrated regions
Consistent market share growth since 1999 demonstrates embedded strengths
Tapping key segments with targeted marketing programs
Management focus on sales effort
Ongoing company wide restructuring is well advanced and pilot projects show impressive results
Strong positioning and competitive advantage in Ankara and Anatolian Turkey

12
A leading retail franchise
Key retail strengths c.50% CAGR in retail lending
A leading YTL franchise in the market
Over 5.6mm customers, of which 1.9mm highly valuable payroll customers
Leader in consumer lending, excl. credit cards
Well positioned to benefit from the expected significant growth in housing loans
Good retail loan portfolio quality
Major opportunity to increase cross-selling ratio (incl. insurance and leasing products of subsidiaries)
Y T Lm n 2003 2004 3Q 05
C A G R 2003–3Q 05
H ous ing ¹ 287 439 803 80 .0%
C red it cards 391 598 706 40 .2%
A u to 166 388 257 28 .4%
O ther 921 1 .243 1 .571 N /M
T ota l re ta il 1 .765 2 .668 3 .337 43 .9%
Source: BRSA bank only financials, VakıfBank, inflation adjusted¹ House loans include TOKI-funded loans
High lending yields (%) Continued strength in YTL deposit market share
Credit cards OverdraftIns talm ent (Retail+Corporate) Interbank avg bid rate
Source: BRSA bank only financials, VakıfBank
58,8
36,1
38,6 36,8
48,6
61,4
41,7 45,6
72,6
27,629,441,7
49,7
21,815,6
49,6
2002 2003 2004 1H05
11.7%12.3%
9.8%8.8%
9.9%
9.7%
2003 2004 3Q05
Demand (YTL) Term (YTL)
Source: BRSA bank only financials

13
Strong corporate and SME lending culture
Attractive client and product mix Number of SME clientsSuperb focus on SMEs• # of SME clients increased from 40,000 (2002) to
105,000 (3Q05)• Successful introduction of relationship managers • Diversified portfolio of products• Unique relationships with financing organisations
(World Bank, EIB, CEDB, KOSGEB and others)Traditionally strong with large corporatesAccelerate development of project finance activities Source: VakıfBank
99,000105,000
52,000
2003 2004 3Q05
Corporate lending growthCorporate loans average yields
44.2
24.720.7 20.3
7.88.49.39.6
6.96.77.59.6
2002 2003 2004 H1 2005
TL FX-indexed FX
(YTLmm) 2003 2004 3Q05
CAGR 2003 – 3Q05
Short term (<1 year) 1.868 2.265 2.504 18.2%
Long term (>1 year) 865 1.238 1.675 45.9%
Instalment 712 1.730 2.204 90.7%
Other 157 161 281 39.5%
Total 3602 5.394 6.664 42.1%
Source: BRSA bank only, VakıfBank, Note: Instalment loans best proxy for SME lending
Source: BRSA bank only financials, VakıfBank

14
Well-developed distribution network with unique reach
No. of branches (top 10 banks by assets) Branch network strategy
Well distributed nationwide branch networkRegional strengths in Ankara, Anatolia and Eastern Turkey—up to 40% market share in some regionsPlans for further expansion in Istanbul and Marmara on a selective basisCurrent restructuring to increase sales focus
302
1.146
869
654
418
592
405
416
172194
219
Ziraat
IsBan
k
HalkBan
k
AkBan
k
YKB
Garanti
VakifB
ank
Denizb
ank
Finansb
ank
KocBan
k
114
Alternative channels
Second largest ATM networkInternet banking since 2000— # of customers increased from 500,000 in 2003 to over 731.000 in September 2005Mobile Phone bankingCall centre with 100 staffMobile banking
Branches Satellite branches
Source: Turkish Banks Association, BRSA bank only , 3Q05

15
11,7%14,2% 11,8%
40,3%35,5%
35,7%
35,0%33,3%27,5%
8,2%5,5%
3,5%
5,7% 4,6% 5,8%
2003 2004 3Q05Loans Interbank¹ Securities Fixed Assets Other²
19,5 24,2 28,6
Loans/deposits increased from 37,1% in 2003 to 49,0% in 3Q05
Relatively low and declining share of non-interesting earning assets with increasing share of lending
Below peers ratio of fixed assets to total assets
Continued effort to rationalise fixed assets and equity participations portfolio
Continued enhancement of asset mix
Increasing share of earning assets Breakdown of assets (YTLbn)
Source: BRSA bank only¹ Interbank includes also balance with Central Bank and reverse repos² Other assets include: Liquid assets, Trade receivable and Sundry
Debtors, Equity Participation and Other
Fixed assets/Total assets, 3Q05
3,9%
1,3%
3,5%4,4%
5,8%
Vakifbank Akbank IS Garanti YKB
Source: Turkish Banks Association, BRSA bank only , 3Q05
Average: 3,8%
16
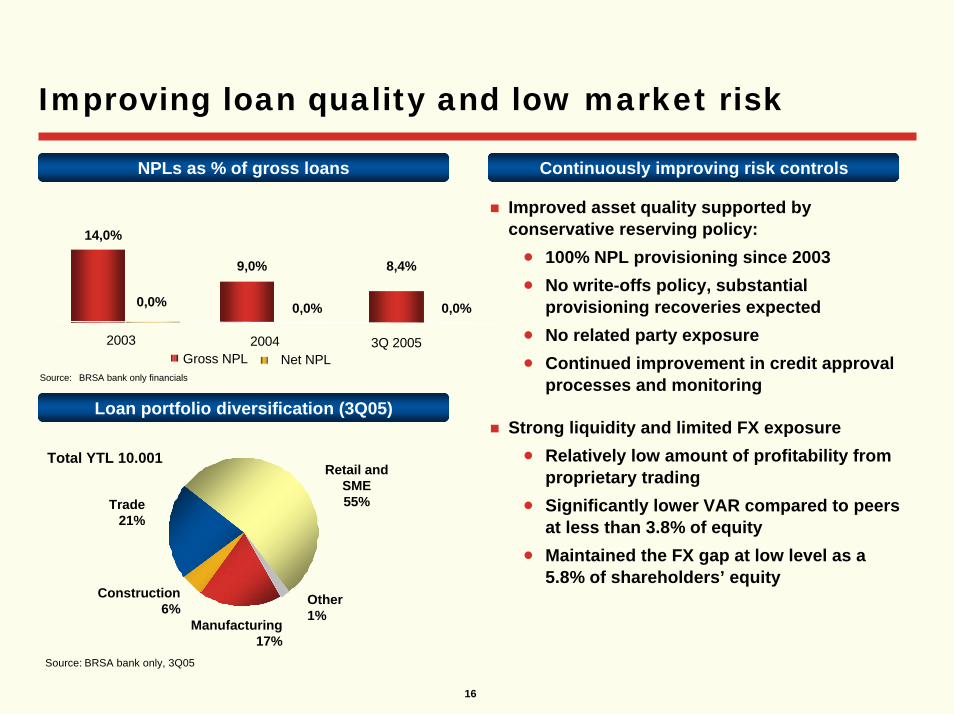
Improving loan quality and low market risk
NPLs as % of gross loans Continuously improving risk controls
14,0%
9,0% 8,4%
0,0% 0,0% 0,0%
2003 2004 3Q 2005Gross NPL Net NPL
Improved asset quality supported by conservative reserving policy:• 100% NPL provisioning since 2003• No write-offs policy, substantial
provisioning recoveries expected• No related party exposure• Continued improvement in credit approval
processes and monitoring
Strong liquidity and limited FX exposure• Relatively low amount of profitability from
proprietary trading• Significantly lower VAR compared to peers
at less than 3.8% of equity• Maintained the FX gap at low level as a
5.8% of shareholders’ equity
Source: BRSA bank only financials
Manufacturing17%
Construction6%
Trade21%
Retail and SME55%
Other1%
Total YTL 10.001
Loan portfolio diversification (3Q05)
Source: BRSA bank only, 3Q05

17
Diversifying & strengthening core revenue generation
Improving profitability (YTLmm)
Future margin pressure to be partially offset by increased share of loans in total assets
Potential to further expand fee & commission income as part of cross-selling initiatives
Aim to maintain strong cost control culture
Strong revenue generation and cost control
319.9
527.8
1444.4
1002.3
539.8543.3
1188.1
864.8
3Q04 3Q05
+15.9
+21.6%
(2.8)%
+68.7
Net Interest Income
Total Banking Income
Operating expense
Net operating income²
Source: BRSA bank only financials

18
40.653.0 36.5
4.0
2.53.0
2003 2004 3Q05
Cost/income
Cost/assets
Stringent cost control and conservative provisioning
Cost control measures (%) Loan loss provisions/NPLs (%)
Comments
Vakifbank maintained strict cost controls keeping C/I ratio at below 40%
• Future cost increases planned mainly in marketing
Provisioning expense were affected by conservative provisioning ahead of IPO -YTL192mm of general reserves in Q105
Source: BRSA bank only financials¹ Annualised
Source: BRSA bank only financials
100.0%100.0% 100.0%
2003 2004 3Q05
Loan loss provisions/NPLs (%)
5.1%9.0%
5.6%¹
2003 2004 3Q05

19
Consistently delivering impressive results
Strong profitability driven by enhanced balance sheet structure Continued improvement in asset quality and more prudent (100%) reserving policyImproved cost efficiencies following rationalization of branch network
Operating income and Net income evolution—YTLmm RoAE (%)
3 year average: 26.3%
264
624
307370
706
1,279
522
813
2003 2004 3Q05 3Q05
Net Income
OperatingIncome¹
21.7%
37.3%
19.8%
2003 2004 3Q05
+55.8% Y-o-Y
Source: BRSA bank only financials¹ Excluding provisions and other operating income (recoveries are significant portion of other operating income)

20
Strong foundations for profitable growth
EXISTING STRENGTHS FUTURE GROWTH DRIVERS
Retail and SME products and platform Healthy macro environment
5.6mm retail customers Sector growth potential, especially retail and SMEs
Extensive nationwide network High cross selling potential
Very high cost efficiency Further non-interest income improvement
Highest profitability in sector Lower loan loss provisioning
STRONG LONG TERM GROWTH AND PROFITABILITY

21
Appendices

22
Balance sheet details: assets
Key financials
CAGR2003-3Q0520042003(YTLmm) 3Q05
Liquid Assets 163 180 256 29%Balances With The Central Bank 301 555 929 90%Balances With Banks 1.965 2.233 2.235 8%Interbank Funds Sold 313 1.100 1.150 -96%Trading Securities Portfolio 5.517 2.678 1.090 -60%Available for Sale Portfolio 1.339 5.365 8.526 188%Reserve Deposits at the Central Bank 814 935 1.140 -98%Loans 5.367 8.062 10.001 43%Sundry Debtors 80 63 132 33%Equity Participations 548 184 549 0%Held to Maturity Securities 581 1.002 552 -3%Premises & Equipment 1.119 1.127 1.029 -5%Other Assets 51 204 183 108%Total Assets 19.487 24.199 28.580 24%
Source: BRSA –Bank Only Financials
23
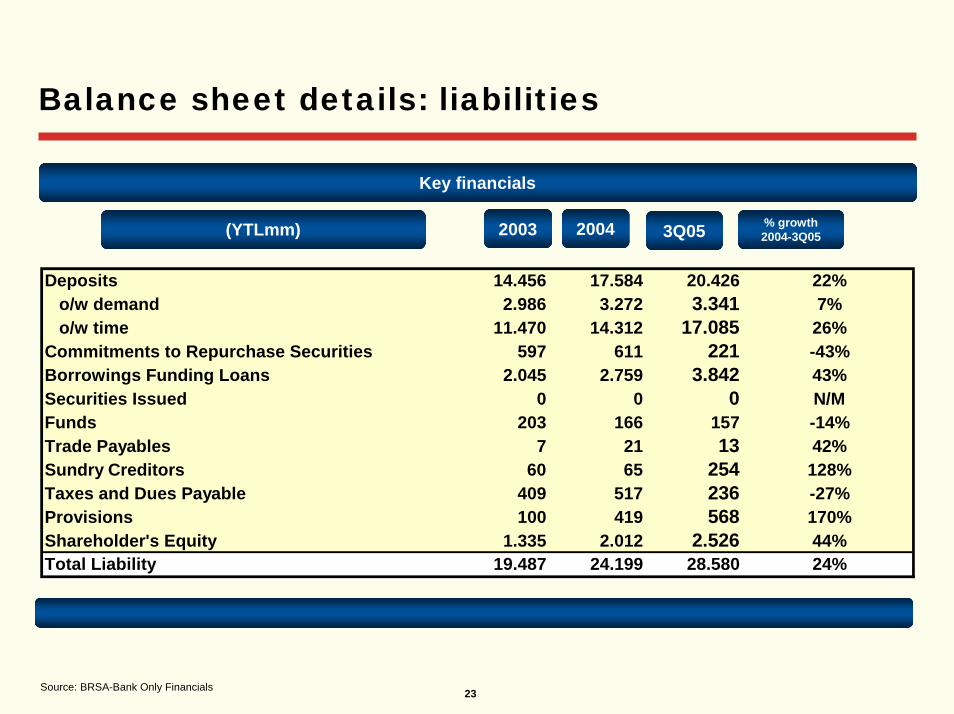
Balance sheet details: liabilities
Key financials
20042003(YTLmm) 3Q05 % growth 2004-3Q05
Deposits 14.456 17.584 20.426 22% o/w demand 2.986 3.272 3.341 7% o/w time 11.470 14.312 17.085 26%Commitments to Repurchase Securities 597 611 221 -43%Borrowings Funding Loans 2.045 2.759 3.842 43%Securities Issued 0 0 0 N/MFunds 203 166 157 -14%Trade Payables 7 21 13 42%Sundry Creditors 60 65 254 128%Taxes and Dues Payable 409 517 236 -27%Provisions 100 419 568 170%Shareholder's Equity 1.335 2.012 2.526 44%Total Liability 19.487 24.199 28.580 24%
Source: BRSA-Bank Only Financials

24
Income statement
(YTLmm) 3Q053Q03 3Q04 % growth 3Q03-3Q05
Interest Income 1.889 2.217 2.645 19%Interest Expense -1.674 -1.353 -1.643 21%Net Interest Income 830 865 1.002 19%Operating Income 1.141 1.188 1.444 -42%Net Banking Income 254 320 540 69%Income /(Loss) from Associates 16 14 4 -71%Monetary Gain/(Loss) 11 -8 0 NMIncome Before Taxes 280 326 544 67%Provisions for Taxes on Income 0 -19 -174 NMNet Income 280 307 370 21%
Source: BRSA Bank Only Financials

25
THANK YOU