investor presentation september 2019 - marine money...teekay offshore too 30 hoegh lng partners hmlp...
TRANSCRIPT

Investor PresentationSeptember 2019

2
2
This presentation contains certain statements that are deemed to be “forward-looking statements” within the meaning ofapplicable U.S. federal securities laws. All statements, other than statements of historical facts, (including, without limitation,statements that address activities, events or developments that Ardmore Shipping Corporation (“Ardmore,” “ASC,” or the“Company”) “estimates”, “expects,” “projects,” “believes,” or “anticipates” will, or may occur in the future) are forward-lookingstatements, including, without limitation, statements about: future operating or financial results; global and regional economicconditions and trends; tanker market fundamentals, including the balance of supply and demand in the tanker market, theestimated growth in the world tanker fleet, the amount of tanker deliveries and scrapping, estimated growth in global oil andrefined products demand and supply, tanker demand and future charter rates; improvements in the tanker market; the effect ofthe IMO 2020 regulations on tanker demand and rates, and refining throughput and maintenance levels; the location andtiming of refining capacity growth; the Company’s business strategy, market outlook and fleet performance; future vesselacquisitions; the potential effect on the Company’s earnings per share of tanker rate increases; estimated revenue days andthe timing of drydockings and ballast water treatment system installations; and the Company’s financial condition and liquidity.The following factors are among those that could cause actual results to differ materially from the forward-looking statements,which involve risks and uncertainties, and that should be considered in evaluating any such statement: changes in theproduction of, or demand for, oil or refined products; changes in trading patterns significantly affecting overall vessel tonnagerequirements; greater, or less than anticipated levels of tanker newbuilding orders and deliveries and greater, or less thananticipated rates of tanker scrapping; changes in global oil prices; changes in applicable industry laws and regulations and thetiming of implementation of new laws and regulations, and the actual effect of the IMO 2020 regulations; the actual timing andlocation of any changes in refining capacity; changes in factors that would affect the Company’s earnings per share, including,among other things, the number of the Company’s outstanding common shares and fleet size; the availability on acceptableterms of second-hand vessels; increased costs; increased vessel off-hire; the amount of future cash flows and earnings of theCompany; and other factors discussed in the Company’s filings from time to time with the United States Securities andExchange Commission (“SEC”), including its Report on Form 20-F for the fiscal year ended December 31, 2018. TheCompany expressly disclaims any obligation or undertaking to release publicly any updates or revisions to any forward-lookingstatements contained herein to reflect any change in the Company’s expectations with respect thereto or any change inevents, conditions or circumstances on which any such statement is based.
For more complete information about the Company, the information in this presentation should be read together with theCompany’s filings with the SEC which may be accessed on the SEC website at www.sec.gov .
Disclaimer

3
I. Company Overview
II. Product Tanker Industry
3
IV. Financial Overview
V. Investment Summary
VI. Appendix
III. Attractive Market Outlook
Contents

4
4
High Quality Fleet:25 x “Eco” Product
Tankers
Fully Integrated Shipping Company
Financial Disciplineand Focus on ROIC
Low CostPlatform & Focuson Performance
Highly Attractive
Market Outlook
ShareholderFriendly
CorporateGovernance
Ardmore Investment Thesis

5
5
Modern, highly fuel efficient fleet of MRs
Average age of 6.2 years(1)
Built at high-quality yards in Korea and Japan
Quality fleet = lower operating costs, higher utilization and maximum value appreciation
Complementary fleet
High Quality Vessels Vessel Name Type Dwt Tonnes IMO Built Country Flag SpecificationArdmore Seavaliant Product/Chemical 49,998 2/3 Feb-13 Korea MI Eco-designArdmore Seaventure Product/Chemical 49,998 2/3 Jun-13 Korea MI Eco-designArdmore Seavantage Product/Chemical 49,997 2/3 Jan-14 Korea MI Eco-designArdmore Seavanguard Product/Chemical 49,998 2/3 Feb-14 Korea MI Eco-designArdmore Sealion Product/Chemical 49,999 2/3 May-15 Korea MI Eco-designArdmore Seafox Product/Chemical 49,999 2/3 Jun-15 Korea MI Eco-designArdmore Seawolf Product/Chemical 49,999 2/3 Aug-15 Korea MI Eco-designArdmore Seahawk Product/Chemical 49,999 2/3 Nov-15 Korea MI Eco-designArdmore Endeavour Product/Chemical 49,997 2/3 Jul-13 Korea MI Eco-designArdmore Enterprise Product/Chemical 49,453 2/3 Sep-13 Korea MI Eco-designArdmore Endurance Product/Chemical 49,466 2/3 Dec-13 Korea MI Eco-designArdmore Explorer Product/Chemical 49,494 2/3 Jan-14 Korea MI Eco-designArdmore Encounter Product/Chemical 49,478 2/3 Jan-14 Korea MI Eco-designArdmore Exporter Product/Chemical 49,466 2/3 Feb-14 Korea MI Eco-designArdmore Engineer Product/Chemical 49,420 2/3 Mar-14 Korea MI Eco-designArdmore Seamariner Product/Chemical 45,726 3 Oct-06 Japan MI Eco-modArdmore Sealancer Product 47,451 — Jun-08 Japan MI Eco-modArdmore Sealeader Product 47,463 — Aug-08 Japan MI Eco-modArdmore Sealifter Product 47,472 — Jul-08 Japan MI Eco-modArdmore Dauntless Product/Chemical 37,764 2 Feb-15 Korea MI Eco-designArdmore Defender Product/Chemical 37,791 2 Feb-15 Korea MI Eco-designArdmore Cherokee Product/Chemical 25,215 2 Jan-15 Japan MI Eco-designArdmore Cheyenne Product/Chemical 25,217 2 Mar-15 Japan MI Eco-designArdmore Chinook Product/Chemical 25,217 2 Jul-15 Japan MI Eco-designArdmore Chippewa Product/Chemical 25,217 2 Nov-15 Japan MI Eco-designTotal 25 1,111,294 6.2
High Quality Fleet of “Eco” MRs
1. Average age as at September 20, 2019

6
6
Name Experience (Years) Past Positions
Anthony Gurnee 37CEO
Mark Cameron 35COO
Paul Tivnan 17CFO
Gernot Ruppelt 17CCO
CEO of Industrial Shipping Enterprises, COO of MTM Group and CFO of Teekay Shipping Corp. Shipping financier with Citicorp and U.S. Naval Officer MBA, CFA, Fellow of the Institute of Chartered Shipbrokers
VP of Strategy and Planning at Teekay Marine Services Fleet Manager at AP Møller-Maersk Chief Engineer at Safmarine Director West of England P&I and former Chairman of International Parcel Tankers Association
(IPTA)
Formerly at Ernst & Young, Financial Services Advisory Fellow of the Institute of Chartered Accountants of Ireland and the Irish Taxation Institute Member of the Institute of Chartered Shipbrokers Graduate of London Business School and INSEAD; Executive Leadership Programme
Tanker Broker at Poten & Partners Trade Manager Maersk Broker / AP Møller-Maersk (Copenhagen, Singapore, Germany) Graduate of Hamburg Shipping School and Member of the Institute of Chartered Shipbrokers Chairman of INTERTANKO’s Commercial & Markets Committee
Decades of Experience with Industry Leading Companies
Senior Management Team

7
Name Experience
Curtis McWilliamsChairman of the Board
Brian DunneChair of Audit Committee
Mats BerglundDirector
Helen Tveitan de JongDirector
Dr. Peter SwiftDirector
Dr. Kirsi Tikka(2)
Director
Director of Ardmore since 2016 and appointed Chairman of the Board effective January 2019 President and CEO of CNL Real Estate Advisors, Inc. and President, CEO and Director of Trustreet
Properties Inc.
Director of ReAssure Group, Ark Life Assurance Company, Aergen Aviation Finance and Chorus Aviation Capital
CFO and President of ACE Aviation Holdings Inc., CFO and Director of Aer Lingus Group plc.
Director and CEO of Pacific Basin CFO and COO at Chemoil Energy, Senior VP Overseas Shipholding Group Group Controller of Stena Line, VP and CFO of Concordia Maritime and StenTex, President of StenTex,
VP and President of Stena Rederi
Chairman of Carisbrooke Holdings and CEO of Carisbrooke Shipping Ltd. Established and headed the London branch of DVB Nedship Bank (1996 – 2001), Founding Partner at
THG Capital (2001 – 2007)
Director of Ardmore since its IPO in August 2013 Managing Director of INTERTANKO, Director of Seascope Shipping Ltd. Over 24 years experience with Royal Dutch Shell in a range of commercial and technical roles
7
Director Pacific Basin, Foreign Member of the U.S. National Academy of Engineering and a member of UK Women in Maritime Task Force
18 years experience with American Bureau of Shipping (ABS) in various specialist and leadership positions Professor of Naval Architecture at the Webb Institute in New York
Fully Independent Board of Directors(1)
1. Excludes executive director, Anthony Gurnee (CEO)2. Dr. Kirsi Tikka joined the board of Ardmore on September 23, 2019

8
8
ASC ranked in the top tier of US public shipping companies for corporate governance:
o Ranked No. 1 Product Tanker Company
o Ranked No. 1 Foreign Private Issuer
Fully independent Board of Directors(2); decades of experience in shipping and finance
No related party and affiliated transactions
Commentary Shipping Corporate Governance Ranking(1)
Quartile 1
1 Eagle Bulk Shipping EGLE2 International Seaways INSW3 Overseas Shipholding Group OSG4 Triton TRTN5 Ardmore Shipping Corporation ASC6 Matson MATX7 Euronav EURN8 Kirby Corporation KEX9 Genco Shipping and Trading GNK
10 Navigator Gas NVGS11 World Fuel Services INT12 Gaslog GLOG13 Double Hull Tankers DHT14 CAI International CAI
Quartile 2
15 Textainer Group Holdings TGH16 Seacor Holdings CKH17 Teekay Tankers TNK18 Grindrod GRIN19 Golar GLNG20 Golden Ocean Group GOGL21 Teekay TK22 Flex LNG FLEX23 Frontline FRO24 New Fortress Energy NFE25 Ship Finance International SFL26 Gaslog Partners LP GLOP27 Hunter Group ASA OB:HUNT28 Dorian LPG
Quartile 3
29 Teekay Offshore TOO30 Hoegh LNG Partners HMLP31 Torm TRMD32 Avance Gas AVANCE33 Seaspan SSW34 BW LPG BWLPG35 Nordic American Tankers NAT36 Golar LNG Partners GMLP37 Teekay LNG Partners TGP38 Diamond S DSSI39 Navios Maritime Holdings NM40 Seadrill Partners SDLP41 Star Bulk SBLK42 Costamare CMRE
Quartile 4
43 Navios Maritime Partners NMM44 Navios Maritime Acquisition Corp. NNA45 Scorpio Bulkers SALT46 Global Ship Lease GSL47 Knot Offshore Partners LP KNOP48 Capital Product Partners CPLP49 Scorpio Tankers STNG50 Dynagas DLNG51 Diana Shipping Inc. DSX52 Tsakos Energy Navigation TNP53 Stealth Gas Inc. GASS54 Safe Bulkers SB55 Danaos Corporation DAC56 Dry Ships DRYS
Industry Leading Corporate Governance
1. Wells Fargo Corporate Governance Scorecard Volume VI issued May 6, 20192. Excludes executive director, Anthony Gurnee (CEO)

9
9
In the short run, it’s all about the market
But over the longer term, it’s all about performance
Our strategy is driven by long-term value creation on a through-the-cycle basis
Ardmore takes a holistic approach:
o ROIC TTC vs. WACC
o Organizational effectiveness and efficiency
o Operational performance
o Capital allocation effectiveness
o Financial risk management
Since IPO in 2013 we have grown from 8 to 25 ships including 6 sales on a well-timed sales
We have also developed a fully in-house organization with a global foot print and high-performance culture
In challenging markets, shareholder value preservation is vitally important; Ardmore has excelled in this regard
We are now well positioned to capture the upside in the months ahead
Performance-Driven Strategy

10
Ardmore has been at the forefront of environmental and social progress for many years:
o One of the most fuel efficient fleets from the start (eco-design and eco-mod)
o Dedicated to operational efficiency as a means to further carbon reduction
o No scrubber installations on ships – IMO 2020 compliant fuel only
o Engaged in technical projects and initiatives contributing toward reaching IMO 2030/2050 targets
o First shipping company to report carbon emissions in its public filings on a quarterly basis
o Participation on the advisory board of the Carbon War Room
o Member of Maritime Anti-Corruption Network (MACN) for over five years
o Diversity as a real strength (12 nationalities, 50/50 gender balance across all departments)
Performance and progress are integral for Ardmore
10
Environmental and Social Progress

11
I. Company Overview
II. Product Tanker Industry
11
IV. Financial Overview
V. Investment Summary
VI. Appendix
III. Attractive Market Outlook
Contents

12
12
Oil Value Chain
13
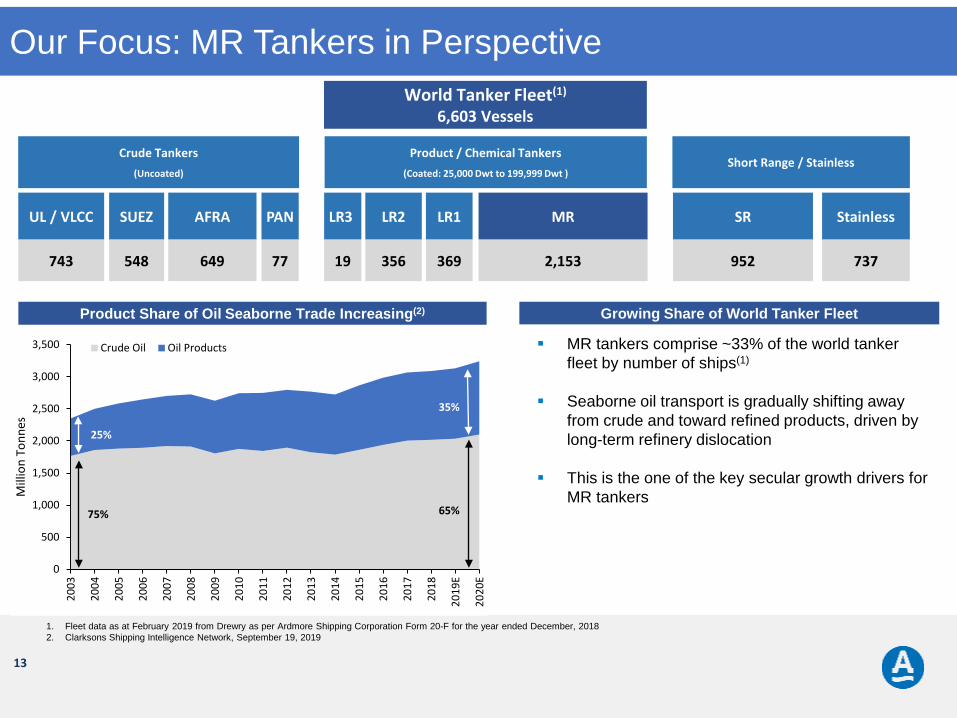
UL / VLCC SUEZ AFRA PAN LR3 LR2 LR1 MR SR Stainless
743 548 649 77 19 356 369 2,153 952 737
13
0
500
1,000
1,500
2,000
2,500
3,000
3,500
2003
2004
2005
2006
2007
2008
2009
2010
2011
2012
2013
2014
2015
2016
2017
2018
2019
E
2020
E
Mill
ion
Tonn
es
Crude Oil Oil Products
Growing Share of World Tanker FleetProduct Share of Oil Seaborne Trade Increasing(2)
75%
25%
65%
35%
MR tankers comprise ~33% of the world tanker fleet by number of ships(1)
Seaborne oil transport is gradually shifting away from crude and toward refined products, driven by long-term refinery dislocation
This is the one of the key secular growth drivers for MR tankers
Crude Tankers(Uncoated)
Product / Chemical Tankers(Coated: 25,000 Dwt to 199,999 Dwt )
Short Range / Stainless
World Tanker Fleet(1)
6,603 Vessels
Our Focus: MR Tankers in Perspective
1. Fleet data as at February 2019 from Drewry as per Ardmore Shipping Corporation Form 20-F for the year ended December, 20182. Clarksons Shipping Intelligence Network, September 19, 2019
14
14
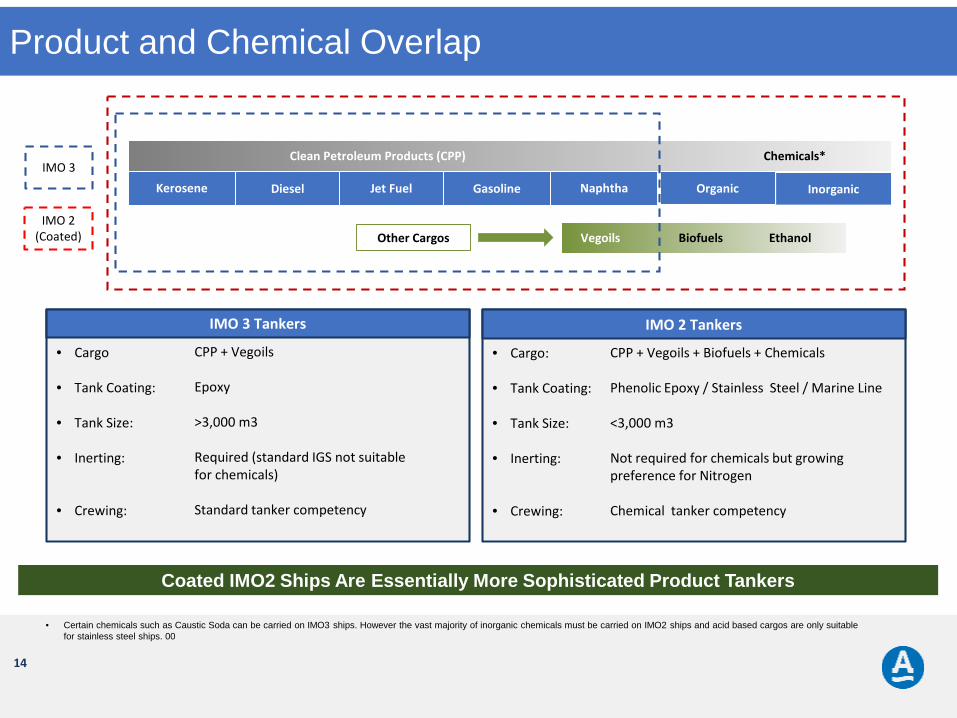
GasolineDieselKerosene Jet Fuel Naphtha
Clean Petroleum Products (CPP) Chemicals*
IMO 3 Tankers
• Cargo
• Tank Coating:
• Tank Size:
• Inerting:
• Crewing:
IMO 2 Tankers
• Cargo:
• Tank Coating:
• Tank Size:
• Inerting:
• Crewing:
IMO 2 (Coated)
IMO 3
CPP + Vegoils
Epoxy
>3,000 m3
Required (standard IGS not suitable for chemicals)
Standard tanker competency
CPP + Vegoils + Biofuels + Chemicals
Phenolic Epoxy / Stainless Steel / Marine Line
<3,000 m3
Not required for chemicals but growing preference for Nitrogen
Chemical tanker competency
Organic Inorganic
Vegoils Biofuels EthanolOther Cargos
• Certain chemicals such as Caustic Soda can be carried on IMO3 ships. However the vast majority of inorganic chemicals must be carried on IMO2 ships and acid based cargos are only suitable for stainless steel ships. 00
Product and Chemical Overlap
Coated IMO2 Ships Are Essentially More Sophisticated Product Tankers

15
15
MRs Trade Everywhere And Are The Ship Of Choice For Oil Traders Due To Their Versatility
MR VLCC
LR1 LR2
MRs are the “Yellow Cabs” of the World Tanker Fleet(1)
1. Vessels Value AIS Data, September, 2019

16
I. Company Overview
II. Product Tanker Industry
16
IV. Financial Overview
V. Investment Summary
VI. Appendix
III. Attractive Market Outlook
Contents

17
17
.
Recent Market Activity

18
-
3,000
6,000
9,000
12,000
15,000
18,000
21,000
24,000
1Q14 2Q14 3Q14 4Q14 1Q15 2Q 15 3Q 15 4Q15 1Q16 2Q16 3Q16 4Q16 1Q17 2Q17 3Q17 4Q17 1Q18 2Q18 3Q18 4Q18 1Q19 2Q19
TCE
($ /
Day)
18
Oil price drop end of 2014; significant rate increase in 2015
Rates troughed in 3Q18; recovery underway in 2019
ASC Fleet TCE Rates ($ / day)(1)
Charter Rates Bottomed in 2018 – Recovery Now Underway
1. Time Charter Equivalent (“TCE”) daily rate, represents net revenues divided by revenue days. Revenue days are the total number of calendar days the vessels are in our possession less off-hire days generally associated with drydocking or repairs. For vessels employed on voyage charters, TCE is the net rate after deducting voyage expenses incurred, divided by revenue days, including among other expenses, all commissions and pool administration fees. MR Tankers Spot & Pool TCE is reported on a discharge to discharge basis. Fleet TCE excludes one-off costs related to the transfer of vessels to Ardmore MR Pool

19
0.0%
1.0%
2.0%
3.0%
4.0%
5.0%
6.0%
7.0%
8.0%
9.0%
10.0%
Feb-11 Aug-11 Feb-12 Aug-12 Feb-13 Aug-13 Feb-14 Aug-14 Feb-15 Aug-15 Feb-16 Aug-16 Feb-17 Aug-17 Feb-18 Aug-18 Feb-19 Aug-19
Prod
uct T
anke
r Net
Fle
et G
row
th
Trailing 12M Net Fleet Growth
19
Supply growth now well below long-term tonne-mile demand growth
Tonne-mile product demand CAGR +4.1%(1)
(2)
Market Absorbed Excess Supply from 2015 – 2017
1. Clarksons Shipping Intelligence Network, September 19, 20192. Clarksons Shipping Intelligence Network, September, 2019; Basket of MR, LR1 and LR2 tankers

20
20
OECD Product Stocks: 2014 - 2019(1)(2)
950
1,000
1,050
1,100
1,150
1,200
Feb-
15
Apr-
15
Jun-
15
Aug-
15
Oct
-15
Dec-
15
Feb-
16
Apr-
16
Jun-
16
Aug-
16
Oct
-16
Dec-
16
Feb-
17
Apr-
17
Jun-
17
Aug-
17
Oct
-17
Dec-
17
Feb-
18
Apr-
18
Jun-
18
Aug-
18
Oct
-18
Dec-
18
Feb-
19
Apr-
19
Jun-
19
OEC
D Pr
oduc
t Sto
cks (
Mill
ion
Barr
els)
Refined Product Inventory Overhang Eliminated
1. Bloomberg, IEA Monthly Oil Report Data, August 20192. OECD Product Stocks taken as total of OECD Motor Gasoline, Middle Distillate and Residual Fuel Oil Stocks

21
0
10
20
30
40
50
60
70
80
90
OVX
Inde
x
21
Oil price volatility(1) is a key driver of trading activity; historically high oil price volatility has resulted in demand spikes for tankers
o We expect price volatility to be at higher levels over the next 24 months; IMO 2020 expected to cause significant disruption to the existing supply chain for marine fuels
Prolonged low price volatility resulted in subdued trading activity in 2017 - 2018
Seasonally low volatility
Oil Price Volatility Increases Trading Activity
1. CBOE.com as at September 19, 2019

22
22
.
Attractive Market Outlook

23
23
Increased Volumes
Refinery throughput
Oil price volatility returning
Low inventory levels
Oil consumption
growth
Growing imbalances; regional and
grades
Increased refinery
throughput
Voyage Distances IMO 2020Trading Activity
Refinery dislocation
Increased volumes of distillates /
other products
Significant disruption and
delays
Price volatility and trading
Macro / Geo political
Tonne-Mile Demand CAGR 4.1% (2003 to 2019)(1) Incremental Demand ~5%+(2)
Product Tanker Demand Drivers
1. Clarksons Shipping Intelligence Network, September 19, 20192. Management’s estimates

24
97.999.3
105.1
1.1
1.3
1.3
1.2
94
96
98
100
102
104
106
2017 2018 2019E 2020E 2021E 2022E 2023E
Mill
ion
Barr
els
/ Day
Total Global Oil Consumption Consumption Growth
24
Avg. +1.2 million bpd annually (2018 – 2023)
Oil consumption forecast to continue to grow at an average of 1.2 million bpd for next five years
Expected Global Oil Consumption Growth(1)
Oil Consumption Growth Remains Robust
1. IEA, Oil Market Report, August 2019

25
25
Refinery capacity growth in line with oil demand growth:
o Almost 85% of incremental capacity expected to be export oriented refineries in Asia and the Middle East leading to increasing tonne-miles
Expected Refinery Capacity Growth (2018 – 2023)(1)(2) Total Projects by Region (2019 – 2023)(1)(3)
100.4
109.92.9
1.1
2.3
0.9
94
96
98
100
102
104
106
108
110
112
2018 2019 2020 2021 2022 2023
Mill
ion
Barr
els
/ Day
Refinery Capacity Additions
Total Global Capacity
0.60.4
0.0
0.4
1.0
3.4
1.6
2.0
3.6
0.0
0.5
1.0
1.5
2.0
2.5
3.0
3.5
4.0
NA LATAM EU FSU Africa ME Other Asia S. Asia China
Mill
ion
Barr
els
/ Day
2019E
2020E
2021E
2022E
2023E
2024E
2025E
2026E
2027E
Refinery Capacity to Grow in Export Oriented Locations(1)
1. Maritime Strategies International, July 24, 20192. IEA, Oil 2019, March 20193. Actual planned and announced expansions; timing for later end projects may move

26
-
500
1,000
1,500
2,000
2,500
3,000
3,500
4,000
2003
2004
2005
2006
2007
2008
2009
2010
2011
2012
2013
2014
2015
2016
2017
2018
2019
E
2020
E
Billi
on T
onne
-Mile
s
26
Import Export Net
Middle East 1.6 3.5 1.9
North America 1.9 3.9 2.0
China 0.7 1.0 0.3
Asia (ex China) 7.3 5.2 -2.1
Europe 6.8 5.9 -0.9
Latin America 2.4 0.7 -1.7
Africa 1.5 0.5 -1.0
FSU N/A 2.4 2.4
Australasia 0.7 N/A -0.7
Other 0.1 0.1 0.0
Total Trade (mbd) 23.2 23.2 0.0
Tonne-Mile Demand for Products(1) Seaborne Product Trade Balances 2018(2)
2003 – 2019: CAGR +4.1%(1)
Tonne-mile demand for product tankers growing driven by underlying oil demand, regional imbalances and trading activity
Tonne-Mile Demand for Product Tankers CAGR 4.1%
1. Clarksons Shipping Intelligence Network, September, 20192. Clarksons Shipping Intelligence Network, Oil & Tanker Outlook, July 2019

27
-
10.0%
20.0%
30.0%
40.0%
50.0%
60.0%
70.0%
-
20.00
40.00
60.00
80.00
100.00
120.00
140.00
160.00
180.00
1996
1997
1998
1999
2000
2001
2002
2003
2004
2005
2006
2007
2008
2009
2010
2011
2012
2013
2014
2015
2016
2017
2018
2019
Ord
erbo
ok a
s % F
leet
Flee
t (M
illio
n Dw
t)
Fleet Orderbook (%)
27
Orderbook 5.8% of Fleet
Orderbook at just 5.8% of the current product tanker fleet; supply growth continues to decelerate
o MR orderbook stands at 5.9% of fleet; LR1 2.1% of fleet and LR2 at 8.5% of fleet
Product Tankers(1)
Supply: Product Tanker Orderbook at Record Lows
1. Clarksons Shipping Intelligence Network and Management’s estimates as at September 16, 2019. Includes MR, LR1 and LR2
28
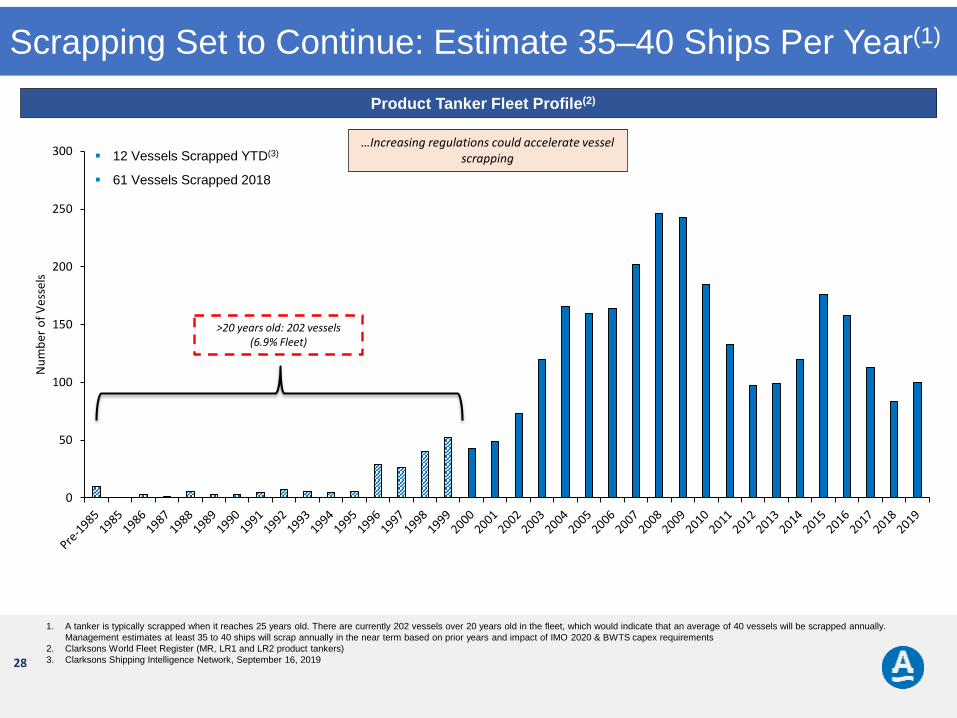
0
50
100
150
200
250
300
Num
ber o
f Ves
sels
28
+27% YoY
+37% YoY
>20 years old: 202 vessels (6.9% Fleet)
…Increasing regulations could accelerate vessel scrapping 12 Vessels Scrapped YTD(3)
61 Vessels Scrapped 2018
Product Tanker Fleet Profile(2)
Scrapping Set to Continue: Estimate 35–40 Ships Per Year(1)
1. A tanker is typically scrapped when it reaches 25 years old. There are currently 202 vessels over 20 years old in the fleet, which would indicate that an average of 40 vessels will be scrapped annually. Management estimates at least 35 to 40 ships will scrap annually in the near term based on prior years and impact of IMO 2020 & BWTS capex requirements
2. Clarksons World Fleet Register (MR, LR1 and LR2 product tankers)3. Clarksons Shipping Intelligence Network, September 16, 2019

29
(4%)
(2%)
-
2%
4%
6%
8%
(30)
(20)
(10)
-
10
20
30
40
50
60
1Q14 1Q15 1Q16 1Q17 1Q18 1Q19 1Q20E 1Q21E
Net
FLe
et G
row
th T
4Q (%
)
Vess
el D
eliv
erie
s / (
Scra
p)
Product Tanker Deliveries Product Tanker Scrap Net Fleet Growth (T4Q)
29
Net Fleet Growth of 2.5% annually (2019 – 2020)
Product Tanker Fleet Development(1)(2)
1. MR, LR1 and LR2 vessels; Clarksons Shipping Intelligence Network, September 16, 2019, and Management’s estimates2. Assumed 1/8 of annual scheduled deliveries slip into following year

30
30
.
IMO 2020

31
31
0.0
0.5
1.0
1.5
2.0
2.5
3.0
3.5
4.0
4.5
5.0
2008 2009 2010 2011 2012 2013 2014 2015 2016 2017 2018 2019 2020 2021 2022
Sulfu
r Con
tent
(%)
World EU Ports ECA
1.5%
4.5%
3.5%
0.5%
1.0%
0.1%0.1%
2015: Set 0.1% sulfur cap for fuel oil used in Emission Control Areas (ECA)
2020: From Jan 1, 2020 global sulfur limit of 0.5% for shipping
2005 – 2010: Annex VI entered into force –Prevention of Air Pollution from Ships. Controlling airborne emissions from ships (SOx, NOx, etc)
2012: Sulfur content of any fuel used on board ships to not exceed 3.5%
2016: IMO sets Jan 1, 2020 as date for introduction of 0.5% sulfur limit
Background to IMO 2020(1)
1. Seatrade Maritime News, What You Need To Know: The 2020 IMO Fuel Sulphur Regulation, September, 2017

32
32
Open Loop(1)
Est. Cost: $2-3 mln
Marine Gas Oil (“MGO”)0.1%
Very Low Sulfur Fuel Oil (“VLSFO”)0.5%
Options for Shipowners
Burn Compliant FuelsBurn High Sulfur Fuel Oil (“HSFO”)
3.5%
Install Scrubber: Open or Closed Loop?
Closed Loop(2)
Est. Cost: $5 mln
1. Open Loop Scrubber System: Seawater, with high sodium chloride content, used as a scrubbing liquid that is sprayed upon the exhaust gas, in order to neutralize SO2 emissions. The waste water is treated and discharged back into the sea; IDC Consorzio, All You Need To Know About Scrubbing
2. Closed Loop Scrubber System: Fresh water, treated with a chemical (usually sodium hydroxide), used for neutralization and scrubbing. The supply of water is recirculated, with small amounts released into the sea; IDC Consorzio, All You Need To Know About Scrubbing
Alternatives for Shipowners
33
33
0
0.5
1
1.5
2
2.5
3
3.5
4
4.5
5
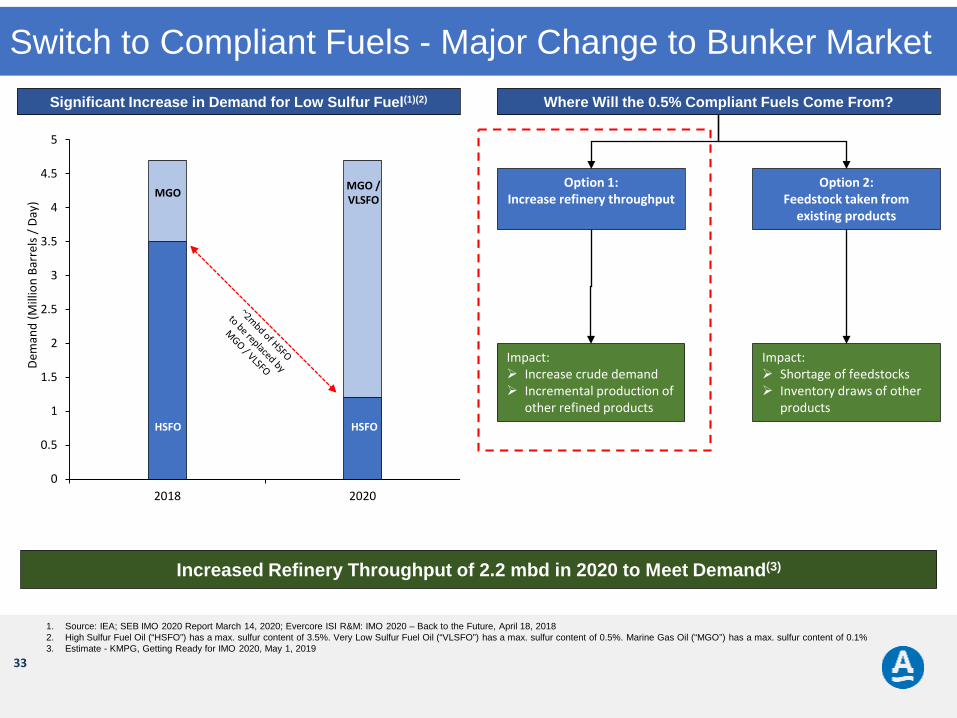
2018 2020
Dem
and
(Mill
ion
Barr
els
/ Day
)
HSFO HSFO
MGO / VLSFOMGO
Option 1:Increase refinery throughput
Option 2:Feedstock taken from
existing products
Impact: Shortage of feedstocks Inventory draws of other
products
Impact: Increase crude demand Incremental production of
other refined products
Significant Increase in Demand for Low Sulfur Fuel(1)(2) Where Will the 0.5% Compliant Fuels Come From?
Increased Refinery Throughput of 2.2 mbd in 2020 to Meet Demand(3)
1. Source: IEA; SEB IMO 2020 Report March 14, 2020; Evercore ISI R&M: IMO 2020 – Back to the Future, April 18, 20182. High Sulfur Fuel Oil (“HSFO”) has a max. sulfur content of 3.5%. Very Low Sulfur Fuel Oil (“VLSFO”) has a max. sulfur content of 0.5%. Marine Gas Oil (“MGO”) has a max. sulfur content of 0.1%3. Estimate - KMPG, Getting Ready for IMO 2020, May 1, 2019
Switch to Compliant Fuels - Major Change to Bunker Market

34
0%
10%
20%
30%
40%
50%
60%
70%
80%
90%
100%
2018 2019E 2020E 2021E 2022E 2023E
HSFO MGO VLSFO
34
~2x increase in expected demand for MGO in 2020
VLSFO demand to increase; refineries re-adjust to low sulfur fuel production / compatible blends manufactured
2.0 mbd 1.9 mbd 1.9 mbd 1.8 mbd
1.0 mbd 1.4 mbd 1.6 mbd 1.7 mbd0.9 mbd0.9 mbd
1. IEA, Oil 2019, March 20192. High Sulfur Fuel Oil (“HSFO”) has a max. sulfur content of 3.5%. Very Low Sulfur Fuel Oil (“VLSFO”) has a max. sulfur content of 0.5%. Marine Gas Oil (“MGO”) has a max. sulfur content of 0.1%
Marine Bunker Demand Breakdown (2018 – 2023)(1)(2)
IMO 2020: Demand for MGO Set to Spike

35
Refinery throughput + 2.2mbd(1) inorder to meet incremental demand from IMO 2020
Demand for MGO to increase substantially(2) as the most reliable source of compliant fuel
Increased volumes of distillates and other refined products(2)
35
Movement of blending components plus shift in trading patterns of distillates and other products
Oil price volatility leading to heightened trading activity
Potential for significant floating storage of HSFO – on Aframaxesand LR2s (heating coils needed)
Port delays and storage constraints with at least three different types of fuel
Dislocation of existing products and feedstocks within refinery complex
Vessel operational challenges reducing the efficiency of the oil logistics system
Increased Volumes of Products Vessel Supply Chain Disruption Oil Trading Activity
1. Estimate - KMPG, Getting Ready for IMO 2020, May, 20192. IEA, Oil 2019, Analysis and forecast to 20243. Management’s estimates
Estimated 5% + Incremental Product Tanker Demand(3)
Estimated 5%+ Incremental Demand for Product Tankers
36
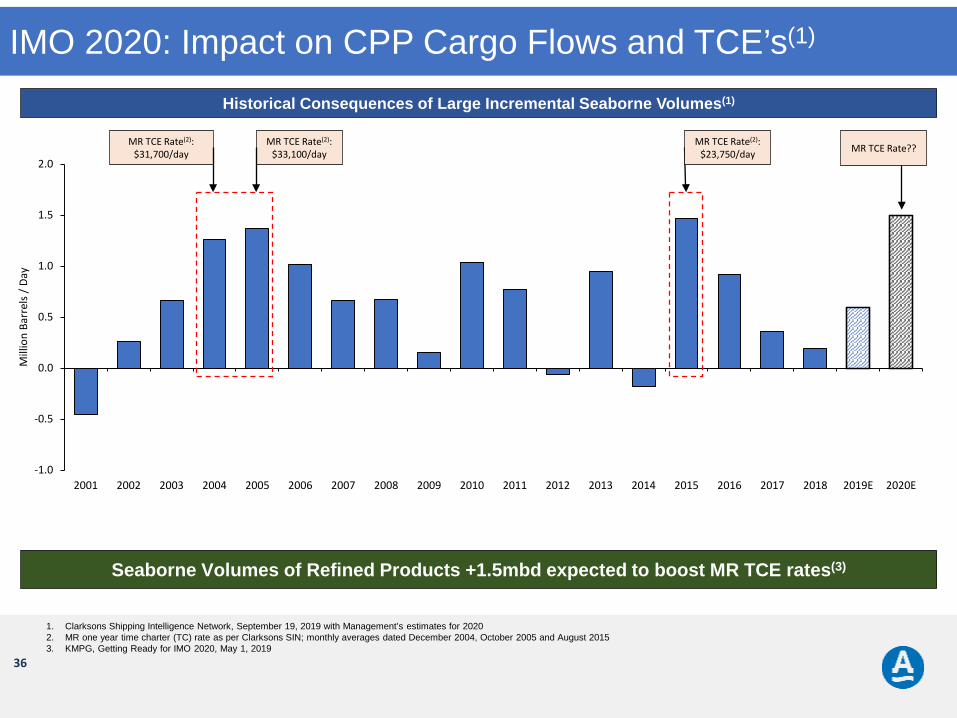
-1.0
-0.5
0.0
0.5
1.0
1.5
2.0
2001 2002 2003 2004 2005 2006 2007 2008 2009 2010 2011 2012 2013 2014 2015 2016 2017 2018 2019E 2020E
Mill
ion
Barr
els /
Day
36
MR TCE Rate(2): $31,700/day
MR TCE Rate(2): $33,100/day
1. Clarksons Shipping Intelligence Network, September 19, 2019 with Management’s estimates for 2020 2. MR one year time charter (TC) rate as per Clarksons SIN; monthly averages dated December 2004, October 2005 and August 20153. KMPG, Getting Ready for IMO 2020, May 1, 2019
Seaborne Volumes of Refined Products +1.5mbd expected to boost MR TCE rates(3)
Historical Consequences of Large Incremental Seaborne Volumes(1)
MR TCE Rate(2): $23,750/day MR TCE Rate??
IMO 2020: Impact on CPP Cargo Flows and TCE’s(1)

37
I. Company Overview
II. Product Tanker Industry
37
IV. Financial Overview
V. Investment Summary
VI. Appendix
III. Attractive Market Outlook
Contents

38
$436.5 $416.8 $377.1 $377.1
$337.4 $333.8
$19.7$39.7
$39.7
$3.6
Gross Debt@ 2Q19
2H19Repayments
Gross Debt@ 2019
2020Repayments
Gross Debt@ 2020
2021Repayments
Gross Debt@ 2021
Gross Debt Debt Repayments Balloon Repayments
38
Cash of $54.8 million plus $17.8 million in net working capital as at June 30, 2019
No near term maturities; next significant maturity in 2022(1)
“Barbell” approach to debt profile through a mix of finance leases (53% of total debt) and senior debt (47% of total debt)(2)
o Weighted average margin of 3% across all debt(2)
Scheduled Debt and Finance Lease Amortization Profile ($mln)
(3) (3) (3) (3)
Strong Balance Sheet and Liquidity Position
1. One loan matures in 2021 in respect to an Eco-Mod MR. Balloon is $3.6 million due in September 2021. Balloons due in 2022 amount to approximately $139.3 million2. Debt profile as at June 30, 20193. Gross Debt is net of sellers’ credit of $2.9mln, excludes netting of deferred financed fees of $6.8mln, in each case as at June 30, 2019

39
39
Top 20 Shareholders(1)
No Holder Position Percent1 Frank Russell Co 3,012,267 9.10%2 Aristotle Capital Management LLC 2,519,023 7.61%3 Donald Smith & Co Inc 2,249,331 6.80%4 Fidelity Management and Research 2,037,638 6.16%5 Dimensional Fund Advisors LP 2,001,575 6.05%6 BlackRock Inc 1,890,610 5.71%7 Royce & Associates LP 1,632,681 4.93%8 Boston Partners Global Investors 1,476,152 4.46%9 Cross River Management LLC 1,420,790 4.29%10 Bank of New York Mellon Corp. 1,253,867 3.79%11 Van Den Berg Management I Inc 979,111 2.96%12 Private Management Group Inc 971,918 2.94%13 Northern Trust Corp 850,140 2.57%14 Franklin Resources Inc 832,000 2.51%15 Schneider Capital Management Corp 675,868 2.04%16 Portolan Capital Management LLC 663,649 2.01%17 BNY Mellon Investment Adviser Inc 607,738 2.00%18 Russell Investment Management 590,832 1.79%19 State Street Corp 537,727 1.62%20 SEI Investments Co 487,463 1.47%
Over 80% of shares held by top 20 shareholders
Concentration of long-only investors, many of whom have been with us since the IPO
No single investor holds a shareholding of 10% or more
Commentary
High Quality Investor Base: Long Term Holders
1. Bloomberg as at September 19, 2019

40
40
Share Price Disconnected from Asset Values - MR Values +35%(2)
(2)(1)
20.00
22.00
24.00
26.00
28.00
30.00
32.00
$4.0
$6.0
$8.0
$10.0
$12.0
$14.0
$16.0
Vess
el V
alue
($ M
ln)
ASC
Shar
e Pr
ice
($)
ASC Share Price MR 5-Yr Value ($ Mln)
Continued Disconnect between Share Price & Asset Values
1. Bloomberg, as at September, 20192. Clarkson's Shipping Intelligence Network. MR value increase since January 2017, as at September 2019

41
41
Vessel Type Base TCE per day
Rates FY2015TCE per day
Upside Rates – 3Q15TCE per day
MR Product (50k Dwt) $17,761 $21,500 $25,000
MR Chem (25-37k Dwt) $15,000 $17,500 $18,000
Illustrative Earnings Per
Share(1)
Every $1,000 / day increase in rates ≈ $0.27 / share in EPS
$0.58
$1.52
$2.28
Base Rates Rates FY2015 Upside Rates - 3Q15
Significant Potential Earnings Power with 25 x Ship Fleet(1)
Significant Earnings Power Across Fleet(1)
1. Management’s estimates based on (i) 25 vessels, (ii) 33,097,831 shares as at March 31, 2019 (iii) 363 revenue days / vessel, (iv) expenses as per 2018 financial statements. Accretion assumes positive earnings. Actual EPS estimates may differ materially from the estimated EPS. MR rate of $17,761 / day and chemical tanker rates of $15,000 / day are based on Analyst’s estimates for 2019. MR and chemical tanker rates for FY2015 based on ASC rates reported for full year 2015 and rates for 3Q15 are based on ASC rates reported in 3Q15. The rates reported in 3Q15 were the highest rates achieved by ASC in the in the most recent 5-year period, but do not reflect the extent of rate increases achieved by the overall industry during the last major cyclical upturn

42
I. Company Overview
II. Product Tanker Industry
42
IV. Financial Overview
V. Investment Summary
VI. Appendix
III. Attractive Market Outlook
Contents

43
43
Company Highlights:
A leading product tanker company listed on the NYSE
High-quality fleet of 25 “Eco” MRs built in Korea and Japan, with average age of 6.2 years
Strategy focused on maximizing ROIC through operating performance, cost efficiency and market timing
Conservative capital structure; low leverage and strong liquidity position
Strong track record of transparency; corporate governance ranked in top tier of marine transportation sector(1)
Market Summary:
Charter rates have increased; strong rebound in crude tanker rates expected to lead a general tanker market recovery
MR tonne-mile demand growth is robust, oil consumption growth matched by refinery capacity additions in trading-oriented locations(2)
The product tanker orderbook remains exceptionally low; net fleet growth expected to average 2.5% for next two years(3)(4)
IMO 2020 expected to be a game changer for tankers(5); increased seaborne volumes of compliant bunker fuels, greater arbitrage opportunities and oil trading activity, all contributing to an expected boost to tonne-mile demand
Summary
1. Wells Fargo Corporate Governance Scorecard Volume V issued May 6, 20192. IEA, Oil 2019, March, 20193. Clarksons Shipping Intelligence Network, September 16, 20194. Clarksons Shipping Intelligence Network, and Management’s estimates. Note these numbers include slippage. Management’s estimates based on 1/8th of annual scheduled orders slipping into
20205. Deutsche Bank: IMO2020 Game changer on horizon, June 2018
44
I. Company Overview
II. Product Tanker Industry
44
IV. Financial Overview
V. Investment Summary
VI. Appendix
III. Attractive Market Outlook
Contents
45
45
Jet
Kerosene
Diesel
Heating Oil
Atmospheric Distillation
Unit
Vacuum Distillation
Unit
Hydrocracker
Delayed Coker
Fluid Catalytic Cracker
Fina
l Tre
atin
g &
Ble
ndin
g
Gasoline
Distillate
Fuel Oils
Lubes
LPG
Naphtha
Kerosene / Jet
Diesel
L.S.S.R.
L.S./H.S. Straight Run Residual
Asphalt / Bunkers
Residue
Vacuum Gasoil (VGO)
Naphtha / Gasoline
Gasoil
Residue
Naphtha / Gasoline
Distillate / Gasoil
Light Cycle Oil
Slurry Oil
Naphtha
Coker-Gasoil
Coke
Aviation
Automotive
Solvents
Bunker Fuel
Utility Fuel
Greases & Wax
Finished Products
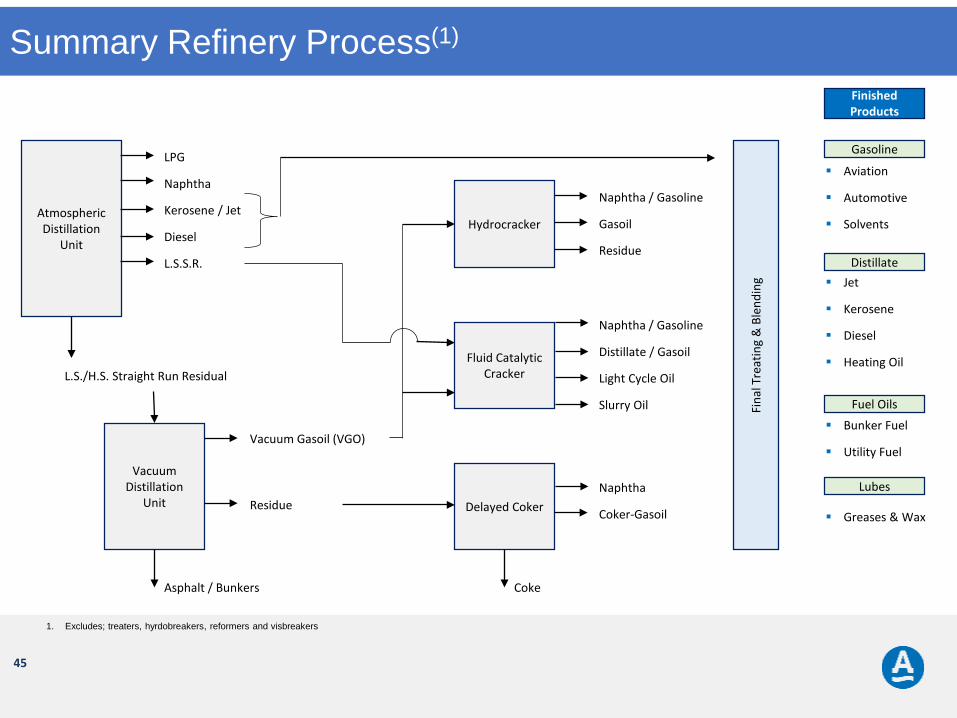
Summary Refinery Process(1)
1. Excludes; treaters, hyrdobreakers, reformers and visbreakers

46
46
.
Crud
e O
il
NGL Plant
Gas
Refinery
Ethylene
Cracker
Naphtha
Cracker
Reformate
EthanePropane
ButaneNaphtha
Pygas
EthylenePropylene
Butylene
Ethylene Dichloride Ethylene Glycol Linear Alcohols Vinyl Acetate Styrene Misc chemicals
Manufacturing• Polystyrene• Fibres• Resin • Latex• Polyester• Nylon• Adhesives • Solvents• Detergent• Anti-Freeze• Flooring• Textiles
Fuel Blending• Oxygenates• Anti-knock agents
Agri-Business• Fertilizers
Commercial UseM/A
Production
Plant
Methanol MTBE UAN
Liquid Cargos
• Benzene• Toulene• Xylenes• Styrene• Cyclohexane• Misc chemicals
Methane
• Gasoline• Jet Fuel and Diesel• Fuel Oil Ardmore’s Fleet Capability
Ethylene
Origin of Product and Chemical Cargos