investor presentation q2 fy 2019-20 - ujjivan · 2020. 1. 29. · q2-fy20 business and operational...
TRANSCRIPT
Investor Presentation Q2 FY 2019-20
October 2019
2
Disclaimer This presentation has been prepared by Ujjivan Financial Services Limited (the “Company”) for general information purposes only, without regard to any specific objectives, suitability, financial situations and needs of any particular person and does not constitute any recommendation or form part of any offer or invitation, directly or indirectly, in any manner, or inducement to sell or issue, or any solicitation of any offer to purchase or subscribe for, any securities of the Company, nor shall it or any part of it or the fact of its distribution form the basis of, or be relied on in connection with, any contract or commitment therefor. This presentation does not solicit any action based on the material contained herein. Nothing in this presentation is intended by the Company to be construed as legal, accounting or tax advice.
This presentation has been prepared by the Company based upon information available in the public domain. This presentation has not been approved and will not or may not be reviewed or approved by any statutory or regulatory authority in India or by any Stock Exchange in India. This presentation may include statements which may constitute forward-looking statements. The actual results could differ materially from those projected in any such forward-looking statements because of various factors. The Company assumes no responsibility to publicly amend, modify or revise any forward-looking statements, on the basis of any subsequent developments, information or events, or otherwise.
This presentation contains certain forward-looking statements relating to the business, financial performance, strategy and results of the Company and/ or the industry in which it operates. Forward-looking statements are statements concerning future circumstances and results, and any other statements that are not historical facts, sometimes identified by the words including, without limitation “believes”, “expects”, “predicts”, “intends”, “projects”, “plans”, “estimates”, “aims”, “foresees”, “anticipates”, “targets”, and similar expressions. The forward-looking statements, including those cited from third party sources, contained in this presentation are based on numerous assumptions and are uncertain and subject to risks. A multitude of factors including, but not limited to, changes in demand, competition and technology, can cause actual events, performance or results to differ significantly from any anticipated development. Neither the Company nor its affiliates or advisors or representatives nor any of its or their parent or subsidiary undertakings or any such person's officers or employees guarantees that the assumptions underlying such forward-looking statements are free from errors nor does either accept any responsibility for the future accuracy of the forward-looking statements contained in this presentation or the actual occurrence of the forecasted developments. Forward-looking statements speak only as of the date of this presentation and are not guarantees of future performance. As a result, the Company expressly disclaims any obligation or undertaking to release any update or revisions to any forward-looking statements in this presentation as a result of any change in expectations or any change in events, conditions, assumptions or circumstances on which these forward looking statements are based. Given these uncertainties and other factors, viewers of this presentation are cautioned not to place undue reliance on these forward-looking statements.
The information contained in these materials has not been independently verified. None of the Company, its directors, promoter or affiliates, nor any of its or their respective employees, advisers or representatives or any other person accepts any responsibility or liability whatsoever, whether arising in tort, contract or otherwise, for any errors, omissions or inaccuracies in such information or opinions or for any loss, cost or damage suffered or incurred howsoever arising, directly or indirectly, from any use of this presentation or its contents or otherwise in connection with this presentation, and makes no representation or warranty, express or implied, for the contents of this presentation including its accuracy, fairness, completeness or verification or for any other statement made or purported to be made by any of them, or on behalf of them, and nothing in this presentation or at this presentation shall be relied upon as a promise or representation in this respect, whether as to the past or the future. Past performance is not a guide for future performance. The information contained in this presentation is current, and if not stated otherwise, made as of the date of this presentation. The Company undertakes no obligation to update or revise any information in this presentation as a result of new information, future events or otherwise. Any person/ party intending to provide finance/ invest in the shares/ businesses of the Company shall do so after seeking their own professional advice and after carrying out their own due diligence procedure to ensure that they are making an informed decision.
3
Disclaimer This presentation is not a prospectus, a statement in lieu of a prospectus, an offering circular, an advertisement or an offer document under the Companies Act, 2013, as amended, the Securities and Exchange Board of India (Issue of Capital and Disclosure Requirements) Regulations, 2018, as amended, or any other applicable law in India.
This presentation is strictly confidential and may not be copied or disseminated, in whole or in part, and in any manner or for any purpose. No person is authorized to give any information or to make any representation not contained in or inconsistent with this presentation and if given or made, such information or representation must not be relied upon as having been authorized by any person. Failure to comply with this restriction may constitute a violation of the applicable securities laws. Neither this document nor any part or copy of it may be distributed, directly or indirectly, in the United States. The distribution of this document in certain jurisdictions may be restricted by law and persons in to whose possession this presentation comes should inform themselves about and observe any such restrictions. By reviewing this presentation, you agree to be bound by the foregoing limitations. You further represent and agree that you are located outside the United States and you are permitted under the laws of your jurisdiction to receive this presentation.
This presentation is not an offer to sell or a solicitation of any offer to buy the securities of the Company in the United States or in any other jurisdiction where such offer or sale would be unlawful. Securities may not be offered, sold, resold, pledged, delivered, distributed or transferred, directly or indirectly, in to or within the United States absent registration under the United States Securities Act of 1933, as amended (the “Securities Act”), except pursuant to an exemption from, or in a transaction not subject to, the registration requirements of the Securities Act and in compliance with any applicable securities laws of any state or other jurisdiction of the United States. The Company’s securities have not been and will not be registered under the Securities Act.
4
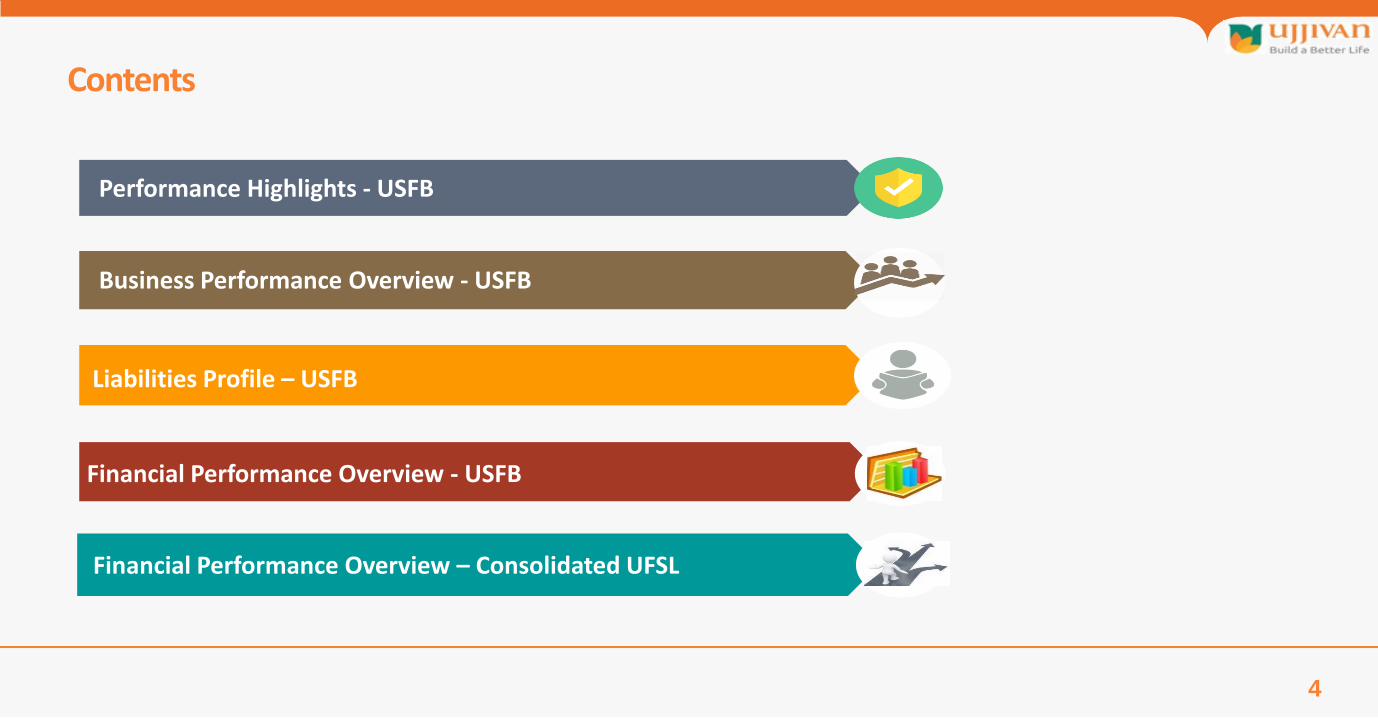
Contents
Performance Highlights - USFB
Business Performance Overview - USFB
Liabilities Profile – USFB
Financial Performance Overview - USFB
Financial Performance Overview – Consolidated UFSL
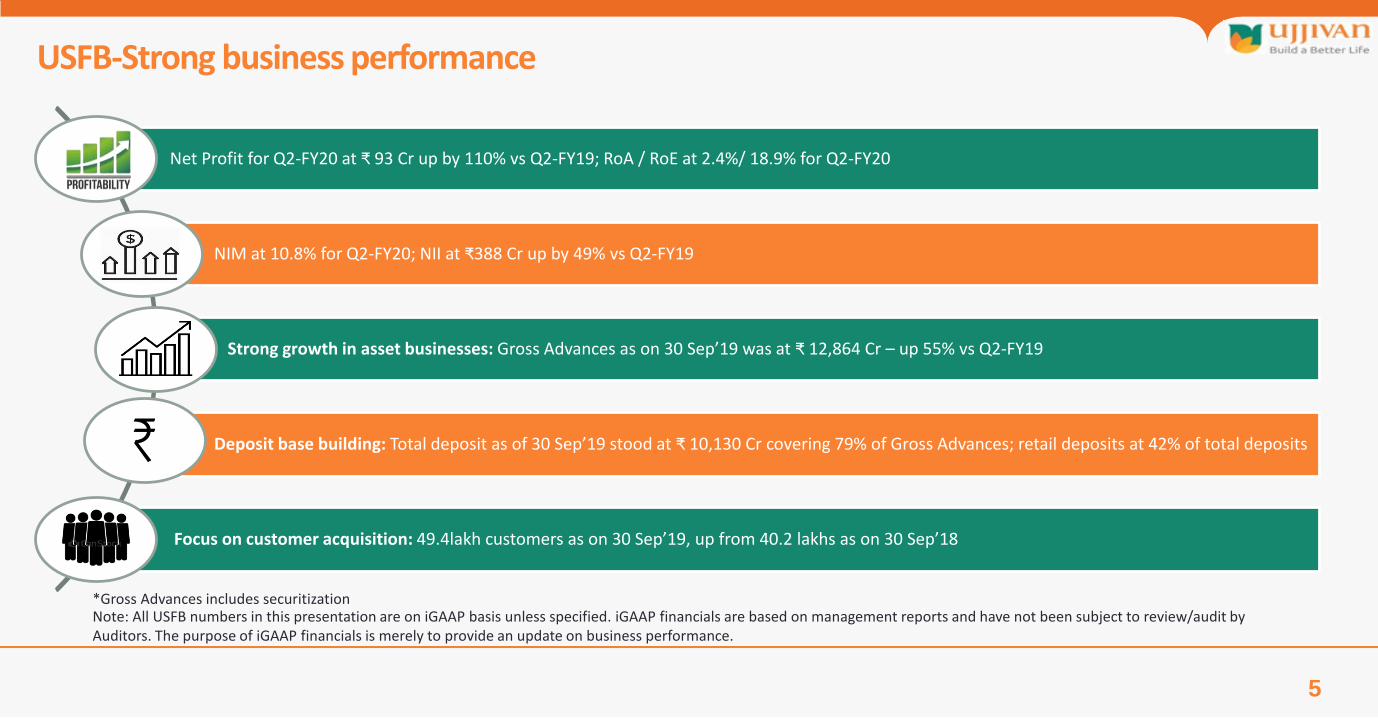
USFB-Strong business performance
5
Net Profit for Q2-FY20 at ₹ 93 Cr up by 110% vs Q2-FY19; RoA / RoE at 2.4%/ 18.9% for Q2-FY20
NIM at 10.8% for Q2-FY20; NII at ₹388 Cr up by 49% vs Q2-FY19
Strong growth in asset businesses: Gross Advances as on 30 Sep’19 was at ₹ 12,864 Cr – up 55% vs Q2-FY19
Deposit base building: Total deposit as of 30 Sep’19 stood at ₹ 10,130 Cr covering 79% of Gross Advances; retail deposits at 42% of total deposits
Focus on customer acquisition: 49.4lakh customers as on 30 Sep’19, up from 40.2 lakhs as on 30 Sep’18
Note: All USFB numbers in this presentation are on iGAAP basis unless specified. iGAAP financials are based on management reports and have not been subject to review/audit by Auditors. The purpose of iGAAP financials is merely to provide an update on business performance.
*Gross Advances includes securitization
6
Performance Highlights Ujjivan Small Finance Bank
Note: All financials given in this presentation are on I-GAAP basis unless specified. These are for informational purpose only
7
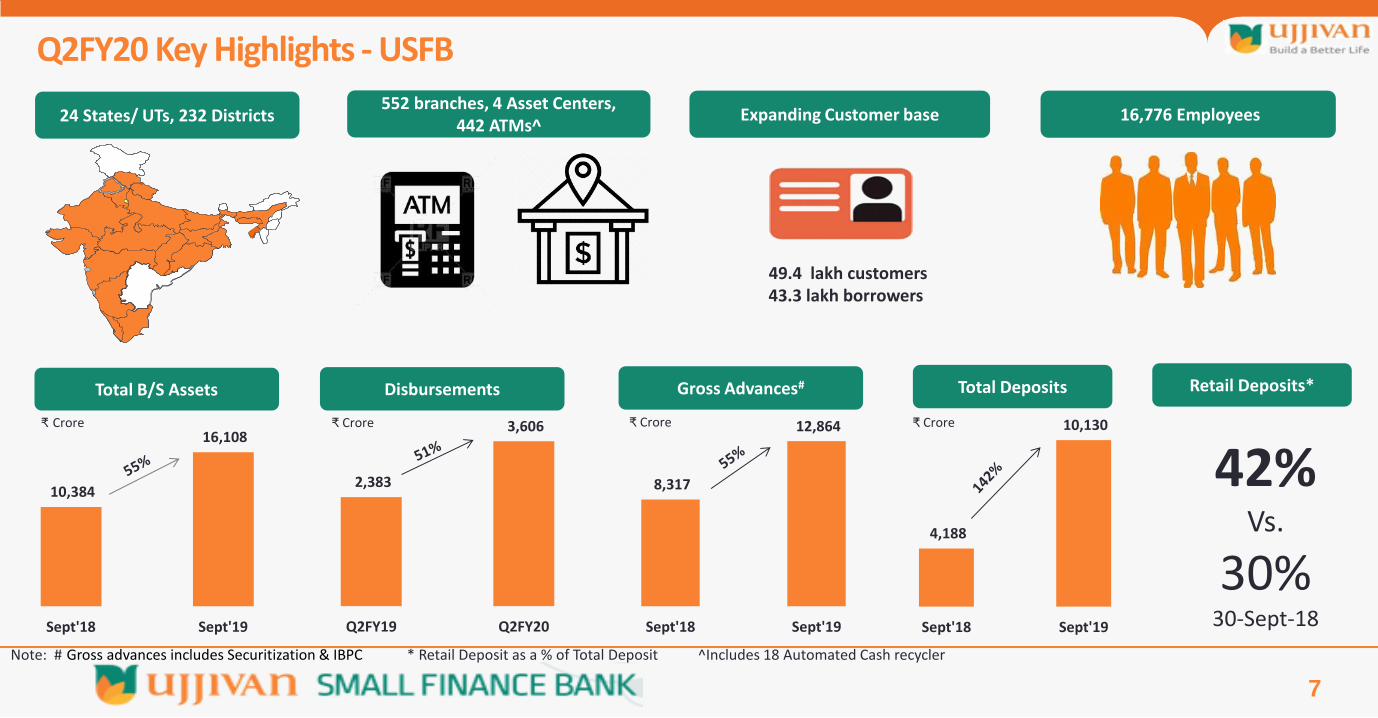
Q2FY20 Key Highlights - USFB
24 States/ UTs, 232 Districts 552 branches, 4 Asset Centers,
442 ATMs^ Expanding Customer base 16,776 Employees
Total B/S Assets
10,384
16,108
Sept'18 Sept'19
Disbursements
2,383
3,606
Q2FY19 Q2FY20
8,317
12,864
Sept'18 Sept'19
Gross Advances# Total Deposits
4,188
10,130
Sept'18 Sept'19
₹ Crore
Retail Deposits*
42% Vs.
30% 30-Sept-18
₹ Crore ₹ Crore ₹ Crore
49.4 lakh customers 43.3 lakh borrowers
Note: # Gross advances includes Securitization & IBPC * Retail Deposit as a % of Total Deposit ^Includes 18 Automated Cash recycler
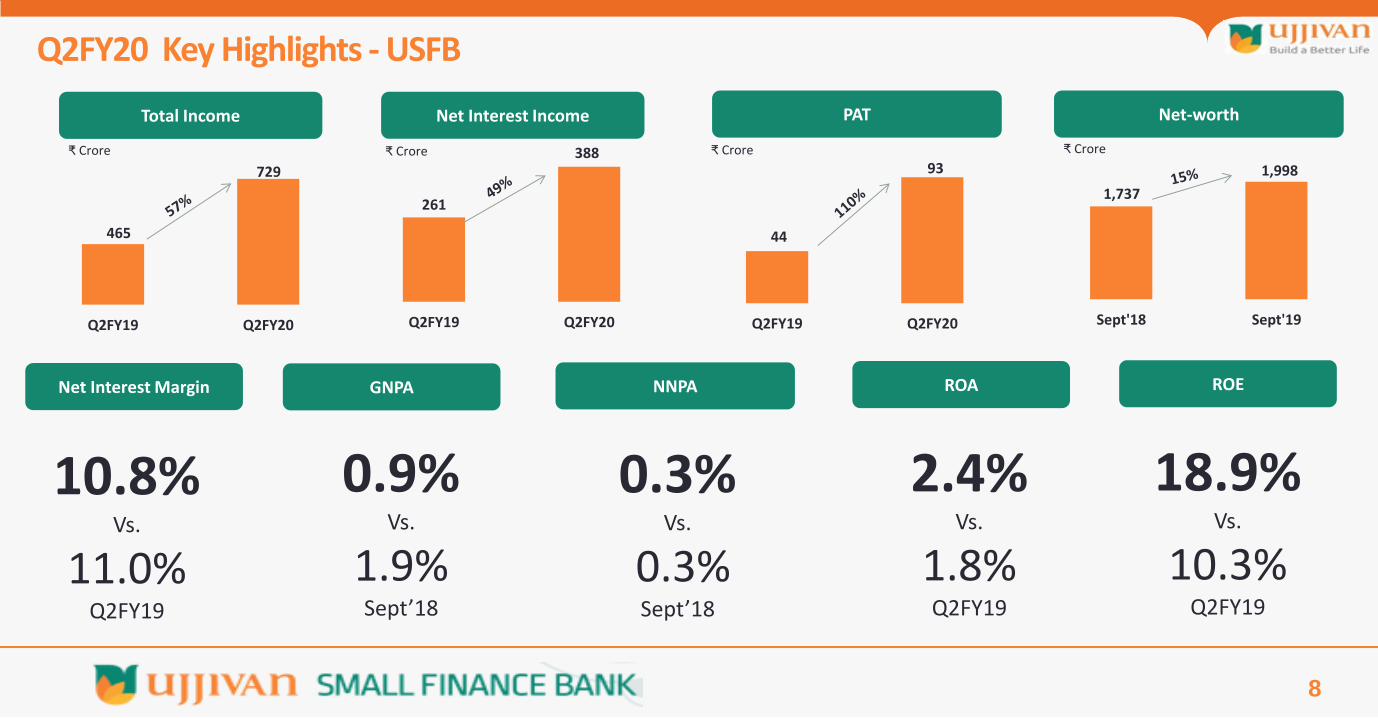
Q2FY20 Key Highlights - USFB
8
Net Interest Income PAT Net-worth
₹ Crore ₹ Crore ₹ Crore
Net Interest Margin GNPA NNPA ROA ROE
10.8% Vs.
11.0% Q2FY19
0.9% Vs.
1.9% Sept’18
0.3% Vs.
0.3% Sept’18
2.4% Vs.
1.8% Q2FY19
18.9% Vs.
10.3% Q2FY19
Total Income
465
729
Q2FY19 Q2FY20
₹ Crore
261
388
Q2FY19 Q2FY20
44
93
Q2FY19 Q2FY20
1,737
1,998
Sept'18 Sept'19
9
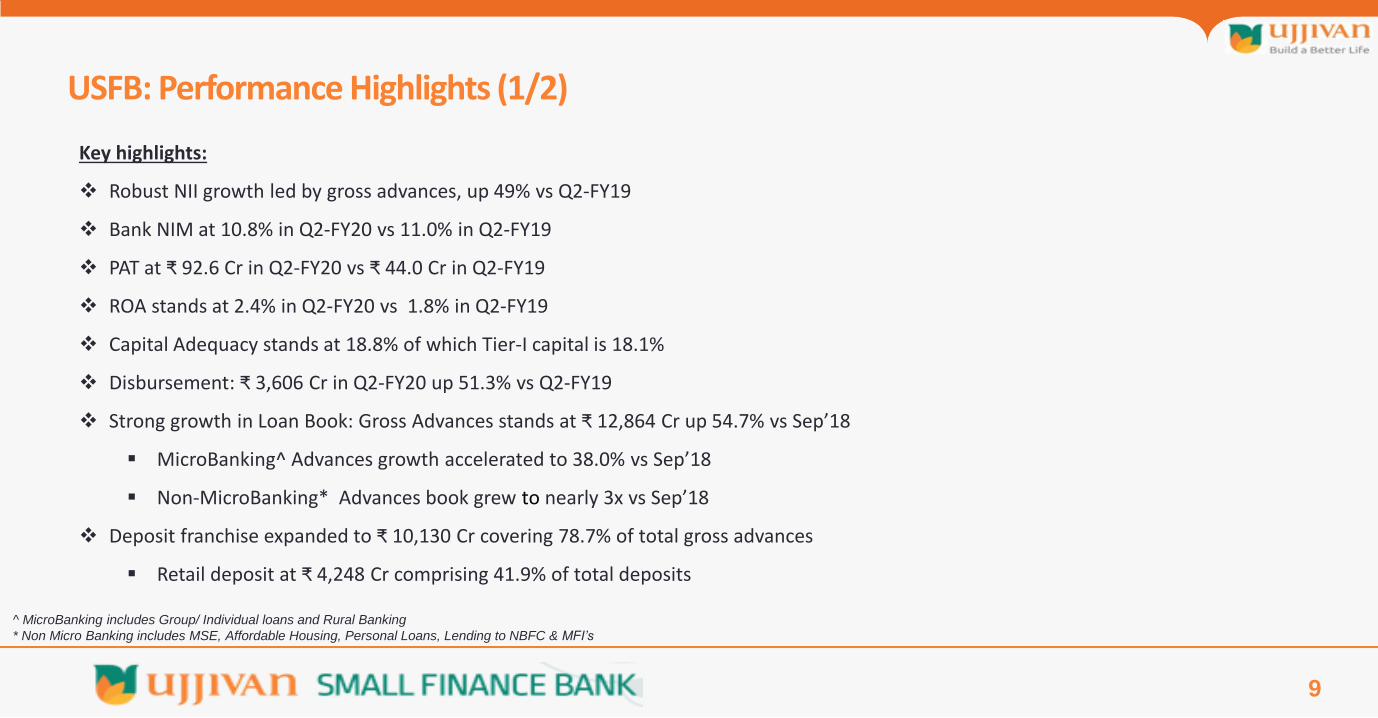
Key highlights:
Robust NII growth led by gross advances, up 49% vs Q2-FY19
Bank NIM at 10.8% in Q2-FY20 vs 11.0% in Q2-FY19
PAT at ₹ 92.6 Cr in Q2-FY20 vs ₹ 44.0 Cr in Q2-FY19
ROA stands at 2.4% in Q2-FY20 vs 1.8% in Q2-FY19
Capital Adequacy stands at 18.8% of which Tier-I capital is 18.1%
Disbursement: ₹ 3,606 Cr in Q2-FY20 up 51.3% vs Q2-FY19
Strong growth in Loan Book: Gross Advances stands at ₹ 12,864 Cr up 54.7% vs Sep’18
MicroBanking^ Advances growth accelerated to 38.0% vs Sep’18
Non-MicroBanking* Advances book grew to nearly 3x vs Sep’18
Deposit franchise expanded to ₹ 10,130 Cr covering 78.7% of total gross advances
Retail deposit at ₹ 4,248 Cr comprising 41.9% of total deposits
USFB: Performance Highlights (1/2)
^ MicroBanking includes Group/ Individual loans and Rural Banking
* Non Micro Banking includes MSE, Affordable Housing, Personal Loans, Lending to NBFC & MFI’s
10
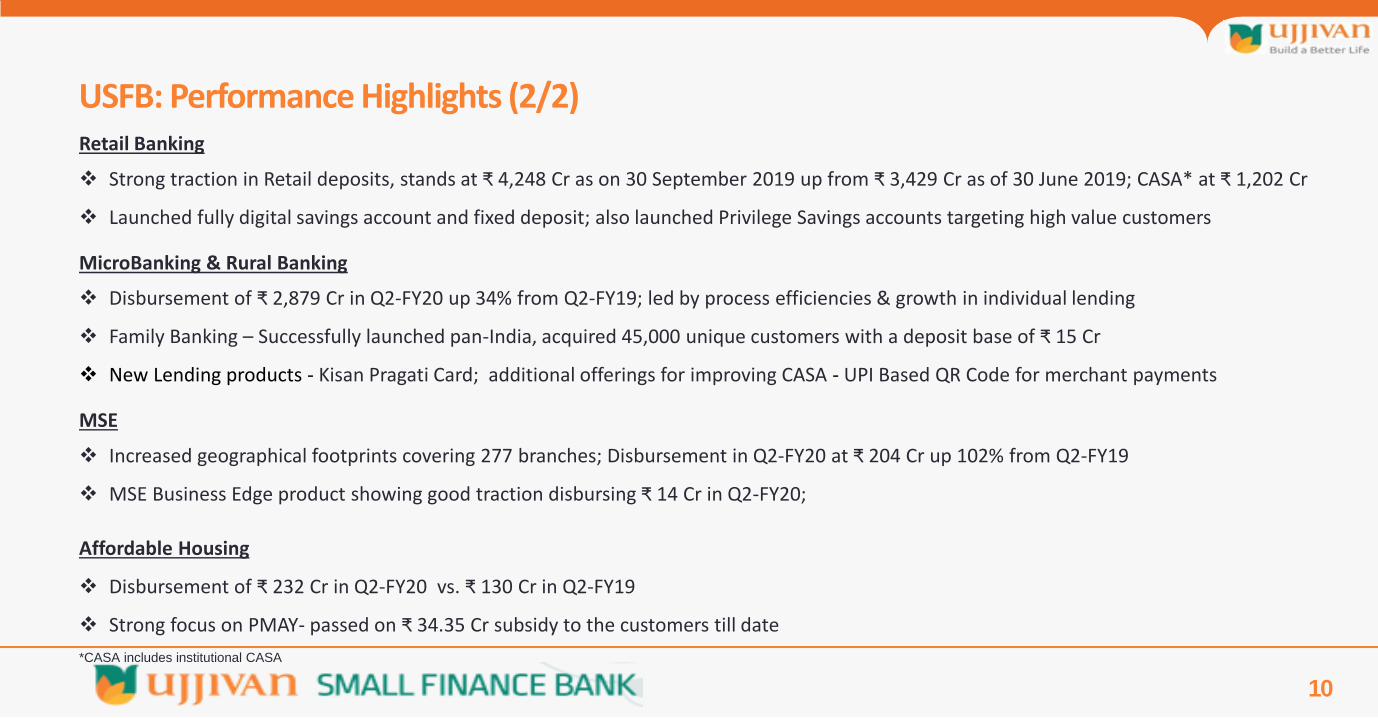
Retail Banking
Strong traction in Retail deposits, stands at ₹ 4,248 Cr as on 30 September 2019 up from ₹ 3,429 Cr as of 30 June 2019; CASA* at ₹ 1,202 Cr
Launched fully digital savings account and fixed deposit; also launched Privilege Savings accounts targeting high value customers
MicroBanking & Rural Banking
Disbursement of ₹ 2,879 Cr in Q2-FY20 up 34% from Q2-FY19; led by process efficiencies & growth in individual lending
Family Banking – Successfully launched pan-India, acquired 45,000 unique customers with a deposit base of ₹ 15 Cr
New Lending products - Kisan Pragati Card; additional offerings for improving CASA - UPI Based QR Code for merchant payments
MSE
Increased geographical footprints covering 277 branches; Disbursement in Q2-FY20 at ₹ 204 Cr up 102% from Q2-FY19
MSE Business Edge product showing good traction disbursing ₹ 14 Cr in Q2-FY20;
Affordable Housing
Disbursement of ₹ 232 Cr in Q2-FY20 vs. ₹ 130 Cr in Q2-FY19
Strong focus on PMAY- passed on ₹ 34.35 Cr subsidy to the customers till date
USFB: Performance Highlights (2/2)
*CASA includes institutional CASA
11
Q2-FY20 Business and Operational Highlights – USFB
Gross Advances^
• ₹12,864 Crore as of Sept’19 • 54.7% y-o-y growth
Loan Composition
• Non-MicroBanking* book constitutes 20.8% against 11.2% in Sept’18
Disbursements
• ₹3,606 Crore for Q2-FY20 • 51.3% y-o-y growth
Secured Loan Book
• 19.4% to total loan book • 235.4% y-o-y growth
Asset Quality
• GNPA at 0.9%, NNPA at 0.3% • Adequate PCR at 61%
Deposits
• Deposits constitute 78.7% of Gross Advances^
• Limited reliance on CD
Retail Deposits
• Retail deposits at 41.9% against 30.1% in Sep’18
#Net Advances
• ₹12,780 Crore as of Sept’19 • 56.5% y-o-y growth
^ Gross Advances includes Securitisation /IBPC & Provision; MicroBanking includes Group/ Individual loans , Rural Banking
#Net Advances excludes IBPC/Securitization & NPA provisions
*Non-MicroBanking Book includes MSE, Affordable Housing, Personal Loans, Lending to NBFC & MFI’s
Y-o-Y refers to Q2-FY20 vs Q2-FY19 comparison
Branch Network
• 552 banking outlets including 141 in URCs
• 4 asset centers
12
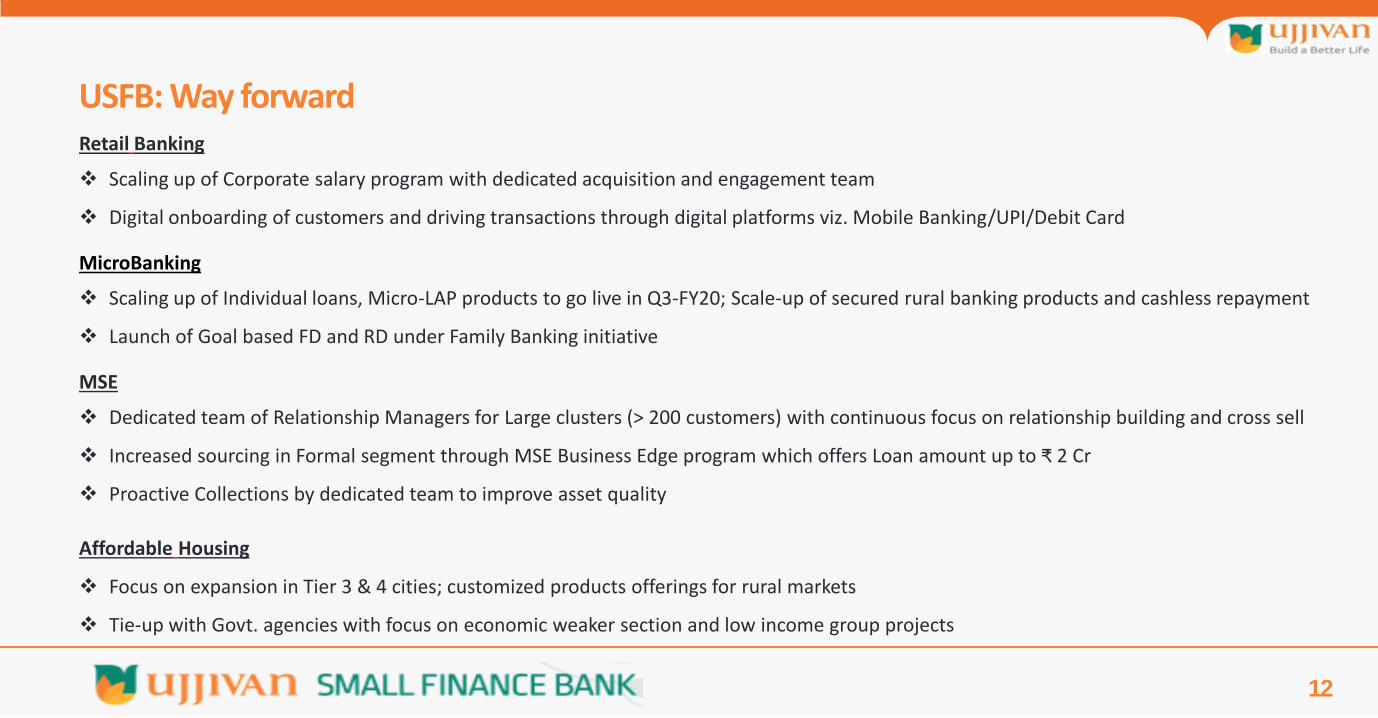
Retail Banking
Scaling up of Corporate salary program with dedicated acquisition and engagement team
Digital onboarding of customers and driving transactions through digital platforms viz. Mobile Banking/UPI/Debit Card
MicroBanking
Scaling up of Individual loans, Micro-LAP products to go live in Q3-FY20; Scale-up of secured rural banking products and cashless repayment
Launch of Goal based FD and RD under Family Banking initiative
MSE
Dedicated team of Relationship Managers for Large clusters (> 200 customers) with continuous focus on relationship building and cross sell
Increased sourcing in Formal segment through MSE Business Edge program which offers Loan amount up to ₹ 2 Cr
Proactive Collections by dedicated team to improve asset quality
Affordable Housing
Focus on expansion in Tier 3 & 4 cities; customized products offerings for rural markets
Tie-up with Govt. agencies with focus on economic weaker section and low income group projects
USFB: Way forward
13
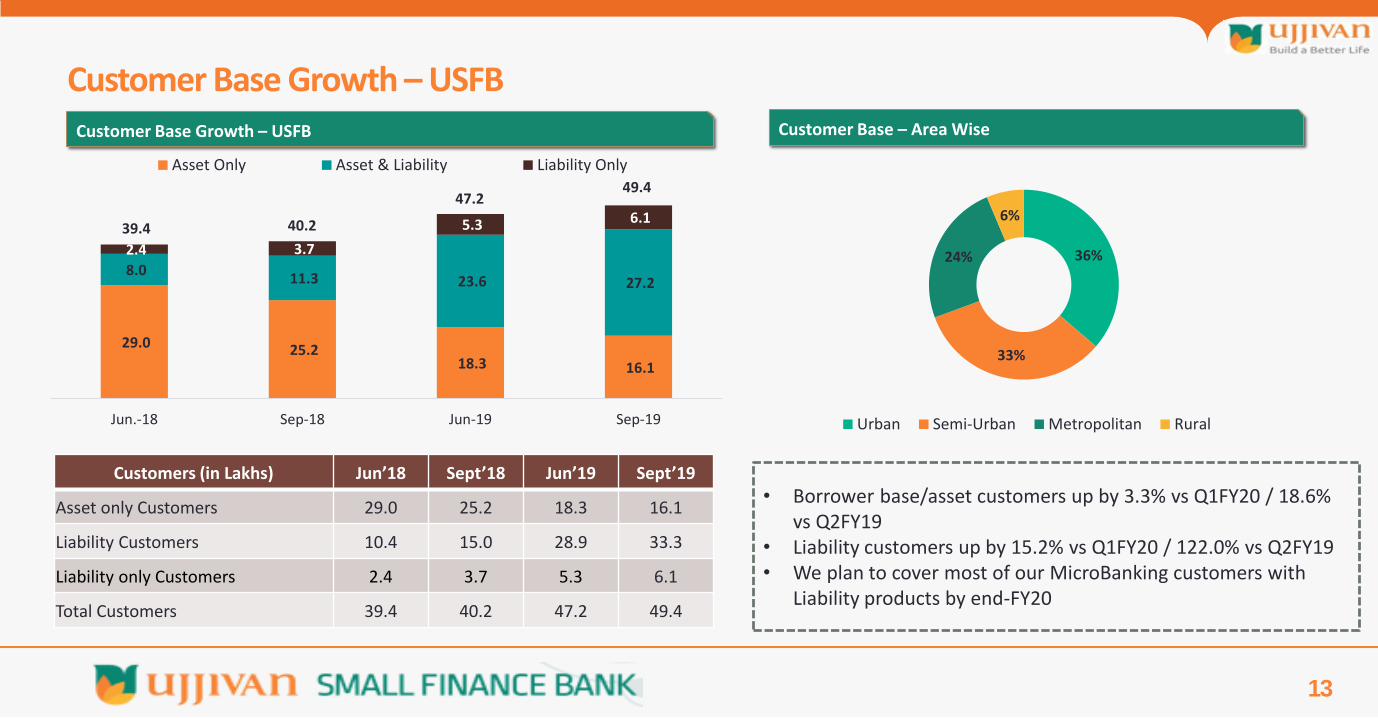
Customers (in Lakhs) Jun’18 Sept’18 Jun’19 Sept’19
Asset only Customers 29.0 25.2 18.3 16.1
Liability Customers 10.4 15.0 28.9 33.3
Liability only Customers 2.4 3.7 5.3 6.1
Total Customers 39.4 40.2 47.2 49.4
Customer Base Growth – USFB Customer Base – Area Wise Customer Base Growth – USFB
36%
33%
24%
6%
Urban Semi-Urban Metropolitan Rural
• Borrower base/asset customers up by 3.3% vs Q1FY20 / 18.6% vs Q2FY19
• Liability customers up by 15.2% vs Q1FY20 / 122.0% vs Q2FY19 • We plan to cover most of our MicroBanking customers with
Liability products by end-FY20
29.0 25.2 18.3 16.1
8.0 11.3 23.6 27.2
2.4 3.7
5.3 6.1
Jun.-18 Sep-18 Jun-19 Sep-19
Asset Only Asset & Liability Liability Only
47.2
40.2
49.4
39.4
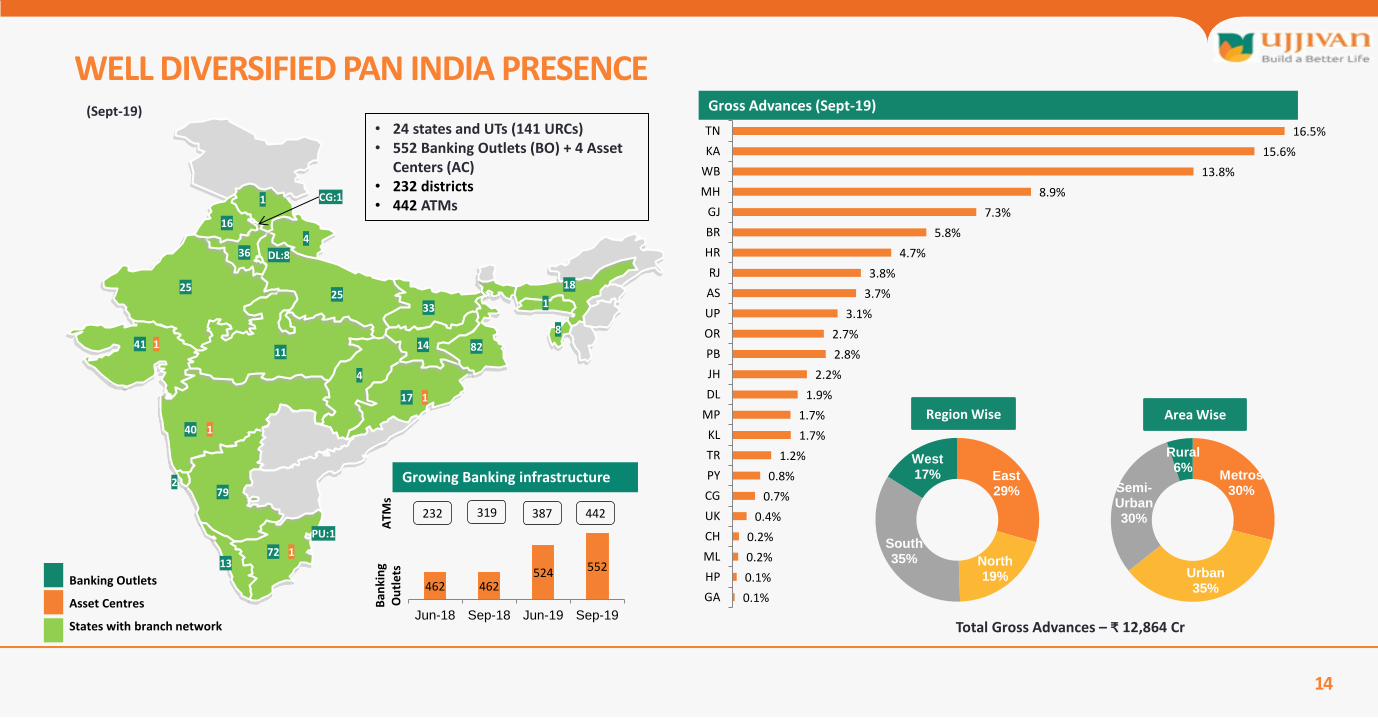
16.5%
15.6%
13.8%
8.9%
7.3%
5.8%
4.7%
3.8%
3.7%
3.1%
2.7%
2.8%
2.2%
1.9%
1.7%
1.7%
1.2%
0.8%
0.7%
0.4%
0.2%
0.2%
0.1%
0.1%
TN
KA
WB
MH
GJ
BR
HR
RJ
AS
UP
OR
PB
JH
DL
MP
KL
TR
PY
CG
UK
CH
ML
HP
GA
Metros 30%
Urban 35%
Semi-Urban 30%
Rural 6%
East 29%
North 19%
South 35%
West 17%
States with branch network
72
Total Gross Advances – ₹ 12,864 Cr
33
79
13
18
1
1
8
PU:1
DL:8
CG:1
Gross Advances (Sept-19) (Sept-19)
Ban
kin
g O
utl
ets
A
TMs
232 387 442
Growing Banking infrastructure
WELL DIVERSIFIED PAN INDIA PRESENCE
14
1
2
40 1
41 1 11
4
17 1
14
25 25
82
16
4 36
Banking Outlets
Asset Centres
462 462 524 552
Jun-18 Sep-18 Jun-19 Sep-19
319
Region Wise Area Wise
• 24 states and UTs (141 URCs) • 552 Banking Outlets (BO) + 4 Asset
Centers (AC) • 232 districts • 442 ATMs
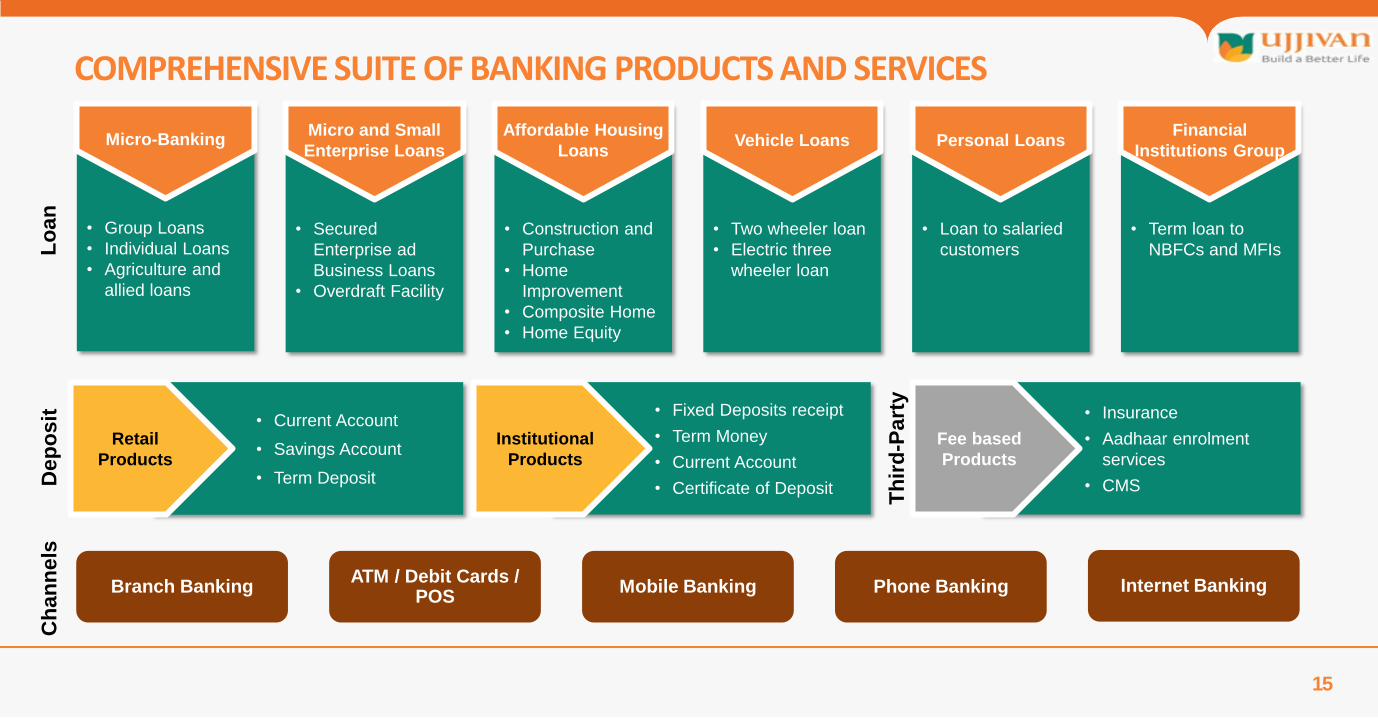
Lo
an
• Group Loans
• Individual Loans
• Agriculture and
allied loans
Micro-Banking
• Secured
Enterprise ad
Business Loans
• Overdraft Facility
Micro and Small
Enterprise Loans
• Construction and
Purchase
• Home
Improvement
• Composite Home
• Home Equity
Affordable Housing
Loans
• Two wheeler loan
• Electric three
wheeler loan
Vehicle Loans
• Loan to salaried
customers
Personal Loans
• Term loan to
NBFCs and MFIs
Financial
Institutions Group
15
COMPREHENSIVE SUITE OF BANKING PRODUCTS AND SERVICES D
ep
osit
• Current Account
• Savings Account
• Term Deposit
Retail
Products
• Fixed Deposits receipt
• Term Money
• Current Account
• Certificate of Deposit
Institutional
Products
Th
ird
-Pa
rty
• Insurance
• Aadhaar enrolment
services
• CMS
Fee based
Products
Ch
an
nels
Branch Banking ATM / Debit Cards /
POS Mobile Banking Phone Banking Internet Banking
BUILDING A STABLE LIABILITY FRANCHISE
16
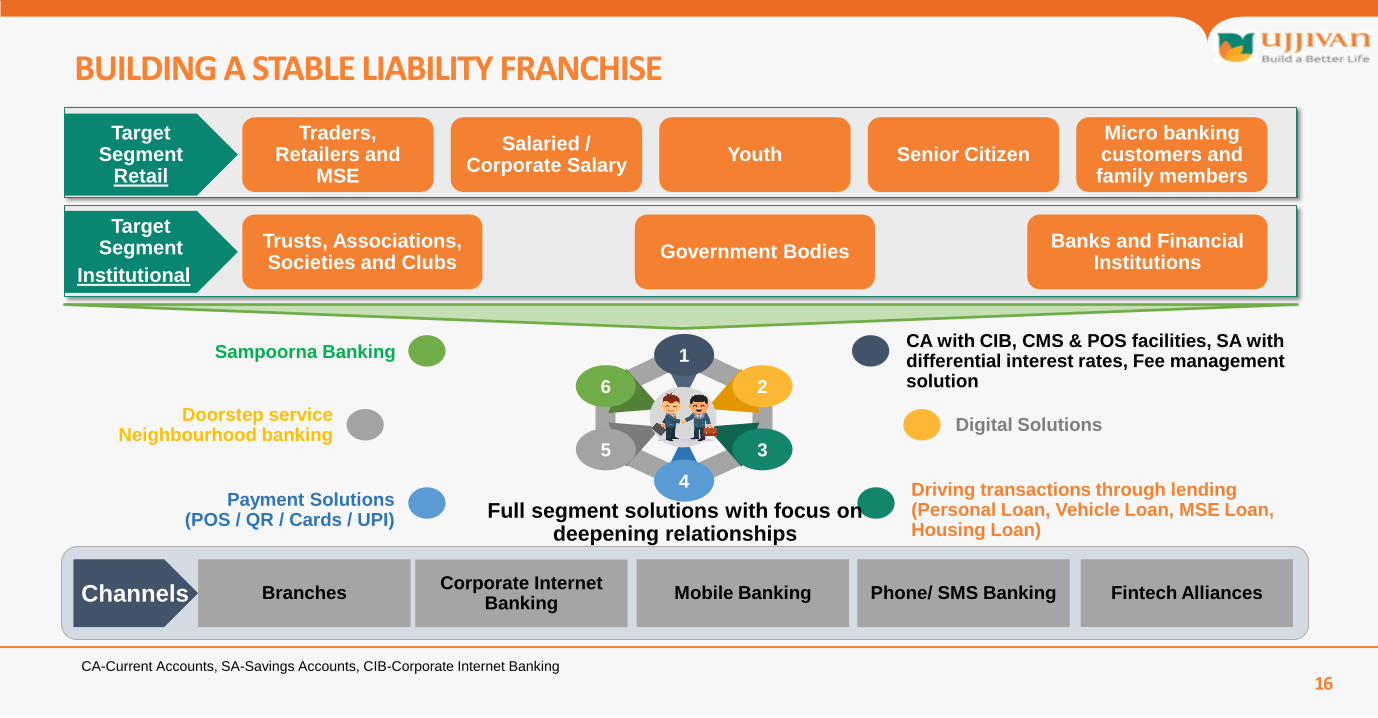
Target Segment
Retail
Traders, Retailers and
MSE
Salaried / Corporate Salary
Youth Senior Citizen Micro banking customers and family members
Target Segment Trusts, Associations,
Societies and Clubs Government Bodies
Banks and Financial Institutions
Institutional
CA with CIB, CMS & POS facilities, SA with differential interest rates, Fee management solution
Digital Solutions
Driving transactions through lending (Personal Loan, Vehicle Loan, MSE Loan, Housing Loan)
1
2
3
4
5
6
Sampoorna Banking
Doorstep service Neighbourhood banking
Payment Solutions (POS / QR / Cards / UPI) Full segment solutions with focus on
deepening relationships
Branches Corporate Internet
Banking Mobile Banking Phone/ SMS Banking Fintech Alliances Channels
CA-Current Accounts, SA-Savings Accounts, CIB-Corporate Internet Banking
17
Business Performance Overview Ujjivan Small Finance Bank
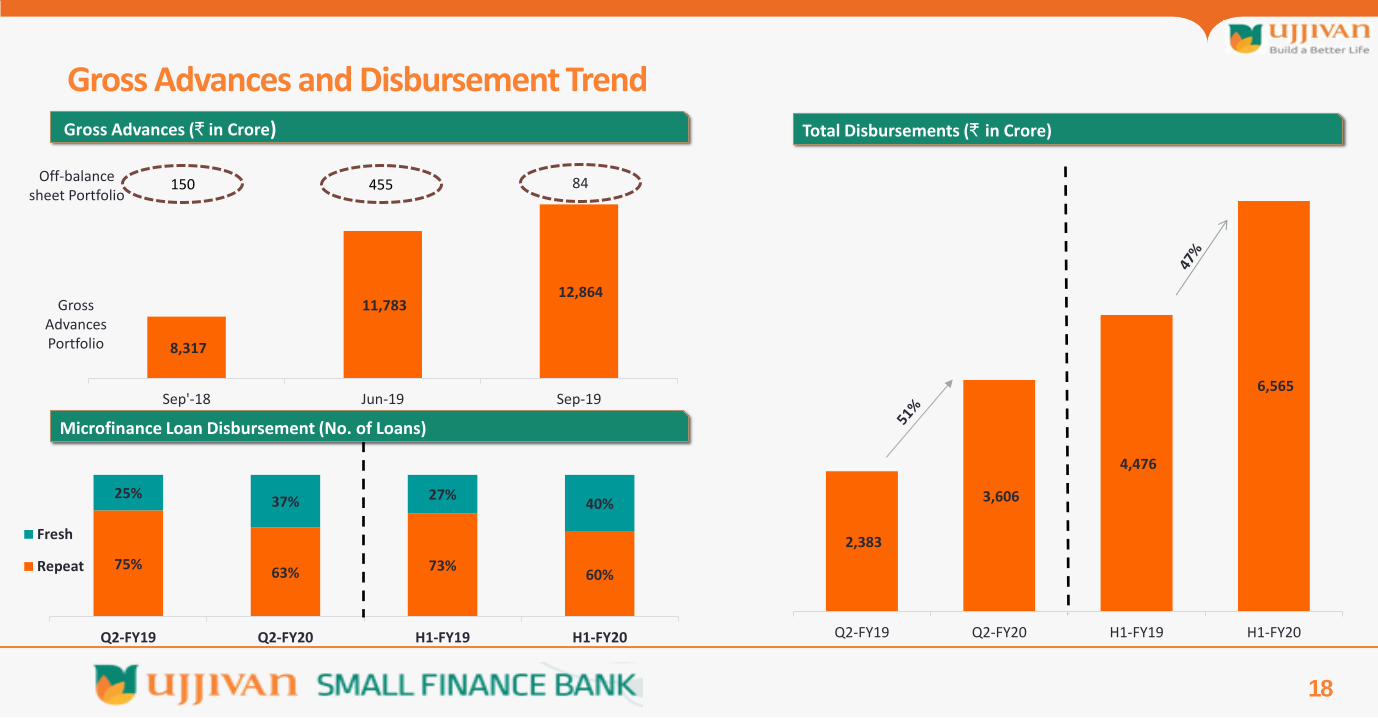
Gross Advances and Disbursement Trend
18
8,317
11,783 12,864
Sep'-18 Jun-19 Sep-19
Gross Advances (₹ in Crore)
Microfinance Loan Disbursement (No. of Loans)
75% 63% 73%
60%
25% 37% 27%
40%
Q2-FY19 Q2-FY20 H1-FY19 H1-FY20
Fresh
Repeat
Gross Advances Portfolio
84 Off-balance sheet Portfolio
150 455
2,383
3,606
4,476
6,565
Q2-FY19 Q2-FY20 H1-FY19 H1-FY20
Total Disbursements (₹ in Crore)
Branch location wise Gross Advances break-up
19
Gross Advances Snapshot
21% 21% 21%
19% 18% 17%
14% 14% 14%
20% 20% 20%
Q2-FY19 Q1-FY20 Q2-FY20
MicroBanking MSE Affordable Housing Overall
Yield (%) – Segment wise
Product % Gross Advances Growth Y-o-Y Growth Q-o-Q
Group Loans 70.1% 34.4% 4.3% Micro Individual Loans 8.4% 59.6% 12.3%
Agri & Allied loans 0.7% - 90.1%
MicroBanking 79.2% 38.0% 5.5%
MSE 6.5% 137.1% 21.7%
Affordable Housing 9.4% 127.3% 20.3%
FIG Lending 4.1% 1985.6% 45.5%
Others 0.8% 409.0% 43.3%
Total 100.0% 54.7% 9.2%
Gross Advances– Segment wise (₹ in Crore)
6,706 8,643 9,012
680 967 1,086
352
49 92 686 835
1,212
Sep.-18 Jun-19 Sep-19
Group Loans Micro Individual Loans Agri & Allied LoansMSE Affordable Housing FIGOthers
25
521
1,007
35%
30%
30%
6% Urban
Semi-Urban
Metropolitan
Rural
358
533 24
73
105
20
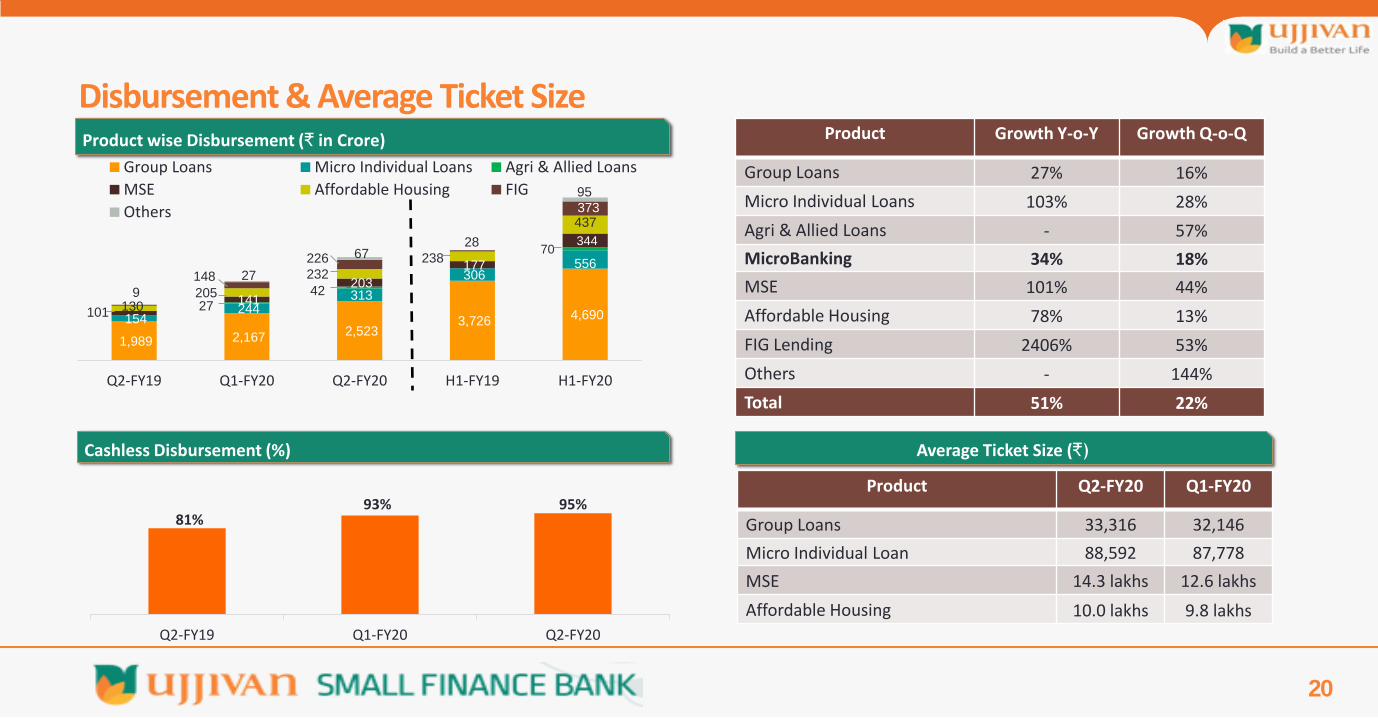
Product wise Disbursement (₹ in Crore)
Product Q2-FY20 Q1-FY20
Group Loans 33,316 32,146
Micro Individual Loan 88,592 87,778
MSE 14.3 lakhs 12.6 lakhs
Affordable Housing 10.0 lakhs 9.8 lakhs
Average Ticket Size (₹)
Product Growth Y-o-Y Growth Q-o-Q
Group Loans 27% 16%
Micro Individual Loans 103% 28%
Agri & Allied Loans - 57%
MicroBanking 34% 18%
MSE 101% 44%
Affordable Housing 78% 13%
FIG Lending 2406% 53%
Others - 144%
Total 51% 22%
Cashless Disbursement (%)
Disbursement & Average Ticket Size
1,989 2,167 2,523 3,726 4,690 154
244 313
306
556
27 42
70
101 141
203
177
344
130 205
232
238
437
148
226
28
373
27
67
95
Q2-FY19 Q1-FY20 Q2-FY20 H1-FY19 H1-FY20
Group Loans Micro Individual Loans Agri & Allied Loans
MSE Affordable Housing FIG
Others
9
81% 93% 95%
Q2-FY19 Q1-FY20 Q2-FY20
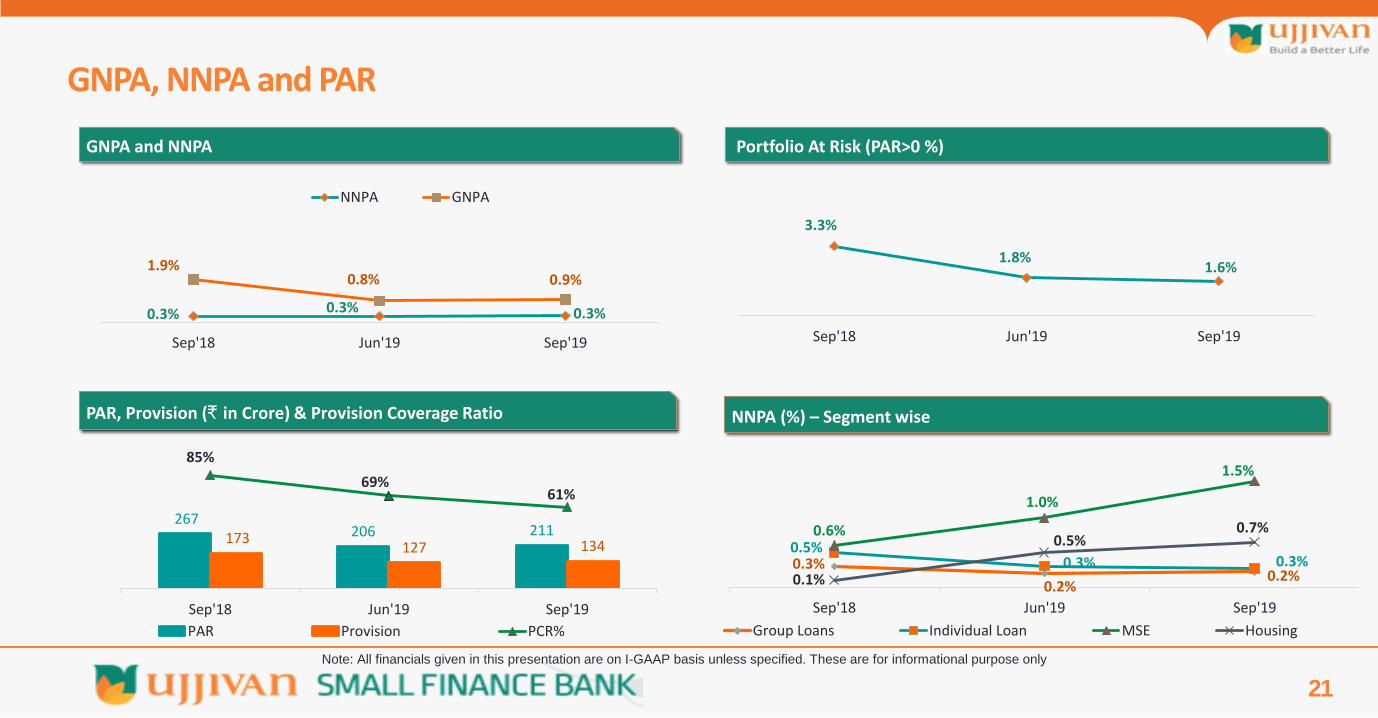
GNPA, NNPA and PAR
21
GNPA and NNPA
PAR, Provision (₹ in Crore) & Provision Coverage Ratio
Portfolio At Risk (PAR>0 %)
NNPA (%) – Segment wise
267 206 211 173
127 134
85%
69% 61%
Sep'18 Jun'19 Sep'19
PAR Provision PCR%
0.3%
0.2% 0.2%
0.5% 0.3% 0.3%
0.6%
1.0%
1.5%
0.1%
0.5% 0.7%
Sep'18 Jun'19 Sep'19
Group Loans Individual Loan MSE Housing
0.3% 0.3% 0.3%
1.9% 0.8% 0.9%
Sep'18 Jun'19 Sep'19
NNPA GNPA
3.3%
1.8% 1.6%
Sep'18 Jun'19 Sep'19
Note: All financials given in this presentation are on I-GAAP basis unless specified. These are for informational purpose only
22
Credit Cost – Net Impact on P/L Q1 FY20 Q2 FY20
Provision on NPA 66.7 66.9
Write off 16.1 16.5
Less: Bad Debt Recovery 7.6 8.4
Credit Cost – Net Impact on P/L 18.8 24.8
Movement of Gross NPA
Opening Gross NPA 97.9 95.8
Additions during the period 23.3 41.1
Reductions during the period 25.6 27.5
-On Account of recovery 8.8 10.1
-On Account of write off 16.1 16.5
-On Account of upgradation 1.5 0.9
Gross NPA (closing) 95.8 109.4
Stable Asset Quality (₹ in Crore)
Note: All financials given in this presentation are on I-GAAP basis unless specified. These are for informational purpose only
23
Liabilities Profile Ujjivan Small Finance Bank
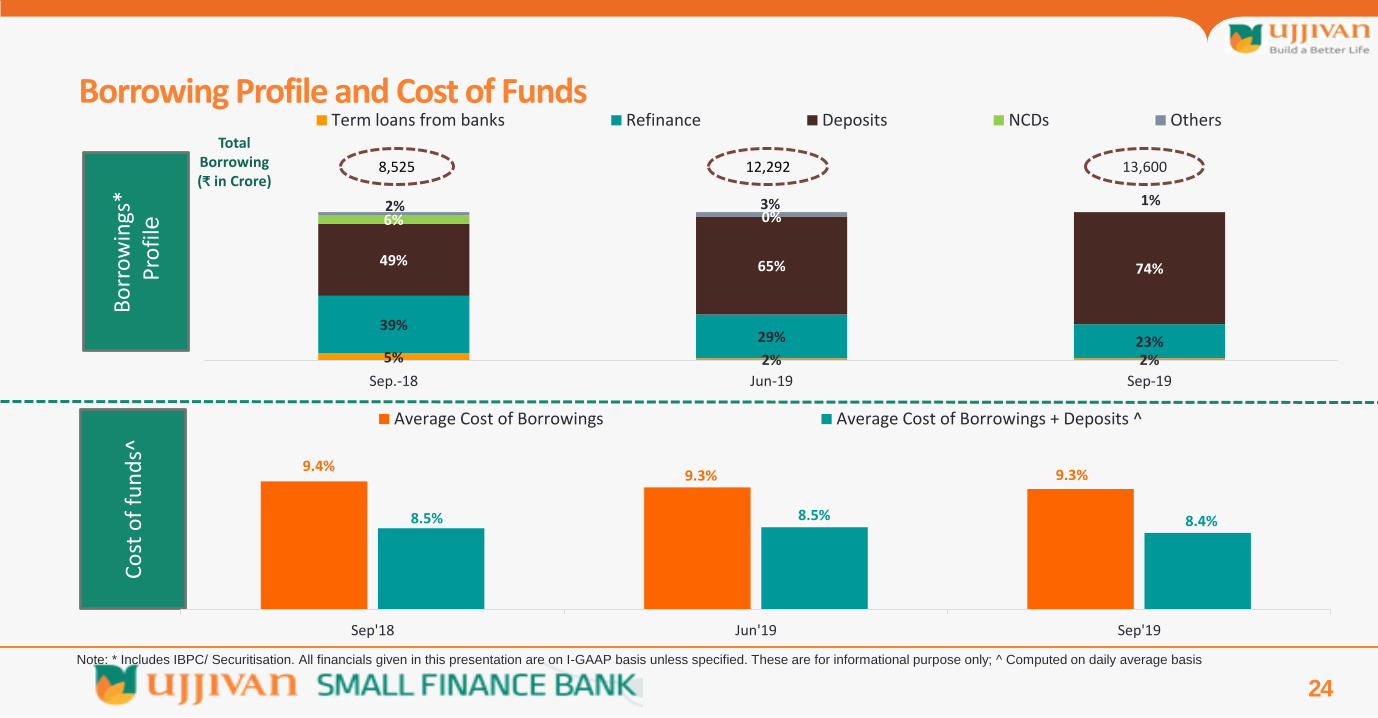
5% 2% 2%
39% 29% 23%
49% 65% 74%
6% 0% 2% 3% 1%
Sep.-18 Jun-19 Sep-19
Term loans from banks Refinance Deposits NCDs Others
24
Bo
rro
win
gs*
P
rofi
le
Co
st o
f fu
nd
s^
12,292 8,525 13,600
Total Borrowing (₹ in Crore)
Borrowing Profile and Cost of Funds
9.4% 9.3% 9.3%
8.5% 8.5% 8.4%
Sep'18 Jun'19 Sep'19
Average Cost of Borrowings Average Cost of Borrowings + Deposits ^
Note: * Includes IBPC/ Securitisation. All financials given in this presentation are on I-GAAP basis unless specified. These are for informational purpose only; ^ Computed on daily average basis
25
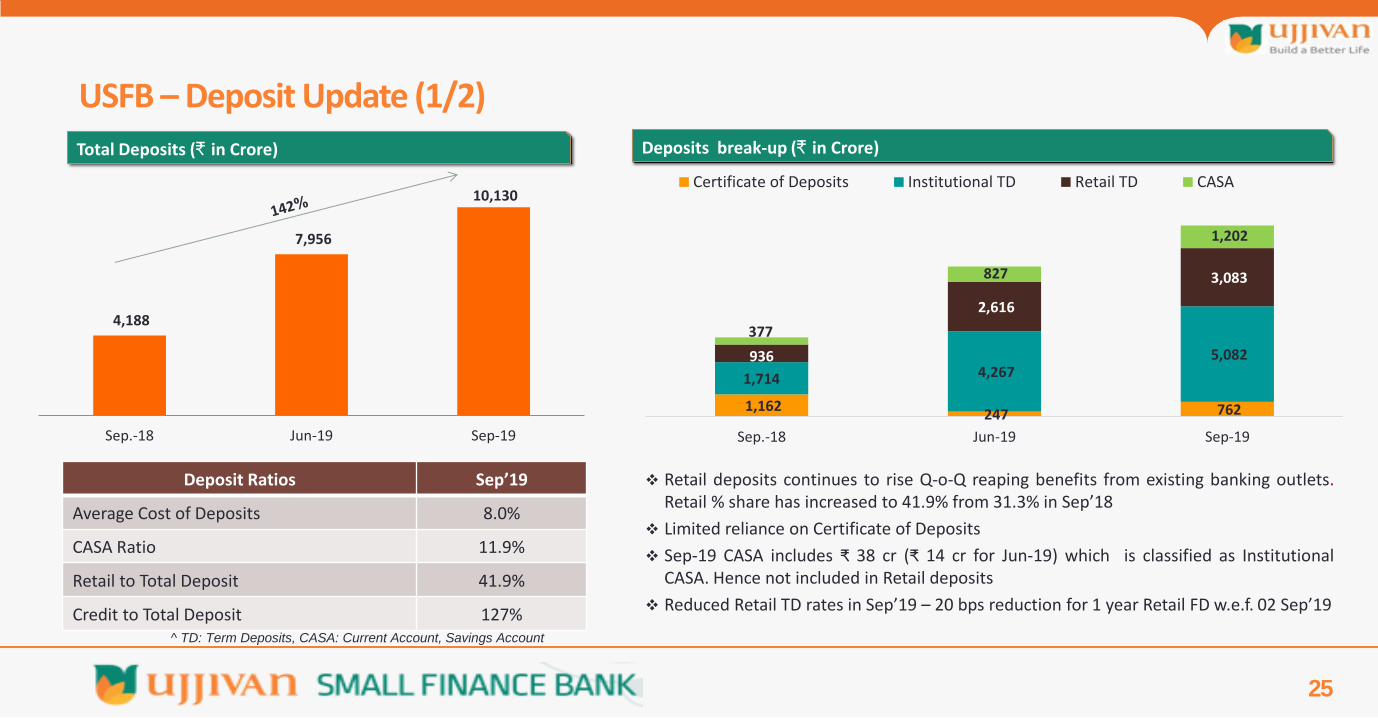
Deposit Ratios Sep’19
Average Cost of Deposits 8.0%
CASA Ratio 11.9%
Retail to Total Deposit 41.9%
Credit to Total Deposit 127%
Retail deposits continues to rise Q-o-Q reaping benefits from existing banking outlets. Retail % share has increased to 41.9% from 31.3% in Sep’18
Limited reliance on Certificate of Deposits
Sep-19 CASA includes ₹ 38 cr (₹ 14 cr for Jun-19) which is classified as Institutional CASA. Hence not included in Retail deposits
Reduced Retail TD rates in Sep’19 – 20 bps reduction for 1 year Retail FD w.e.f. 02 Sep’19
^ TD: Term Deposits, CASA: Current Account, Savings Account
Total Deposits (₹ in Crore) Deposits break-up (₹ in Crore)
USFB – Deposit Update (1/2)
1,162 247 762
1,714 4,267 5,082 936
2,616
3,083
377
827
1,202
Sep.-18 Jun-19 Sep-19
Certificate of Deposits Institutional TD Retail TD CASA
4,188
7,956
10,130
Sep.-18 Jun-19 Sep-19
31 43 42
Sep-18 Jun-19 Sep-19
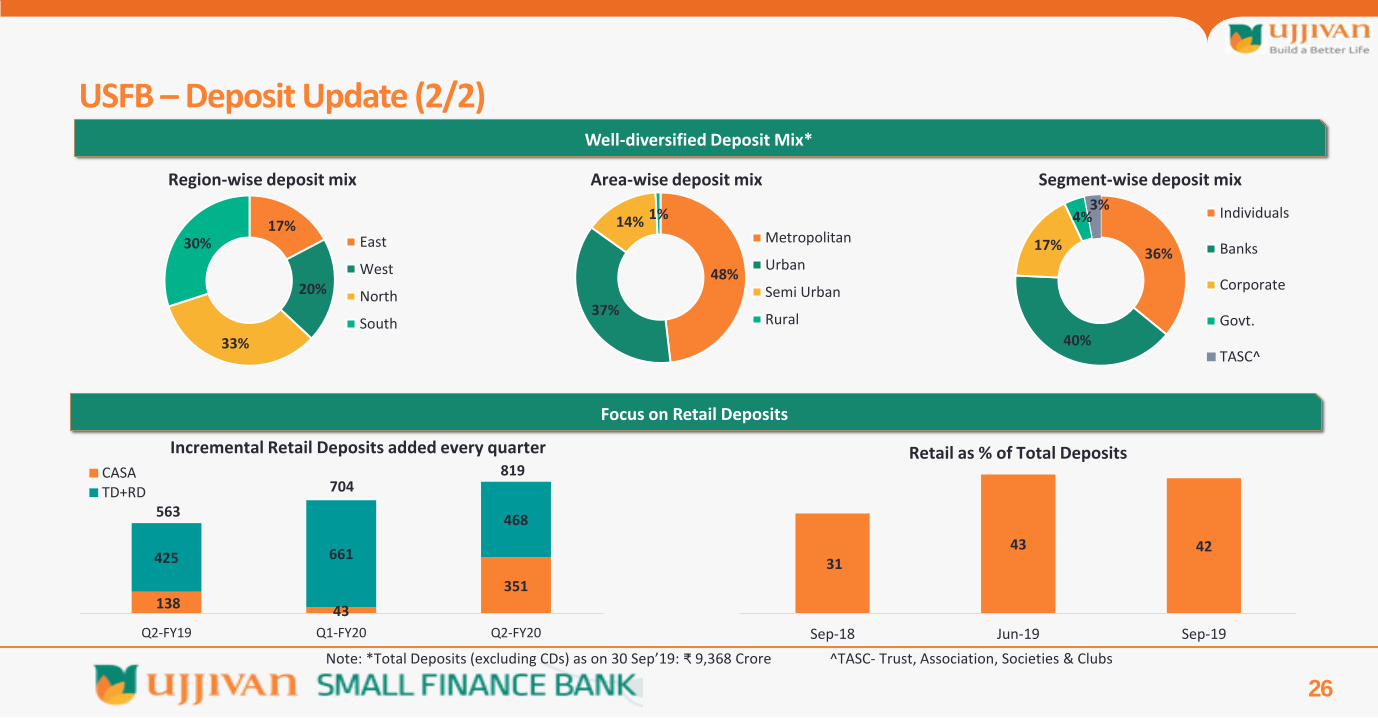
26
48%
37%
14% 1%
Metropolitan
Urban
Semi Urban
Rural
36%
40%
17%
4% 3%
Individuals
Banks
Corporate
Govt.
TASC^
Region-wise deposit mix
Well-diversified Deposit Mix*
USFB – Deposit Update (2/2)
Note: *Total Deposits (excluding CDs) as on 30 Sep’19: ₹ 9,368 Crore ^TASC- Trust, Association, Societies & Clubs
Segment-wise deposit mix Area-wise deposit mix
Focus on Retail Deposits
138 43
351
425 661
468
Q2-FY19 Q1-FY20 Q2-FY20
CASATD+RD
Retail as % of Total Deposits Incremental Retail Deposits added every quarter
17%
20%
33%
30% East
West
North
South
819
563
704
27
Sep’18 Jun’19 Sep’19
Credit Risk Weighted Assets 6,930 9,434 10,026
Tier I Capital 1,601 1,733 1,821
Tier II Capital 51 59 68
Total Capital 1,651 1,793 1,889
CRAR 23.8% 19.0% 18.8%
Tier I CRAR 23.1% 18.4% 18.1%
Tier II CRAR 0.7% 0.6% 0.7%
Adequately Capitalized (₹ in Crore)
Note: All financials given in this presentation are on I-GAAP basis unless specified. These are for informational purpose only
28
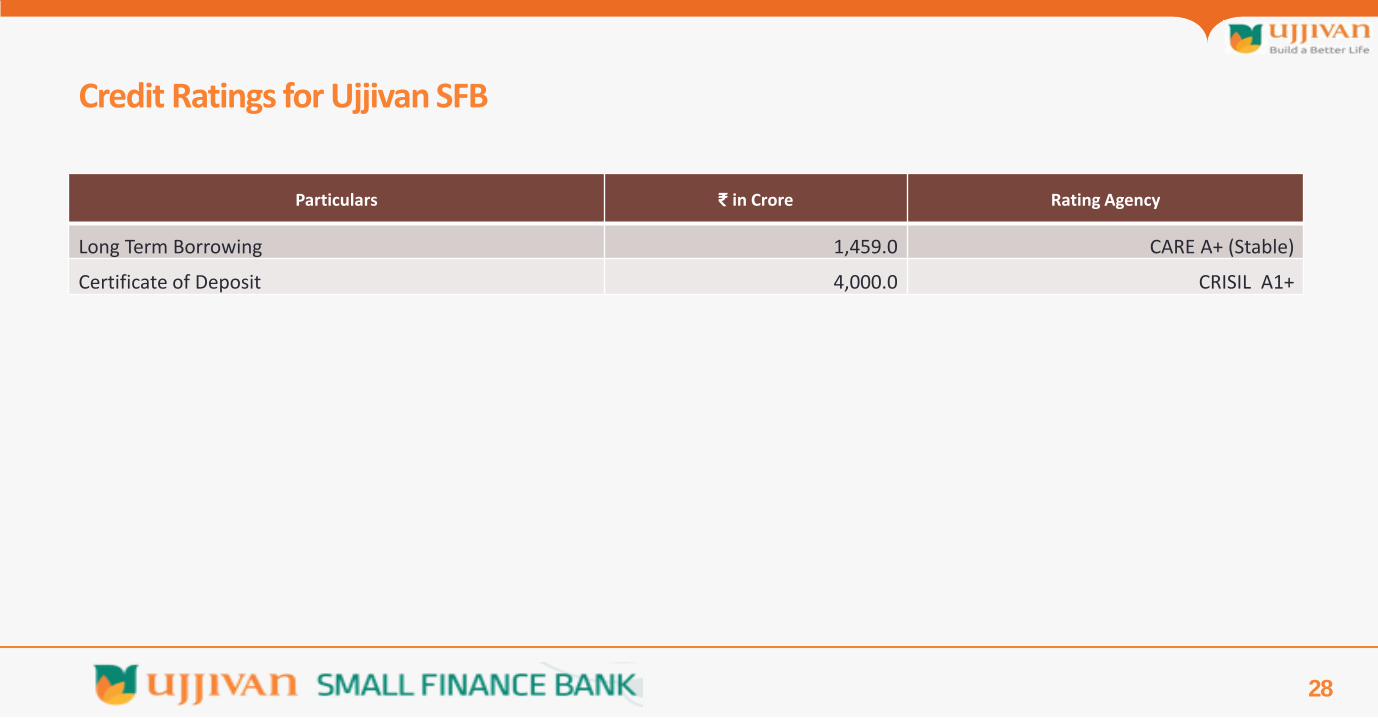
Particulars ₹ in Crore Rating Agency
Long Term Borrowing 1,459.0 CARE A+ (Stable)
Certificate of Deposit 4,000.0 CRISIL A1+
Credit Ratings for Ujjivan SFB
29
Financial Overview Ujjivan Small Finance Bank
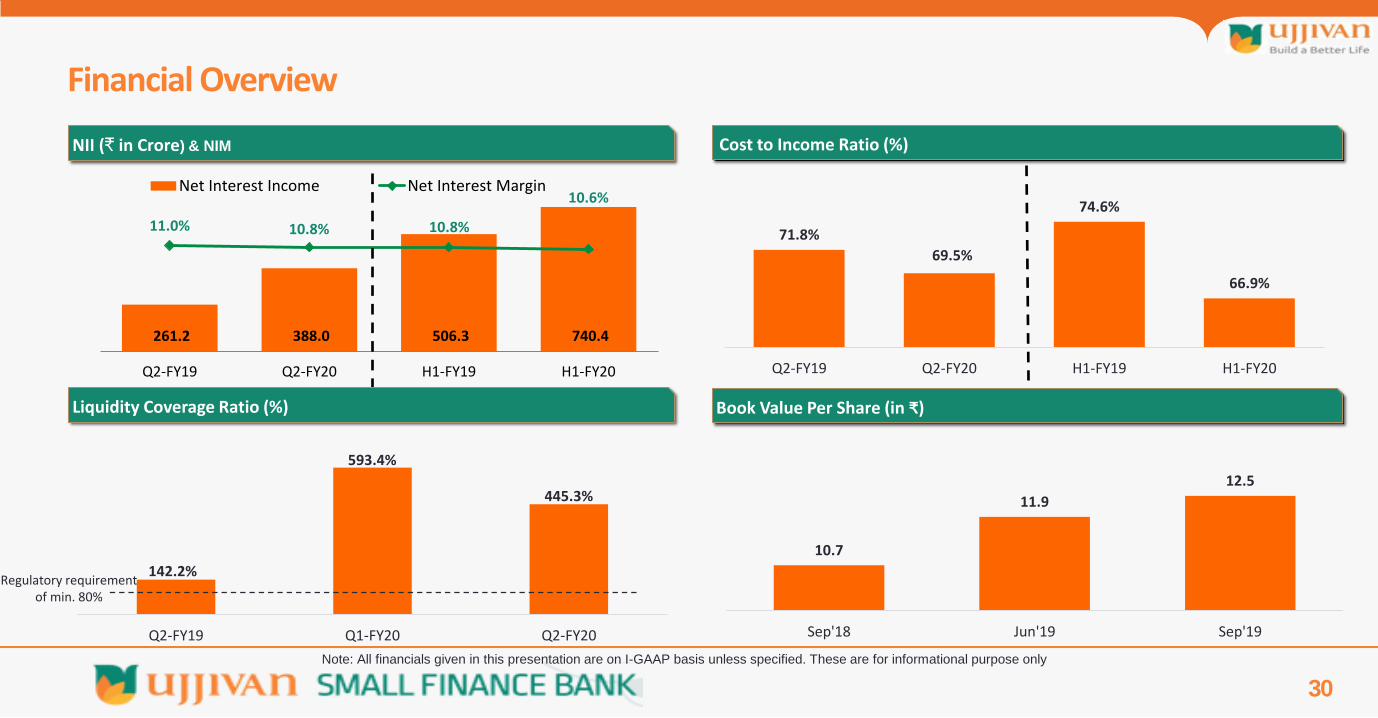
261.2 388.0 506.3 740.4
11.0% 10.8% 10.8%
10.6%
Q2-FY19 Q2-FY20 H1-FY19 H1-FY20
Net Interest Income Net Interest Margin
30
Financial Overview
Liquidity Coverage Ratio (%)
Cost to Income Ratio (%)
71.8%
69.5%
74.6%
66.9%
Q2-FY19 Q2-FY20 H1-FY19 H1-FY20
NII (₹ in Crore) & NIM
Book Value Per Share (in ₹)
10.7
11.9
12.5
Sep'18 Jun'19 Sep'19
Note: All financials given in this presentation are on I-GAAP basis unless specified. These are for informational purpose only
142.2%
593.4%
445.3%
Q2-FY19 Q1-FY20 Q2-FY20
Regulatory requirement of min. 80%
31
Income Statement – USFB ₹ in Crore
Note: All financials given in this presentation are on I-GAAP basis unless specified. These are for informational purpose only
Particulars Q2-FY20 Q2-FY19 YoY Growth Q1-FY20 QoQ Growth H1-FY20 H1-FY19 YoY Growth
Interest Earned 654.3 427.0 53.2% 605.4 8.1% 1,259.7 833.3 51.2%
Other Income 75.0 37.8 98.4% 100.1 (25.1%) 175.2 91.1 92.3%
Total Income 729.4 464.8 56.9% 705.5 3.4% 1,434.9 924.5 55.2%
Interest Expended 266.4 165.8 (60.7%) 252.9 (5.3%) 519.3 327.0 (58.8%)
Operating Expenses 321.6 231.5 (38.9%) 291.3 (10.4%) 613.0 445.9 (37.5%)
Provisions and Contingencies 48.8 23.5 (107.7%) 66.8 26.9% 115.5 61.5 (87.8%)
Total Expenditure 636.7 420.8 (51.3%) 611.0 (4.2%) 1,247.7 834.3 (49.6%)
Net profit for the period 92.6 44.0 110.5% 94.4 (1.9%) 187.1 90.1 107.7%
Diluted EPS 0.6 0.3 - 0.7 - 1.2 0.6 -
32
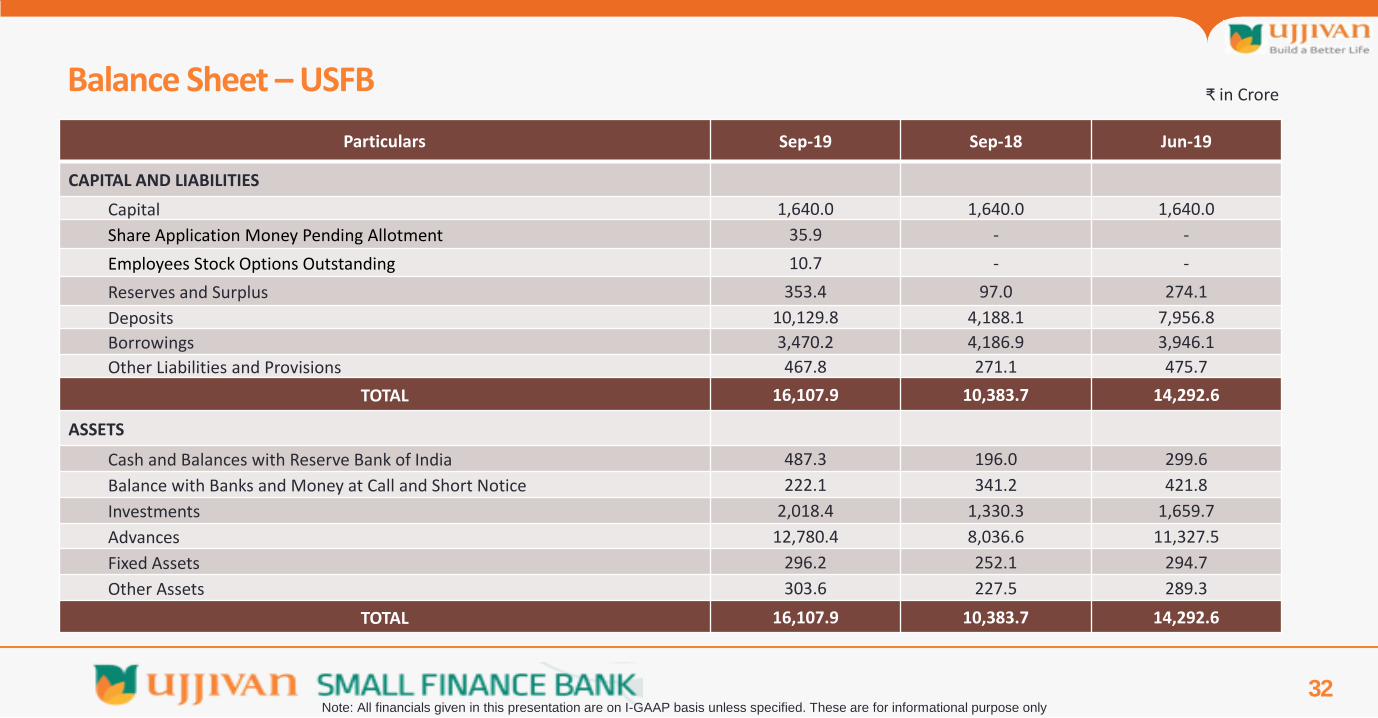
Balance Sheet – USFB
Particulars Sep-19 Sep-18 Jun-19
CAPITAL AND LIABILITIES
Capital 1,640.0 1,640.0 1,640.0
Share Application Money Pending Allotment 35.9 - -
Employees Stock Options Outstanding 10.7 - -
Reserves and Surplus 353.4 97.0 274.1
Deposits 10,129.8 4,188.1 7,956.8
Borrowings 3,470.2 4,186.9 3,946.1
Other Liabilities and Provisions 467.8 271.1 475.7
TOTAL 16,107.9 10,383.7 14,292.6
ASSETS
Cash and Balances with Reserve Bank of India 487.3 196.0 299.6
Balance with Banks and Money at Call and Short Notice 222.1 341.2 421.8
Investments 2,018.4 1,330.3 1,659.7
Advances 12,780.4 8,036.6 11,327.5
Fixed Assets 296.2 252.1 294.7
Other Assets 303.6 227.5 289.3
TOTAL 16,107.9 10,383.7 14,292.6
₹ in Crore
Note: All financials given in this presentation are on I-GAAP basis unless specified. These are for informational purpose only

33
Financial Overview Consolidated Ujjivan Financial Services
34
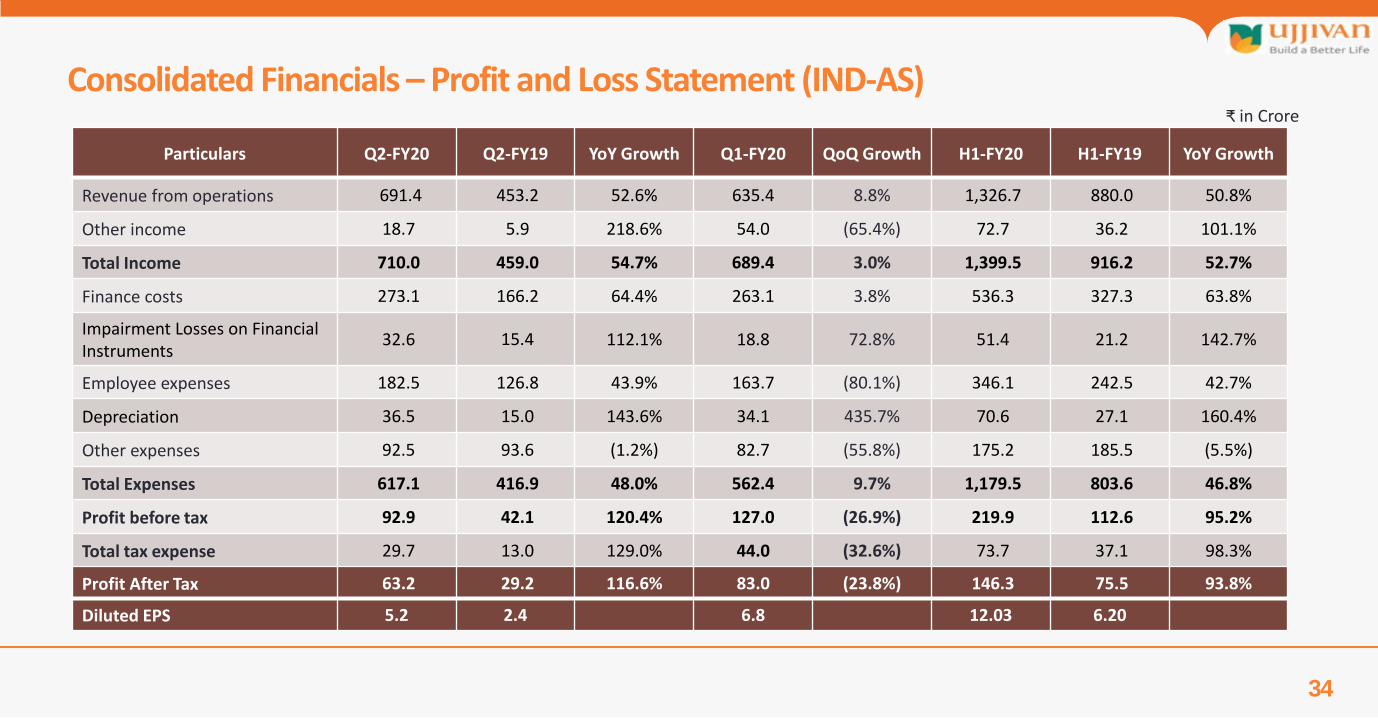
Consolidated Financials – Profit and Loss Statement (IND-AS)
Particulars Q2-FY20 Q2-FY19 YoY Growth Q1-FY20 QoQ Growth H1-FY20 H1-FY19 YoY Growth
Revenue from operations 691.4 453.2 52.6% 635.4 8.8% 1,326.7 880.0 50.8%
Other income 18.7 5.9 218.6% 54.0 (65.4%) 72.7 36.2 101.1%
Total Income 710.0 459.0 54.7% 689.4 3.0% 1,399.5 916.2 52.7%
Finance costs 273.1 166.2 64.4% 263.1 3.8% 536.3 327.3 63.8%
Impairment Losses on Financial Instruments
32.6 15.4 112.1% 18.8 72.8% 51.4 21.2 142.7%
Employee expenses 182.5 126.8 43.9% 163.7 (80.1%) 346.1 242.5 42.7%
Depreciation 36.5 15.0 143.6% 34.1 435.7% 70.6 27.1 160.4%
Other expenses 92.5 93.6 (1.2%) 82.7 (55.8%) 175.2 185.5 (5.5%)
Total Expenses 617.1 416.9 48.0% 562.4 9.7% 1,179.5 803.6 46.8%
Profit before tax 92.9 42.1 120.4% 127.0 (26.9%) 219.9 112.6 95.2%
Total tax expense 29.7 13.0 129.0% 44.0 (32.6%) 73.7 37.1 98.3%
Profit After Tax 63.2 29.2 116.6% 83.0 (23.8%) 146.3 75.5 93.8%
Diluted EPS 5.2 2.4 6.8 12.03 6.20
₹ in Crore
35
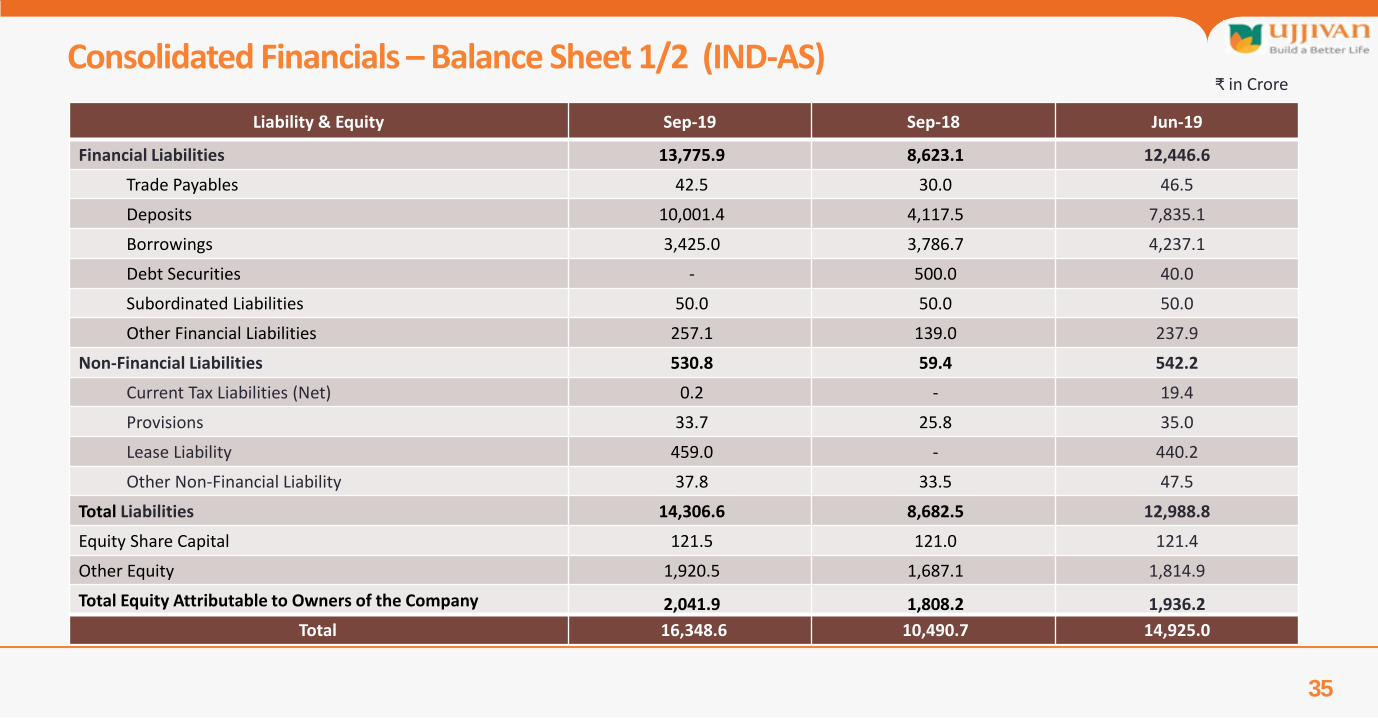
Consolidated Financials – Balance Sheet 1/2 (IND-AS)
Liability & Equity Sep-19 Sep-18 Jun-19
Financial Liabilities 13,775.9 8,623.1 12,446.6
Trade Payables 42.5 30.0 46.5
Deposits 10,001.4 4,117.5 7,835.1
Borrowings 3,425.0 3,786.7 4,237.1
Debt Securities - 500.0 40.0
Subordinated Liabilities 50.0 50.0 50.0
Other Financial Liabilities 257.1 139.0 237.9
Non-Financial Liabilities 530.8 59.4 542.2
Current Tax Liabilities (Net) 0.2 - 19.4
Provisions 33.7 25.8 35.0
Lease Liability 459.0 - 440.2
Other Non-Financial Liability 37.8 33.5 47.5
Total Liabilities 14,306.6 8,682.5 12,988.8
Equity Share Capital 121.5 121.0 121.4
Other Equity 1,920.5 1,687.1 1,814.9
Total Equity Attributable to Owners of the Company 2,041.9 1,808.2 1,936.2
Total 16,348.6 10,490.7 14,925.0
₹ in Crore
36
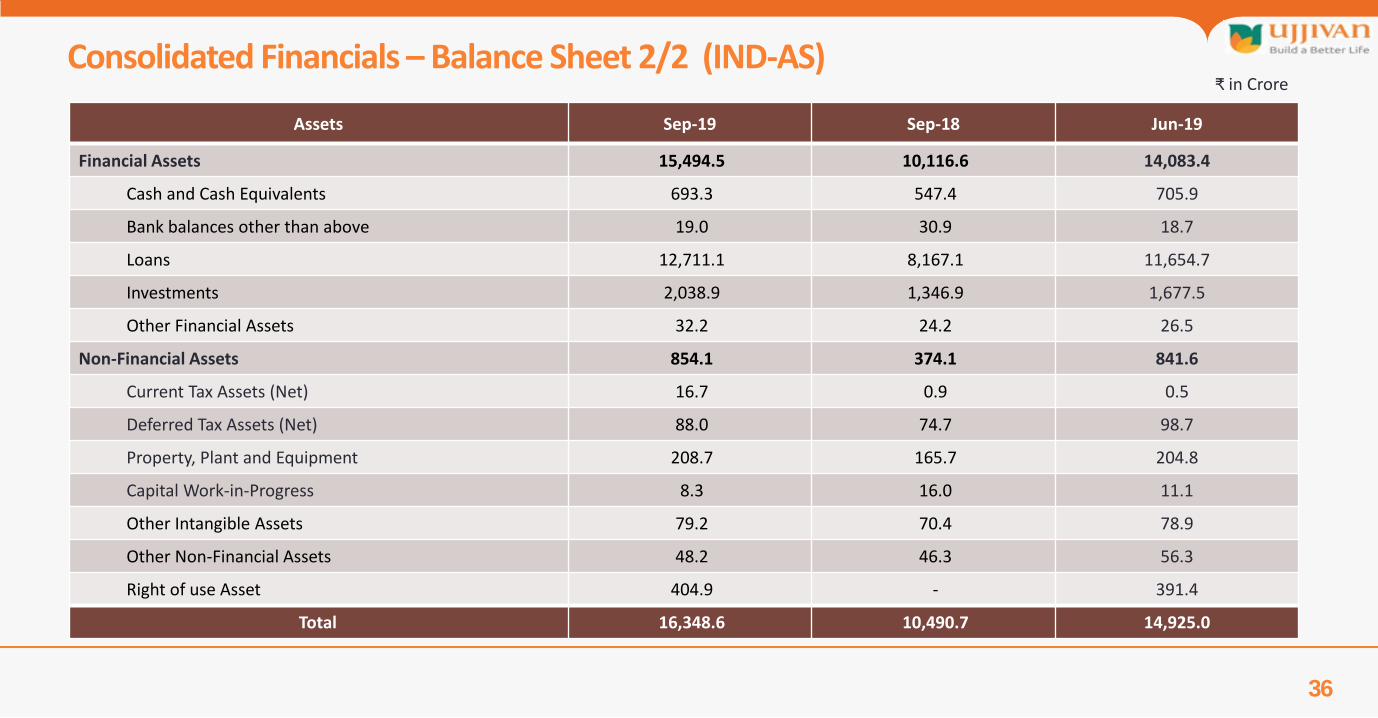
Consolidated Financials – Balance Sheet 2/2 (IND-AS) ₹ in Crore
Assets Sep-19 Sep-18 Jun-19
Financial Assets 15,494.5 10,116.6 14,083.4
Cash and Cash Equivalents 693.3 547.4 705.9
Bank balances other than above 19.0 30.9 18.7
Loans 12,711.1 8,167.1 11,654.7
Investments 2,038.9 1,346.9 1,677.5
Other Financial Assets 32.2 24.2 26.5
Non-Financial Assets 854.1 374.1 841.6
Current Tax Assets (Net) 16.7 0.9 0.5
Deferred Tax Assets (Net) 88.0 74.7 98.7
Property, Plant and Equipment 208.7 165.7 204.8
Capital Work-in-Progress 8.3 16.0 11.1
Other Intangible Assets 79.2 70.4 78.9
Other Non-Financial Assets 48.2 46.3 56.3
Right of use Asset 404.9 - 391.4
Total 16,348.6 10,490.7 14,925.0
37
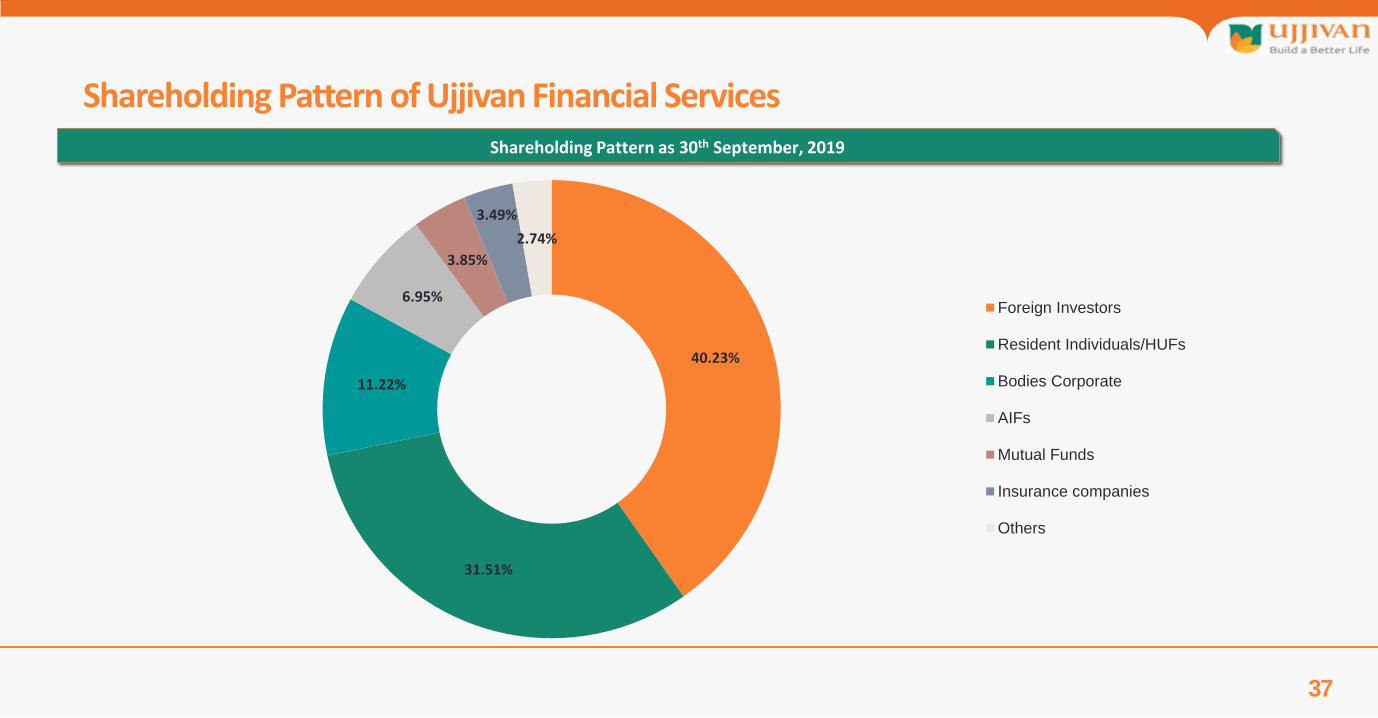
Shareholding Pattern as 30th September, 2019
Shareholding Pattern of Ujjivan Financial Services
40.23%
31.51%
11.22%
6.95%
3.85%
3.49%
2.74%
Foreign Investors
Resident Individuals/HUFs
Bodies Corporate
AIFs
Mutual Funds
Insurance companies
Others

38
Thank You!