investor presentation may 2017 - atlanta limited future performance and are subject to known and...
TRANSCRIPT
Investor Presentation
May 2017
1
Investor Presentation
May 2017
Investor Presentation
May 2017

Safe Harbor
This presentation and the accompanying slides (the “Presentation”), which have been prepared by Atlanta Limited (the
“Company”), have been prepared solely for information purposes and do not constitute any offer, recommendation or invitation to
purchase or subscribe for any securities, and shall not form the basis or be relied on in connection with any contract or binding
commitment whatsoever. No offering of securities of the Company will be made except by means of a statutory offering document
containing detailed information about the Company.
This Presentation has been prepared by the Company based on information and data which the Company considers reliable, but
the Company makes no representation or warranty, express or implied, whatsoever, and no reliance shall be placed on, the truth,
accuracy, completeness, fairness and reasonableness of the contents of this Presentation. This Presentation may not be all inclusive
and may not contain all of the information that you may consider material. Any liability in respect of the contents of, or any
omission from, this Presentation is expressly excluded.
Certain matters discussed in this Presentation may contain statements regarding the Company’s market opportunity and business
prospects that are individually and collectively forward-looking statements. Such forward-looking statements are not guarantees of
future performance and are subject to known and unknown risks, uncertainties and assumptions that are difficult to predict. These
risks and uncertainties include, but are not limited to, the performance of the Indian economy and of the economies of various
international markets, the performance of the industry in India and world-wide, competition, the company’s ability to successfully
implement its strategy, the Company’s future levels of growth and expansion, technological implementation, changes and
advancements, changes in revenue, income or cash flows, the Company’s market preferences and its exposure to market risks, as
well as other risks. The Company’s actual results, levels of activity, performance or achievements could differ materially and
adversely from results expressed in or implied by this Presentation. The Company assumes no obligation to update any forward-
looking information contained in this Presentation. Any forward-looking statements and projections made by third parties included
in this Presentation are not adopted by the Company and the Company is not responsible for such third party statements and
projections.

Financial Highlights & Updates
Q4 & FY17
3

Standalone Financials
Revenue EBIDTA PAT
All figures in Rs. mn
4
Revenue EBIDTA PAT
65%
Ann
ual
Quart
erl
y
280% 2368%
-8% 77% 64%

Annual Consolidated Financials
All figures in Rs. mn 5
60% 1134%
Revenue EBIDTA PAT
Formulated Dividend Distribution policy; recommended a dividend of 15% i.e Rs 0.30 per
equity shares of Rs 2/- each to non promoter shareholders.

Management’s Comment
Commenting on the results, Mr. Rajhoo Bbarot, Chairman,
Atlanta Ltd, said “I am pleased to present our performance
for 2016-17 wherein the Company’s consolidated revenues
increased by 60% with PAT of Rs 572 mn against loss of Rs
396 mn in FY16.
With a receivables of over ~Rs 14 bn in arbitration award, we
are focused on deleveraging and being debt free on standalone
basis by FY18.
We are very optimistic about the growth opportunities in the
infrastructure space, and are confident that based on our robust
order book, skills and execution capabilities, we should be able
to grow at a CAGR of 40-50% over the next couple of years”.
Mr. Rajhoo Bbarot, Chairman
6

Key Business Updates (FY17)
• Commencement of toll collection on Punjab Toll Project
Project involved 2/4 laning of Ropar-Chamkur Sahib-Neelon-Doraha Road (Sirhind canal) in Punjab
Length – 55 Kms
Project cost – Rs. 2.6 bn
• Awarded Hybrid Annuity (HAM) Project in Gujarat
Project involved 4/6 laning of Shamlaji- Himmatnagar-Chiloda in Gujarat
Length – 93 Kms
Project cost – Rs. 13 bn
EPC contract value to Atlanta Ltd – Rs 11.5 bn
• Atlanta & its subsidiary Atlanta Infra Asset Ltd has received part of its Arbitration Award money amounting to Rs. 3.15 bn
7

Company Overview
8

Key Highlights
9

Business Segments
• Executed various commercial and
residential projects in Mumbai , Delhi &
Rajasthan
• Focus on Affordable Housing
• Over 1.8 mn square feet of space under
various stages of development
Real Estate
• Over 4 decades experience in EPC
• Presence in DBFOT & HAM projects
• Completed more than 2,500 lane km
projects Pan- India
• Servicing clients like NHAI, MoRTH,
NHIDCL, PWD of various states, Airport
Authority of India, etc
Infrastructure
10
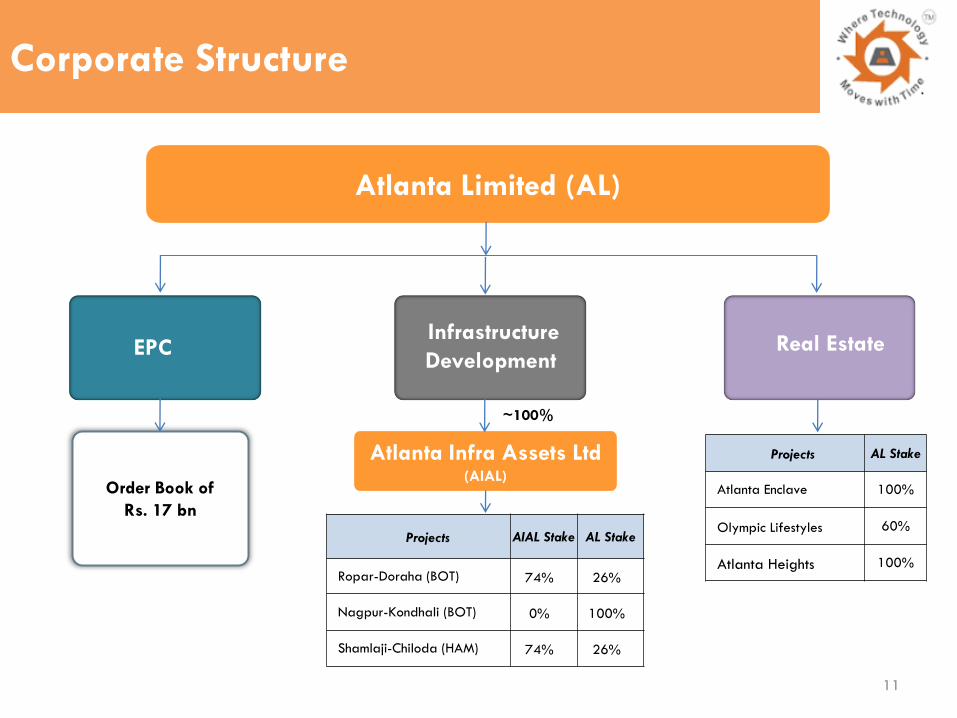
Corporate Structure
Atlanta Limited (AL)
Order Book of
Rs. 17 bn
EPC
Atlanta Infra Assets Ltd (AIAL)
Infrastructure
Development
Projects AIAL Stake AL Stake
Ropar-Doraha (BOT) 74% 26%
Nagpur-Kondhali (BOT) 0% 100%
Shamlaji-Chiloda (HAM) 74% 26%
~100%
11
Real Estate
Projects AL Stake
Atlanta Enclave 100%
Olympic Lifestyles 60%
Atlanta Heights 100%
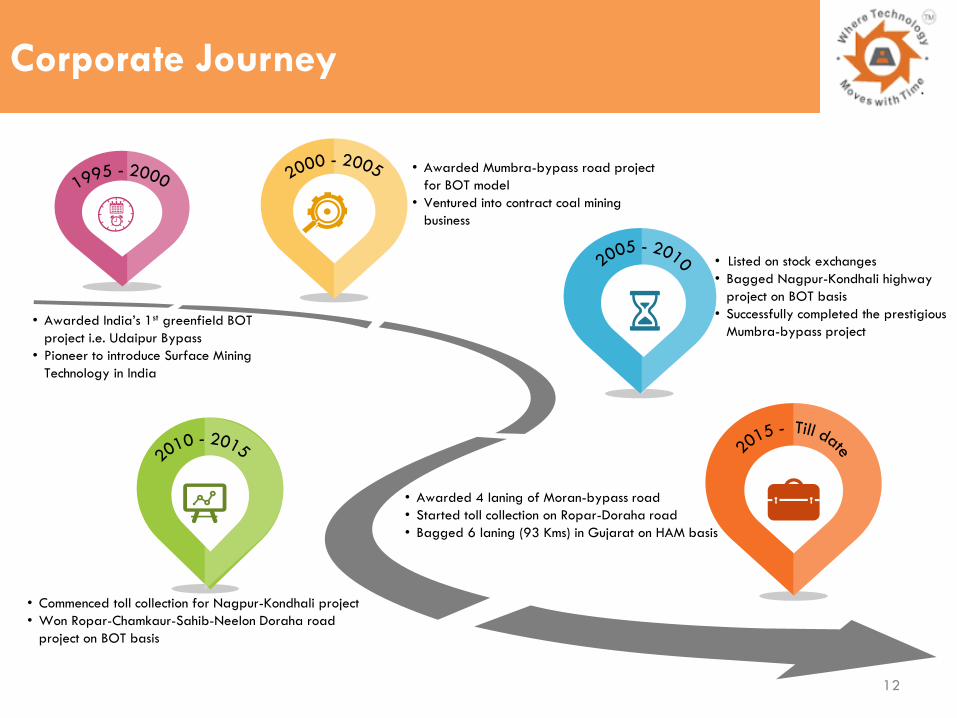
Corporate Journey
• Commenced toll collection for Nagpur-Kondhali project
• Won Ropar-Chamkaur-Sahib-Neelon Doraha road
project on BOT basis
•
• Listed on stock exchanges
• Bagged Nagpur-Kondhali highway
project on BOT basis
• Successfully completed the prestigious
Mumbra-bypass project
• Awarded Mumbra-bypass road project
for BOT model
• Ventured into contract coal mining
business
• Awarded India’s 1st greenfield BOT
project i.e. Udaipur Bypass
• Pioneer to introduce Surface Mining
Technology in India
• Awarded 4 laning of Moran-bypass road
• Started toll collection on Ropar-Doraha road
• Bagged 6 laning (93 Kms) in Gujarat on HAM basis
12

Business Strengths
13

Strong Framework for Road to Success
Robust
Order Book
Focused
Approach
De-Leveraging Experienced
Professional Team
14

Robust Order Book
Our current order book provides visibility for at least 2 years
Infrastructure Order Book (Rs bn)
15

Focused Approach
Projects
Partnership • Enter into strategic JV or form project specific
SPV for big size and large projects
End to End Services • Equipped to offer complete range of services
from designing, engineering, constructing,
operating and maintenance
• Focus on road infra projects; exited out of non-
core activities like mining, rate contract jobs
• Ensure Timely and Quality completion of projects
16

De-leveraging
Rs. mn
Debt Position Award Receivables*
* The award amount in favour of the company
Company targets to be debt free on standalone basis by FY18
FY17 Value (Rs. mn)
Standalone Debt 2,171
Consolidated Debt 10,343
17

Experienced Management Team
Rajhoo Bbarot
Chairman
• Has promoted the Company and has been
the driving force of the Company
• Has 37 years of experience in construction
business
Rikiin Bbarot
MD
• Holds Bachelor’s degree in Commerce ,
Diploma in Civil Engineering and Diploma
in Business Management
• Has an experience of 17 years in the
industry
Rajesh Verma
CFO
Ulhaas Bhole
VP- Contracts
• Holds a Bachelor’s degree in Civil
Engineering from Mumbai University with
Geotechnical Engineering as Elective Subject
• Has an experience of 30 years in the
Industry and has carried out a large number
of Projects
Narayan Joshi
CS
• Holds Bachelor’s degree in Engineering,
Post Graduate Diploma in Management
From IIM, Kolkata
• Has an experience of 24 years in the
finance industry
• Holds Bachelor’s degree in Commerce ,
Post graduate in LLB & member of Institute
of CS in India
• Has an experience of 28 years in the
Secretarial Department
18
Taj Khan
VP- Sales & Realty
• Holds Bachelor’s degree in Construction
Engineering with Masters in Marketing & LLB
from Mumbai University
• Has more than 13 years of experience in
Real State
Projects
19

Projects: EPC
Project % Stake Authority State Total Project Cost
(Rs.mn)
Date of
Commencement Execution So far
Ropar-Doraha 100 PWD (Punjab) Punjab 2,300 Apr’13 95%*
Nagpur-Kondhali
(Major maintenance work) 100 NHAI Maharashtra 350 May’16 60%
Moran Project 100 NHAI Assam 2,520 Aug’16 10%
Shamlaji-Chiloda 100 NHAI Gujarat 11,500 Oct’17 Yet to be started
Project % Stake Authority State Total Project Cost
(Rs.mn)
Dahej-Sez 100 GIDC Gujarat 1,464
Lucknow Bypass 50 NHAI U.P 2,200
Khurda-Bhubaneshwar 50 NHAI Orissa 1,189
Parlakhemundi-Mohana road 51 R & B Orissa 1,539
Nagpur-Kondhali 100 NHAI Maharashtra 3,800
Key Ongoing Projects
Key Completed Projects
20
* Toll collection has started
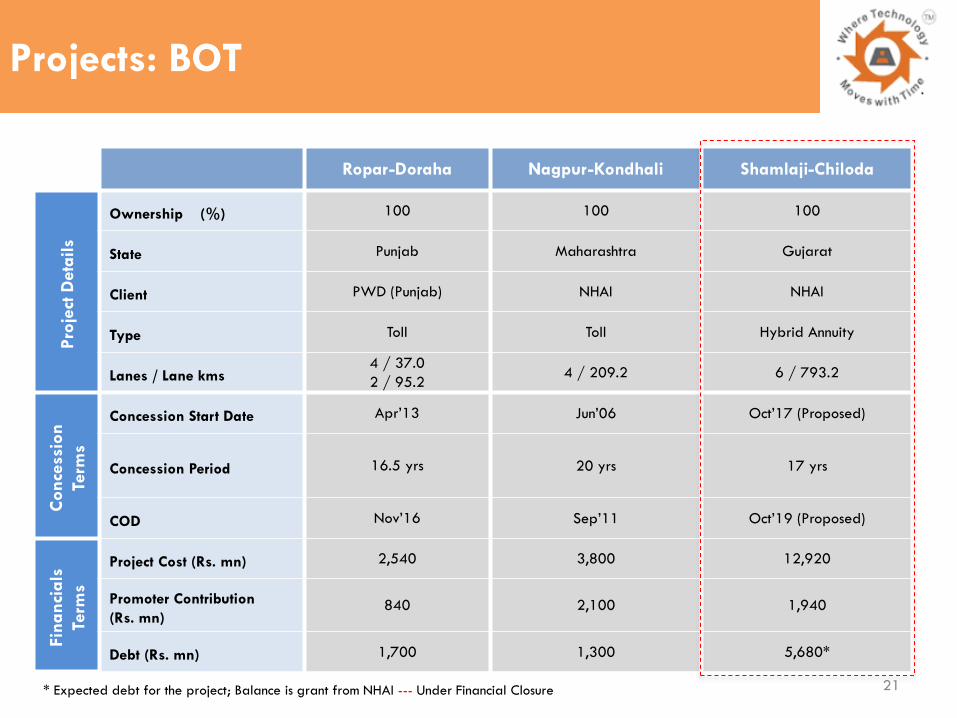
Projects: BOT
Ropar-Doraha Nagpur-Kondhali Shamlaji-Chiloda
Pro
ject
Deta
ils
Ownership (%) 100 100 100
State Punjab Maharashtra Gujarat
Client PWD (Punjab) NHAI NHAI
Type Toll Toll Hybrid Annuity
Lanes / Lane kms 4 / 37.0
2 / 95.2 4 / 209.2 6 / 793.2
Conce
ssio
n
Term
s
Concession Start Date Apr’13 Jun’06 Oct’17 (Proposed)
Concession Period 16.5 yrs 20 yrs 17 yrs
COD Nov’16 Sep’11 Oct’19 (Proposed)
Fin
anci
als
Term
s
Project Cost (Rs. mn) 2,540 3,800 12,920
Promoter Contribution
(Rs. mn) 840 2,100 1,940
Debt (Rs. mn) 1,700 1,300 5,680*
* Expected debt for the project; Balance is grant from NHAI --- Under Financial Closure 21

Real Estate
Project Name City Ownership
(%)
Area
(Mn Sq. Ft)
Project Cost
(Rs mn.) Current Status
Completion
Date
Atlanta Enclave Thane 100% 1.2 3,527 Phase I completed Dec’20
Olympic Lifestyles Jodhpur,
Rajasthan 60% 0.5 1,600 Under construction Dec’19
Atlanta Heights Mumbai 100% 0.15 750 Yet to be started NA
Total 1.85 5,877
Executed commercial projects and residential projects in
prime and emerging locations in Mumbai, Delhi & Rajasthan
Over 11 mn square feet has been completed and 1.8 mn sq
ft under various stages of development
Focus on development of premium residential, commercial,
integrated township and redevelopment of properties
Ongoing Projects
22
Opportunities
23

Infrastructure Opportunities
NHAI Award Government Initiatives
Allotted Rs 640 bn to NHAI for roads and highways and Rs 270 bn for
PMGSY
Planning to develop 35,000 kms of highways at an estimated cost of Rs
3,000 bn under the Economic Corridor Project
Proposed budgetary allocation for roads & Highways raised to Rs 649
bn in FY18
Roads & Highways
India has a road network of 4.8 mn km, the second largest globally
India has been constructing highways at a rate of 27-28 kms per day,
with the aim of speeding up the construction rate to 41 kms per day.
2,000 kms of coastal connectivity roads will be constructed
The ‘Char Dham’ project includes developing 900 kms of national
highways in Uttarakhand at a total cost of Rs 120 bn
Bid Pipeline
Bid Pipeline (Mar-May’17)
Source: NHAI, Industry reports
Project Rs. mn Kms
HAM 1,83,141 712
EPC 77,981 559
Toll 87,668 148
Total 3,48,790 1,420 NHAI has listed 27 road projects worth Rs. 349 bn totaling to 1,420
kms that are expected to be awarded in March- May 2017
The focus would continue to be on PPP basis
24
kms
Focus is more on HAM projects
going forward

Real Estate Opportunities
Market Size Government Initiatives
The government has allowed FDI of up to 100 per cent for townships &
settlements development projects
Under the Housing For All scheme, 6 crore houses are to be built in
which 4 crore in rural areas & 2 crore in urban area by 2022
Plan’s to build 100 smart cities would reduce the migration of people
to metro & other developed cities
One crore houses are to be built in rural India by 2019
Affordable housing is given Infrastructure status
Criteria for affordable housing were also revised to 30 sq. m. and 60
sq. m. on carpet rather than saleable area in the four main metros and
non-metros respectively
Real Estate
Residential segment contributes ~80 per cent of the real estate sector
India’s real estate market is expected to reach US$ 180 bn by 2020
from US$ 93.8 bn in 2014
Focus on affordable & midrange categories to meet the huge demand
By 2022, real estate and construction sector in India is expected to
generate 75 mn jobs & emerge as the largest employer in the country
Urbanization & growing household incomes are driving demand for
residential real estate & growth in the retail sector
Demand Analysis (2013-2017)
Source: IBEF
USD bn
mn sq ft
25
16
25 26
8
15 13
32
4

Financials
26

Standalone: Financial Highlights
27
Particulars (Rs.mn) Q4FY17 Q4FY16 % growth FY17 FY16 % growth
Sales 764.4 830.9 -8% 2,244.8 1,358.7 65%
Construction Expenses 233.4 569.7 -59% 648.3 843.6 -23%
% of sales 31% 69% 29% 62%
Employee Expenses 68.4 9.0 658% 115.3 53.3 116%
% of sales 9% 1% 5% 4%
Other Expenses 67.2 28.7 135% 123.8 105.0 18%
% of sales 9% 3% 6% 8%
EBIDTA 395 224 77% 1,357 357 280%
% of sales 52% 27% 60% 26%
Depreciation 11.3 9.2 24% 44.0 50.3 -12%
Finance Cost 94.7 88.2 7% 295.2 285.0 4%
% of sales 12% 11% 13% 21%
Other Income 0.04 8.28 -100% 23.88 12.2 96%
PBT 289.3 134.5 115% 1,041.9 33.9 2976%
% of sales 38% 16% 46% 2%
Taxes 73.4 3.0 217.5 0.5
PAT 215.8 131.5 64% 824.4 33.4 2368%

Standalone: Financial Highlights
28
Sources of Funds (Rs. mn) Mar-17 Mar-16
Shareholder’s Funds 4608.1 3792.7
Share capital 163.0 163.0
Preference shares 25.0 25.0
Reserves & Surplus 4420.1 3604.7
Non-current liabilities 2007.9 2084.9
Long term borrowings 1612.0 1781.0
Deferred Tax Liability 5.9 10.3
Other Long term Liabilities 252.0 31.4
Long-Term Provisions 138.0 262.1
Current liabilities 1621.1 1473.6
Short Term Borrowings 265.6 167.6
Trade Payables 765.8 872.7
Other Current liabilities 371.3 367.8
Short-term provisions 218.4 65.6
Total Equities & Liabilities 8237.0 7351.2
Application of Funds(Rs. mn) Mar-17 Mar-16
Non-current assets 5482.0 4575.3
Fixed assets 294.3 277.9
Non-current Investments 2731.0 2730.5
Long-term loans & advances 75.0 75.0
Other non-current assets 2381.7 1492.0
Current Assets 2755.1 2775.9
Current Investments 489.2 572.7
Inventories 837.8 1093.3
Trade receivables 553.7 241.7
Cash & Cash equivalents 94.5 127.4
Short-term loans & Advances 669.1 634.5
Other Current Assets 110.8 106.4
Total Assets 8237.0 7351.2

Consolidated: Financial Highlights
29
Particulars (Rs.mn) FY17 FY16 % growth
Sales 2,547.7 1,592.8 60%
Construction Expenses 871.9 1,308.5 -33%
% of sales 34% 82%
Employee Expenses 129.5 60.4 114%
% of sales 5% 4%
Other Expenses 131.5 109.2 20%
% of sales 5% 7%
EBIDTA 1,415 115 1134%
% of sales 56% 7%
Depreciation 49.5 55.4 -11%
Finance Cost 643.3 544.9 18%
% of sales 25% 34%
Other Income 26.7 16.8 60%
PBT 748.7 -468.9 NA
% of sales 29% -29%
Taxes 176.7 -73.1 NA
PAT before minority interest 572.0 -395.8 NA
% of sales 22% -25%
Minority/ Associates 0.31 0.6
Consolidated PAT 572.3 -395.2

Consolidated: Financial Highlights
30
Source of Funds(Rs. mn) Mar-17 Mar-16
Shareholder’s Funds 7452.1 6891.2
Share capital 163.0 163.0
Preference shares 25.0 25.0
Reserves & Surplus 7264.1 6703.2
Minority Interest 14.2 13.9
Non-current liabilities 5270.9 5447.8
Long term borrowings 4868.6 5107.9
Deferred Tax Liability 0.0 0.0
Other Long term Liabilities 252.0 0.0
Long-Term Provisions 150.3 340.0
Current liabilities 6673.8 5524.6
Short Term Borrowings 271.5 168.2
Trade Payables 892.9 1000.8
Other Current liabilities 5291.0 4290.1
Short-term provisions 218.4 65.6
Total Equities & Liabilities 19411.0 17877.4
Application of Funds(Rs. mn) Mar-17 Mar-16
Non-current assets 16384.0 14738.5
Fixed assets 6462.1 8057.8
Goodwill on consolidation 2850.5 2850.5
Deferred tax Assets (Net) 176.5 131.2
Non-current Investments 4.1 3.6
Long-term loans & advances 75.0 75.0
Other non-current assets 6815.8 3620.4
Current Assets 3027.0 3138.9
Current Investments 66.1 150.8
Inventories 1313.5 1568.3
Trade receivables 1048.8 899.1
Cash & Cash equivalents 101.9 131.6
Short-term loans & Advances 70.0 98.6
Other Current Assets 426.7 290.5
Total Assets 19411.0 17877.4
Let’s Connect
Mr. Amit Kumar Singh
CIN: L64200MH1984PLC031852