investor presentation - larsen & toubroinvestors.larsentoubro.com/upload/invpres...itc grand...
TRANSCRIPT
1
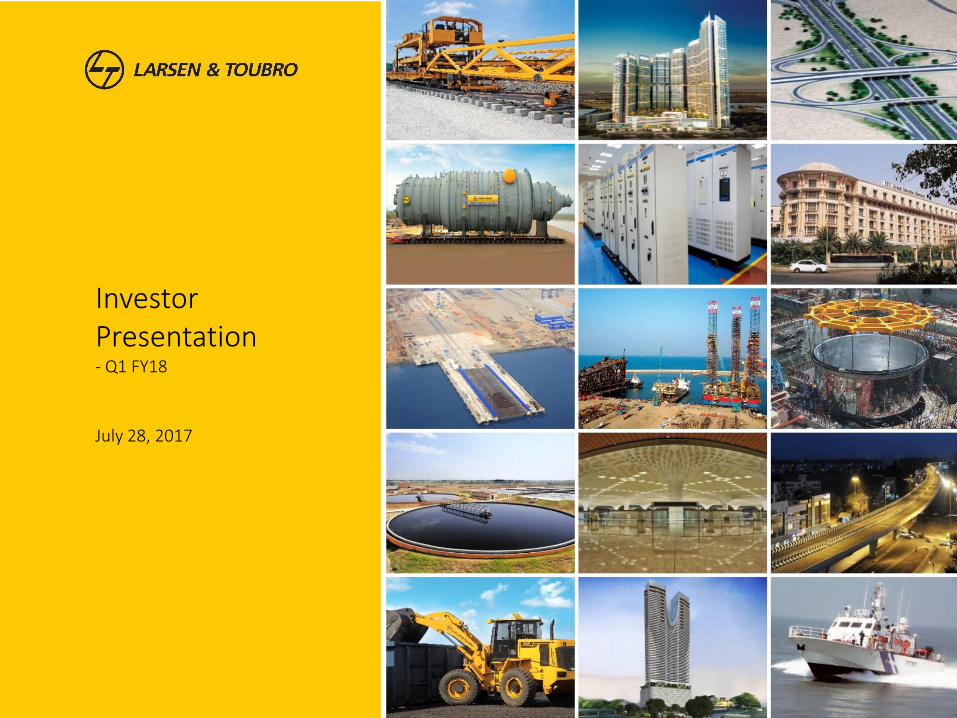
InvestorPresentation- Q1 FY18
July 28, 2017
2
Disclaimer
This presentation contains certain forward
looking statements concerning L&T’s future
business prospects and business profitability,
which are subject to a number of risks and
uncertainties and the actual results could
materially differ from those in such forward
looking statements.
The risks and uncertainties relating to these
statements include, but are not limited to,
risks and uncertainties regarding fluctuations
in earnings, our ability to manage growth,
competition (both domestic and
international), economic growth in India and
the target countries for exports, ability to
attract and retain highly skilled professionals,
time and cost over runs on contracts, our
ability to manage our international
operations, government policies and actions
with respect to investments, fiscal deficits,
regulations, etc., interest and other fiscal
costs generally prevailing in the economy.
Past performance may not be indicative of
future performance.
The company does not undertake to make
any announcement in case any of these
forward looking statements become
materially incorrect in future or update any
forward looking statements made from time
to time by or on behalf of the company.
3Presentation Outline
L&T Overview
Business Overview
Group Performance
The Environment & the Outlook
4
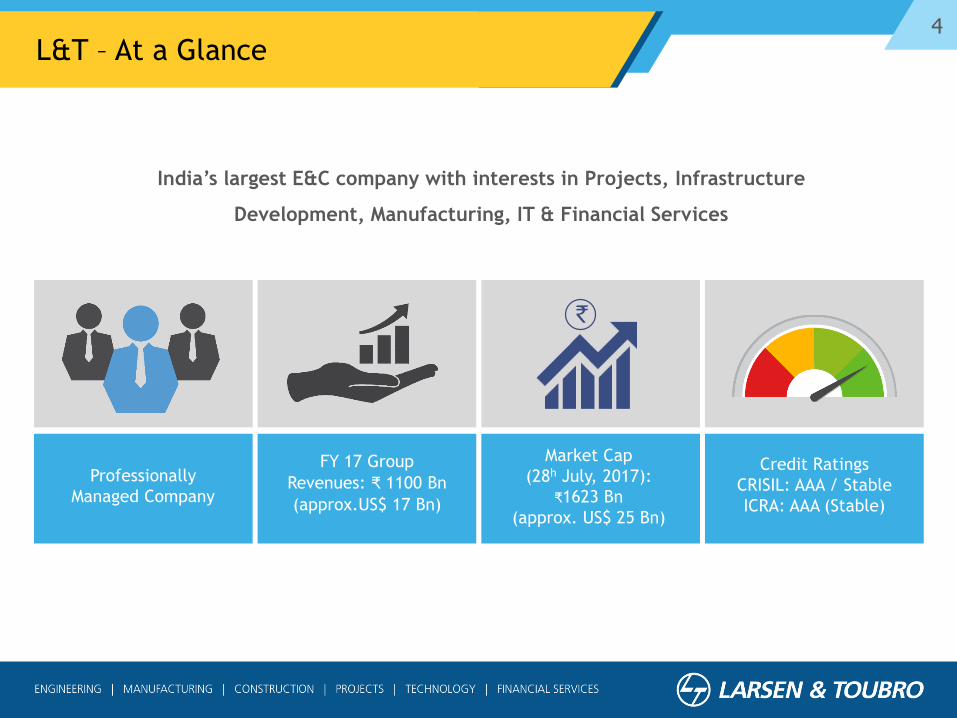
L&T – At a Glance
India’s largest E&C company with interests in Projects, Infrastructure
Development, Manufacturing, IT & Financial Services
Professionally
Managed Company
Credit Ratings
CRISIL: AAA / Stable
ICRA: AAA (Stable)
FY 17 Group
Revenues: ₹ 1100 Bn
(approx.US$ 17 Bn)
Market Cap
(28h July, 2017):
₹1623 Bn
(approx. US$ 25 Bn)
`
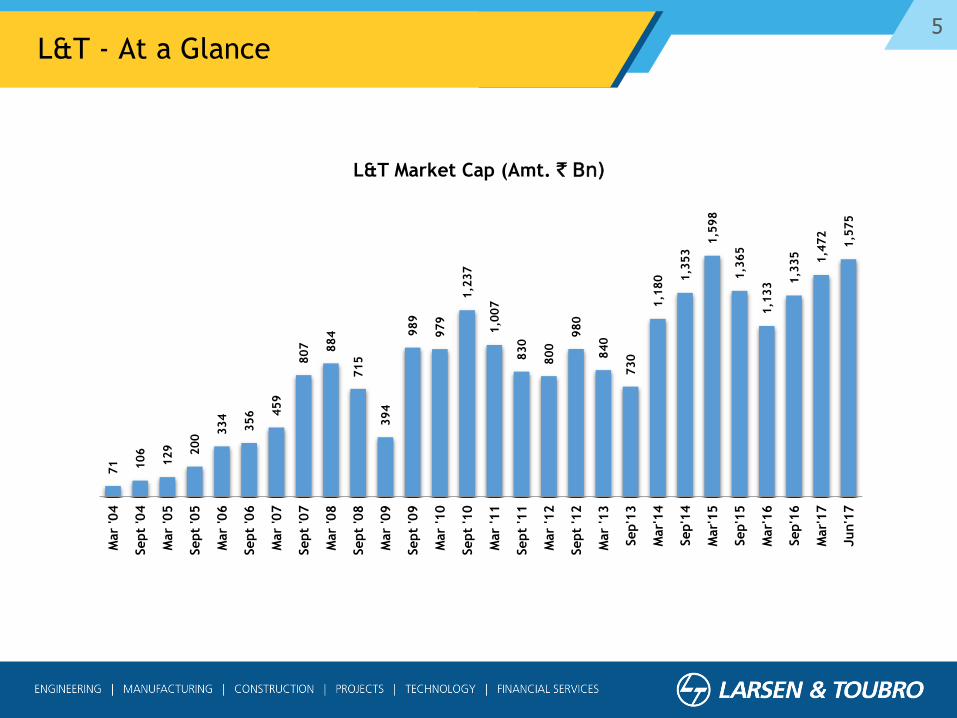
5L&T - At a Glance
71
106
129
200 334
356
459
807
884
715
394
989
979
1,2
37
1,0
07
830
800
980
840
730
1,1
80
1,3
53 1
,598
1,3
65
1,1
33 1,3
35
1,4
72
1,5
75
Mar
'04
Sept
'04
Mar
'05
Sept
'05
Mar
'06
Sept
'06
Mar
'07
Sept
'07
Mar
'08
Sept
'08
Mar
'09
Sept
'09
Mar
'10
Sept
'10
Mar
'11
Sept
'11
Mar
'12
Sept
'12
Mar
'13
Sep'1
3
Mar'
14
Sep'1
4
Mar'
15
Sep'1
5
Mar'
16
Sep'1
6
Mar'
17
Jun'1
7
L&T Market Cap (Amt. ` Bn)
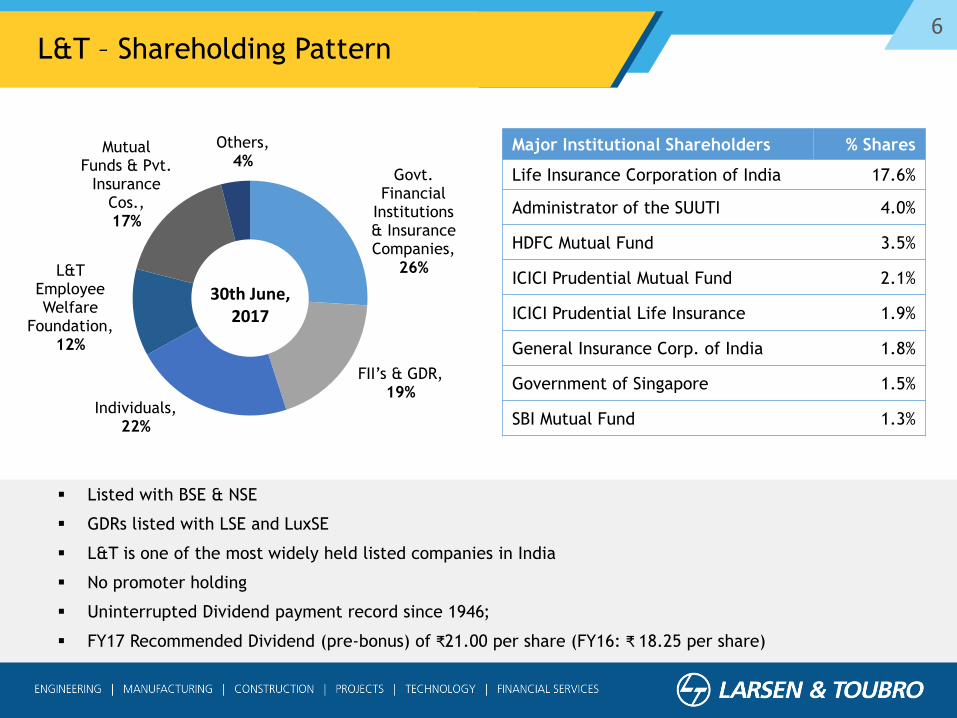
6L&T – Shareholding Pattern
Major Institutional Shareholders % Shares
Life Insurance Corporation of India 17.6%
Administrator of the SUUTI 4.0%
HDFC Mutual Fund 3.5%
ICICI Prudential Mutual Fund 2.1%
ICICI Prudential Life Insurance 1.9%
General Insurance Corp. of India 1.8%
Government of Singapore 1.5%
SBI Mutual Fund 1.3%
Govt. Financial
Institutions & Insurance Companies,
26%
FII’s & GDR, 19%
Individuals,22%
L&T Employee Welfare
Foundation,12%
Mutual Funds & Pvt.
Insurance Cos., 17%
Others,4%
30th June, 2017
Listed with BSE & NSE
GDRs listed with LSE and LuxSE
L&T is one of the most widely held listed companies in India
No promoter holding
Uninterrupted Dividend payment record since 1946;
FY17 Recommended Dividend (pre-bonus) of ₹21.00 per share (FY16: ₹ 18.25 per share)
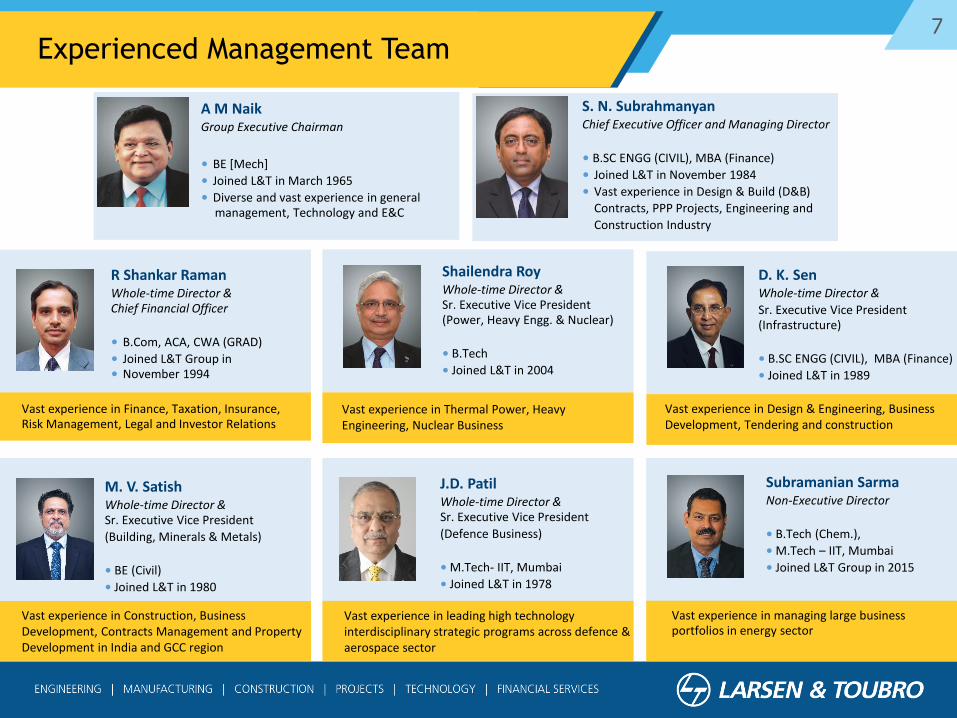
7Experienced Management Team
M. V. SatishWhole-time Director & Sr. Executive Vice President
(Building, Minerals & Metals)
• BE (Civil)
• Joined L&T in 1980
Vast experience in Construction, Business Development, Contracts Management and Property Development in India and GCC region
Subramanian SarmaNon-Executive Director
• B.Tech (Chem.),
• M.Tech – IIT, Mumbai
• Joined L&T Group in 2015
Vast experience in managing large business portfolios in energy sector
D. K. SenWhole-time Director &
Sr. Executive Vice President (Infrastructure)
• B.SC ENGG (CIVIL), MBA (Finance)
• Joined L&T in 1989
A M NaikGroup Executive Chairman
• BE [Mech]
• Joined L&T in March 1965
• Diverse and vast experience in general management, Technology and E&C
S. N. SubrahmanyanChief Executive Officer and Managing Director
• B.SC ENGG (CIVIL), MBA (Finance)
• Joined L&T in November 1984
• Vast experience in Design & Build (D&B)
Contracts, PPP Projects, Engineering and
Construction Industry
R Shankar RamanWhole-time Director & Chief Financial Officer
• B.Com, ACA, CWA (GRAD)
• Joined L&T Group in • November 1994
Vast experience in Finance, Taxation, Insurance, Risk Management, Legal and Investor Relations
Shailendra RoyWhole-time Director & Sr. Executive Vice President (Power, Heavy Engg. & Nuclear)
• B.Tech
• Joined L&T in 2004
Vast experience in Thermal Power, Heavy Engineering, Nuclear Business
Vast experience in Design & Engineering, Business Development, Tendering and construction
J.D. PatilWhole-time Director & Sr. Executive Vice President
(Defence Business)
• M.Tech- IIT, Mumbai
• Joined L&T in 1978
Vast experience in leading high technology interdisciplinary strategic programs across defence & aerospace sector
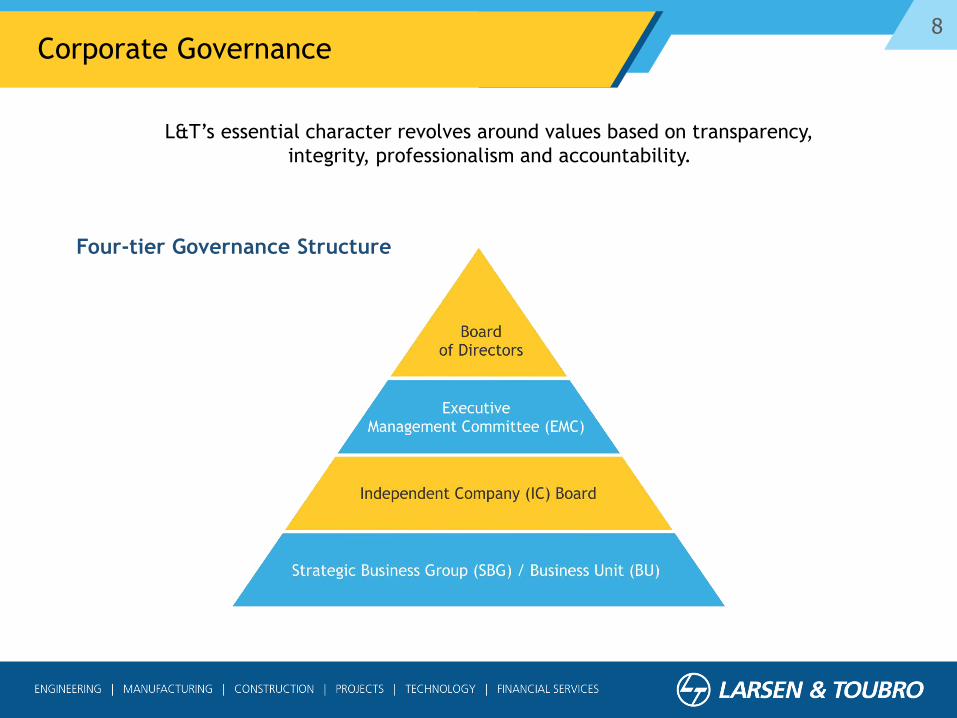
8Corporate Governance
L&T’s essential character revolves around values based on transparency,
integrity, professionalism and accountability.
Four-tier Governance Structure
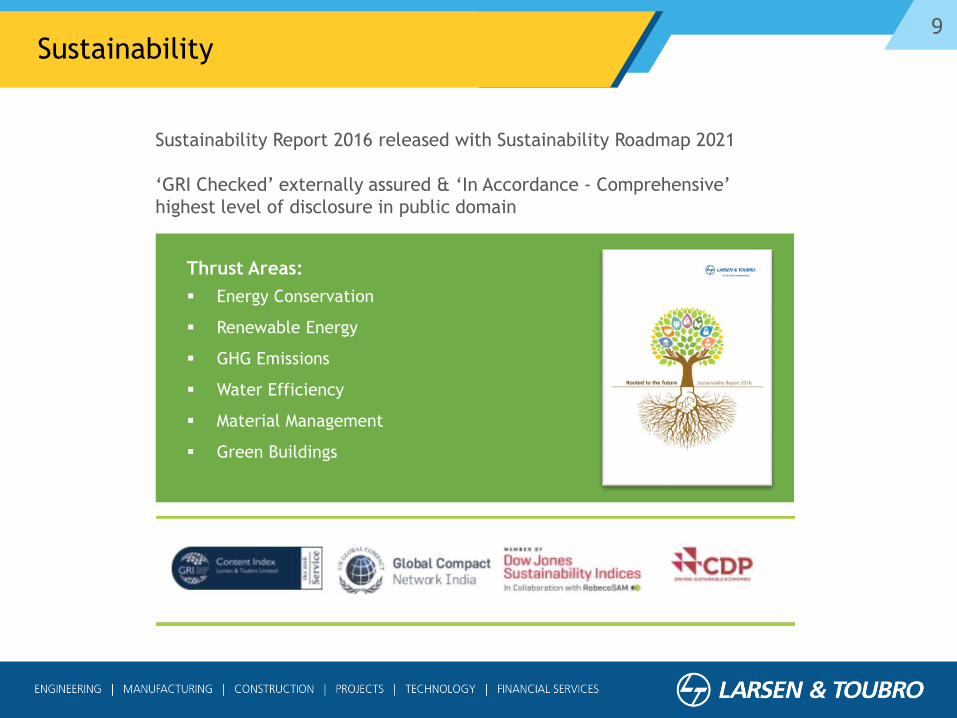
9Sustainability
Sustainability Report 2016 released with Sustainability Roadmap 2021
‘GRI Checked’ externally assured & ‘In Accordance - Comprehensive’
highest level of disclosure in public domain
Thrust Areas:
Energy Conservation
Renewable Energy
GHG Emissions
Water Efficiency
Material Management
Green Buildings
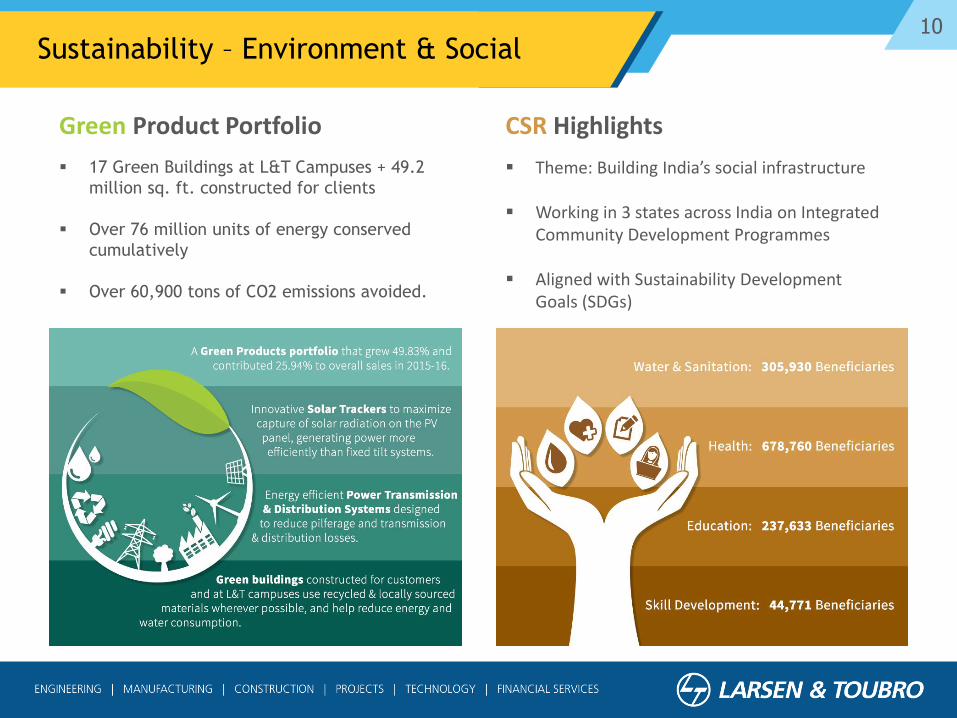
10Sustainability – Environment & Social
17 Green Buildings at L&T Campuses + 49.2
million sq. ft. constructed for clients
Over 76 million units of energy conserved
cumulatively
Over 60,900 tons of CO2 emissions avoided.
CSR Highlights
Theme: Building India’s social infrastructure
Working in 3 states across India on Integrated Community Development Programmes
Aligned with Sustainability Development Goals (SDGs)
Green Product Portfolio

11Presentation Outline
L&T Overview
Business Overview
Group Performance
The Environment & the Outlook
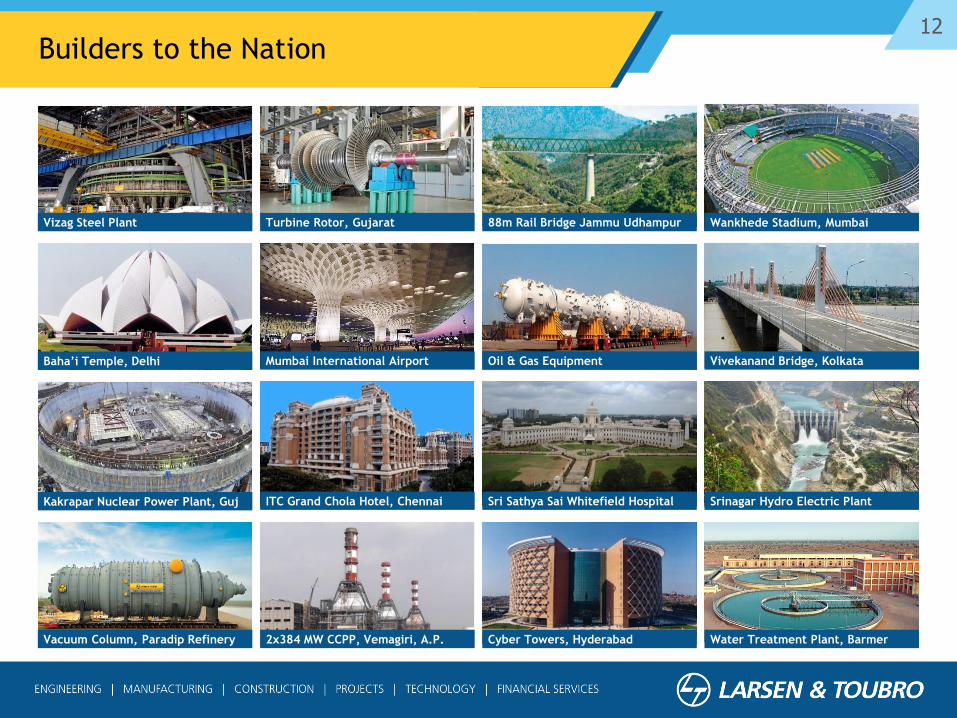
12Builders to the Nation
Wankhede Stadium, Mumbai
Baha’i Temple, Delhi
Vizag Steel Plant 88m Rail Bridge Jammu UdhampurTurbine Rotor, Gujarat
Oil & Gas EquipmentMumbai International Airport Vivekanand Bridge, Kolkata
ITC Grand Chola Hotel, Chennai Sri Sathya Sai Whitefield Hospital Srinagar Hydro Electric Plant
2x384 MW CCPP, Vemagiri, A.P. Cyber Towers, Hyderabad Water Treatment Plant, BarmerVacuum Column, Paradip Refinery
Kakrapar Nuclear Power Plant, Guj

13International Footprint – Marquee Jobs
NMC Speciality hospital, Abu Dhabi
Bhukara Hotel, Uzbeckistan
Stadium at Barbados Twin Towers, Dubai MarinaSalalah Airport, Oman
Fabrication Facility, Oman
Sheikh Khalifa Interchange, UAE Coal Gasifier for China Transmission Lines, Fujirah, Dhaid
Petronas Refinery, Malaysia Bi-metallic Urea Stripper for Saudi MV Switchgear Factory, MalaysiaWater Treatment Plant, Doha
Punatsangchhu HEP, Bhutan
World’s Longest Conveyer, Bangladesh Bulk Cement Terminal, Colombo
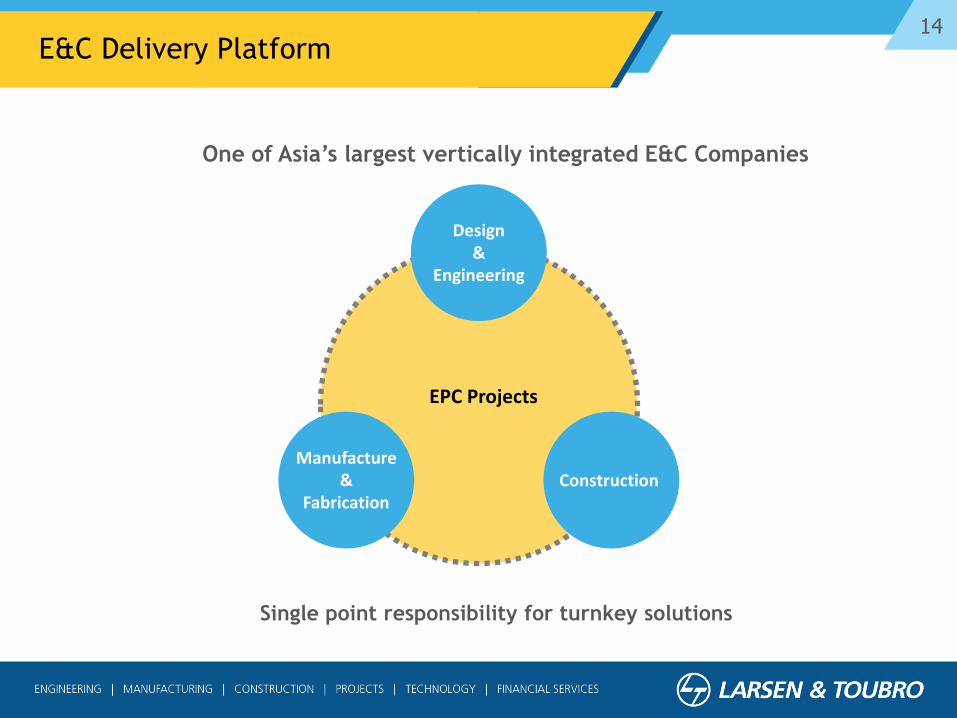
14E&C Delivery Platform
Single point responsibility for turnkey solutions
One of Asia’s largest vertically integrated E&C Companies
Design &
Engineering
EPC Projects
Manufacture &
FabricationConstruction
15
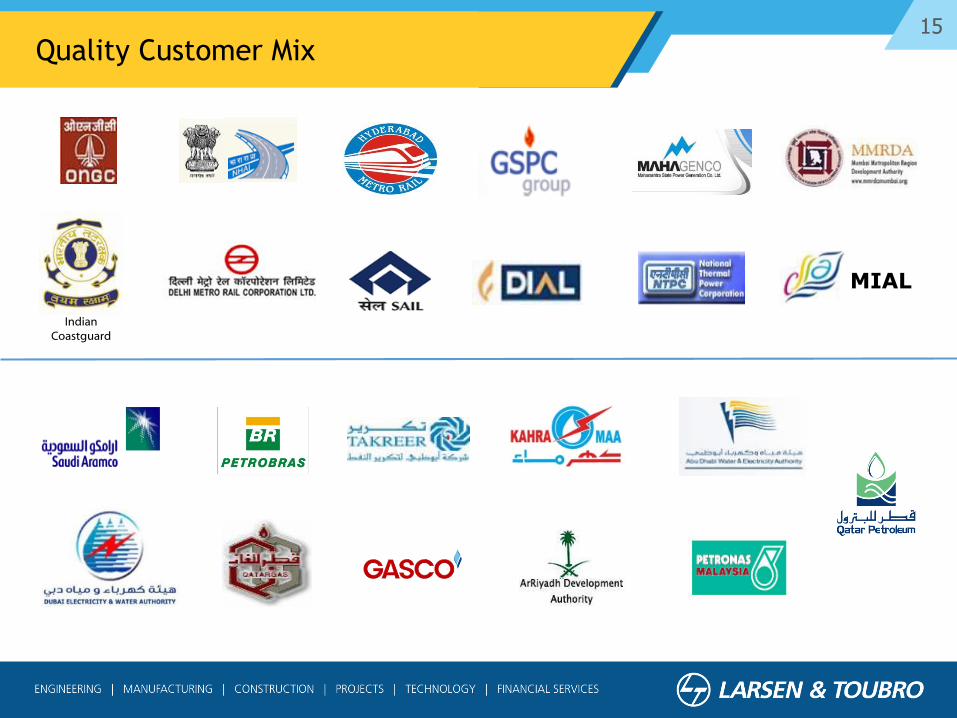
Quality Customer Mix
MIAL
Indian Coastguard
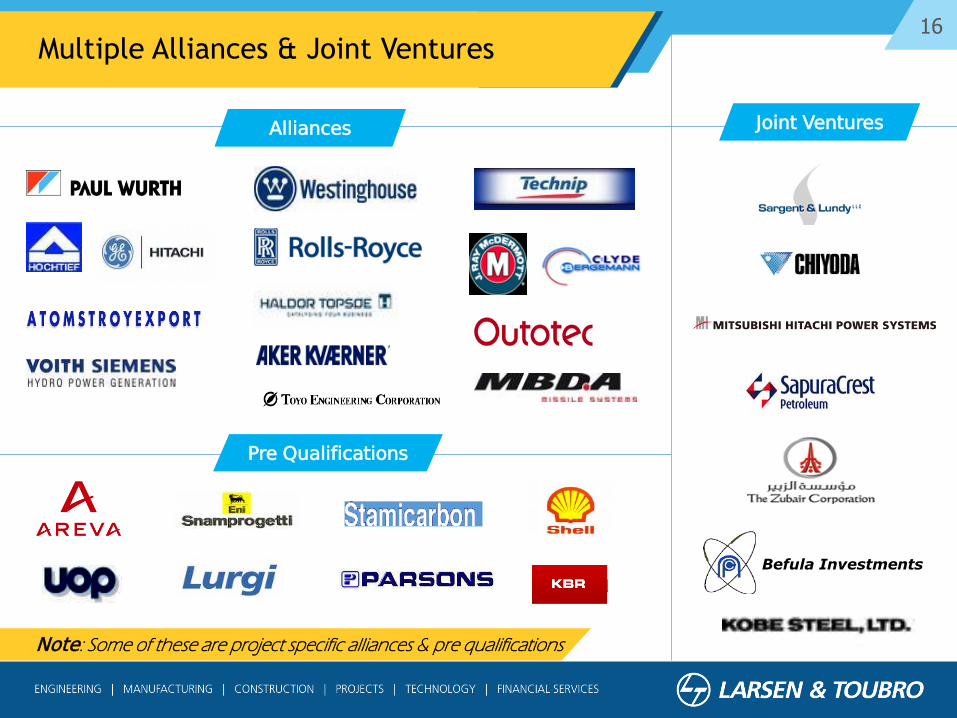
16Multiple Alliances & Joint Ventures
Note: Some of these are project specific alliances & pre qualifications
Alliances
Pre Qualifications
Joint Ventures
Befula Investments
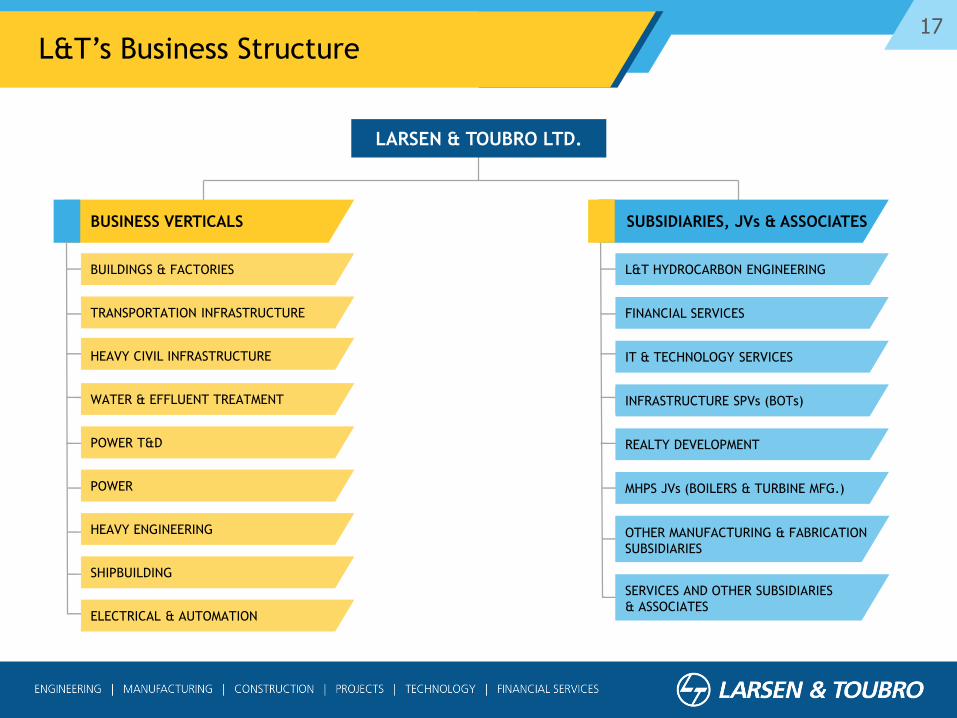
17L&T’s Business Structure
BUILDINGS & FACTORIES
TRANSPORTATION INFRASTRUCTURE
HEAVY CIVIL INFRASTRUCTURE
WATER & EFFLUENT TREATMENT
POWER T&D
POWER
HEAVY ENGINEERING
SHIPBUILDING
ELECTRICAL & AUTOMATION
L&T HYDROCARBON ENGINEERING
FINANCIAL SERVICES
IT & TECHNOLOGY SERVICES
INFRASTRUCTURE SPVs (BOTs)
REALTY DEVELOPMENT
MHPS JVs (BOILERS & TURBINE MFG.)
SERVICES AND OTHER SUBSIDIARIES
& ASSOCIATES
OTHER MANUFACTURING & FABRICATION
SUBSIDIARIES
BUSINESS VERTICALS SUBSIDIARIES, JVs & ASSOCIATES
LARSEN & TOUBRO LTD.
18Presentation Outline
L&T Overview
Business Overview
Group Performance
The Environment & the Outlook
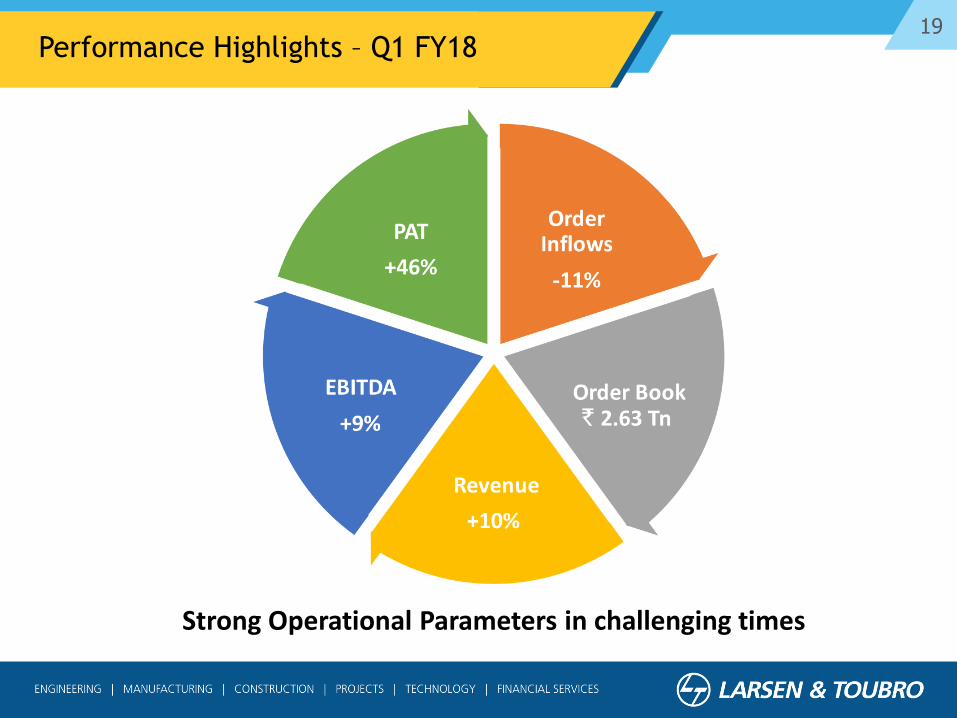
19Performance Highlights – Q1 FY18
Strong Operational Parameters in challenging times
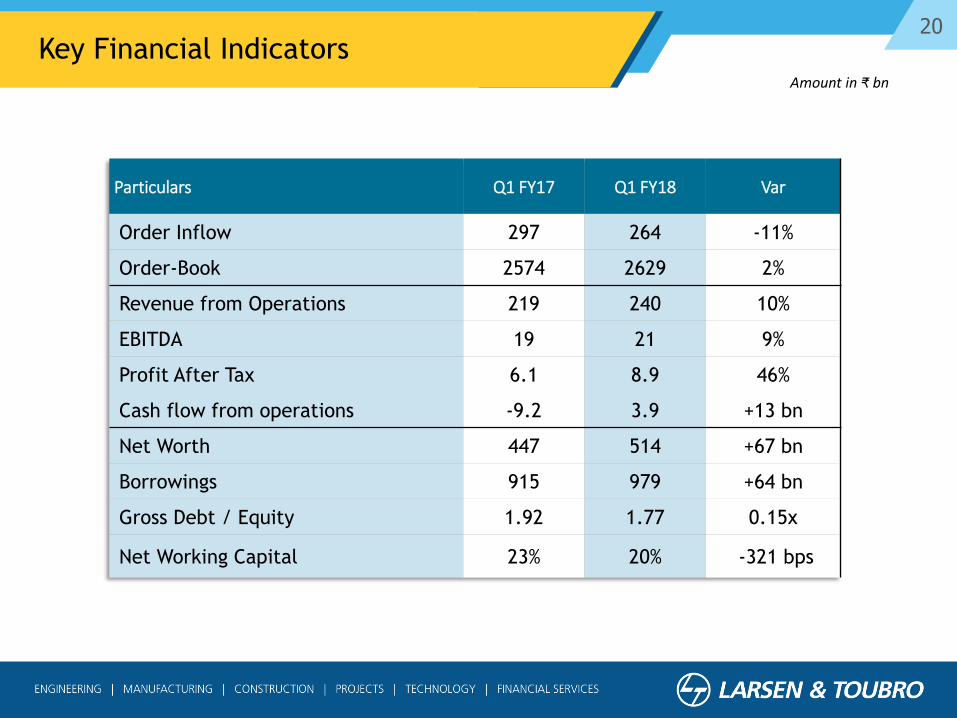
20Key Financial Indicators
Amount in ₹ bn
Particulars Q1 FY17 Q1 FY18 Var
Order Inflow 297 264 -11%
Order-Book 2574 2629 2%
Revenue from Operations 219 240 10%
EBITDA 19 21 9%
Profit After Tax 6.1 8.9 46%
Cash flow from operations -9.2 3.9 +13 bn
Net Worth 447 514 +67 bn
Borrowings 915 979 +64 bn
Gross Debt / Equity 1.92 1.77 0.15x
Net Working Capital 23% 20% -321 bps
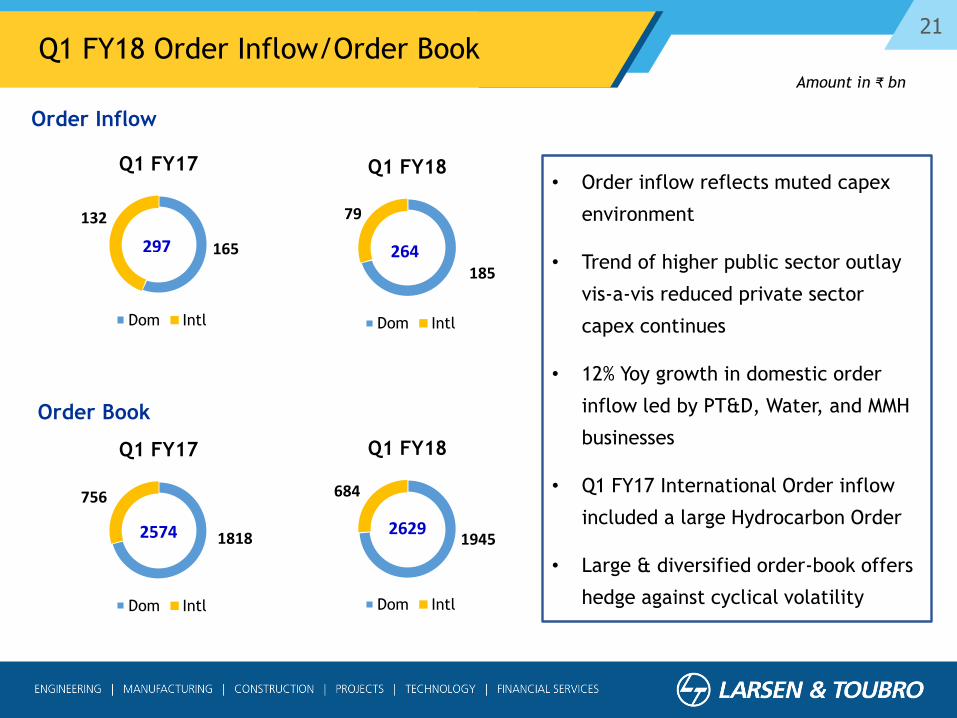
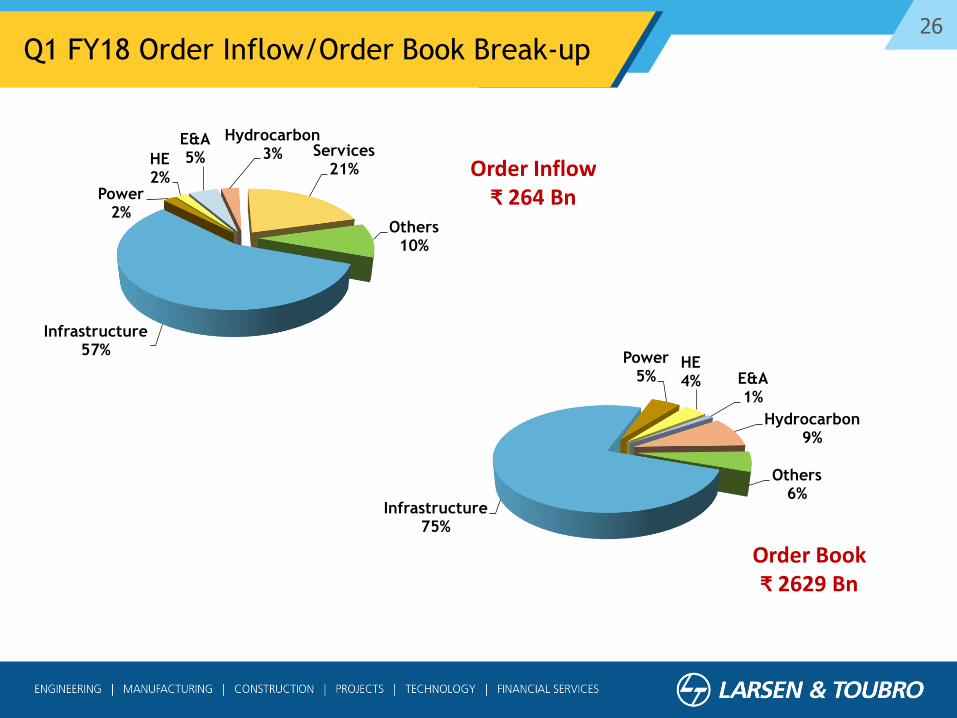
21Q1 FY18 Order Inflow/Order Book
165
132
Q1 FY17
Dom Intl
297
Order Inflow
Order Book
• Order inflow reflects muted capex
environment
• Trend of higher public sector outlay
vis-a-vis reduced private sector
capex continues
• 12% Yoy growth in domestic order
inflow led by PT&D, Water, and MMH
businesses
• Q1 FY17 International Order inflow
included a large Hydrocarbon Order
• Large & diversified order-book offers
hedge against cyclical volatility
Amount in ₹ bn
185
79
Q1 FY18
Dom Intl
264
1945
684
Q1 FY18
Dom Intl
26291818
756
Q1 FY17
Dom Intl
2574
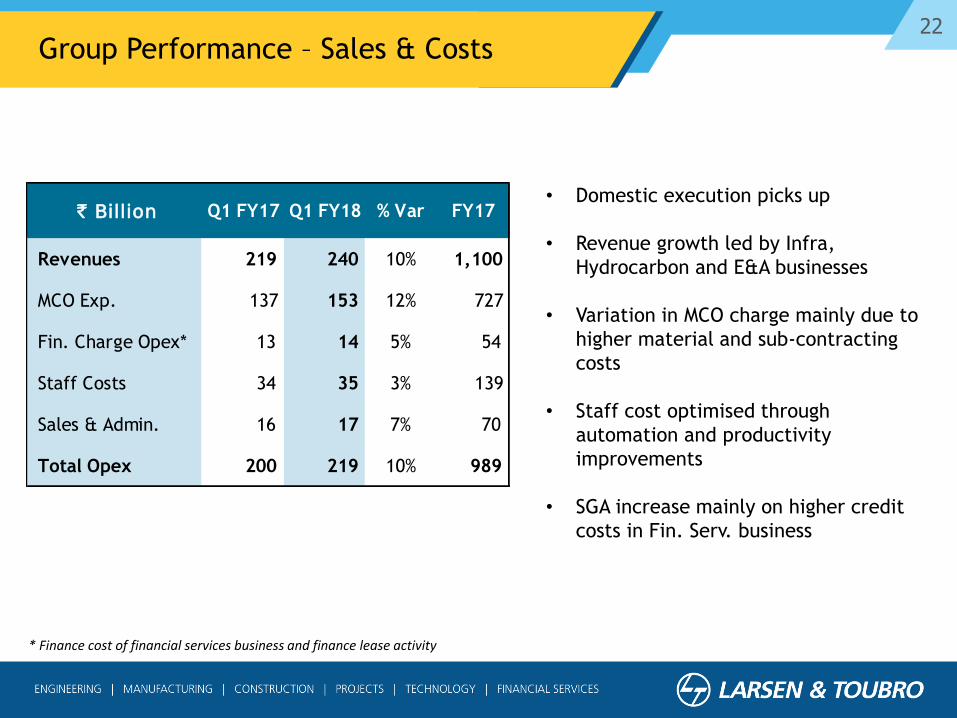
22Group Performance – Sales & Costs
• Domestic execution picks up
• Revenue growth led by Infra,
Hydrocarbon and E&A businesses
• Variation in MCO charge mainly due to
higher material and sub-contracting
costs
• Staff cost optimised through
automation and productivity
improvements
• SGA increase mainly on higher credit
costs in Fin. Serv. business
* Finance cost of financial services business and finance lease activity
` Billion Q1 FY17 Q1 FY18 % Var FY17
Revenues 219 240 10% 1,100
MCO Exp. 137 153 12% 727
Fin. Charge Opex* 13 14 5% 54
Staff Costs 34 35 3% 139
Sales & Admin. 16 17 7% 70
Total Opex 200 219 10% 989
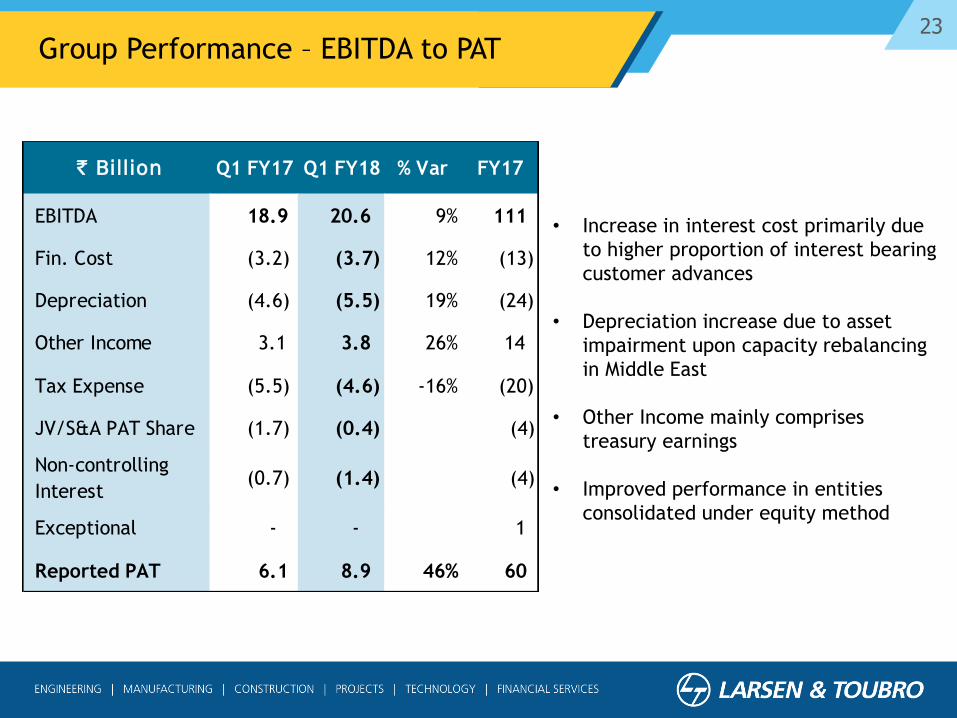
23
• Increase in interest cost primarily due
to higher proportion of interest bearing
customer advances
• Depreciation increase due to asset
impairment upon capacity rebalancing
in Middle East
• Other Income mainly comprises
treasury earnings
• Improved performance in entities
consolidated under equity method
Group Performance – EBITDA to PAT
` Billion Q1 FY17 Q1 FY18 % Var FY17
EBITDA 18.9 20.6 9% 111
Fin. Cost (3.2) (3.7) 12% (13)
Depreciation (4.6) (5.5) 19% (24)
Other Income 3.1 3.8 26% 14
Tax Expense (5.5) (4.6) -16% (20)
JV/S&A PAT Share (1.7) (0.4) (4)
Non-controlling
Interest (0.7) (1.4) (4)
Exceptional - - 1
Reported PAT 6.1 8.9 46% 60
24
Segment Performance Analysis
25
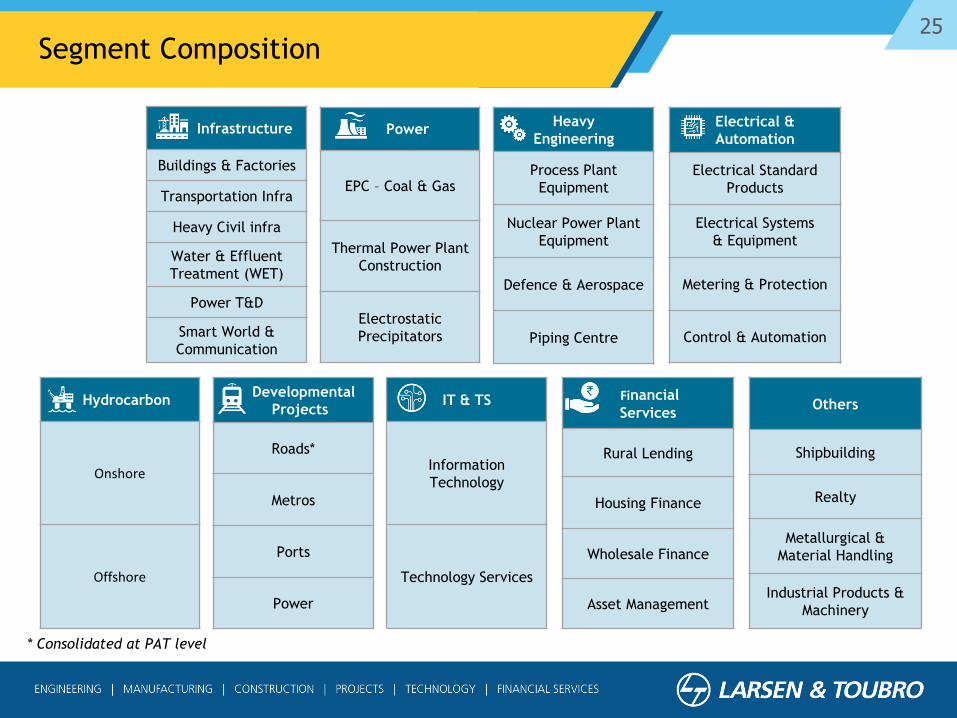
* Consolidated at PAT level
Infrastructure
Buildings & Factories
Transportation Infra
Heavy Civil infra
Water & Effluent
Treatment (WET)
Power T&D
Smart World &
Communication
Power
EPC – Coal & Gas
Thermal Power Plant
Construction
Electrostatic
Precipitators
Heavy
Engineering
Process Plant
Equipment
Nuclear Power Plant
Equipment
Defence & Aerospace
Piping Centre
Electrical &
Automation
Electrical Standard
Products
Electrical Systems
& Equipment
Metering & Protection
Control & Automation
Hydrocarbon
Onshore
Offshore
Developmental
Projects
Roads*
Metros
Ports
Power
IT & TS
Information
Technology
Technology Services
Financial
Services
Rural Lending
Housing Finance
Wholesale Finance
Asset Management
Others
Shipbuilding
Realty
Metallurgical &
Material Handling
Industrial Products &
Machinery
Segment Composition
26
Infrastructure57%
Power2%
HE2%
E&A5%
Hydrocarbon3% Services
21%
Others10%
Infrastructure75%
Power5%
HE4% E&A
1%
Hydrocarbon 9%
Others6%
Order Book₹ 2629 Bn
Order Inflow₹ 264 Bn
Q1 FY18 Order Inflow/Order Book Break-up
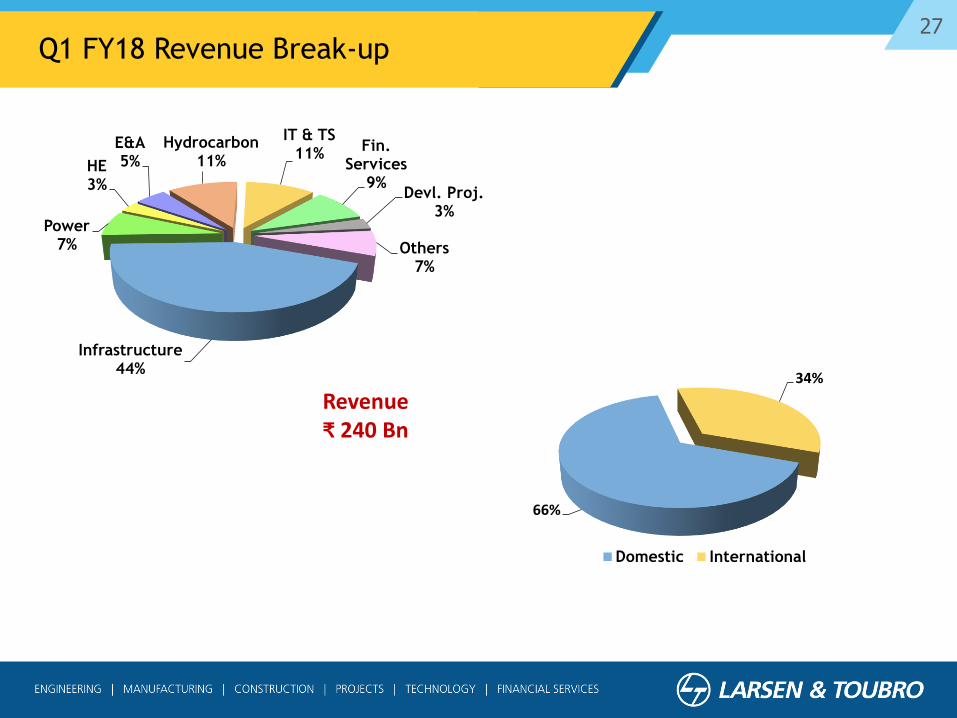
27Q1 FY18 Revenue Break-up
Infrastructure44%
Power7%
HE3%
E&A5%
Hydrocarbon11%
IT & TS11%
Fin. Services
9%Devl. Proj.
3%
Others7%
66%
34%
Domestic International
Revenue₹ 240 Bn
28
Net Revenues
Amount in ` bn
Infrastructure Segment
EBIDTA
• Transportation Infra and other
Businesses deliver revenue
growth
• Higher growth witnessed in
domestic market
• Quarterly variation in margins
primarily due to job mix and
cost overruns on extended
stay in a few projects
29
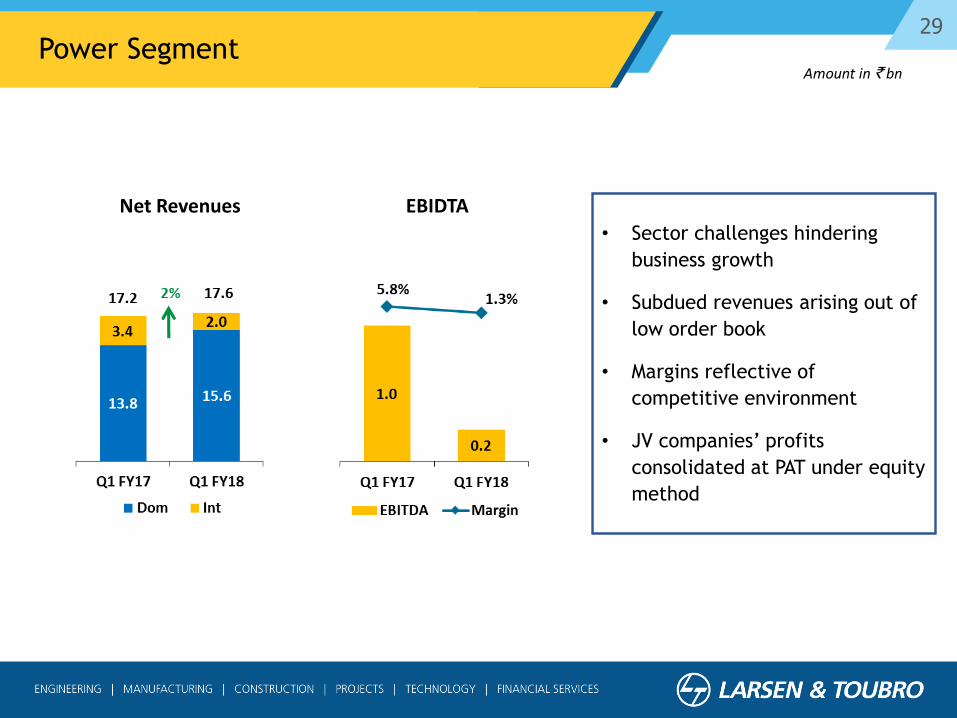
Amount in ` bnPower Segment
Net Revenues EBIDTA
• Sector challenges hindering
business growth
• Subdued revenues arising out of
low order book
• Margins reflective of
competitive environment
• JV companies’ profits
consolidated at PAT under equity
method

30
Amount in ` bnHeavy Engineering Segment
Net Revenues EBIDTA
• Revenues affected by lower
order book
• Quarterly margin variation is
subject to job progress
• Low capacity utilisation in
Forgings business (consolidated
at PAT level under equity
method)
31
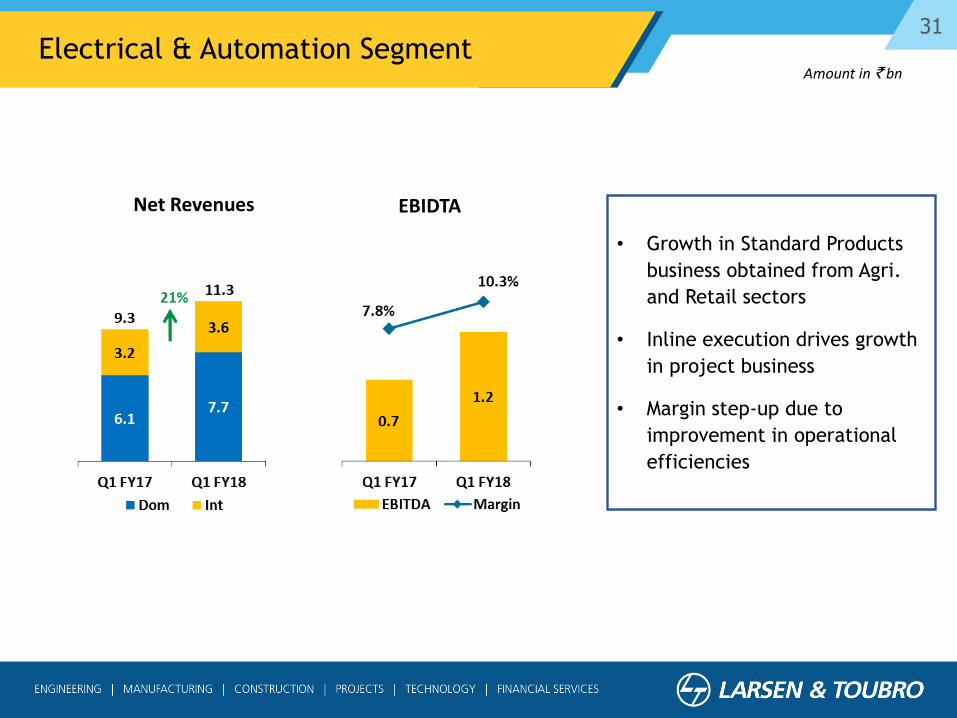
Amount in ` bnElectrical & Automation Segment
• Growth in Standard Products
business obtained from Agri.
and Retail sectors
• Inline execution drives growth
in project business
• Margin step-up due to
improvement in operational
efficiencies
Net Revenues EBIDTA
32
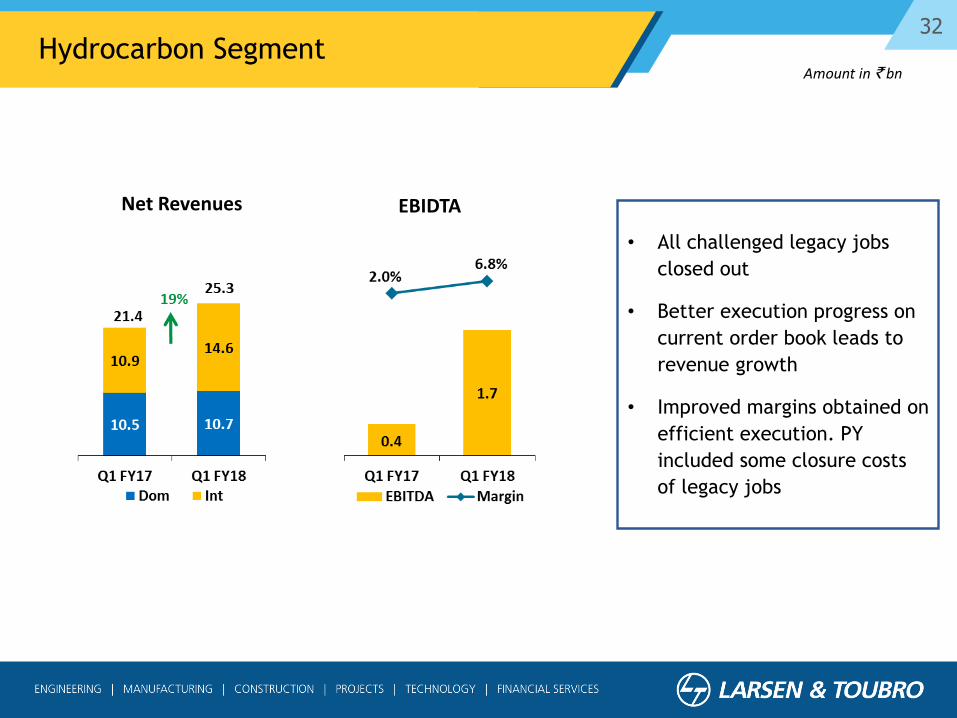
Amount in ` bnHydrocarbon Segment
• All challenged legacy jobs
closed out
• Better execution progress on
current order book leads to
revenue growth
• Improved margins obtained on
efficient execution. PY
included some closure costs
of legacy jobs
Net Revenues EBIDTA
33
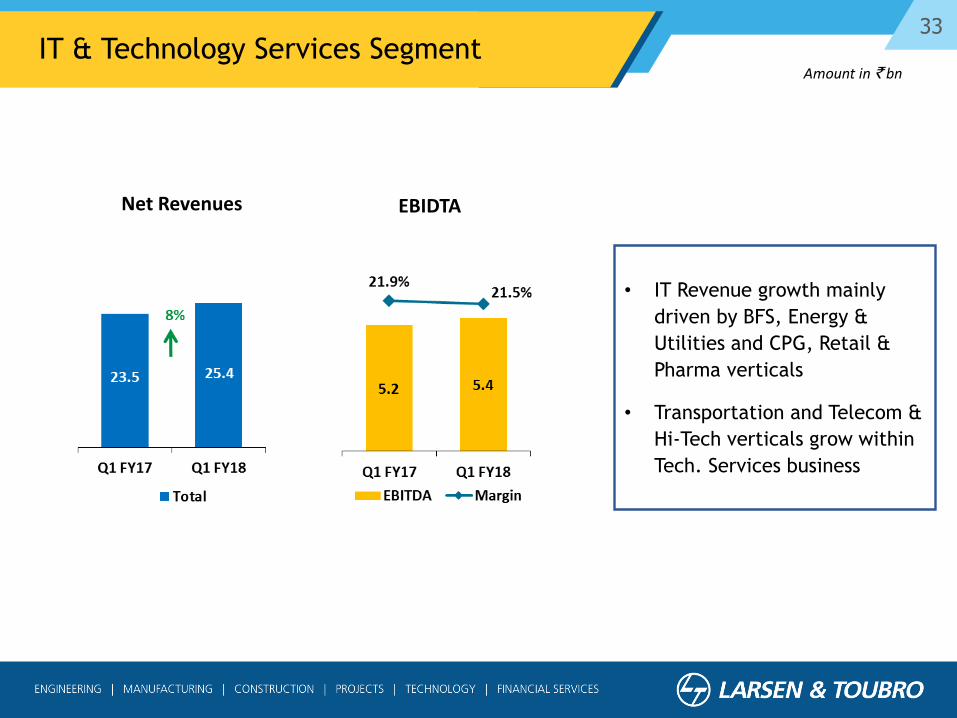
Amount in ` bnIT & Technology Services Segment
• IT Revenue growth mainly
driven by BFS, Energy &
Utilities and CPG, Retail &
Pharma verticals
• Transportation and Telecom &
Hi-Tech verticals grow within
Tech. Services business
Net Revenues EBIDTA
34
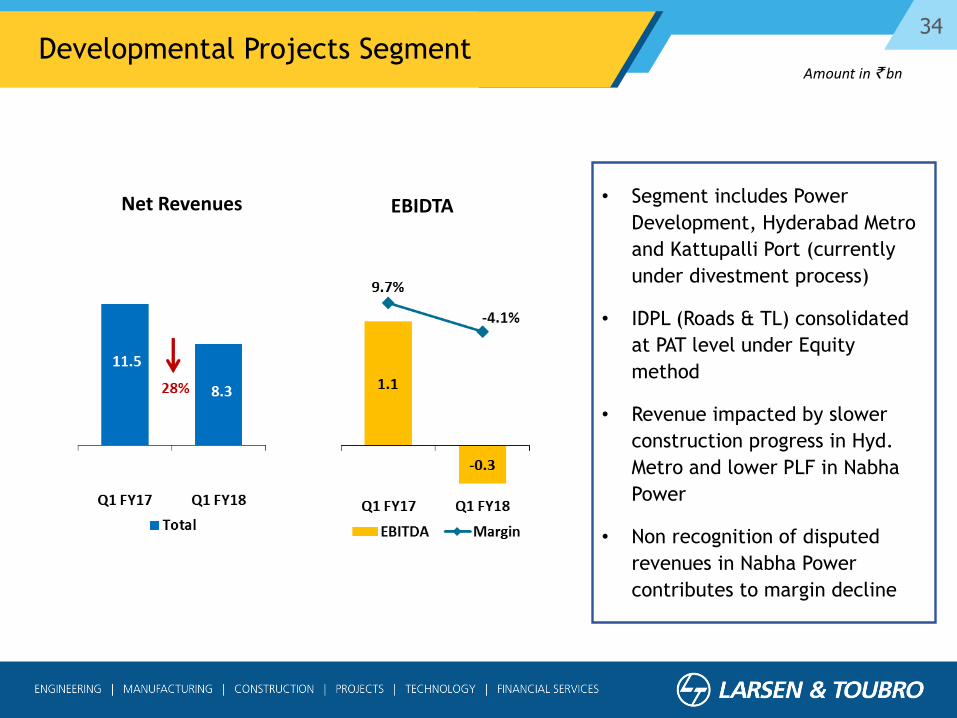
Amount in ` bnDevelopmental Projects Segment
• Segment includes Power
Development, Hyderabad Metro
and Kattupalli Port (currently
under divestment process)
• IDPL (Roads & TL) consolidated
at PAT level under Equity
method
• Revenue impacted by slower
construction progress in Hyd.
Metro and lower PLF in Nabha
Power
• Non recognition of disputed
revenues in Nabha Power
contributes to margin decline
Net Revenues EBIDTA
35
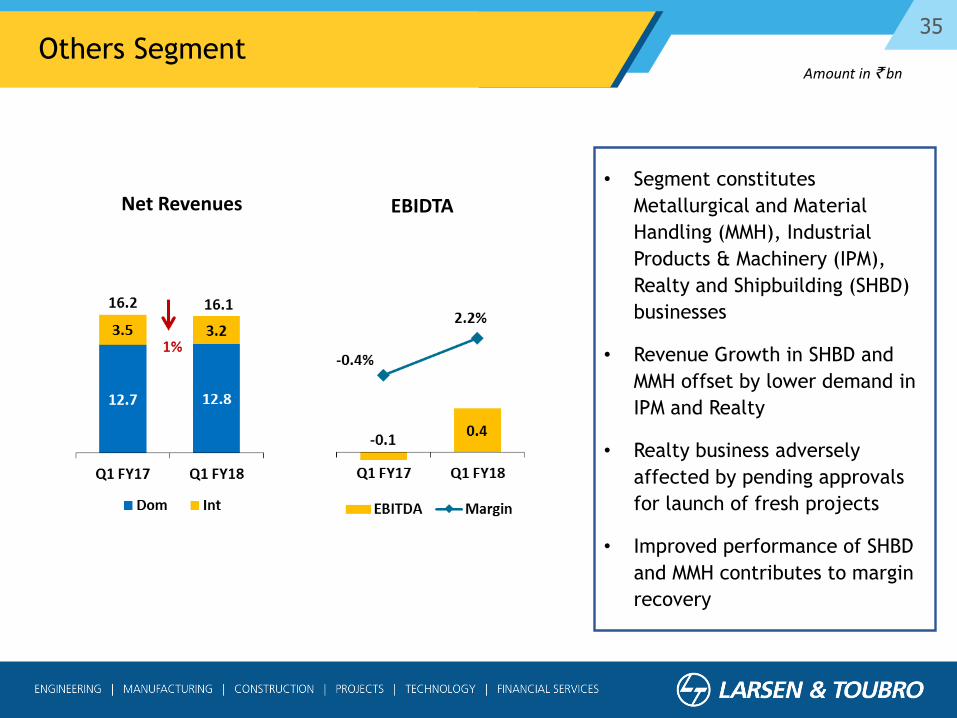
Amount in ` bnOthers Segment
• Segment constitutes
Metallurgical and Material
Handling (MMH), Industrial
Products & Machinery (IPM),
Realty and Shipbuilding (SHBD)
businesses
• Revenue Growth in SHBD and
MMH offset by lower demand in
IPM and Realty
• Realty business adversely
affected by pending approvals
for launch of fresh projects
• Improved performance of SHBD
and MMH contributes to margin
recovery
Net Revenues EBIDTA
36
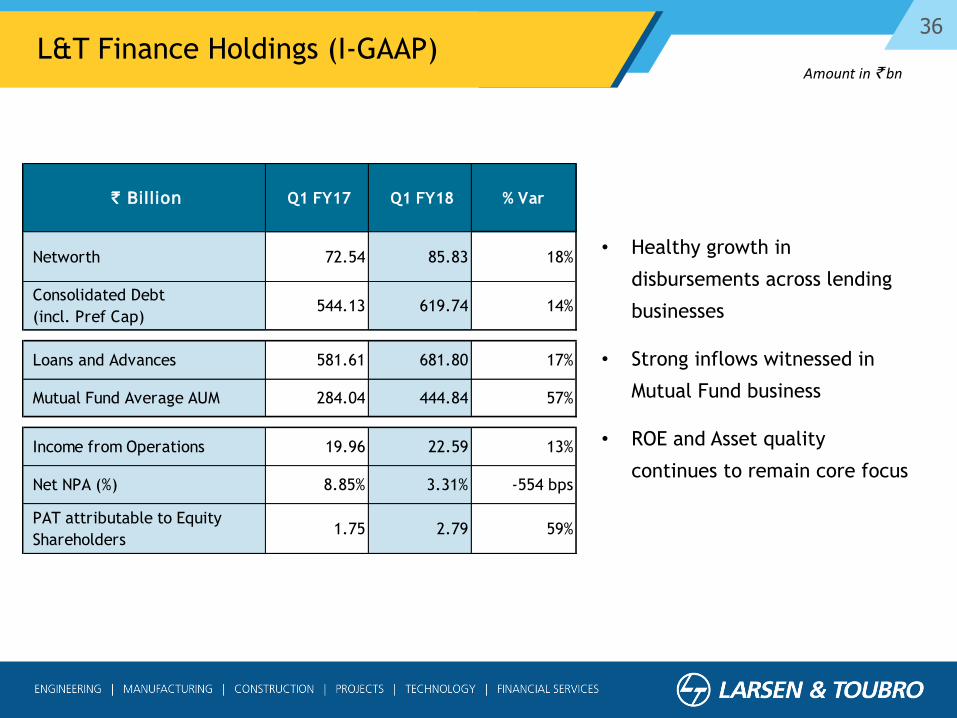
Amount in ` bnL&T Finance Holdings (I-GAAP)
• Healthy growth in
disbursements across lending
businesses
• Strong inflows witnessed in
Mutual Fund business
• ROE and Asset quality
continues to remain core focus
` Billion Q1 FY17 Q1 FY18 % Var
Networth 72.54 85.83 18%
Consolidated Debt
(incl. Pref Cap) 544.13 619.74 14%
Loans and Advances 581.61 681.80 17%
Mutual Fund Average AUM 284.04 444.84 57%
Income from Operations 19.96 22.59 13%
Net NPA (%) 8.85% 3.31% -554 bps
PAT attributable to Equity
Shareholders 1.75 2.79 59%
37Presentation Outline
L&T Overview
Business Overview
Group Performance
The Environment & the Outlook
38
OrderInflows
Revenues Margins
Robust
Prospect
Base
Public Sector
Outlay
Quarterly
Volatility
Domestic
Execution
Digitisation /
Productivity
Operational
Excellence
Private
CapexAward
Deferrals
GCC
Slowdown
Working
Capital
Industrial
Offtake
Payments &
Clearances
Infra
SegmentOperating
Leverage
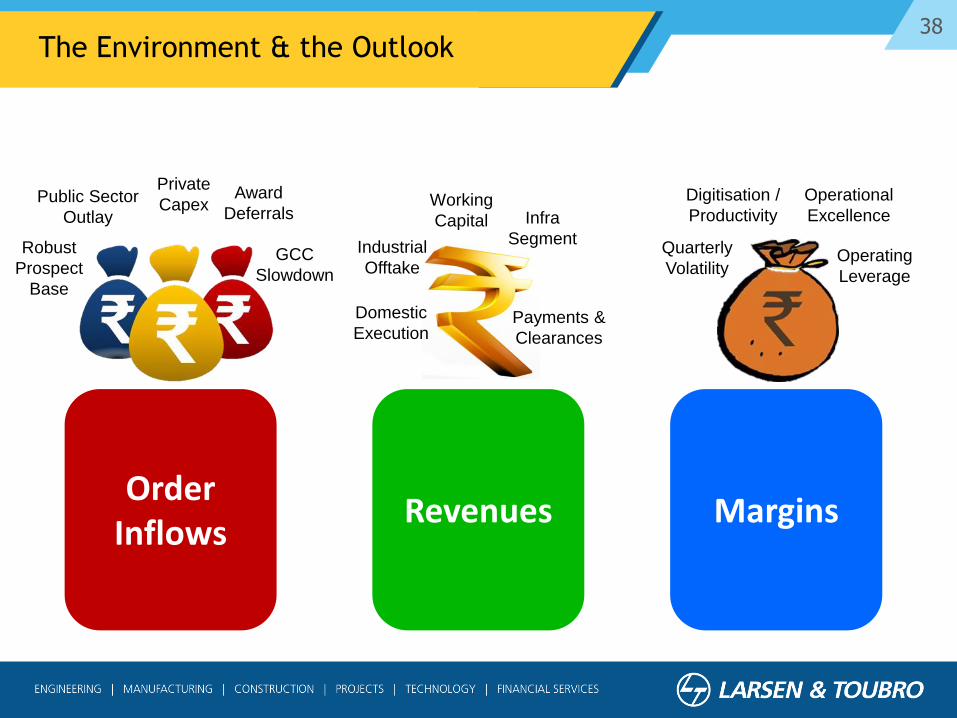
The Environment & the Outlook
39
Thank You
40
Annexures
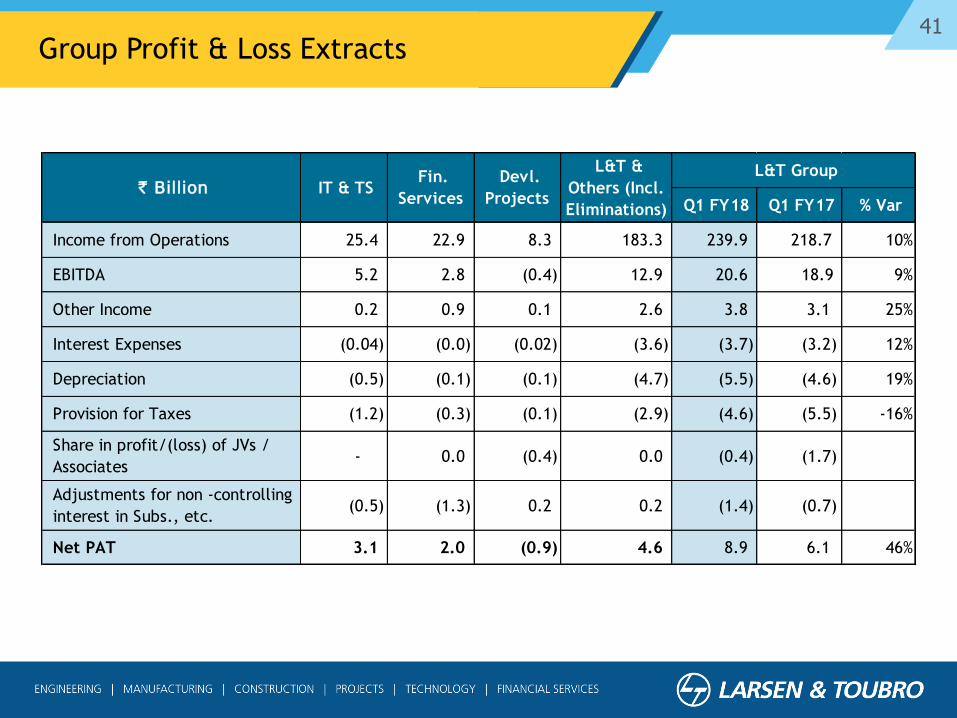
41Group Profit & Loss Extracts
Q1 FY18 Q1 FY17 % Var
Income from Operations 25.4 22.9 8.3 183.3 239.9 218.7 10%
EBITDA 5.2 2.8 (0.4) 12.9 20.6 18.9 9%
Other Income 0.2 0.9 0.1 2.6 3.8 3.1 25%
Interest Expenses (0.04) (0.0) (0.02) (3.6) (3.7) (3.2) 12%
Depreciation (0.5) (0.1) (0.1) (4.7) (5.5) (4.6) 19%
Provision for Taxes (1.2) (0.3) (0.1) (2.9) (4.6) (5.5) -16%
Share in profit/(loss) of JVs /
Associates- 0.0 (0.4) 0.0 (0.4) (1.7)
Adjustments for non -controlling
interest in Subs., etc.(0.5) (1.3) 0.2 0.2 (1.4) (0.7)
Net PAT 3.1 2.0 (0.9) 4.6 8.9 6.1 46%
L&T Group ` Billion IT & TS
Fin.
Services
Devl.
Projects
L&T &
Others (Incl.
Eliminations)
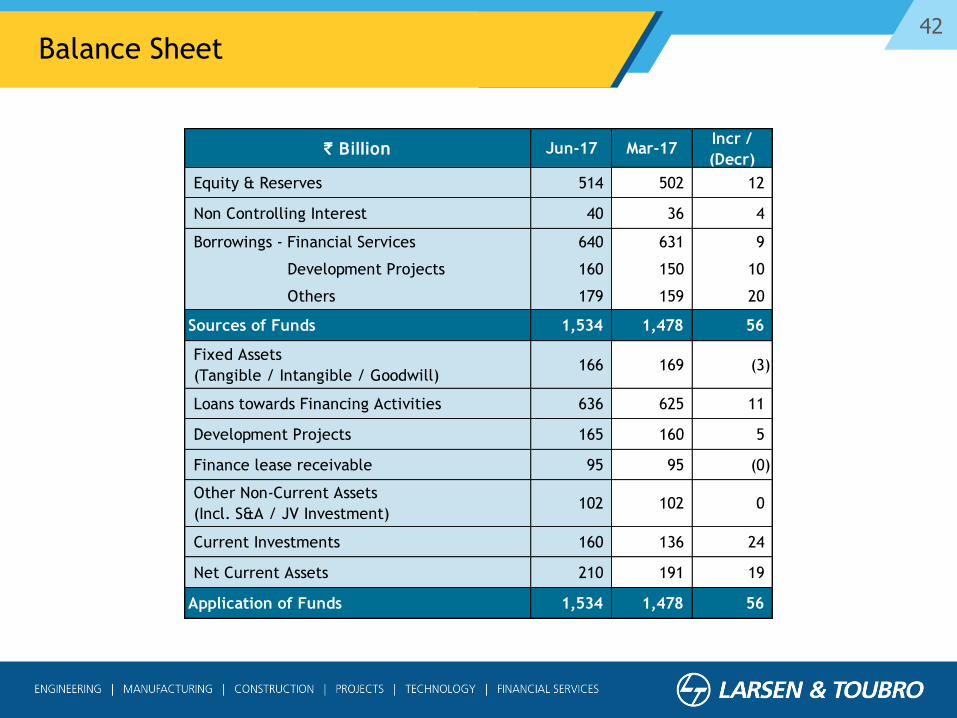
42Balance Sheet
` Billion Jun-17 Mar-17Incr /
(Decr)
Equity & Reserves 514 502 12
Non Controlling Interest 40 36 4
Borrowings - Financial Services 640 631 9
Development Projects 160 150 10
Others 179 159 20
Sources of Funds 1,534 1,478 56
Fixed Assets
(Tangible / Intangible / Goodwill)166 169 (3)
Loans towards Financing Activities 636 625 11
Development Projects 165 160 5
Finance lease receivable 95 95 (0)
Other Non-Current Assets
(Incl. S&A / JV Investment)102 102 0
Current Investments 160 136 24
Net Current Assets 210 191 19
Application of Funds 1,534 1,478 56
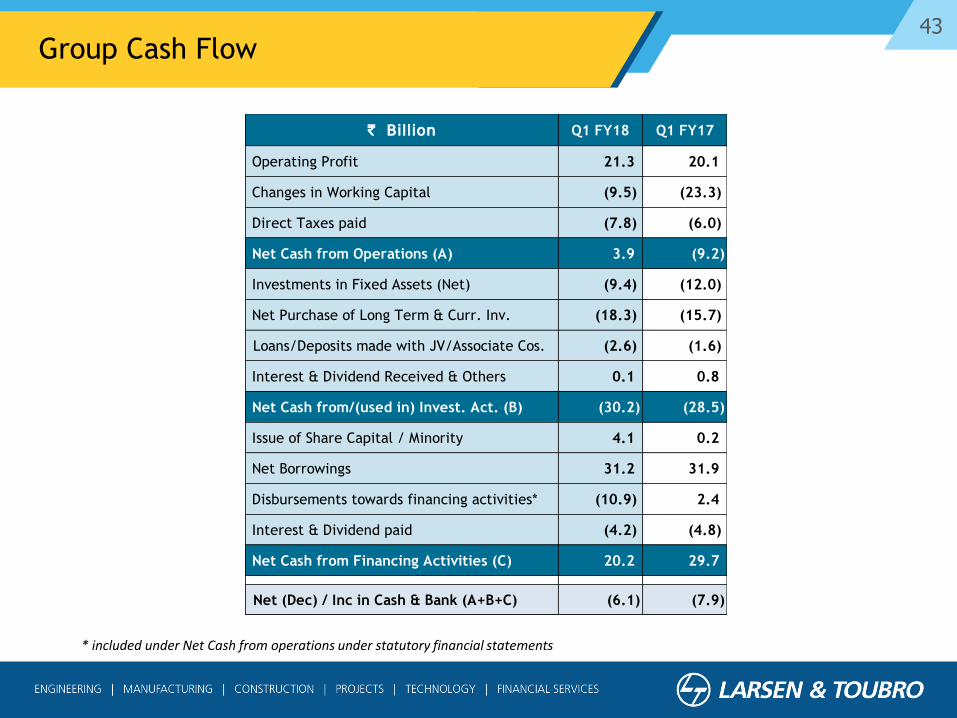
43Group Cash Flow
* included under Net Cash from operations under statutory financial statements
` Billion Q1 FY18 Q1 FY17
Operating Profit 21.3 20.1
Changes in Working Capital (9.5) (23.3)
Direct Taxes paid (7.8) (6.0)
Net Cash from Operations (A) 3.9 (9.2)
Investments in Fixed Assets (Net) (9.4) (12.0)
Net Purchase of Long Term & Curr. Inv. (18.3) (15.7)
Loans/Deposits made with JV/Associate Cos. (2.6) (1.6)
Interest & Dividend Received & Others 0.1 0.8
Net Cash from/(used in) Invest. Act. (B) (30.2) (28.5)
Issue of Share Capital / Minority 4.1 0.2
Net Borrowings 31.2 31.9
Disbursements towards financing activities* (10.9) 2.4
Interest & Dividend paid (4.2) (4.8)
Net Cash from Financing Activities (C) 20.2 29.7
Net (Dec) / Inc in Cash & Bank (A+B+C) (6.1) (7.9)
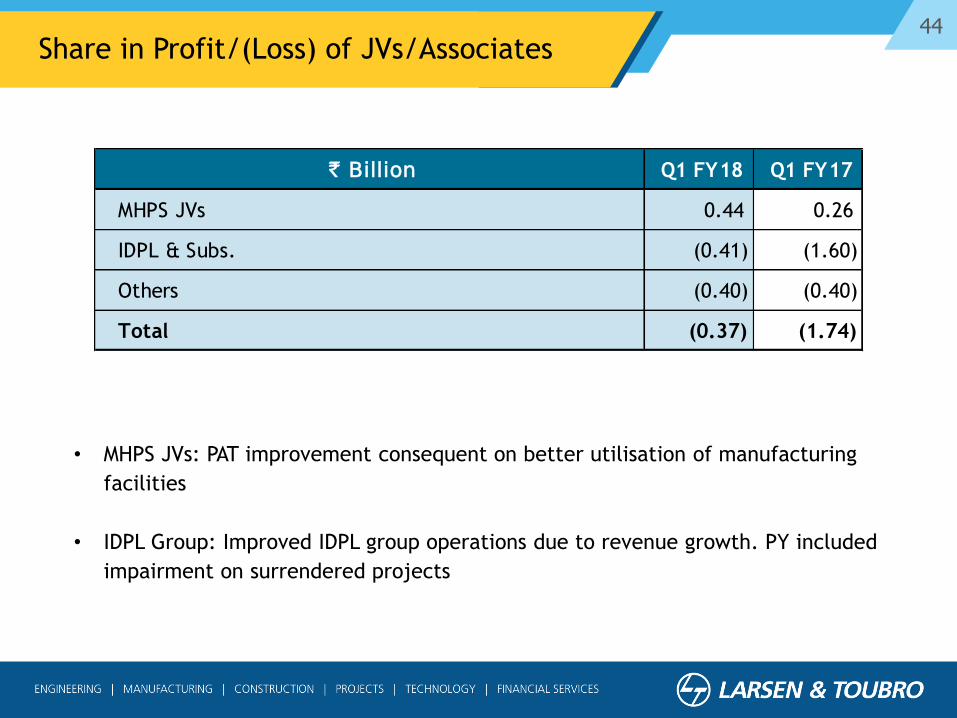
44Share in Profit/(Loss) of JVs/Associates
• MHPS JVs: PAT improvement consequent on better utilisation of manufacturing
facilities
• IDPL Group: Improved IDPL group operations due to revenue growth. PY included
impairment on surrendered projects
` Billion Q1 FY18 Q1 FY17
MHPS JVs 0.44 0.26
IDPL & Subs. (0.41) (1.60)
Others (0.40) (0.40)
Total (0.37) (1.74)
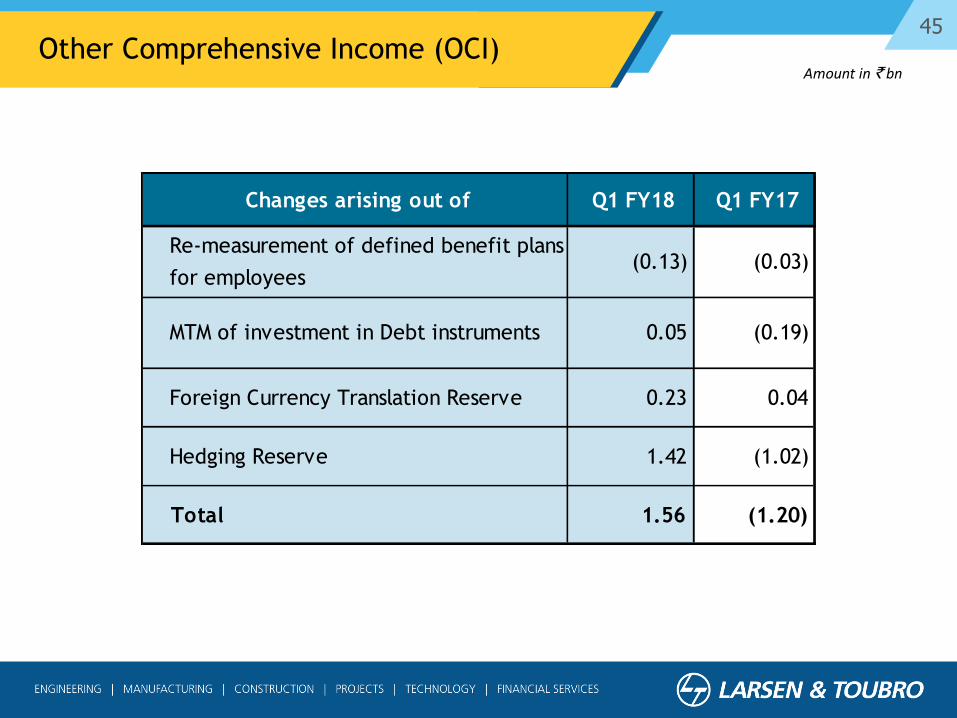
45Other Comprehensive Income (OCI)
Amount in ` bn
Changes arising out of Q1 FY18 Q1 FY17
Re-measurement of defined benefit plans
for employees (0.13) (0.03)
MTM of investment in Debt instruments 0.05 (0.19)
Foreign Currency Translation Reserve 0.23 0.04
Hedging Reserve 1.42 (1.02)
Total 1.56 (1.20)
46
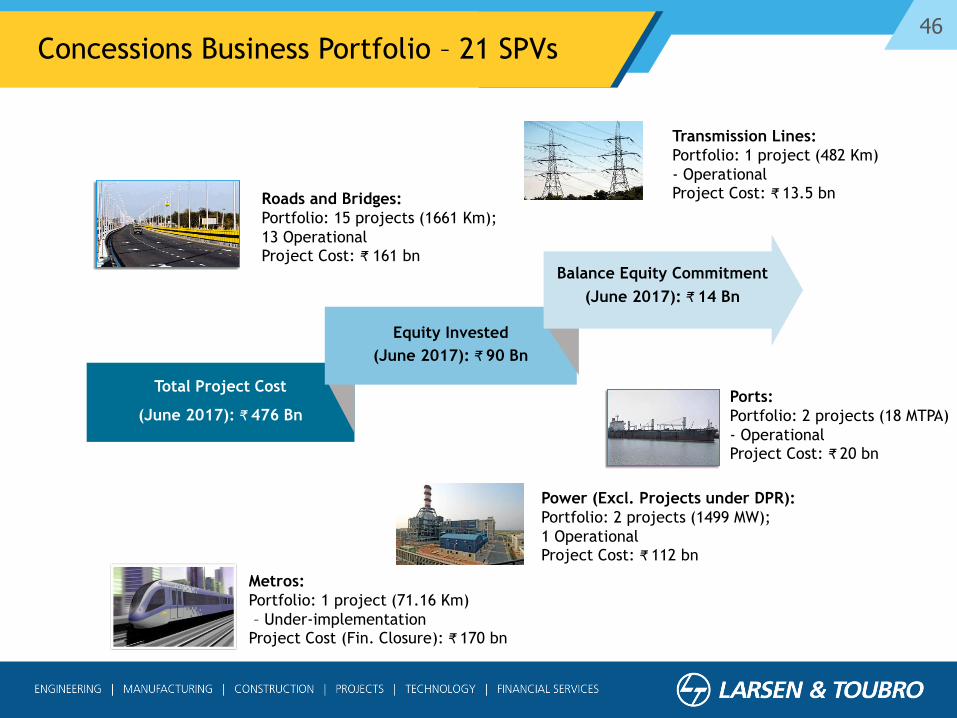
Roads and Bridges:
Portfolio: 15 projects (1661 Km);
13 OperationalProject Cost: ₹ 161 bn
Power (Excl. Projects under DPR):
Portfolio: 2 projects (1499 MW);
1 OperationalProject Cost: ₹ 112 bn
Ports:
Portfolio: 2 projects (18 MTPA)
- Operational Project Cost: ₹ 20 bn
Metros:
Portfolio: 1 project (71.16 Km)
– Under-implementationProject Cost (Fin. Closure): ₹ 170 bn
Transmission Lines:
Portfolio: 1 project (482 Km)
- Operational Project Cost: ₹ 13.5 bn
Total Project Cost
(June 2017): ₹ 476 Bn
Equity Invested
(June 2017): ₹ 90 Bn
Balance Equity Commitment
(June 2017): ₹ 14 Bn
Concessions Business Portfolio – 21 SPVs
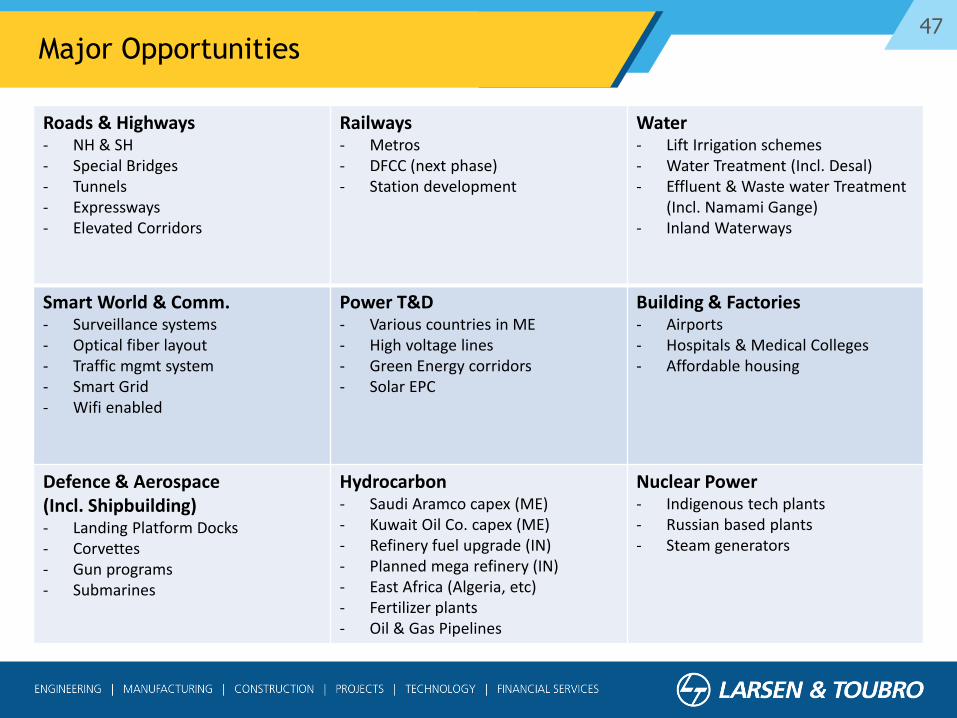
47Major Opportunities
Roads & Highways- NH & SH- Special Bridges- Tunnels- Expressways- Elevated Corridors
Railways- Metros- DFCC (next phase)- Station development
Water- Lift Irrigation schemes- Water Treatment (Incl. Desal)- Effluent & Waste water Treatment
(Incl. Namami Gange)- Inland Waterways
Smart World & Comm.- Surveillance systems- Optical fiber layout- Traffic mgmt system- Smart Grid- Wifi enabled
Power T&D- Various countries in ME- High voltage lines- Green Energy corridors- Solar EPC
Building & Factories- Airports- Hospitals & Medical Colleges- Affordable housing
Defence & Aerospace(Incl. Shipbuilding)- Landing Platform Docks- Corvettes- Gun programs- Submarines
Hydrocarbon- Saudi Aramco capex (ME)- Kuwait Oil Co. capex (ME)- Refinery fuel upgrade (IN)- Planned mega refinery (IN)- East Africa (Algeria, etc)- Fertilizer plants- Oil & Gas Pipelines
Nuclear Power- Indigenous tech plants- Russian based plants- Steam generators