investor presentation - lancashire corporate website...investor presentation q4 2018 . ... impact...
TRANSCRIPT

Investor Presentation
Q4 2018
www.lancashiregroup.com

Safe harbour statements
NOTE REGARDING FORWARD-LOOKING STATEMENTS: CERTAIN STATEMENTS AND INDICATIVE PROJECTIONS (WHICH MAY INCLUDE MODELLED LOSS SCENARIOS) MADE IN THIS RELEASE OR OTHERWISE THAT ARE NOT BASED ON CURRENT OR HISTORICAL FACTS ARE FORWARD-LOOKING IN NATURE INCLUDING, WITHOUT LIMITATION, STATEMENTS CONTAINING THE WORDS “BELIEVES”, “ANTICIPATES”, “PLANS”, “PROJECTS”, “FORECASTS”, “GUIDANCE”, “INTENDS”, “EXPECTS”, “ESTIMATES”, “PREDICTS”, “MAY”, “CAN”, “LIKELY”, “WILL”, “SEEKS”, “SHOULD”, OR, IN EACH CASE, THEIR NEGATIVE OR COMPARABLE TERMINOLOGY. ALL SUCH STATEMENTS OTHER THAN STATEMENTS OF HISTORICAL FACTS INCLUDING, WITHOUT LIMITATION, THE GROUP’S FINANCIAL POSITION, TAX RESIDENCY, LIQUIDITY, RESULTS OF OPERATIONS, PROSPECTS, GROWTH, CAPITAL MANAGEMENT PLANS AND EFFICIENCIES, ABILITY TO CREATE VALUE, DIVIDEND POLICY, OPERATIONAL FLEXIBILITY, COMPOSITION OF MANAGEMENT, BUSINESS STRATEGY, PLANS AND OBJECTIVES OF MANAGEMENT FOR FUTURE OPERATIONS (INCLUDING DEVELOPMENT PLANS AND OBJECTIVES RELATING TO THE GROUP’S INSURANCE BUSINESS) ARE FORWARD-LOOKING STATEMENTS. SUCH FORWARD-LOOKING STATEMENTS INVOLVE KNOWN AND UNKNOWN RISKS, UNCERTAINTIES AND OTHER IMPORTANT FACTORS THAT COULD CAUSE THE ACTUAL RESULTS, PERFORMANCE OR ACHIEVEMENTS OF THE GROUP TO BE MATERIALLY DIFFERENT FROM FUTURE RESULTS, PERFORMANCE OR ACHIEVEMENTS EXPRESSED OR IMPLIED BY SUCH FORWARD-LOOKING STATEMENTS. THESE FACTORS INCLUDE, BUT ARE NOT LIMITED TO: THE ACTUAL DEVELOPMENT OF LOSSES AND EXPENSES IMPACTING ESTIMATES FOR HURRICANE MICHAEL AND THE WILDFIRES WHICH IMPACTED PARTS OF CALIFORNIA DURING THE FOURTH QUARTER OF 2018, HURRICANE FLORENCE, THE TYPHOONS AND MARINE LOSSES THAT OCCURRED IN THE THIRD QUARTER OF 2018, HURRICANES HARVEY, IRMA AND MARIA AND THE EARTHQUAKES IN MEXICO THAT OCCURRED IN THE THIRD QUARTER OF 2017 AND THE WILDFIRES WHICH IMPACTED PARTS OF CALIFORNIA DURING THE FOURTH QUARTER OF 2017; THE IMPACT OF COMPLEX AND UNIQUE CAUSATION AND COVERAGE ISSUES ASSOCIATED WITH ATTRIBUTION OF LOSSES TO WIND OR FLOOD DAMAGE OR OTHER PERILS SUCH AS FIRE OR BUSINESS INTERRUPTION RELATING TO SUCH EVENTS; POTENTIAL UNCERTAINTIES RELATING TO REINSURANCE RECOVERIES, REINSTATEMENT PREMIUMS AND OTHER FACTORS INHERENT IN LOSS ESTIMATION; THE GROUP’S ABILITY TO INTEGRATE ITS BUSINESSES AND PERSONNEL; THE SUCCESSFUL RETENTION AND MOTIVATION OF THE GROUP’S KEY MANAGEMENT; THE INCREASED REGULATORY BURDEN FACING THE GROUP; THE NUMBER AND TYPE OF INSURANCE AND REINSURANCE CONTRACTS THAT THE GROUP WRITES OR MAY WRITE; THE GROUP’S ABILITY TO IMPLEMENT SUCCESSFULLY ITS BUSINESS STRATEGY DURING ‘SOFT’ AS WELL AS ‘HARD’ MARKETS; THE PREMIUM RATES WHICH MAY BE AVAILABLE AT THE TIME OF SUCH RENEWALS WITHIN THE GROUP’S TARGETED BUSINESS LINES; THE POSSIBLE LOW FREQUENCY OF LARGE EVENTS; POTENTIALLY UNUSUAL LOSS FREQUENCY; THE IMPACT THAT THE GROUP’S FUTURE OPERATING RESULTS, CAPITAL POSITION AND RATING AGENCY AND OTHER CONSIDERATIONS MAY HAVE ON THE EXECUTION OF ANY CAPITAL MANAGEMENT INITIATIVES OR DIVIDENDS; THE POSSIBILITY OF GREATER FREQUENCY OR SEVERITY OF CLAIMS AND LOSS ACTIVITY THAN THE GROUP’S UNDERWRITING, RESERVING OR INVESTMENT PRACTICES HAVE ANTICIPATED; THE RELIABILITY OF, AND CHANGES IN ASSUMPTIONS TO, CATASTROPHE PRICING, ACCUMULATION AND ESTIMATED LOSS MODELS; INCREASED COMPETITION FROM EXISTING ALTERNATIVE CAPITAL PROVIDERS, INSURANCE LINKED FUNDS AND COLLATERALISED SPECIAL PURPOSE INSURERS AND THE RELATED DEMAND AND SUPPLY DYNAMICS AS CONTRACTS COME UP FOR RENEWAL; THE EFFECTIVENESS OF THE GROUP’S LOSS LIMITATION METHODS; THE POTENTIAL LOSS OF KEY PERSONNEL; A DECLINE IN THE GROUP’S OPERATING SUBSIDIARIES’ RATING WITH A.M. BEST, S&P GLOBAL RATINGS, MOODY’S OR OTHER RATING AGENCIES; INCREASED COMPETITION ON THE BASIS OF PRICING, CAPACITY, COVERAGE TERMS OR OTHER FACTORS; CYCLICAL DOWNTURNS OF THE INDUSTRY; THE IMPACT OF A DETERIORATING CREDIT ENVIRONMENT FOR ISSUERS OF FIXED MATURITY INVESTMENTS; THE IMPACT OF SWINGS IN MARKET INTEREST RATES, CURRENCY EXCHANGE RATES AND SECURITIES PRICES; CHANGES BY CENTRAL BANKS REGARDING THE LEVEL OF INTEREST RATES; THE IMPACT OF INFLATION OR DEFLATION IN RELEVANT ECONOMIES IN WHICH THE GROUP OPERATES; THE EFFECT, TIMING AND OTHER UNCERTAINTIES SURROUNDING FUTURE BUSINESS COMBINATIONS WITHIN THE INSURANCE AND REINSURANCE INDUSTRIES; THE IMPACT OF TERRORIST ACTIVITY IN THE COUNTRIES IN WHICH THE GROUP WRITES RISKS; A RATING DOWNGRADE OF, OR A MARKET DECLINE IN, SECURITIES IN THE GROUP’S INVESTMENT PORTFOLIO; CHANGES IN GOVERNMENTAL REGULATIONS OR TAX LAWS IN JURISDICTIONS WHERE THE GROUP CONDUCTS BUSINESS; LANCASHIRE OR ANY OF THE GROUP’S BERMUDIAN SUBSIDIARIES BECOMING SUBJECT TO INCOME TAXES IN THE UNITED STATES OR IN THE UNITED KINGDOM; THE IMPACT OF THE CHANGE IN TAX RESIDENCE ON STAKEHOLDERS OF THE COMPANY; AND THE IMPACT OF “BREXIT” (FOLLOWING THE UK’S NOTIFICATION TO THE EUROPEAN COUNCIL UNDER ARTICLE 50 OF THE TREATY ON EUROPEAN UNION ON 29 MARCH 2017) AND FUTURE NEGOTIATIONS REGARDING THE UK’S RELATIONSHIP WITH THE EU ON THE GROUP’S BUSINESS, REGULATORY RELATIONSHIPS, UNDERWRITING PLATFORMS OR THE INDUSTRY GENERALLY. ALL FORWARD-LOOKING STATEMENTS IN THIS RELEASE SPEAK ONLY AS AT THE DATE OF PUBLICATION. LANCASHIRE EXPRESSLY DISCLAIMS ANY OBLIGATION OR UNDERTAKING (SAVE AS REQUIRED TO COMPLY WITH ANY LEGAL OR REGULATORY OBLIGATIONS INCLUDING THE RULES OF THE LONDON STOCK EXCHANGE) TO DISSEMINATE ANY UPDATES OR REVISIONS TO ANY FORWARD-LOOKING STATEMENT TO REFLECT ANY CHANGES IN THE GROUP’S EXPECTATIONS OR CIRCUMSTANCES ON WHICH ANY SUCH STATEMENT IS BASED. ALL SUBSEQUENT WRITTEN AND ORAL FORWARD-LOOKING STATEMENTS ATTRIBUTABLE TO THE GROUP OR INDIVIDUALS ACTING ON BEHALF OF THE GROUP ARE EXPRESSLY QUALIFIED IN THEIR ENTIRETY BY THIS NOTE. PROSPECTIVE INVESTORS SHOULD SPECIFICALLY CONSIDER THE FACTORS IDENTIFIED IN THIS RELEASE WHICH COULD CAUSE ACTUAL RESULTS TO DIFFER BEFORE MAKING AN INVESTMENT DECISION.
2

Lancashire is a global specialty P&C re-insurer
Active portfolio construction and risk management will continue to support our performance irrespective of market conditions.
Our business model centres around our “Underwriting comes first” principle:
1. We aim to maximise risk-adjusted returns over the long run within our global specialty P&C business
2. We are highly selective in choosing risks to underwrite and we focus on higher margin business
3. We operate three capital platforms, which allow us further flexibility in accessing and underwriting the risks we like
4. We actively manage our capital base to support healthy shareholder returns whatever the operating environment
(1) Based on 2019 forecast of gross premiums written as of January 2019. Estimates could change without notice in response to several factors, including trading conditions.
Property reinsurance
& Retro
29%
Property insurance
15%
Terrorism &
Political risks
9%
Marine
10%
Energy
15%
Aviation
16%
Other
6%
55% insurance 45% reinsurance 36% nat-cat exposed 64% other(1)
3

Why invest in Lancashire:
1. Underwriting comes first, whatever the market environment. This core principle has helped us deliver a market-leading track record, with better combined ratios over 3 years (0.6 pts outperformance) 5 years (10.2 pts outperformance) and 10 years (23.2 pts outperformance).
2. Actively balancing risk and return through risk selection and risk management. Our daily underwriting call, strategic overview of risk and active management of exposures have proven they lead to long-term success.
3. Operate nimbly through the cycle. Our three market-leading platforms support this and drive our long-term success: Lancashire, Cathedral and Kinesis. Better broker relationships; better cross-selling and referral opportunities; and better reinsurance purchasing power. Our active use of capital management can also help deliver shareholder returns.
4. Proven superior risk/return profile over the long run, with RoE and TSR comfortably above peer averages. Across the business, the compensation structure is aligned with shareholders, with all permanent employees participating in Lancashire's restricted share scheme.
5. Stable senior leadership and underwriting team. Our CEO, CFO and Chief Underwriting Officer have all been with Lancashire for over 10 years and have over 20 years average industry experience. Our senior underwriters have c. 26 years average industry experience, with average tenure at Lancashire of just over 8 years.
4

1. Underwriting comes first: Delivering better returns, even in heavier loss years
Combined Ratio (1)
0%
20%
40%
60%
80%
100%
120%
2009 2010 2011 2012 2013 2014 2015 2016 2017 2018
Lancashire Sector average Lancashire 10 year average Sector 10 year average
• Delivering strong combined ratios in specialty insurance lines demonstrates Lancashire’s continued profitability in these lines of business
(1) 10 year average based on 2009 to 2018 reporting periods. Lancashire ratios are weighted by annual net premiums earned. Annual sector ratios are weighted by annual net premiums earned. (2) Sector includes Arch, Argo, Axis, Beazley, Everest, Greenlight Re, Hanover, Hiscox, Ren Re and Third Point Re. Third Point Re commenced underwriting operations in 2012. Source: Company reports. 5

2. Actively balancing risk and return: Robust risk management process
1. Daily Underwriting Marketing Conference Call allows for better risk selection and portfolio construction
• Supports our “underwriting comes first” principle: senior management and underwriters are on the call, allowing for more objective analysis of risk and fast feedback loops on market conditions
• Unique underwriting approach with proven results, with participants from London, Bermuda, and Cathedral allowing flexibility and the best use of our three platforms
• Excellent record of combined ratio out performance
2. Risk and Return Committee helps ensure active management of exposures
• Strategic overview of risk and portfolio optimisation that allows for best use of capacity
• Proven ability to manage risk / return dynamics via re-underwriting, risk selection and de-risking when appropriate
• Three platform strategy enabling diversified access and a quick response to market events
3. Disciplined capital deployment
• Commitment to maximising growth in fully converted book value per share, not just growth in revenues
• Track record of active management via special dividends and buybacks when appropriate
• All permanent employees participate in Lancashire's restricted share scheme, aligning interests with shareholders
6
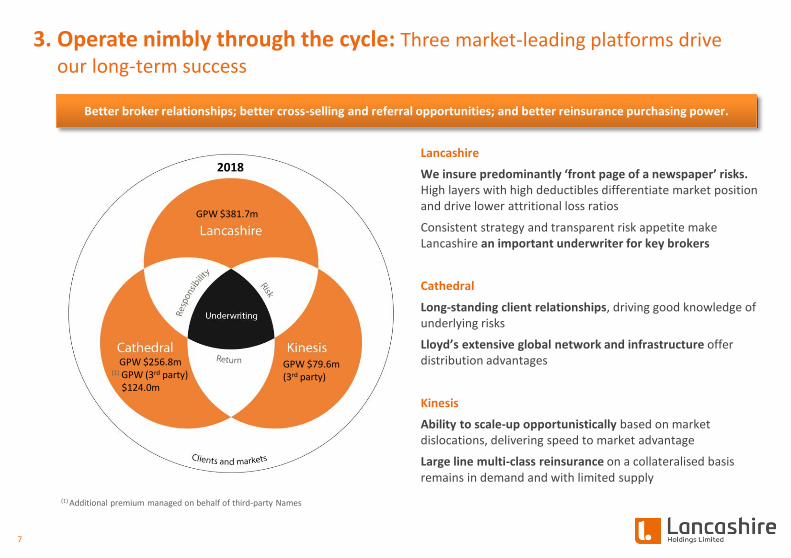
3. Operate nimbly through the cycle: Three market-leading platforms drive our long-term success
Better broker relationships; better cross-selling and referral opportunities; and better reinsurance purchasing power.
GPW $381.7m
GPW $256.8m (1) GPW (3rd party) $124.0m
GPW $79.6m (3rd party)
Lancashire
We insure predominantly ‘front page of a newspaper’ risks. High layers with high deductibles differentiate market position and drive lower attritional loss ratios
Consistent strategy and transparent risk appetite make Lancashire an important underwriter for key brokers
Cathedral
Long-standing client relationships, driving good knowledge of underlying risks
Lloyd’s extensive global network and infrastructure offer distribution advantages
Kinesis
Ability to scale-up opportunistically based on market dislocations, delivering speed to market advantage
Large line multi-class reinsurance on a collateralised basis remains in demand and with limited supply
2018
(1) Additional premium managed on behalf of third-party Names
7
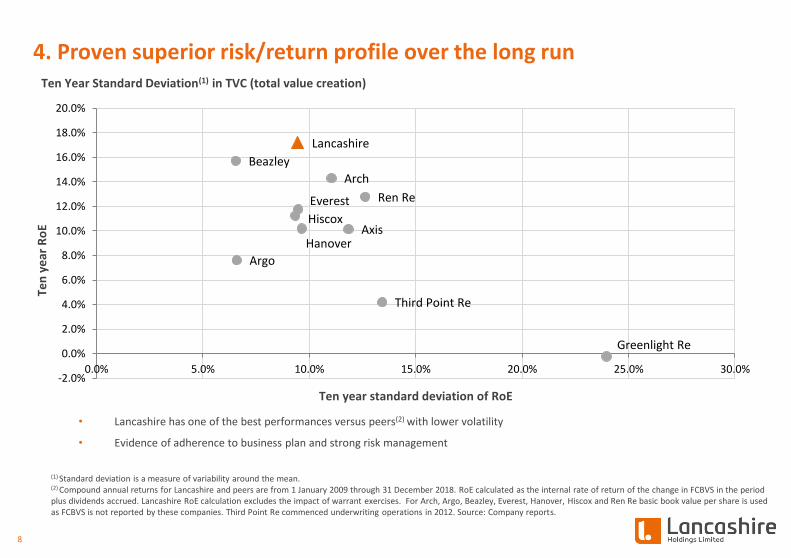
4. Proven superior risk/return profile over the long run Ten Year Standard Deviation(1) in TVC (total value creation)
Arch
Argo
Axis
Beazley
Everest
Greenlight Re
Hanover
Hiscox
Ren Re
Third Point Re
Lancashire
-2.0%
0.0%
2.0%
4.0%
6.0%
8.0%
10.0%
12.0%
14.0%
16.0%
18.0%
20.0%
0.0% 5.0% 10.0% 15.0% 20.0% 25.0% 30.0%
Ten
ye
ar R
oE
Ten year standard deviation of RoE
• Lancashire has one of the best performances versus peers(2) with lower volatility
• Evidence of adherence to business plan and strong risk management
(1) Standard deviation is a measure of variability around the mean. (2) Compound annual returns for Lancashire and peers are from 1 January 2009 through 31 December 2018. RoE calculated as the internal rate of return of the change in FCBVS in the period plus dividends accrued. Lancashire RoE calculation excludes the impact of warrant exercises. For Arch, Argo, Beazley, Everest, Hanover, Hiscox and Ren Re basic book value per share is used as FCBVS is not reported by these companies. Third Point Re commenced underwriting operations in 2012. Source: Company reports.
8

5. Active use of capital management further helps deliver shareholder returns
• Strategic decision not to declare special dividend for 2017 to retain capital to take advantage of expected rate increases
• Special dividend declared in 2018
285.0% of original IPO share capital has been returned to shareholders
(1) Dividends included in the financial statement year in which they were recorded. (2) Dividend yield is shown above the data in the chart area. Annual dividend yield is calculated as the total calendar year cash dividends divided by the year end share price.
0%
50%
100%
150%
200%
250%
300%
0
50
100
150
200
250
300
350
400
450
500
2007 2008 2009 2010 2011 2012 2013 2014 2015 2016 2017 2018
($m
)
Share repurchases Special dividends Ordinary dividends Percentage of IPO capital returned ITD
15.2%
8.3%
18.1%
N/A
18.0%
8.4%
12.3% 17.8%
17.3%
(1)
10.5%
1.6%
4.5%
9
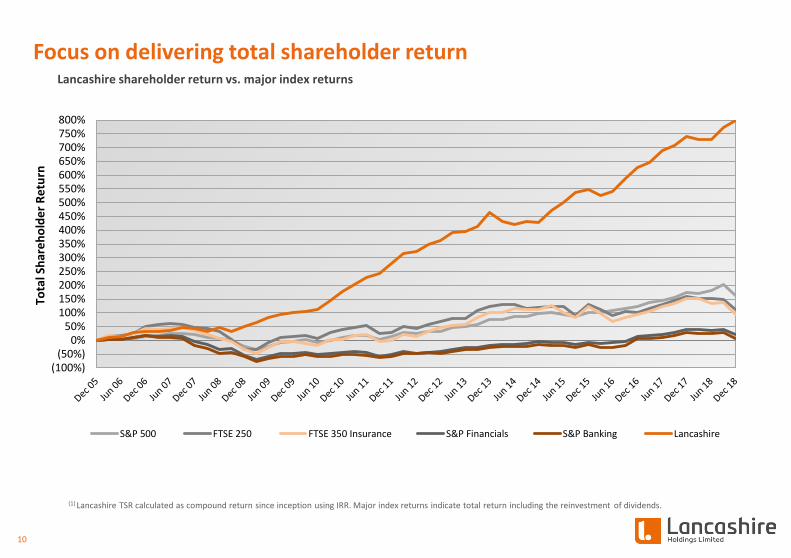
Focus on delivering total shareholder return
(100%)(50%)
0%50%
100%150%200%250%300%350%400%450%500%550%600%650%700%750%800%
Tota
l Sh
are
ho
lde
r R
etu
rn
S&P 500 FTSE 250 FTSE 350 Insurance S&P Financials S&P Banking Lancashire
Lancashire shareholder return vs. major index returns
(1) Lancashire TSR calculated as compound return since inception using IRR. Major index returns indicate total return including the reinvestment of dividends.
10
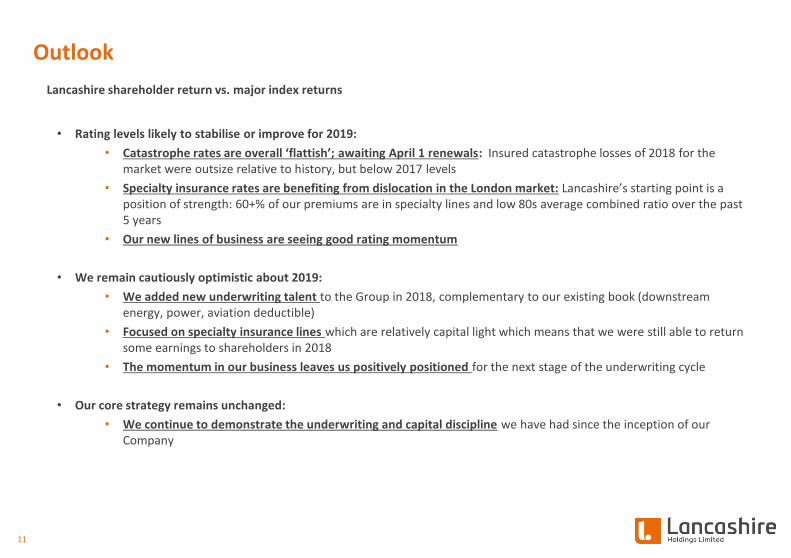
Outlook
• Rating levels likely to stabilise or improve for 2019:
• Catastrophe rates are overall ‘flattish’; awaiting April 1 renewals: Insured catastrophe losses of 2018 for the market were outsize relative to history, but below 2017 levels
• Specialty insurance rates are benefiting from dislocation in the London market: Lancashire’s starting point is a position of strength: 60+% of our premiums are in specialty lines and low 80s average combined ratio over the past 5 years
• Our new lines of business are seeing good rating momentum
• We remain cautiously optimistic about 2019:
• We added new underwriting talent to the Group in 2018, complementary to our existing book (downstream energy, power, aviation deductible)
• Focused on specialty insurance lines which are relatively capital light which means that we were still able to return some earnings to shareholders in 2018
• The momentum in our business leaves us positively positioned for the next stage of the underwriting cycle
• Our core strategy remains unchanged:
• We continue to demonstrate the underwriting and capital discipline we have had since the inception of our Company
Lancashire shareholder return vs. major index returns
11

Appendix
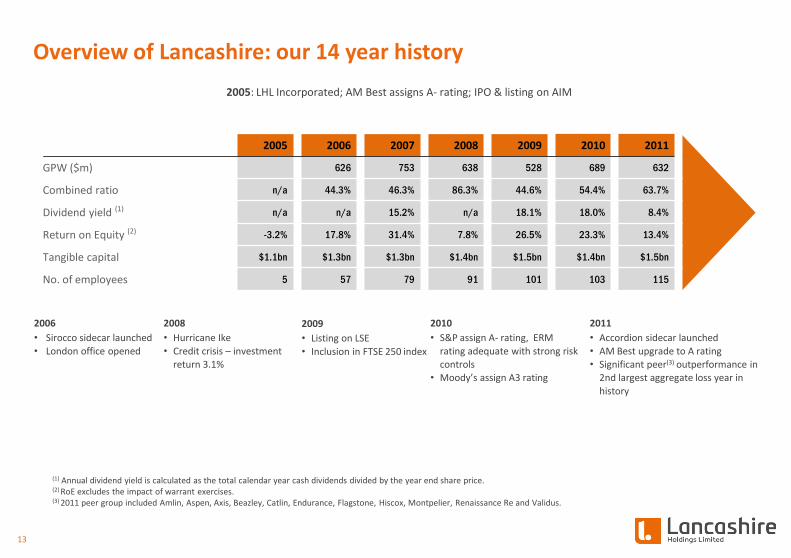
Overview of Lancashire: our 14 year history
2005: LHL Incorporated; AM Best assigns A- rating; IPO & listing on AIM
2005 2006 2007 2008 2009 2010 2011
GPW ($m) 626 753 638 528 689 632
Combined ratio n/a 44.3% 46.3% 86.3% 44.6% 54.4% 63.7%
Dividend yield (1) n/a n/a 15.2% n/a 18.1% 18.0% 8.4%
Return on Equity (2) -3.2% 17.8% 31.4% 7.8% 26.5% 23.3% 13.4%
Tangible capital $1.1bn $1.3bn $1.3bn $1.4bn $1.5bn $1.4bn $1.5bn
No. of employees 5 57 79 91 101 103 115
2006
• Sirocco sidecar launched
• London office opened
2008
• Hurricane Ike
• Credit crisis – investment return 3.1%
2009
• Listing on LSE
• Inclusion in FTSE 250 index
2010
• S&P assign A- rating, ERM
rating adequate with strong risk controls
• Moody’s assign A3 rating
2011
• Accordion sidecar launched
• AM Best upgrade to A rating • Significant peer(3) outperformance in
2nd largest aggregate loss year in
history
(1) Annual dividend yield is calculated as the total calendar year cash dividends divided by the year end share price. (2) RoE excludes the impact of warrant exercises. (3) 2011 peer group included Amlin, Aspen, Axis, Beazley, Catlin, Endurance, Flagstone, Hiscox, Montpelier, Renaissance Re and Validus.
13

2012 2013 2014 2015 2016 2017 2018
GPW ($m) 724 680 908 641 634 592 639
Combined ratio 63.9% 70.2% 68.7% 72.1% 76.5% 124.9% 92.2%
Dividend yield (1) 8.3% 12.3% 17.8% 17.3% 10.5% 1.6% 4.5%
Return on Equity (2) 17.1% 18.9% 14.7% 13.5% 13.5% -5.9% 2.4%
Tangible capital $1.6bn $1.6bn $1.5bn $1.4bn $1.4bn $1.3bn $1.2bn
No. of employees 104 169 185 192 198 204 213
Overview of Lancashire: our 14 year history
2012
• Rollover of
Accordion sidecar
• Saltire facility
launched • Issued $130
million of 5.7%
senior unsecured notes due 2022
2013
• Purchase of
Cathedral Capital Limited
• Launch of Kinesis
Capital Management, Kinesis Re and
Kinesis Holdings
2014
• Alex Maloney
appointed as CEO
• Syndicate 3010
capacity added-Energy and Terror
• Accordion and Saltire placed in run-off
2015
• Syndicate 3010 capacity
expanded to £100 million
2016
• Hired new management team for Cathedral and a new
underwriting team for Cathedral Property Catastrophe and D&F portfolios
2017
• Hurricanes Harvey, Irma & Maria, Mexico earthquakes
and California wildfires • Total shareholder return(3) of 9.4% in one of the top three
years for aggregate industry insured losses in recent
history
2018
• Added new complementary specialty insurance lines: downstream energy, power and aviation deductible
• Marine losses; Typhoons Jebi & Trami, Hurricanes
Florence & Michael and California wildfires
(1) Annual dividend yield is calculated as the total calendar year cash dividends divided by the year end share price. (2) RoE excludes the impact of warrant exercises. (3) Total shareholder return: The internal rate of return of the increase/(decrease) in share price in the period, measured in U.S. dollars, adjusted for dividends.
14
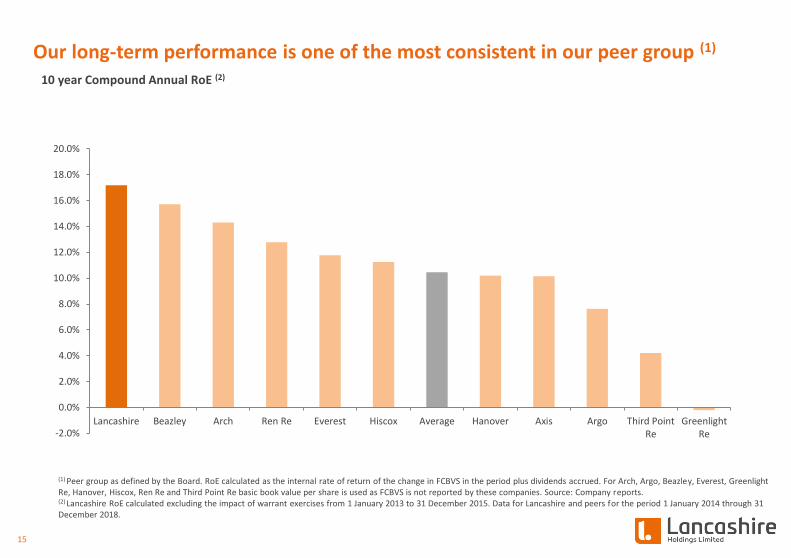
Our long-term performance is one of the most consistent in our peer group (1)
10 year Compound Annual RoE (2)
-2.0%
0.0%
2.0%
4.0%
6.0%
8.0%
10.0%
12.0%
14.0%
16.0%
18.0%
20.0%
Lancashire Beazley Arch Ren Re Everest Hiscox Average Hanover Axis Argo Third PointRe
GreenlightRe
(1) Peer group as defined by the Board. RoE calculated as the internal rate of return of the change in FCBVS in the period plus dividends accrued. For Arch, Argo, Beazley, Everest, Greenlight Re, Hanover, Hiscox, Ren Re and Third Point Re basic book value per share is used as FCBVS is not reported by these companies. Source: Company reports. (2) Lancashire RoE calculated excluding the impact of warrant exercises from 1 January 2013 to 31 December 2015. Data for Lancashire and peers for the period 1 January 2014 through 31 December 2018.
15
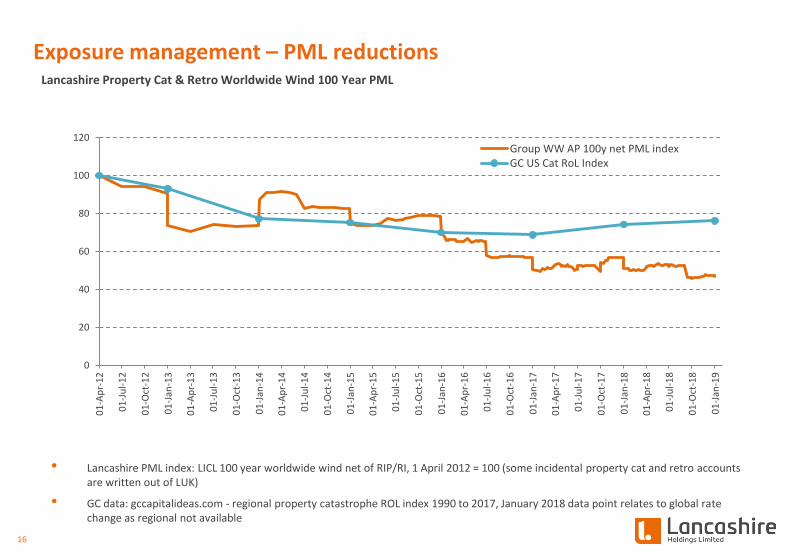
Exposure management – PML reductions Lancashire Property Cat & Retro Worldwide Wind 100 Year PML
• Lancashire PML index: LICL 100 year worldwide wind net of RIP/RI, 1 April 2012 = 100 (some incidental property cat and retro accounts are written out of LUK)
• GC data: gccapitalideas.com - regional property catastrophe ROL index 1990 to 2017, January 2018 data point relates to global rate change as regional not available
0
20
40
60
80
100
120
01
-Ap
r-1
2
01
-Ju
l-1
2
01
-Oct
-12
01
-Jan
-13
01
-Ap
r-1
3
01
-Ju
l-1
3
01
-Oct
-13
01
-Jan
-14
01
-Ap
r-1
4
01
-Ju
l-1
4
01
-Oct
-14
01
-Jan
-15
01
-Ap
r-1
5
01
-Ju
l-1
5
01
-Oct
-15
01
-Jan
-16
01
-Ap
r-1
6
01
-Ju
l-1
6
01
-Oct
-16
01
-Jan
-17
01
-Ap
r-1
7
01
-Ju
l-1
7
01
-Oct
-17
01
-Jan
-18
01
-Ap
r-1
8
01
-Ju
l-1
8
01
-Oct
-18
01
-Jan
-19
Group WW AP 100y net PML indexGC US Cat RoL Index
16
(15)
(10)
(5)
0
5
10
15
20
25
30
35
2011 2012 2013 2014 2015 2016 2017 2018
($m
)
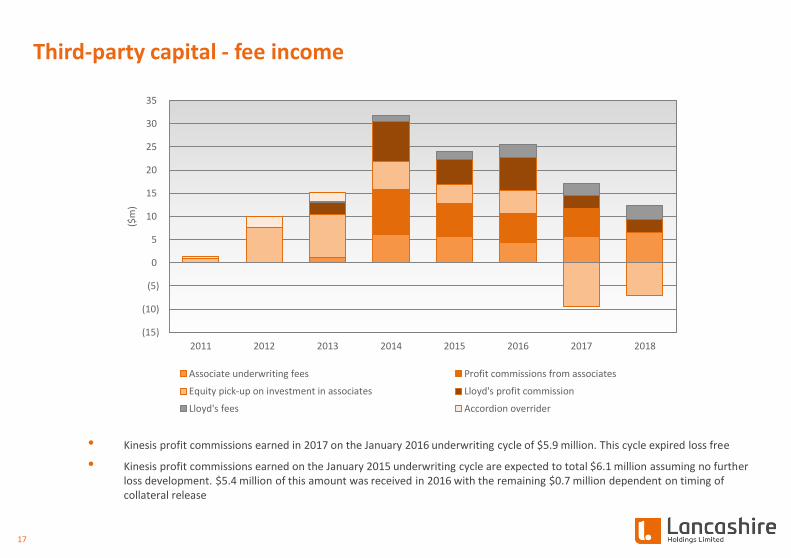
Associate underwriting fees Profit commissions from associates
Equity pick-up on investment in associates Lloyd's profit commission
Lloyd's fees Accordion overrider
• Kinesis profit commissions earned in 2017 on the January 2016 underwriting cycle of $5.9 million. This cycle expired loss free
• Kinesis profit commissions earned on the January 2015 underwriting cycle are expected to total $6.1 million assuming no further loss development. $5.4 million of this amount was received in 2016 with the remaining $0.7 million dependent on timing of collateral release
17
Third-party capital - fee income
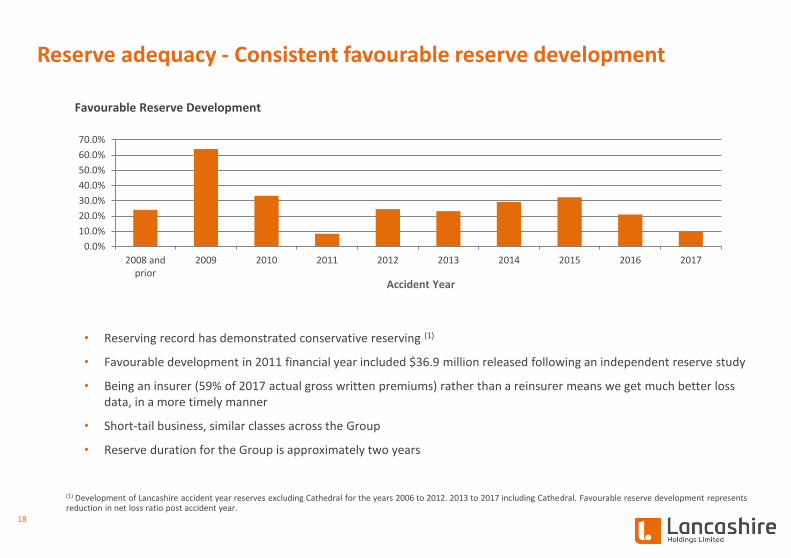
Reserve adequacy - Consistent favourable reserve development
(1) Development of Lancashire accident year reserves excluding Cathedral for the years 2006 to 2012. 2013 to 2017 including Cathedral. Favourable reserve development represents reduction in net loss ratio post accident year.
• Reserving record has demonstrated conservative reserving (1)
• Favourable development in 2011 financial year included $36.9 million released following an independent reserve study
• Being an insurer (59% of 2017 actual gross written premiums) rather than a reinsurer means we get much better loss data, in a more timely manner
• Short-tail business, similar classes across the Group
• Reserve duration for the Group is approximately two years
0.0%
10.0%
20.0%
30.0%
40.0%
50.0%
60.0%
70.0%
2008 andprior
2009 2010 2011 2012 2013 2014 2015 2016 2017
Accident Year
Favourable Reserve Development
18
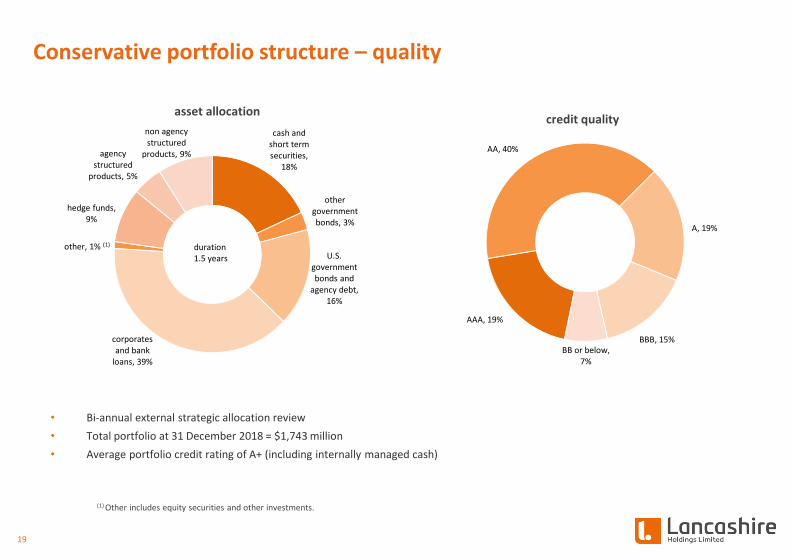
Conservative portfolio structure – quality
cash and short term securities,
18%
other government bonds, 3%
U.S. government bonds and
agency debt, 16%
corporates and bank
loans, 39%
other, 1% (1)
hedge funds, 9%
agency structured
products, 5%
non agency structured
products, 9%
asset allocation
duration 1.5 years
AAA, 19%
AA, 40%
A, 19%
BBB, 15% BB or below,
7%
credit quality
• Bi-annual external strategic allocation review
• Total portfolio at 31 December 2018 = $1,743 million
• Average portfolio credit rating of A+ (including internally managed cash)
(1) Other includes equity securities and other investments.
19

For more information:
Investor Relations Jelena Bjelanovic Lancashire Holdings Limited
29th Floor,
20 Fenchurch Street,
London, EC3M 3BY
Telephone: +44 (0) 20 7264 4066
Fax: +44 (0) 20 7264 4077
Email: [email protected]
London Office, UK Lancashire Holdings Limited 29th Floor, 20 Fenchurch Street, London, EC3M 3BY Telephone: + 44 (0) 20 7264 4000 Fax: + 44 (0) 20 7264 4077 Email: [email protected]
Media Contacts Haggie Partners
4 Sun Court 66-67 Cornhill London EC3V 3NB Email: [email protected]
Registered and Head Office, Bermuda Lancashire Holdings Limited Power House, 7 Par-la-Ville Road, Hamilton HM 11 Bermuda Telephone: + 1 (441) 278-8950 Fax: + 1 (441) 278-8951 Email: [email protected]
20