investor presentation july 2017 - talanx/media/files/t/talanx/reports-and-presentations/... ·...
TRANSCRIPT

Investor Presentation
July 2017

‘German Mittelstand’
Private policy
holders
Large German corporates, e.g.
V.a.G.
79.0%
Group structure
Free float
1903
1919
1953
1966
1991
1994
1998
2001
2006
2012
Foundation as ‘Haftpflichtverband der
deutschen Eisen- und Stahlindustrie‘ in Frankfurt
Relocation to Hannover
Companies of all industry sectors are able
to contract insurance with HDI V.a.G.
Foundation of Hannover Rückversiche-
rungs-AG
Diversification into life insurance
IPO of Hannover Rückversicherungs-AG
Renaming of HDI Beteiligungs AG to Talanx AG
Start transfer of business from HDI V.a.G.
to individual Talanx subsidiaries
Acquisition of Gerling insurance group by
Talanx AG
IPO of Talanx AG
History
21.0%1
1 Including employee shares and stake of Meiji Yasuda (below 5%)
Industrial
Lines
Retail
Germany
(P/C and Life)
Reinsurance
(P/C and
Life/Health)
Retail
International
Founded as a lead insurer by German corporates
Listing at Warsaw Stock Exchange 2014
Strong roots: originally founded by German corporate clients; HDI V.a.G still key shareholder
2 Investor Presentation July 2017

Industrial
Lines
Retail
International
Financial
Services
Reinsurance Retail Germany
Four divisions with a strong portfolio of brands
Integrated international insurance group following a multi-brand approach
3 Investor Presentation July 2017

Industrial
Lines
Retail
International
Reinsurance
Local presence by own risk carriers, branches and partners create efficient network in >130 countries
Key target growth regions: Latin America, Southeast Asia/India, Arabian Peninsula
Target regions: CEE (incl. Turkey) and Latin America
# 2 motor insurer in Poland2
# 5 motor insurer in Brazil2
# 3 motor insurer in Chile2
# 7 motor insurer in Mexico2
Global presence focussing on Western Europe, North- and South America as well as Asia
~5.000 customers in >150 countries
Presence in countries1
1 By branches, agencies, risk carriers, representative offices 2 Source: local regulatory authorities, Talanx AG
International presence International strategy by divisions
Total GWP: €31.1bn (2016)
2016 GWP: 50% in Primary Insurance (2015: 49%),
50% in Reinsurance (2015: 51%)
Group wide presence in >150 countries
20,039 employees (FTE) in 2016
International footprint and focussed growth strategy
Global network in Industrial Lines and Reinsurance – leading position in retail target markets
4 Investor Presentation July 2017

4.0
4.4
5.6
6.9
7.8
9.8
14.8
31.1
48.9
116.2
W&W
Gothaer
Signal Iduna
HUK
Vk Bayern
Debeka
R + V
Talanx
Munich Re
Allianz
European insurers by global GWP (2016, €bn) German insurers by global GWP (2016, €bn)
Listed insurers
1 2015 f igures 3 Gross earned premium 2 preliminary f igures
Source: Company publications, as of 15 June 2017
Top 10 European insurers Top 10 German insurers
Third-largest German insurance group with leading position in Europe
Among the leading European insurance groups
2
2
31.1
31.2
31.8
32.3
43.7
47.8
48.9
70.5
94.2
116.2
Talanx
Aviva
CNP
Swiss Re
Zurich
Prudential
Munich Re
Generali
AXA
Allianz
3
5 Investor Presentation July 2017

GWP by regions 2016 (Primary Insurance)
Regional and segmental split of GWP and EBIT
GWP by regions 2016 (consolidated Group level)
Germany
United Kingdom
Central and Eastern Europe
including Turkey (CEE)
Rest of Europe
North America
Latin America
RoW
GWP by segments 20161
Industrial Lines
Retail Germany P/C
Retail Germany Life
Retail International
Non-Life Reinsurance
Life/ Health Reinsurance
EBIT by segments 20161,2
20%
20%
6%
47%
11%
1 Adjusted for the 50.2% stake in Hannover Re 2 Calculation excludes Retail Germany P/C, w hich reported a negative EBIT of €2m
18%
21%
20%
15% 28%
9%
15%
18%
8%
14%
51%
14%
17%
4% 11%
2%
Well-diversified sources of premium and EBIT generation
6%
Industrial Lines
Retail Germany Life
Retail International
Non-Life Reinsurance
Life/ Health Reinsurance
Corporate Operations and Consolidation
15%
1%
8%
Germany
United Kingdom
Central and Eastern Europe
including Turkey (CEE)
Rest of Europe
North America
Latin America
RoW
1%
6 Investor Presentation July 2017

Industrial Lines
Retail Germany
Retail International
Reinsurance
Market leader in Bancassurance
Market leader in employee affinity
business
Core focus on corporate clients with
relationships often for decades
Blue-chip client base in Europe
Capability and capacity to lead international programs
~35% of segment GWP generated
by Bancassurance
Distribution focus on banks, brokers
and independent agents
Typically non-German business
generated via brokers
Unique strategy with clear focus on
B2B business models
Strategic focus on B2B and B2B2C Excellence in distribution channels1
Brokers
Bancassurance
Automotive
Employee
affinity
business
Retail Industrial/Reinsurance
Brazil
B2B competence as a key differentiator
1 Samples of clients/partners
Superior service of corporate relationships lies at heart of our value proposition
7 Investor Presentation July 2017

Key Pillars of our risk management
Asset risk is limited to less
than 50% of our SCR (solvency capital require-
ment)
Generating positive annual
earnings with a probability of 90%
Sufficient capital to withstand at
least an aggre-gated 3,000-year shock
1 2 3
8 Investor Presentation July 2017

Market risk
Non-life risk
Underwriting risk life
Operational risk
Total market risk stands at 47% of solvency
capital requirements, which is comfortably
below the 50% limit
Self-set limit of 50% reflects the dedication to
primarily focus on insurance risk
Non-Life is the dominating insurance risk
category, comprising premium and reserve
risk, NatCat and counterparty default risk
Equities ~2% of investments under own
management
Over 75% of fixed-income portfolio invested in
“A“ or higher-rated bonds – broadly stable over
recent quarters
47%
29%
17%
4%
1 Figures show risk categorisation, in terms of solvency capital requirements, of the Talanx Group in the economic view (based on Basic Ow n Funds) as of FY2016
Comments Risk components of Talanx Group1
1 Focus on insurance risk
Market risk sensitivity (limited to less than 50% of solvency capital requirement) is deliberately low
3% Counterparty default risk
9 Investor Presentation July 2017

394
477
183
485
216
512
626
732769
734
907
2006 2007 2008 2009 2010 2011 2012 2013 2014 2015 2016
+ Net profit – Net loss
1 Net income of Talanx after minorities, after tax based on restated f igures as shown in annual reports (2005–2015 according to IFRS) 2 Adjusted on the basis of IAS 8 3 Top 20 European peers, each year measured by GWP; on group level; IFRS standards
Source: Bloomberg, annual reports
Ta
lan
x G
rou
p a
nd
p
red
ece
sso
rs n
et i
nco
me
1
# o
f lo
ss
m
akin
g
co
mp
etito
rs3
+ + + + + + + + + +
Talanx Group net income
3 2 2 - - 7 1 2 - - -
+
2
2
2
2
2
Talanx Group net income1 (€m)
Diversification of business model leads to earnings resilience 2
Robust cycle resilience due to diversification of segments
10 Investor Presentation July 2017

3
Basic Own Funds (including hybrids and
surplus funds as well as non-controlling
interests)
Risk calculated with the full internal model
Eligible Own Funds, i.e. Basic Own Funds
(including hybrids and surplus funds as well as
non-controlling interests) with haircut on Talanx‘s
minority holdings
Operational risk modeled with standard formula,
(„partial internal model“)
For the Solvency II perspective, the HDI V.a.G.
as ultimate parent is the addressee of the
regulatory framework for the Group
Economic
View
(BOF CAR) 264%
(2015: 253%)
Limit ≥
200 %
186% Solvency II
Ratio1
(2015: 171%)
Target
corridor
150%-200%
Capital ratios improved despite a continuing low level of interest rates
with haircut
operational risk modeled
with standard formula
HDI solo-funds
1Group Solvency II Ratios including transitional (i.e. Regulatory View ): FY2016: 236%, FY2015: 224%
Note: In the entire presentation, calculations of Solvency II Capital Ratios are based on a 99.5% confidence level,
including volatility adjustments yet w ithout the effect of applicable transitionals – if not explicitly stated differently
TERM 2016 results – Capitalisation perspectives
11 Investor Presentation July 2017

Industrial Lines – International programmes as competitive edge
Talanx Primary Insurer:
37 countries Individual solution
possible
Network
hubs
Network
partner
12 Investor Presentation July 2017

Industrial Lines – An impressive long-standing client franchise
German corporates
(multinationals)
International corporates
(multinationals) German mid-market (SMEs)
Overview of selected key customers by customer segment
Well-established relationships with main players in targeted segments
13 Investor Presentation July 2017

Industrial Lines – Three initiatives to optimise performance
Strategic 3-element-programme
“Balanced Book” – raising profitability in
our domestic market 1
Generating profitable growth in foreign
markets 2
Establishing best-in-class efficiency and
processes 3
14 Investor Presentation July 2017

Industrial Lines – Profitabilisation measures in Germany
Portfolios under
review (GWP)
Results from negotiations (gross)
and portfolio improvement
Pro
pe
rty
M
oto
r3
Ma
rin
e
300
121
72
Negotiated €303.7m
Effects on premium - 8.4%
Capacity - 21.7%
Premium to capacity ratio
+25%1,2
Negotiated €121m
Effects on premium -10.1%
Effect on losses4 ~ -14%
Expected improvement in
loss ratio by FY2016 ≥ 3%pts5
Negotiated €71.8m
Effects on premium -5.3%
Capacity -26.9%
Premium to capacity ratio
+30%1
1 For portfolio under review 2 Including effect of additional specif ic reinsurance measures 3 German business only 4 Expected, in terms of loss volume 5 Assuming constant claims statistic; FY2015 loss ratio: 84.4% (gross)
€1,370m
€362m
€325m
Premium negotiated
2015/16 2016/17
Portfolios under
review (GWP)
Results from negotiations (gross)
and portfolio improvement
Negotiated €150m
Effects on premium - 2.0%
Capacity - 19.0%
Premium to capacity ratio
+20.7%1,2
Negotiated €24.5m
Effects on premium +23.2%
Capacity -15.0%
Premium to capacity ratio
+44%1
25
€350m
150
€1,350m
Successfully completed in 2016
15 Investor Presentation July 2017

Retail Germany - Key Messages from Capital Markets Day 2016
Retail Germany stands for 21% of Talanx’s GWP and 47% of its assets under own management. It
adds Life exposure to the Talanx Group which is overall strongly geared to P/C business
Retail Germany has a strong and highly committed management team with an excellent professional
track-record in handling challenges and in turning businesses around
Retail Germany targets for a sustainable EBIT contribution of at least €240m from 2021 onwards
KuRS combines three substantial strategic pillars: a new Life strategy, a new P/C strategy and
investments in Digitalisation/IT in combination with ongoing cost management
Management initiatives and the central strategic programme KuRS focus on optimising the position in
Bancassurance and on turning HDI around. Based on a customer-centric, sustainable and stable
business model, we target for a material improvement of the risk-return profile for shareholders
KuRS is the by far largest initiative with ~€330m of investments and a targeted cost cutting of ~€240m.
Targeted strategic investments comprise overall ~€420m. This includes ~€90m for Voyager4life
targeting at a joint IT Life platform
All interim goals have been met. In 2017, the KuRS programme savings are likely to first-time exceed
costs on EBIT level
16 Investor Presentation July 2017

2021E 2015 2016
~240
2020E 2019E
~-20
2018E 2017E
~€330m
~€240m Cost reduction1
Targeted strategic
investments for KuRS are
expected to be ~€330m
The related cost saving
target is ~€240m p.a.
Both numbers refer to Life
and P/C business in sum
Target is to implement all
initiatives in full by the end
of 2020 with the full cost
benefit to be reached in
2021
Investment & personnel redundancies
Cost reductions
Strategic target:
Gross reduction
cost base by
~€240m
in €m
73
128 ~140
~155
~180
~222
-89 -112
~-60 ~-40 ~-5
~-3
Investment
Cost reductions planned (2015/2016)
74
29
Retail Germany – KuRS programme:
Investment and cost reduction targets
Comments Estimated project costs and savings
Strategic investments target at restructuring HDI (catching up with market) and optimising BA (strengthening excellent market positions)
1 Cost reduction before inflation
Targeted strategic investments
comprise overall ~€420m ,
including already communicated
~€90m for Voyager4life
17 Investor Presentation July 2017

Retail Germany – KuRS programme:
Strategic approach P/C
Growth within target segment corporate business in 2016:
New business in total grew about +44% y/y
therof exclusive distribution (incl. direct sales) + 26% thereof third-party distribution + 77%
50k new motor policies via direct sales in 2016
Selective growth
Implementation of a new inventory management system in Motor within one year
By the help of the new system, a straight-through processing rate of more than 80% in the motor year-end business has been achieved
The migration of Motor legacy systems is planned until the beginning of 2019
Modernisation IT & processes
Succesful implementation of a claims app with more than 13k settled damages within one year (the app has been installed in April 2016)
HDI – together with cooperation partners – offers innovative telematics services via the app “TankTaler“; nearly 3k customers have already registered
Digitalisation
Strong base for the ongoing turnaround
P/C
18 Investor Presentation July 2017

Retail Germany – KuRS programme:
Strategic approach Life
Strong growth in biometric products1 of more than 11% in 2016 (~ €200m2)
Successful launch of new capital-efficient products in all carriers
Strategy-conform reduction of single-premium business by around 12.5% compared to 2015 for the Retail Germany Life carriers
New business
Approval of the internal model for all four German Life carriers Solvency II
Digitalisation of bAV services (pension scheme business) has been further boosted, with 62k active contracts until May 2017
Service apps have been introduced for all bancassurance companies until the end of 2016 (e.g. SmartCapture@BA)
Digitalisation
1 includes the follow ing products: term life insurance, funeral expense insurance, disabilitiy insurance, nursing care insurance, credit life insurance 2 in terms of total premiums paid
Key measures taken to allow for a successful performance in the low-interest environment
Life
19 Investor Presentation July 2017

Based on these assumptions, the average running yields will be sufficient to finance the guarantees for policyholders
Comments HDI Life Bancassurance
The implicit market
expectation for 20-
year AAA euro
government bonds
plus 50 bps is taken
as the assumed
reinvestment yield
for 2017 - 2021 in
the two diagrams -
e.g. 1.33% for 2017
The fixed-income
reinvestment yield in
2016 was higher at
1.34% for
Bancassurance and
at 1.50% for HDI
Life
avg. running yields avg. guarantee rates (incl. ZZR) reinvestment yield (fixed income)
Retail Germany – Asset Management Strategy: Comparison of
average running yields versus average guarantee rates
All numbers refer to German GAAP (HGB)
20 Investor Presentation July 2017
0.0%
0.5%
1.0%
1.5%
2.0%
2.5%
3.0%
3.5%
4.0%
0.0%
0.5%
1.0%
1.5%
2.0%
2.5%
3.0%
3.5%
4.0%

Retail Germany – Targets from Capital Markets Day 2016
Cost cutting initiatives to be implemented by end of 2020 ~ €240m
1 Talanx definition: incl. net interest income on funds w ithheld and contract deposits 2 Compared to base year 2014 Talanx targets for a combined ratio of ~96% until 2019 in Primary Insurance
Life new business: share of traditional life products by 2021 (new business premium) ≤ 25%
P/C: Growth in Property & Liability to SMEs and self-employed professionals by 20212 ≥ 25%
Combined ratio 20211 ≤ 95%
EBIT contribution (targeted sustainably from 2021) ≥ €240m
Gross premium growth (p.a.) ≥ 0%
Life ~ 0%
P/C ≥ 3%
Targets Retail Germany
Targets are subject to no large losses exceeding budget (cat), no turbulences on capital markets (capital), and no material currency fluctuations (currency)
21 Investor Presentation July 2017

Turkey
Poland
GWP growth (local currency)
Combined ratio
EBIT (€)
GWP growth (local currency)
o/w Life
o/w Non-Life
Combined ratio2
EBIT (€)
o/w Life
o/w Non-Life
-0.4%pts
-20.9%
0.0%pts
+19.9%
-81.6%
-4.9%
-6.4%
96.1%
89.3m
4.3m
84.9m
-24.4%
-4.1%
Brazil
GWP growth (local currency)
Combined ratio
EBIT (€)
+2.8%pts
-8.8%
-4.8%
102.1%
42.3m
+24.2%
102.5%
5.8m
Most of our core markets in Retail International with business growth
Mexico
GWP growth (local currency)
Combined ratio
EBIT (€)
+2.1%pts
-2.6%
+17.0%
95.3%
8.1m
Chile1
GWP growth (local currency)
Combined ratio
EBIT (€)
-3.5%pts
+112.3%
+24.7%
88.7%
24.1m
1 Includes all entities of HDI Chile Group operating in the Chilean market; Magallanes integrated in February 2015
2 Combined ratio for Warta only
Note: Market shares based on regional supervisory authorities or insurance associations (Polish KNF, Turkish TSB, Brazilian Siscorp, Mexican AMIS, Chilean AACH)
Retail International – Core Markets: FY2016 overview
Motor: 8.8%
Non-Life: 4.6%
Motor: 4.9%
Non-Life: 2.2%
Motor: 17.5%
Non-Life: 10.1%
Motor: 2.7%
Non-Life: 2.5%
Motor: 14.8%
Non-Life: 12.8%
% = market share in %
22 Investor Presentation July 2017

Retail International – Cycle management: Strategic initiatives in
Core Markets
Turkey
Poland
(Warta)
Strategic initiatives as key drivers of combined ratio improvement – supported by transfer of best practices
Brazil
Behavioral economics to improve claims
& service process
HDI Digital & Recycle to optimise profitability
Increase usage ratio of “Bate Prontos”
2017E 2016
102.1
Chile
Increase direct online sales
Focus on customer service
Increase sales through mid-sized brokers
Combined
Ratio in %:
2017E 2016
88.7
Mexico
Channel consolidation
P&C diversification
Pricing intelligence & Behavioral
economics
Combined
Ratio in %:
2017E 2016
95.3
Innovation in pricing („Big Data“)
Data driven claims handling
360° sales management
Combined
Ratio in %:
2017E 2016
96.1
Focus on non-motor, pro-active risk
selection in motor own damage
Cost management in claims handling
Offer “best in class” IT processes
Combined
Ratio in %:
2016 2017E
102.5
1 Magallanes integrated in February 2015
Combined
Ratio in %:
23 Investor Presentation July 2017

Challenges & Opportunities – Digitalisation
Elinvar White-label platform
for the digitalisation of
private wealth
management
HDI.de Redesign and launch
of new online products
and services
WARTA Digital Extensive data
analysis for a
customer-specific
approach
Claims app The app “HDI hilft” for the
transmission of claims
information and to track the
processing status
Startupbootcamp /
Plug and Play Partnerships to identify
the globally most promising
technologies in the insurance
industry Telematics “HDI TankTaler“
– the new telematics
product – attracting
customers by various
extra benefits
Pursuing and implementing a stringent innovation and digitalisation strategy
24 Investor Presentation July 2017
In-house expertise – partner of leading global accelerators – group-internal know-how transfer

Outlook for Talanx Group 20171
Gross written premium >1 %
Return on investment ≥3.0%
Group net income ~€800m
Return on equity >8.0%
Dividend payout ratio 35-45% target range
Targets are subject to no large losses exceeding budget (cat), no turbulences on capital markets (capital), and no material currency fluctuations (currency)
1 The targets are based on a large loss budget of €290m (2016: €300m) in Primary Insurance, of w hich €260m (2016: €270m) in Industrial Lines. The large loss
budget in Reinsurance stands at an unchanged €825m
25 Investor Presentation July 2017

~50%~50%
Primary Insurance Reinsurance Primary Insurance Reinsurance
Management ambition – Earnings balance Primary Insurance vs.
Reinsurance
EBIT 20161 EBIT ambition by 20211
Profitability improvement in Primary Insurance to lead to a balanced EBIT split
1 Adjusted for the 50.2% stake in Hannover Re
42%
58%
26 Investor Presentation July 2017
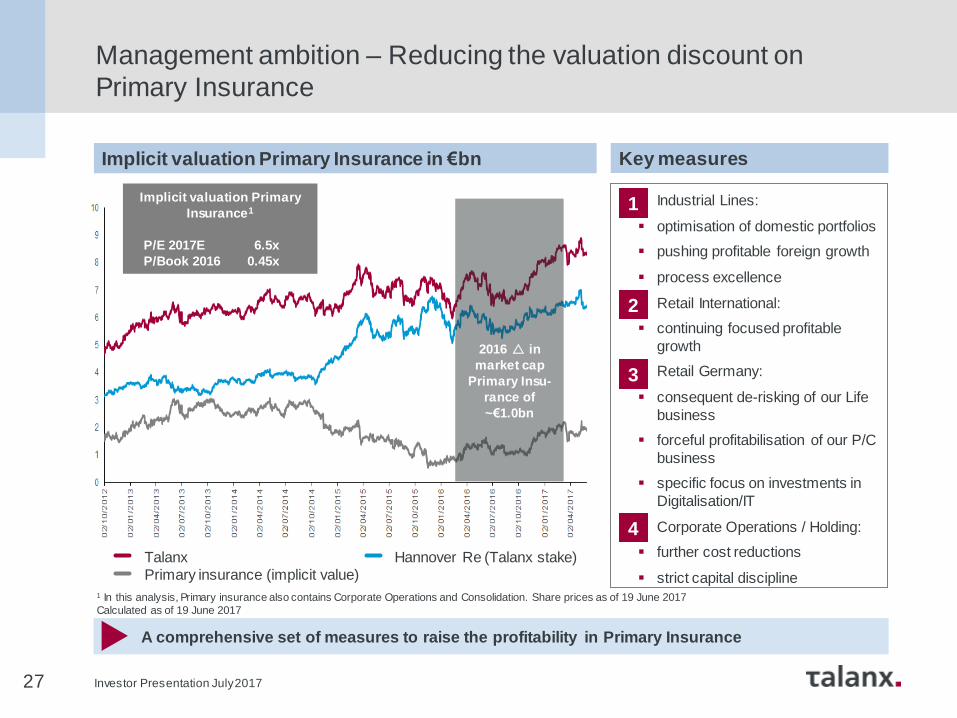
Industrial Lines:
optimisation of domestic portfolios
pushing profitable foreign growth
process excellence
Retail International:
continuing focused profitable
growth
Retail Germany:
consequent de-risking of our Life
business
forceful profitabilisation of our P/C
business
specific focus on investments in
Digitalisation/IT
Corporate Operations / Holding:
further cost reductions
strict capital discipline
Talanx Hannover Re (Talanx stake) Primary insurance (implicit value)
1
2
3
4
Management ambition – Reducing the valuation discount on
Primary Insurance
Implicit valuation Primary Insurance in €bn Key measures
A comprehensive set of measures to raise the profitability in Primary Insurance
Implicit valuation Primary
Insurance1
P/E 2017E 6.5x
P/Book 2016 0.45x
1 In this analysis, Primary insurance also contains Corporate Operations and Consolidation. Share prices as of 19 June 2017
Calculated as of 19 June 2017
2016 in
market cap
Primary Insu-
rance of
~€1.0bn
27 Investor Presentation July 2017

90%
110%
130%
150%
170%
190%
210%
Total shareholder return – More than four and half years since IPO
€m 19 June 2017
Market cap
31 Dec 2016
8,368
Market cap
IPO
./. 4,623
Dividends + 1,554
Value creation since IPO 5,299
TLX
Performance of the Talanx share
Total shareholder return since IPO close to 18% p.a.
28 Investor Presentation July 2017

Summary - Investment highlights
Global insurance group with leading market positions and strong German roots
Dedication to focus on insurance rather than market risks
Value creation through group-wide synergies
Profitability measures implemented in Industrial Lines and Retail Germany
Leading and successful B2B insurer
Commitment to continuously fulfill a „AA“ capital requirement by Standard & Poor‘s
Dedication to pay out 35-45% of IFRS earnings to shareholders
29 Investor Presentation July 2017

Mid-term Target Matrix & Current Status
1 Organic grow th only; currency-neutral 2 Risk-free rate is defined as the 5-year rolling average of the 10-year German
government bond yield 3 Talanx definition: incl. net interest income on funds w ithheld and contract deposits 4 EBIT/net premium earned, 5 Reflects Hannover Re target of at least €220m
6 Average throughout the cycle; currency-neutral, 7 Targets reflect Hannover Re‘s targets for 2015-2017 strategy cycle 8 Grow th rates calculated as 2014 – 2016 CAGR; otherw ise arithmetic mean Note: grow th targets are based on 2014 results. Grow th rates, combined ratios and EBIT margins are average annual targets
Group
Primary Insurance
P/C Reinsurance7
Life & Health
Reinsurance7
Segments
Gross premium grow th1
Return on equity
Group net income grow th
Dividend payout ratio
Return on investment
3 - 5%
≥ 750 bps above risk free2
mid single-digit percentage grow th rate
35 - 45%
≥ risk free + (150 to 200) bps2
Key figures Strategic targets (2015 - 2019)
Gross premium grow th1
Retention rate
Gross premium grow th
Gross premium grow th1
Combined ratio3
EBIT margin4
Gross premium grow th6
Combined ratio3
EBIT margin4
3 - 5%
60 - 65%
≥ 0%
≥ 10%
~ 96%
~ 6%
3 - 5%
≤ 96%
≥ 10%
Gross premium grow th1
Average value of New Business (VNB) after minorities5
EBIT margin4 f inancing and longevity business
EBIT margin4 mortality and health business
5 - 7%
≥ € 110m
≥ 2%
≥ 6%
Industrial Lines
Retail Germany
Retail International
2016 2015/20168
(0.3%)
10.4% [≥8.4%]
23.6%
37.6%
3.6% [≥2.4 – 2.9%]
2.2%
9.7% [≥8.6%]
9.5%
41.2%
3.6% [≥2.6 – 3.1%]
(0.1%)
53.4%
1.2%
52.6%
(5.7%) (4.5%)
10.2% 8.4%
98.1%
5.3%
-
4.5%
(0.2%)
93.7%
17.2%
4.1%
-
17.2%
(4.3%)
€ 448m
9.4%
3.4%
2.5%
€ 361m
10.2%
3.5%
30 Investor Presentation July 2017

- Q1 2017 -
31 Investor Presentation July 2017

Q1 2017 Group net income increased by 7% y/y to €238m (Q1 2016: €222m) – well on track to meet our FY2017 Group net income Outlook of ~€800m
Shareholders’ equity stood at €9,368m, or €37.06 per share at the end of Q1 2017. This is above the FY2016 level (€9,078m or €35.91 per share). RoE reached 10.3% (FY2016: 10.4%) – well on track to achieve FY2017 RoE Outlook of >8.0%
FY 2016 Solvency II Ratio (excluding transitional) improved to 186% (FY2015: 171%) and is expected to have moved sideways in Q1 2017
Return on investment stood at 3.5% (Q1 2016: 3.7%). Ordinary investment income up, also driven by distributions in real estate and other alternative investments
The Group‘s combined ratio remained stable at 96.3% (Q1 2016: 96.3%). Improvement in Primary Insurance segments (Industrial Lines, Retail Germany P/C) overcompensate the slightly higher combined ratio in Reinsurance P/C segment
I Q1 2017: Well on track to meet FY2017 Group Outlook
1 Adjusted for the 50.2% stake in Hannover Re
32 Investor Presentation July 2017

I Q1 2017 – Divisional contribution to change in Group net
income
Industrial Lines
Retail Germany
Retail International
Reinsurance Corporate Operations incl. Consolidation
31 Mar 2016
reported
Improvement of Group net income is due to positive contribution from Primary Insurance (incl. holding functions)
31 Mar 2017
reported
in €m
222
11 3
20 (10) (9)
238
33 Investor Presentation July 2017

I Q1 2017 results – Key financials
Summary of Q1 2017
€m, IFRS Q1 2017 Q1 2016 Change
Gross written premium 9,752 8,995 +8%
Net premium earned 6,692 6,266 +7%
Net underwriting result (415) (422) n/m
Net investment income 1,011 1,022 (1%)
Operating result (EBIT) 576 573 +0%
Net income after minorities 238 222 +7%
Key ratios Q1 2017 Q1 2016 Change
Combined ratio non-life
insurance and reinsurance 96.3% 96.3% 0.0%pts
Return on investment 3.5% 3.7% (0.2%)pts
Balance sheet Q1 2017 FY2016 Change
Investments under
own management 107,810 107,174 +1%
Goodwill 1,060 1,039 +2%
Total assets 160,061 156,571 +2%
Technical provisions 112,618 110,429 +2%
Total shareholders' equity 15,132 14,688 +3%
Shareholders' equity 9,368 9,078 +3%
Comments
GWP markedly up by 8.4% y/y, slightly supported by currency
tailwind (curr.-adj. GWP growth was 7.4%). Retail International
and P/C Reinsurance were the main growth drivers, both
contributing double-digit growth rates
Combined ratio remained stable y/y at 96.3%. Cost ratio
improved by 0.1%pts to 27.9%, while loss ratio was up by
0.3%pts to 68.6%. Industrial Lines (Q1 2017: 96.5% vs. Q1
2016: 97.6%) and Retail Germany (101.7% vs. 103.8%; adj.
for KuRS cost: 99.2% vs. 101.6%) with improved combined
ratios and overcompensating the higher combined ratio in
Reinsurance. Retail International‘s combined ratio (96.6% vs.
96.2%) also somewhat up due to losses from wild fires in Chile
Higher ordinary investment result, helped by better results
from real estate and other alternative investments, largely
compensating the lower extraordinary investment result
Q1 2017 EBIT slightly up compared to an also loss-light Q1
2016. Net income benefitted from a lower tax rate, resulting
from a higher pre-tax profit contribution from entities with
below-average tax rates mainly in Industrial Lines and Retail
International
Shareholders‘ equity increased to €9,368m, or €37.06 per
share (FY2016: €35.91; Q1 2016: €33.75). 2016 Solvency II
ratio (excluding transitional) significantly improved by 15%pts
y/y to 186% (FY2015: 171%, Q3 2016: 160%) – expected to
have moved sideways in Q1 2017
Increased net income due to improved net underwriting result and increased profit from lower-taxed entities – improvement in Solvency II ratio (FY2016) to 186%
34 Investor Presentation July 2017

€m, net Primary Insurance Reinsurance Talanx Group
Storms/tornadoes; USA January 2017 - 11.4 11.4
Wild f ires; Chile Jan./Feb. 2017 3.0 20.8 23.9
Cyclone „Debbie“; Australia March 2017 - 50.0 50.0
Total NatCat 3.0 82.2 85.2
Transport - - -
Fire/Property 16.2 30.8 47.0
Aviation - - -
Credit - 20.6 20.6
Other - - -
Total other large losses 16.2 51.5 67.7
Total large losses 19.2 133.7 152.9
pro-rata large loss budget 72.5 170.3 242.8
Impact on Combined Ratio (incurred) 1.2%pts 6.2%pts 4.0%pts
Total large losses Q1 2016 67.1 55.5 122.5
Impact on Combined Ratio (incurred) Q1 2016 4.4%pts 2.8%pts 3.5%pts
Group Q1 2017 large loss burden of €153m was
above the level of Q1
2016 (€123m), but below
the Q1 2017 pro-rata
large loss budget of €243m
Q1 2017 net burden of
€19m in Primary and
€134m in Reinsurance – the latter due to a mix of
man-made and NatCat
large losses, including
cyclone „Debbie“ in
Australia and wild fires in Chile
Primary Insurance as well
as Reinsurance remained
well within their pro-rata large loss budgets
(Primary Insurance:
€73m; Reinsurance:
€170m)
1 Def inition „large loss“: in excess of €10m gross in either Primary Insurance or Reinsurance
Note: : Q1 2017 Primary Insurance large losses (net) are split as f ollows: Industrial Lines: €16.2m; Retail Germany : €0m; Retail International: €3.0m, Corporate Operations: €0m; since
FY2016 reporting onwards, the table includes large losses f rom Industrial Liability line, booked in the respectiv e FY. Please also note that as long as large losses of the period are within the
pro rata large loss budget, single segments book their resüectiv e large loss budgets into their P&L statements.
I Large losses1 in Q1 2017
35 Investor Presentation July 2017

28.0% 28.6% 28.1% 27.5% 27.9%
68.3% 69.0% 68.5% 65.7%
68.6%
96.3% 97.3% 96.4% 93.1%
96.3%
Q1 Q2 Q3 Q4 Q1
Combined ratios
Development of net combined ratio1 Combined ratio1 by segment/selected carrier
Expense ratio Loss ratio
1 Incl. net interest income on funds w ithheld and contract deposits 2 Incl. Magallanes Generales; merged w ith HDI Seguros S.A. on 1 April 2016
Q1 2017 combined ratios in all P/C segments below the 100% level – also Retail Germany when adjusting for KuRS costs
Q1 2017 Q1 2016 FY2016
Industrial Lines 96.5% 97.6% 96.8%
Retail Germany P/C 101.7% 103.8% 103.3%
Retail International 96.6% 96.2% 96.5%
HDI Seguros S.A., Brazil 102.0% 101.6% 102.1%
HDI Seguros S.A., Mexico 94.2% 92.0% 95.3%
HDI Seguros S.A., Chile2 97.7% 90.5% 88.7%
TUiR Warta S.A., Poland 95.6% 95.8% 96.1%
TU Europa S.A., Poland 87.1% 81.5% 83.0%
HDI Sigorta A.Ş., Turkey 102.1% 102.5% 102.5%
HDI Assicurazioni S.p.A., Italy 96.8% 96.4% 94.0%
Non-Life Reinsurance 95.6% 94.7% 93.7%
I
FY2016: 95.7%
2016 2017
36 Investor Presentation July 2017

20% 23% 24% 20% 21%
77% 75% 74% 73% 76%
98% 98% 98% 93% 97%
Q1 2016 Q2 2016 Q3 2016 Q4 2016 Q1 2017
II Segments – Industrial Lines
Improved net underwriting result and higher investment income led to increased profitability
P&L for Industrial Lines Comments
Q1 2017 GWP up by 4.3% y/y, helped by currency effects (curr.-adj.:+3.1%). Underlying growth effects from European markets like e.g. France as well as from US
underwriting. Takeover of the motor fleet business from Retail Germany P/C had an impact of ~1%pts on the Q1
2017 GWP growth rate
Slight increase in retention rate to 56.4% (Q1 2016: 55.5%), mainly due to above-average growth in lines
with generally higher retention (e.g. transport) and some higher retention rate in Liability business
Q1 2017 combined ratio improved to 96.5% (Q1 2016: 97.6%) as large losses remained within their budget. While the loss ratio was 1.4%pts down y/y at 75.9%, the
cost ratio was slightly higher (Q1 2017: 20.6% vs. Q1 2016: 20.2%), mainly due to higher project cost
Net investment result improved. This was partly due to a higher extraordinary investment result. However, also the ordinary investment result was up, helped by
improved result from investments in private equity vehicles
Insignificant reserving impact from Ogden tables
EBIT is negatively impacted by a weaker currency result in the „other result“. At the bottom line this is partly
compensated by a lower tax rate due to above-average profit contribution from lower-taxed entities
Combined ratio1
Expense ratio Loss ratio
FY2014: 103% FY2016: 97%
€m, IFRS Q1 2017 Q1 2016 Δ
Gross written premium 2,004 1,921 +4%
Net premium earned 552 537 +3%
Net underw riting result 19 13 +46%
Net investment income 69 50 +38%
Operating result (EBIT) 80 74 +8%
Group net income 59 48 +23%
Return on investment (annualised) 3.5% 2.6% +0.9%pts
1 Incl. net interest income on funds w ithheld and contract deposits
37 Investor Presentation July 2017

Segments – Retail Germany Division II
47
10 13 20
34
Comments P&L for Retail Germany
Having started with 6M 2016 reporting, the Life and P/C segments in the German Retail business report separately. In addition, we continue to show the
aggregated numbers for the Division
Q1 2017 GWP was flat y/y as the effect from a slight
top line decline in the Life segment (Q1 2017: -0.7%) is fully compensated by a 1.3% increase in P/C gross premiums
Improvement in the net underwriting result was backed by both segments: While P/C reported some
improvement of its combined ratio, the Life segment benefited from a lower RfB contribution, resulting from lower extraordinary investment gains, the latter
predominantly to finance the ZZR
Cost impact from KuRS affected the Division by a total
of ~€12m (Q1 2016: ~€10m). The impact of costs on the Q1 2017 EBIT was ~€9m (Q1 2016: ~€8m). Impact from KuRS costs on net income was ~€6m (Q1 2016:
~€5m)
EBIT impacted by higher RfB allocation due to pass-
through of tax benefits to policyholders in Life. Nevertheless, divisional tax ratio up
EBIT (€m)
FY2016: €90m
€m, IFRS Q1 2017 Q1 2016 Δ Gross written premium 1,906 1,904 +0%
of w hich Life 1,147 1,155 (1%)
of w hich Non-Life 759 749 +1%
Net premium earned 1,184 1,217 (3%)
Net underw riting result (422) (478) n/m
of w hich Life (417) (465) n/m
of w hich Non-Life (6) (13) n/m
Net investment income 460 535 (14%)
Operating result (EBIT) 34 47 (27%)
Group net income 19 29 (35%)
Return on investment (annualised) 3.7% 4.5% (0.8%)pts
Q1 2016 Q2 2016 Q3 2016 Q4 2016 Q1 2017
EBIT impacted by higher RfB allocation due to pass-through of tax benefits to Life policyholders
38 Investor Presentation July 2017

II Segments – Retail Germany P/C
Premium decline stopped: Q1 2017 GWP up y/y,
mainly due to continuing growth effects from
SMEs and self-employed professionals as well as
unemployment insurance products. In Motor,
growth contribution from digital distribution (“direct
business”) nearly compensated the effect from the
shift of the fleet business towards the Industrial
Lines segment
Better claims experience led to an improvement of
the combined ratio in Q1 2017. The latter was
impacted by ~€8m costs for KuRS programme
(Q1 2016 impact was also ~€8m). Adjusting for
KuRS, the Q1 2017 combined ratio reached
99.2% (Q1 2016: 101.6%)
Impact from ordinary investment income was
stable, while extraordinary investment result
slightly improved but without major overall impact.
As a consequence, Q1 2017 RoI improved to
2.5% (Q1 2016: 2.3%)
Overall, Q1 2017 EBIT was burdened by ~€9m
(Q1 2016: €8m) costs for KuRS; the impact of
KuRS on “other result” was limited (~€1m) as
personnel redundancy cost have been fully
booked until 2016 Expense ratio Loss ratio
FY2016: 103%
€m, IFRS Q1 2017 Q1 2016 Δ
Gross written premium 759 749 +1%
Net premium earned 340 341 (1%)
Net underw riting result (6) (13) n/m
Net investment income 25 22 +11%
Operating result (EBIT) 13 5 +137%
EBIT margin 3.8% 1.6% 2.2%pts
Investments under ow n Management 3,990 4,027 (1%)
Return on investment (annualised) 2.5% 2.3% 0.2%pts
Comments P&L for Retail Germany P/C
Top-line growth, improvement in underwriting result and slightly higher net investment income lead to improvement in EBIT
Combined ratio1
1 Incl. net interest income on funds w ithheld and contract deposits
36% 35% 34% 41% 37%
68% 71% 66% 62% 65%
104% 106% 100% 103% 102%
Q1 2016 Q2 2016 Q3 2016 Q4 2016 Q1 2017
39 Investor Presentation July 2017

II Segments – Retail Germany Life
41 31
6 13
21
Comments P&L for Retail Germany Life
Very moderate decline in GWP (Q1 2017: -0.7%
y/y) as effects from the targeted phase-out of
traditional/single-premium business were broadly
compensated by growth effects from credit life
insurance business. Some higher decline in net
premiums earned due to above-average deferred
credit life premiums related to coming quarters
~€3m cost impact from KuRS – completely
compensated in the EBIT due to policyholder
participation
Investment result is significantly lower compared
to Q1 2016. This is due to lower extraordinary
gains mainly being used to finance ZZR. Ordinary
investment result is up by roughly 4% thanks to
higher ordinary income from real estate and other
alternative investments
Q1 2017 ZZR allocation – according to HGB - of
€207m (Q1 2016: €168m). Total ZZR stock
reached €2.48bn in Q1 2017, expected to rise to
~€3.1bn until year-end 2017
EBIT impacted by higher RfB allocation due to
pass-through of tax benefits to policyholders
FY2015: 99%
€m, IFRS Q1 2017 Q1 2016 Δ
Gross written premium 1,147 1,155 (1%)
Net premium earned 844 876 (4%)
Net underw riting result (416) (465) n/m
Net investment income 435 513 (15%)
Operating result (EBIT) 21 41 (49%)
EBIT margin 2.5% 4.7% (2.2%)pts
Investments under ow n Management 45,483 44,886 +1%
Return on investment (annualised) 3.9% 4.7% (0.8%)pts
FY2016: €92m
Q1 2016 Q2 2016 Q3 2016 Q4 2016 Q1 2017
EBIT (€m)
Top-line stabilised – EBIT impacted by higher RfB allocation due to pass-through of tax benefits to policyholders
40 Investor Presentation July 2017

31% 32% 31% 31% 30%
65% 65% 67% 64% 67%
96% 97% 98% 95% 97%
Q1 2016 Q2 2016 Q3 2016 Q4 2016 Q1 2017
II Segments – Retail International
P&L for Retail International Comments
Combined ratio1
Expense ratio Loss ratio
FY2016: 97%
Q1 2017 GWP significantly up by 29% y/y also helped by tailwind from currencies in Brazil and Chile (curr.-adj.:+25.8%) and the consolidation of CBA/Italy since
Q3 2016 (GWP impact €148m). All core markets grew their top line, in local currency as well as in €-terms.
Mexico, Poland and Turkey even with significant double-digit underlying growth rates
P/C business grew by 23% in Q1 2017 y/y. Currency-adjusted, top line in P/C grew by 18.4% y/y, mainly
backed by double digit growth rates in Poland, Mexico and Turkey and a high single digit growth rate in Chile
Q1 2017 combined ratio slightly up by 0.4%pts y/y to 96.6%. Increase in loss ratio by 2%pts to 66.9% due to
higher theft rates in Brazil, higher prices for spare parts namely in Mexico and wild fires in Chile. This is widely compensated by a 1.6%pts decline in the cost ratio
predominantly due to cost optimisation measures in Poland and in Brazil
EBIT up despite an overall negative currency influence (~€1m) and the impact from wild fires in Chile (~€3m),
while additional EBIT contribution from CBA Vita was ~€2m
Turkey added €1.4m to Q1 2017 EBIT (stable vs. Q1 2016). Contribution from Chile was €83m GWP (Q1
2016: €69m) and €3.1m in terms of EBIT (€4.6m)
€m, IFRS Q1 2017 Q1 2016 Change
Gross written premium 1,483 1,148 +29%
of w hich Life 549 390 +41%
of w hich Non-Life 934 758 +23%
Net premium earned 1,217 986 +23%
Net underw riting result 7 8 (13%)
of w hich Life (18) (16) n/m
of w hich Non-Life 25 24 +4%
Net investment income 87 80 +9%
Operating result (EBIT) 63 61 +3%
Group net income 40 36 +11%
Return on investment (annualised) 3.7% 4.0% (0.3%)pts
First quarter 2017 showed strong top-line growth and slight improvement in EBIT
1 Incl. net interest income on funds w ithheld and contract deposits
41 Investor Presentation July 2017

413 342
445 501 401
P&L for Reinsurance Comments
The Division Reinsurance combines the two
segments P/C Reinsurance and Life/Health Reinsurance. Since the FY2016 reporting we
additionally show the aggregated numbers for
the Reinsurance Division
Q1 2017 GWP up by 6.6% y/y; adjusted for
currency effects: +5.9%. Net premium is up by 5.4% on a reported basis and grew by
4.3% on a currency-adjusted basis
RoI slightly up by 0.1%pts y/y to 3.1% in Q1 2017; ordinary investment income higher
mainly due to private equity and real estate investments
Good EBIT net income driven by strong
investment performance and favourable P/C underwriting result.
Q1 2017 EBIT margin1 of 10.7% (Q1 2016: 11.7%)
1 EBIT margin reflects a Talanx Group view;
Note: Differences between figures from Reinsurance Division and Hannover Re reporting may occor due to different recognition of common private equity investments. At Talanx,
they are fully consolidated due to Hannover Re‘s majority stakes.
Favourable start into 2017, in line with targets
€m, IFRS Q1 2017 Q1 2016 Change
Gross w ritten premium 4,547 4,263 7%
Net premium earned 3,733 3,542 5%
Net underwriting result (23) 32 n/m
Net investment income 398 370 8%
Operating result (EBIT) 401 413 (3%)
Group net income 132 142 (7%)
Return on investment 3.1% 3.0% 0.1%pts
II Segments – Reinsurance Division
Q1 2016 Q2 2016 Q3 2016 Q4 2016 Q1 2017
EBIT (€m)
FY2016: €1,701
42 Investor Presentation July 2017

Net investment income Talanx Group Comments
Ordinary investment income up, also driven by distributions in real estate and other alternative
investments
Realised investment net gains about ~€80m
lower y/y to €137m in Q1 2017, as increased ZZR is partly financed by extraordinary operating gains. Q1 2017 ZZR allocation:
€207m vs. Q1 2016: €168m; under German GAAP only)
Investment writedowns lower compared to Q1 2016, remaining on a very moderate level
Q1 2017 RoI at 3.5% - slightly lower compared to the previous year (Q1 2016: 3.7%) and predominantly due to lower realised gains on
investments. Well on track to reach FY2017 outlook of “at least 3.0%“
Impact from ModCo derivatives was limited at €1m in Q1 2017 vs. Q1 2016: -€1m. There is no impact from inflation swaps anymore as these
have been terminated already FY2015
Q1 2017 RoI of 3.5% at sufficient level - well on track to reach FY2017 Outlook of “at least 3.0%”
€m, IFRS Q1 2017 Q1 2016 Change
Ordinary investment income 867 783 +11%
thereof current investment income from
interest 705 690 +2%
thereof profit/loss from shares in associated
companies 5 2 +218%
Realised net gains/losses on investments 137 221 (38%)
Write-ups/write-downs on investments (32) (40) n/m
Unrealised net gains/losses on investments 24 31 (21%)
Investment expenses (54) (55) n/m
Income from investments under own
management 943 941 +0%
Income from investment contracts (1) 2 n/m
Interest income on funds withheld and
contract deposits 69 79 (13%)
Total 1,011 1,022 (1%)
III Net investment income
43 Investor Presentation July 2017

Capital breakdown (€bn)
Compared to the end of FY2016, shareholders’
equity increased by €290m to €9,368m at the
end of Q1 2017, predominantly driven by the
contribution from net income (€238m). Limited
effect on OCI from the change in currency
effects, but also from interest rates
Book value per share stood at €37.06
compared to €35.91 in FY2016 and €33.75 in
Q1 2016. NAV per share was €32.86 (FY2016:
€31.80; Q1 2016: 29.64)
Neither book value per share nor NAV contain
off-balance sheet reserves. These amounted
to €382m (see next page), or €1.51 per share
(shareholder share only). This would add up to
an adjusted book value of €38.57 per share
and an adjusted NAV (excluding goodwill) of
€34.37
Shareholders‘ equity Minorities Subordinated liabilities
Comments
Shareholders’ equity up by €290m compared to end of FY2016
III Equity and capitalisation – Our equity base
8.5 8.7 9.0 9.1 9.4
5.3 5.3 5.5 5.6 5.8
1.9 2.0 2.0 2.0
2.0 15.8 16.0
16.5 16.7
31 Mar 16 30 June 16 30 Sep 16 31 Dec 16 31 Mar 17
17.1
44 Investor Presentation July 2017

4,604
46 338 108 (201) (158)
4,737
3,806
526
4,332
9,069
Loans andreceivables
Held tomaturity
Investmentproperty
Real estateown use
Subordinatedloans
Notespayable and
loans
Off balancesheet
reserves
Available forsale
Other assets On balancesheet
reserves
Totalunrealised
gains (losses)
Δ market value vs. book value
31 Dec 16 4,928 333 47 104 (296) 4,948 4,191 528 4,718 9,666 (168)
Off-balance sheet reserves of ~€4.7bn – €382m (€1.51 per share) attributable to shareholders (net of policyholders, taxes & minorities)
Unrealised gains and losses (off and on balance sheet) as of 31 March 2017 (€m)
Note: Shareholder contribution estimated based on FY2015 profit sharing pattern
III Equity and capitalisation – Unrealised gains
45 Investor Presentation July 2017

9,078
238
52
9,368
Comments
At the end of Q1 2017,
shareholders’ equity stood at €9,368m, or €37.06 per share
This was €290m above the level at
the end of FY2016 (€9,078m or
€35.91 per share), predominantly driven by the Q1 2017 Group net
income
At the end of FY2016, the Solvency II Ratio (Solvency II
view, HDI Group level) stood at
186% (FY2015: 171%; Q3 2016: 160%)
Based on Basic Own Funds, so
taking the full internal model into account, Talanx’s capitalisation
was 264% (FY2015: 253%; Q3 2016: 239%) – all numbers before
transitional
Net income after
minorities
Other comprehensive
income
31 March 2017
Shareholders’ equity up to €9,368m, or €37.06 per share (FY2016: €9,078m)
In €m
31 Dec 2016
III Equity and capitalisation – Contribution to change in equity
46 Investor Presentation July 2017

1.9
0.8 0.7 0.9
2.0
0.7
0.2 0.3 0.2
0.8
1.2
1.2 1.1 1.3
1.1
1.1
1.3 1.2 1.2
1.5
2.5
2.1 2.5 2.1
2.8
1.8
1.9 1.7 1.8
1.7
(0.2) (0.2) (0.1) (0.2) (0.2)
Q1 Q2 Q3 Q4 Q1
GWP development (€bn)
Q1 2017 GWP were significantly up (+8.4%), somewhat helped by currency effects (curr.-adj.: +7.4%)
Retail International and Industrial Lines were the main drivers of growth
Retail International helped by consolidation effect from CBA/Italy (from 30 June 2016), explaining ~50% of the segment‘s GWP growth
Overall, seasonal pattern remains intact
2017
Q1 2017 GWP significantly up due to strong contribution from Retail International and Industrial Lines
Comments
A Q1 2017 Additional Information – GWP trend
9.0
7.4 7.3 7.4
9.8
Industrial Lines
Reinsurance P/C
Retail Germany P/C
Life/Health Reinsurance
Retail Germany Life
Corporate Functions and Consolidation
Retail International
2016
47 Investor Presentation July 2017

P/C Insurance
Life Insurance
New Segmentation in Retail Germany
Industrial Lines
Retail Germany Reinsurance
Retail International
Divisions
P/C Reinsu-rance
Operating
Segments
Life/Health Reinsu-rance
The responsibilities within the Retail Germany Division have been separated between “Life“ and
“Property/Casualty“. As a consequence, applying IFRS 8, both segments report separate P&Ls
(incl. EBIT) since the 6M 2016 reporting1
In addition, Talanx continues to show the former segment “Retail Germany“ as the aggregated division
Talanx insurance activities are now subdivided into six, rather than the previous five reportable segments
Retail International continues to act as one single segment including life and non-life activities.
To further raise transparency, Talanx has started to show regional P&Ls (incl. EBIT) in the status report
1 The (very limited) effects of the interaction betw een the tw o new segments in the “Retail Germany“ division are now eliminated in the Group‘s consolidation line.
Under the former segmentation, interaction betw een “Life“ and “Non-Life“ business has been eliminated w ithin “Retail Germany“.
A
48 Investor Presentation July 2017

€m, IFRS Q1 2017 Q1 2016 Change
P&L
Gross written premium 2,004 1,921 +4%
Net premium earned 552 537 +3%
Net underwriting result 19 13 +43%
Net investment income 69 50 +39%
Operating result (EBIT) 80 74 +9%
Net income after minorities 59 48 +23%
Key ratios
Combined ratio non-life
insurance and reinsurance 96.5% 97.6% (1.0%)pts
Return on investment 3.5% 2.6% 0.9%pts
Industrial Lines
Q1 2017 Q1 2016 Change
759 749 +1%
340 342 (1%)
(6) (13) n/m
24 22 +11%
13 5 +137%
n/a n/a n/a
101.7% 103.8% (2.1%)pts
2.5% 2.3% 0.2%pts
Q1 2017 Q1 2016 Change
1,147 1,155 (1%)
844 876 (4%)
(416) (465) n/m
435 513 (15%)
21 41 (49%)
n/a n/a n/a
- - -
3.9% 4.7% (0.8%)pts
Retail Germany P/C Retail Germany Life
Q1 2017 Additional Information – Segments A
49 Investor Presentation July 2017

€m, IFRS Q1 2017 Q1 2016 Change
P&L
Gross written premium 1,484 1,148 +29%
Net premium earned 1,217 986 +23%
Net underwriting result 7 8 (13%)
Net investment income 87 80 +9%
Operating result (EBIT) 63 61 +3%
Net income after minorities 40 36 +11%
Key ratios
Combined ratio non-life
insurance and reinsurance 96.6% 96.2% 0.4%pts
Return on investment 3.7% 4.0% (0.3%)pts
Q1 2017 Q1 2016 Change
2,815 2,502 +13%
2,166 1,961 +10%
91 100 (9%)
250 213 +17%
315 310 +2%
n/a n/a n/a
95.6% 94.7% 0.9%pts
3.0% 2.8% 0.2%pts
Q1 2017 Q1 2016 Change
1,732 1,761 (2%)
1,567 1,581 (1%)
(114) (68) n/m
148 157 (6%)
86 103 (17%)
n/a n/a n/a
--- --- ---
3.6% 3.6% 0.0%pts
Retail
International P/C Reinsurance
Life and Health
Reinsurance
Q1 2017 Q1 2016 Change
9,752 8,995 +8%
6,692 6,266 +7%
(415) (422) n/m
1,011 1,022 (1%)
576 573 +1%
238 222 +7%
96.3% 96.3% 0.0%pts
3.5% 3.7% (0.2%)pts
Group
Q1 2017 Additional Information – Segments (continued) A
50 Investor Presentation July 2017

Retail Germany Retail International
GWP, €m, IFRS Q1 2017 Q1 2016 Change
Non-life Insurance 759 749 +1%
HDI Versicherung AG 709 712 (0%)
Life Insurance 1,147 1,155 (1%)
HDI Lebensversicherung AG 454 473 (4%)
neue leben Lebensversicherung AG1 188 206 (9%)
TARGO Lebensversicherung AG 308 248 +24%
PB Lebensversicherung AG 161 188 (14%)
Total 1,906 1,904 +0%
GWP, €m, IFRS Q1 2017 Q1 2016 Change
Non-life Insurance 934 758 +23%
HDI Seguros S.A., Brazil 223 172 +30%
TUiR Warta S.A.2, Poland 296 220 +35%
TU Europa S.A.3, Poland 21 28 (25%)
HDI Assicurazioni S. p. A., Italy (P&C) 89 84 +6%
HDI Seguros S.A. De C.V., Mexico 76 57 +33%
HDI Sigorta A.Ş., Turkey 81 69 +17%
HDI Seguros S.A., Chile4 83 69 +20%
Life Insurance 549 390 +41%
TU Warta Zycie S.A., Poland2 47 40 +18%
TU Europa Zycie, Poland3 78 32 +144%
HDI Assicurazioni S. p. A., Italy (Life) 185 222 (17%)
Total 1,483 1,148 +29%
1 Talanx ow nership 67.5% 2 Talanx ow nership of 75.74% 3 Talanx ow nership 50% + 1 share 4 incl. Magallanes Generales; merged w ith HDI Seguros S.A. from 1 April 2016
A Q1 2017 Additional Information – GWP of main risk carriers
51 Investor Presentation July 2017

907
~25
~55
~(85)
~(35) ~(10)
(26) ~(25)
~800
FY2016
Outlook for Talanx Group FY 2017 – Expected change factors
in Group net income
Change in net income from Reinsurance1
Currency result in Primary
Insurance2
C-Quadrat disposal
Expected operating inprovement in Primary Insurance (incl. KuRS effects) likely to be overcompensated by lower investment result and guided profit decline in Reinsurance
FY2017E
in €m
Investment result in Primary
insurance
Operating performance &
other
1 According to Hannover Re guidance (after Talanx’s minorities)
2 In case of neutral currency result booked in “other result”
A
Result improvement
KuRS
Full utilisation of large loss
budget in
Primary Insurance
52 Investor Presentation July 2017

53
Cumulative costs for
KuRS in P/C are expected
to account for ~€230m
More than half of all
project costs are expected
to have been booked until
end-2016
The expected costs for
personnel redundancies
have been covered until
mid-2016
In 2017, the KuRS
programme savings are
likely to exceed costs on
EBIT level for the first time
From 2017 onwards, the
improvement in EBIT is
expected to visibly
progress year by year
~€230m
~€140m Cost reduction1
Investment
2020E 2019E 2018E 2017E 2016 2015
2021E
Investment & personnel redundancies
Cost reduction
in €m
EBIT impact -15 -15 ~28 ~50 ~80 ~120 ~138
~140
~-15
39
63 ~70
~80
~96
~126
-54
-78
~-42 ~-30 ~-5 ~-2
Retail Germany – KuRS programme:
Investment and cost reduction targets P/C
Comments Estimated project costs and savings in P/C
From 2017 onwards, the EBIT contribution of KuRS is expected to be positive
1 Cost reduction before Inflation
A
Investor Presentation July 2017

€47m
€78m
€185m
€229m €539m
(€375m)
Warta, (Poland)
TU Europa,
(Poland)
HDI Italy
HDI Turkey 102.5%; €1m
96.4%; €10m
81.5%;
95.8%; €20m
102.1%; €1m
96.8%; €9m
87.1%;
95.6%; €25m
P&L for Retail International Europe
Strong top-line improvement due to growth effects mainly from Poland – EBIT flat
GWP split by carriers (P/C)
GWP split by carriers (Life) Combined ratio and EBIT1 by selected carrier
€296m
€21m
€93m
€81m
€34m
€525m (€441m)
Warta (Poland)
TU Europa (Poland)
HDI Italy
HDI Turkey
Other
Warta Life
(Poland)
TU Europa Life (Poland)
HDI Italy
Other
Q1 2017 Q1 2016 1 EBIT number includes Life and Non-Life operations
€5m
€6m
(€36m)
(€220m)
(€69m)
(€88m)
(€28m)
(€222m)
(€32m)
(€40m)
(€81m)
A Q1 2017 Additional Information –
Retail International Europe: Key financials
€m, IFRS Q1 2017 Q1 2016 Δ
Gross written premium 1,064 817 +30%
Net premium earned 856 685 +25%
Net underw riting result (1) 1 n/m
Net investment income 60 60 +1%
Operating result (EBIT) 47 47 +1%
54 Investor Presentation July 2017

Q1 2017 Q1 2017
89.3%; €5m
92.0%; €3m
101.6%; €8m
94.9%; €4m
94.2%; €3m
102.0%; €8m
P&L for Retail International LatAm
Improving top-line momentum – EBIT negatively impacted by wild fires in Chile
€m, IFRS Q1 2017 Q1 2016 Δ
Gross written premium 414 325 +28%
Net premium earned 361 301 +20%
Net underw riting result 2 7 (77%)
Net investment income 28 21 +30%
Operating result (EBIT) 15 16 (11%)
GWP split by carriers (P/C)
GWP split by carriers (Life) Combined ratio and EBIT1 by selected carrier
€1m
€4m
€5m (€8m)
HDI Argentina HDI Chile Life
1 EBIT number includes Life and Non-Life operations
HDI Brazil
HDI Mexico
HDI Chile
HDI Brazil HDI Mexico
HDI Chile
Other
€223m
€76m
€83m
€27m
€409m (€317m)
(€19m)
(€172m)
(€57m)
(€69m)
(€5m)
(€2m)
A Q1 2017 Additional Information –
Retail International LatAm: Key financials
55 Investor Presentation July 2017

Turkey
Poland
GWP growth (local currency)
Combined ratio
EBIT (€)
GWP growth (local currency)
o/w Life
o/w Non-Life
Combined ratio2
EBIT (€)
o/w Life
o/w Non-Life
(0.1%)pts
10.3%
(0.4%)pts
(2.1%)
11.8%
10.2%
+38.3%
95.6%
29.7m
2.7m
27.1m
+72.7%
+28.2%
Brazil
GWP growth (local currency)
Combined ratio
EBIT (€)
+0.3%pts
(0.5%)
+1.4%
102.0%
7.5m
+40.5%
102.1%
1.4m
Most of our core markets in Retail International with significant business growth
Mexico
GWP growth (local currency)
Combined ratio
EBIT (€)
+2.2%pts
0.9%
+46.4%
94.2%
2.6m
Chile1
GWP growth (local currency)
Combined ratio
EBIT (€)
7.2%pts
(26.6)%
+10.5%
97.7%
4.1m
1 Includes all entities of HDI Chile Group operating in the Chilean market; Magallanes integrated in February 2015, Combined ratio for HDI Chile only
2 Combined ratio for Warta only
Retail International – Core Markets: Q1 2017 overview A
56 Investor Presentation July 2017

28% 28% 27% 26% 28%
67% 69% 68% 64% 68%
95% 96% 94% 90% 96%
Q1 2016 Q2 2016 Q3 2016 Q4 2016 Q1 2017
Combined ratio1
P&L for P/C Reinsurance Comments
Q1 2017 GWP up by 12.5% y/y (adjusted
for currency effects: +11.3%); growth
mainly from Structured Reinsurance;
diversified growth in Property Lines
Net premium earned grew by +10.5%
(curr.-adj.: +8.8%)
Major losses of €134m below budget of
€170m for Q1 2017 (6.2% of NPE);
reserve increase due to Ogden tables of
€126m, compensated by corresponding
reserve releases
Strong ordinary investment income driven
by private equity and real estate
investments
Other result mainly impacted by negative
currency effects
Q1 2017 EBIT margin2 of 14.6% (Q1
2016: 15.8%) well above target
1Incl. net interest income on funds w ithheld and contract deposits 2 EBIT margins reflect a Talanx Group view
Expense ratio Loss ratio
FY2016: 94%
Attractive premium growth mainly driven by Structured Reinsurance
€m, IFRS Q1 2017 Q1 2016 Change
Gross w ritten premium 2,815 2,502 +13%
Net premium earned 2,166 1,961 +10%
Net underwriting result 91 100 (9%)
Net investment income 250 213 +17%
Operating result (EBIT) 315 311 +2%
Return on investment 3.0% 2.8% +0.2%pts
A Segments – P/C Reinsurance
57 Investor Presentation July 2017

P&L for Life/Health Reinsurance Comments
Q1 2017 GWP -1.6% y/y, adjusted for
currency effects also -1.7% y/y; reduced
premium volume from large-volume
treaties, partly offset by diversified growth
in other areas
Net premium earned down -0.9% y/y
(curr.-adj.: -1.3%)
Technical result impacted by legacy US
mortality business
Investment income in line with
expectations
Other result increased due to strong
contribution from deposit accounted
treaties (Q1 2017: €47m)
Q1 2017 EBIT margin1 of 5.5% (Q1 2016:
6.5%) for the segment
EBIT (€m)
1 EBIT margin reflects a Talanx Group view
FY2016: €330m
Strong earnings contribution from Financial Solutions
€m, IFRS Q1 2017 Q1 2016 Change
Gross w ritten premium 1,732 1,761 (2%)
Net premium earned 1,567 1,581 (1%)
Net underwriting result (114) (68) n/m
Net investment income 148 157 (6%)
Operating result (EBIT) 86 103 (17%)
Return on investment 3.6% 3.6% (0.0%)pts
A Segments – Life/Health Reinsurance
103 71
108
49 86
Q1 2016 Q2 2016 Q3 2016 Q4 2016 Q1 2017
58 Investor Presentation July 2017

A Q1 2017 Additional Information – Breakdown of investment
portfolio
43%
31%
25%
1%
Other
Covered bonds
Corporate bonds
Government bonds
41%
20%
15%
24%
33%
67%
Euro
Non-Euro
Total: €107.8bn
89%
2%
9%
Other
Equities
Fixed incomesecurities
Fixed-income-portfolio split Comments
Investments under own
management are slightly up to €107.8bn vs FY2016 (€107.2bn;
Q1 2016: €101.9bn). This
includes the €1.1bn from acquired CBA Vita/Italy
(consolidation as of 30 June 2016)
Investment portfolio remains
dominated by fixed-income securities: portfolio share of
89% at the end of Q1 2017 (FY2016: 90%; Q1 2016: 90%)
Share of fixed-income portfolio
invested in “A” or higher-rated bonds unchanged vs. FY 2016
– and broadly stable over recent quarters (FY2016: 76%; Q1
2016: 78%)
20% of “investments under own management” held in USD, 33%
overall in non-euro currencies (FY2016: 33%)
Investment portfolio as of 31 Mar 2017
Breakdown
by rating
Breakdown
by type
Total: €96.3bn
Asset
allocation
Currency
split
BBB and below
A
AA
AAA
Investment strategy unchanged – portfolio dominated by strongly rated fixed-income securities
59 Investor Presentation July 2017

Country Rating Sovereign Semi-
Sovereign Financial Corporate Covered Other Total
Italy BBB 2,296 - 630 668 401 - 3,996
Spain BBB+ 738 417 277 450 276 - 2,158
Brazil BB 230 - 96 408 - 8 741
Mexico BBB+ 122 5 39 240 - - 406
Hungary BBB- 425 - - 9 20 - 454
Russia BB+ 176 13 82 189 - - 460
South Africa BBB- 172 9 12 50 - 6 249
Portugal BB+ 41 - 4 74 10 - 128
Turkey BB+ 18 - 25 15 3 - 60
Greece CCC - - - - - - -
Other BBB+ 13 - 33 57 - - 103
Other BBB 82 38 49 63 - - 231
Other <BBB 193 19 102 197 - 245 756
Total 4,506 502 1,348 2,418 710 259 9,743
In % of total investments under ow n
management 4.2% 0.5% 1.3% 2.2% 0.7% 0.2% 9.0%
In % of total Group assets 2.8% 0.3% 0.8% 1.5% 0.4% 0.2% 6.1%
1 Investment under ow n management
Investments into issuers from countries with a rating below A-1 (in €m)
A Q1 2017 Additional Information – Details on selected fixed-
income country exposure
60 Investor Presentation July 2017

FY2016 Solvency II Ratio (excluding transitional) improved to 186% (FY2015: 171%) and is expected to have moved sideways in Q1 2017
Stresses on interest rates, NatCat and equities with little impact on Solvency II Ratio - somewhat higher degree of sensitivity on credit spreads
More than 90% of Own Funds in the Solvency II View reflect unrestricted Tier 1 capital. Tier 1 coverage of SCR has further improved and stands at a strong 173%
Risk Management 2016 - Essentials A
61 Investor Presentation July 2017

Solvency II Ratio materially improved despite the low-interest environment
Comments
Eligible Own Funds, i.e. Basic Own Funds
(including hybrids and surplus funds as well as
minority interests) with haircut on Talanx‘s
minority holdings
Compared to the Economic View (BOF CAR),
the higher level of the SCR reflects the
measurement of operational risks by means of
the standard formula
Improvement of Solvency II Ratio was driven by
a strong increase of Eligible Own Funds mainly
driven by retained earnings and by lower credit
spreads
Eligible Own Funds (€bn)
Solvency Capital Required (€bn)
Solvency II Ratio
A TERM 2016 - Result History (Solvency II View)
13.4 13.1 13.6 13.3 15.5
2015 Q1 2016 6M 2016 9M 2016 2016
7.8 7.9 7.9 8.3 8.3
2015 Q1 2016 6M 2016 9M 2016 2016
171% 166% 172% 160%
186%
2015 Q1 2016 6M 2016 9M 2016 2016
62 Investor Presentation July 2017

Capital Adequacy Ratio is up by 11%pts year-on-year
Comments
Basic Own Funds (including hybrids and
surplus funds as well as non-controlling
interests)
The respective CAR (99.5% confidence level)
stands at a comfortable 264%
This concept is used for risk budgeting and
steering at Talanx as it best reflects the
economic capital position of the Group
Higher Basic Own Funds overcompensate a
slightly increased SCR which has proven very
stable over the entire period
Basic Own Funds (€bn)
Solvency Capital Required (€bn)
Capital Adequacy Ratio (CAR)
A TERM 2016 - Result History (Economic View,
based on Basic Own Funds)
18.0 17.7 18.3 17.6 19.6
2015 Q1 2016 6M 2015 9M 2016 2016
7.1 7.2 7.0 7.4 7.4
2015 Q1 2016 6M 2015 9M 2016 2016
253% 245% 262%
239% 264%
2015 Q1 2016 6M 2015 9M 2016 2016
63 Investor Presentation July 2017

A TERM 2016 – Analysis of Change
(Economic View)
18.0 18.1 19.6
0.1 1.5
2015 Model ChangeEffect
2015after Model
Change
EconomicEffect
2016
253% 261% 264%
8% 3%
2015 Model ChangeEffect
2015after Model
Change
EconomicEffect
2016
Interest rate volatility
calibration
Reinsurance default model
Basic Own Funds (€bn)
Solvency Capital Required (€bn)
Capital Adequacy Ratio (CAR)
Model Change Effect Economic Effect
Increase in IFRS equity
driven by retained earnings, spread and currency movements Interest rate development Allowance on intercompany
effects in asset cost and reinsurance recoverable
More conservative mgmt. assumptions in Life
Model Change Effect Economic Effect
Higher exposures, i.e. higher
rate, credit, equity and foreign exchange rate risk
Increase of natural catastrophic risk due to larger capacities in Reinsurance
÷
=
7.1 6.9 7.4
(0.2) 0.5
2015 Model ChangeEffect
2015after Model
Change
EconomicEffect
2016
detrimental impact moderately negative impact
favourable impact
Model robustness has materially improved
Interest rate calibration
Reinsurance default model
64 Investor Presentation July 2017

Significant diversification between risk categories – market risk remains below 50% threshold
Risk components of Talanx Group1 (€bn)
1 Figures show risk categorisation of the Talanx Group including non-controlling interests. Solvency capital requirement determined according to 99.5% security
level for the Economic View , based on Basic Ow n Funds (BOF)
A Solvency capital requirement split into
components M
ark
et
risk
non-l
ife and
rein
sura
nce
Mark
et
risk
pri
mary
life
Pensio
n ri
sk
Counte
rpart
y defa
ult ri
sk
Pre
miu
m and
reserv
e ri
sk
non-l
ife (e
xcl.
NatC
at)
NatC
at
risk
Underw
riting
ri
sk
life
Opera
tional
risk
LA
C o
f D
T
non-l
ife and
rein
sura
nce
Tota
l undiv
ers
ifie
d
com
ponte
nts
Div
ers
ific
ation
Tota
l ri
sk
Tota
l m
ark
et
risk
after
div
ers
ific
ation
Non-l
ife r
isk
after
div
ers
ific
ation
Tota
l ri
sk
befo
re ta
x
and befo
re
div
ers
ific
ation
5.2
1.9
100%
0.3
0.8
6.6
0.3
2.1
4.1
2.7
3.5 16.8
0.8
2.1
0.5
2.3
0.8
7.4
15.2
1.5
2.1
5.0
47%
Diversif ication
effects
29%
17%
65 Investor Presentation July 2017

Economic View
Terminology Talanx level HDI level
BOF CAR =
19,569 / 7,406 = 264%
(BOF/SCRBOF)
in €m
Figures according to Talanx’s standardised terminology
SII Ratio =
15,547 / 8,346 = 186%
Solvency II View
FCIIF – Financial Credit Institutions and Inv estmend Firms
IORP – Insitutions f or Occupational Retirement Prov isions
A
TERM 2016 – From IFRS equity to
Eligible Own Funds
HDI V.a.G 1,257
Basic own funds HDI before deductions (BOF) 20,826
Total of non-available own fund items -5,370
Other -17
Ancillary own funds 0
Own funds for FCIIF, IORP and entities included 109
Total available own funds (AOF) 15,547
Effects from tiering 0
Total eligible own funds (EOF) 15,547
IFRS total equity 14,688
Goodwill & Intangible assets -1,938
Valutaion adjustments (Goodwill & Intangible assets) 3,729
Surplus funds (before minorities) 1,603
= Excess of assets over liabilities (EAoL) 18,082
Subordinated liabilitites (before minorities) 2,208
Own shares 0
Foreseeable dividends & distribution -722
= Basic Own Funds (Talanx) excluding Transitional measure 19,569
66 Investor Presentation July 2017

91%
2% 7%
Own funds composition
Unrestricted Tier 1
Restricted Tier 1
Tier 2
Solvency II Ratio 186%
of which
Tier 1 coverage 173%pts
Tier 2 coverage 13%pts
Capital tiering
Very high share of unrestricted Tier 1 capital in Solvency II Ratio
Comments
The capital tiering reflects the
composition of Own Funds
under the Solvency II
Perspective
91% of Own Funds consist of
unrestricted Tier 1. The overall
Tier 1 coverage stands at
173%. The tiering of Talanx
compares well with sector
peers
Tier 2 mainly consists of
subordinated bonds issued by
Reinsurance respectively
Talanx Finance
A TERM 2016 – Solvency II Perspective - Tiering
67 Investor Presentation July 2017

A TERM 2016 – Sensitivities of Solvency II Ratio
15.5
8.3
186%
Eligible Own Funds
SCRSII
Solvency II Perspective Estimation of stress impact1
1 Estimated solvency ratio changes in case of stress scenarios (stress applied on both Eligible Ow n Funds and capital requirement, approximation for loss absorbing
capacity of deferred taxes)
2 The credit spreads are calculated as spreads over the sw ap curve (credit spread stresses inculde stress on government bonds) 3 Interest rate stresses based on non-parallel shifts of the interest rate curve based on EIOPA approach
3
3
2
Stresses on interest rates, NatCat and equities with little impact on Solvency II Ratio – somewhat higher degree of sensitivity on credit spreads
191%
178%
147%
180%
191%
183%
186%
Interest rate +50 bps
Interest rate -50 bps
Credit spread +100 bps
NatCat event (1-in-200-years)
Equity markets +30%
Equity markets -30%
Ratio as of 31.12.201531.12.2016 in €bn
68 Investor Presentation July 2017

186%
264%
50%
100%
150%
200%
250%
300%
Solvency II View Economic View
Target capitalisation
245%
For the Solvency II
Perspective, Talanx
defines a target corridor of
150 to 200%
For the Economic View, a
minimum target of 200% is
set
The latter reflects the
concept that is used for
risk budgeting and steering
at Talanx as it best reflects
the economic capital
position of the Group
target corridor
limit ≥ 200%
Comments
A Solvency II Update – Target capitalisation levels
Solvency II Ratio moves towards the upper end of the target corridor
69 Investor Presentation July 2017

This presentation contains forward-looking statements which are based on certain assumptions, expectations and opinions of the
management of Talanx AG (the "Company") or cited from third-party sources. These statements are, therefore, subject to certain known
or unknown risks and uncertainties. A variety of factors, many of which are beyond the Company’s control, affect the Company’s
business activities, business strategy, results, performance and achievements. Should one or more of these factors or risks or
uncertainties materialize, actual results, performance or achievements of the Company may vary materially from those expressed or
implied as being expected, anticipated, intended, planned, believed, sought, estimated or projected.in the relevant forward-looking
statement.
The Company does not guarantee that the assumptions underlying such forward-looking statements are free from errors nor does the
Company accept any responsibility for the actual occurrence of the forecasted developments. The Company neither intends, nor
assumes any obligation, to update or revise these forward-looking statements in light of developments which differ from those
anticipated.
Where any information and statistics are quoted from any external source, such information or statistics should not be interpreted as
having been adopted or endorsed by the Company as being accurate. Presentations of the company usually contain supplemental
financial measures (e.g., return on investment, return on equity, gross/net combined ratios, solvency ratios) which the Company
believes to be useful performance measures but which are not recognised as measures under International Financial Reporting
Standards, as adopted by the European Union ("IFRS"). Therefore, such measures should be viewed as supplemental to, but not as
substitute for, balance sheet, statement of income or cash flow statement data determined in accordance with IFRS. Since not all
companies define such measures in the same way, the respective measures may not be comparable to similarly -titled measures used
by other companies. This presentation is dated as of 7 July 2017. Neither the delivery of this presentation nor any further discussions of
the Company with any of the recipients shall, under any circumstances, create any implication that there has been no change i n the
affairs of the Company since such date. This material is being delivered in conjunction with an oral presentation by the Company and
should not be taken out of context.
Guideline on Alternative Performance Measures - For further information on the calculation and definition of specific Alternative
Performance Measures please refer to the Annual Report 2016 Chapter “Enterprise management”, pp. 23 and the following, the
“Glossary and definition of key figures” on page 256 as well as our homepage http://www.talanx.com/investor-
relations/ueberblick/midterm-targets/definitions_apm.aspx
Disclaimer
70 Investor Presentation July 2017