investor presentation · pdf fileiso 9001:2015 certified cops and cpc iso 9001:2015 customer...
TRANSCRIPT

Investor PresentationJanuary 2018
This presentation and the accompanying slides (the “Presentation”), which have been prepared by PNB Housing
Finance Ltd (the “Company”), have been prepared solely for information purposes and do not constitute any offer,
recommendation or invitation to purchase or subscribe for any securities, and shall not form the basis or be relied on in
connection with any contract or binding commitment what so ever. No offering of securities of the Company will be
made except by means of a statutory offering document containing detailed information about the Company.
This Presentation has been prepared by the Company based on information and data which the Company considers
reliable, but the Company makes no representation or warranty, express or implied, whatsoever, and no reliance shall
be placed on, the truth, accuracy, completeness, fairness and reasonableness of the contents of this Presentation. This
Presentation may not be all inclusive and may not contain all of the information that you may consider material. Any
liability in respect of the contents of, or any omission from, this Presentation is expressly excluded.
Certain matters discussed in this Presentation may contain statements regarding the Company’s market opportunity
and business prospects that are individually and collectively forward-looking statements. Such forward-looking
statements are not guarantees of future performance and are subject to known and unknown risks, uncertainties and
assumptions that are difficult to predict. These risks and uncertainties include, but are not limited to, the performance of
the Indian economy and of the economies of various international markets, the performance of the industry in India and
world-wide, competition, the company’s ability to successfully implement its strategy, the Company’s future levels of
growth and expansion, technological implementation, changes and advancements, changes in revenue, income or cash
flows, the Company’s market preferences and its exposure to market risks, as well as other risks. The Company’s
actual results, levels of activity, performance or achievements could differ materially and adversely from results
expressed in or implied by this Presentation. The Company assumes no obligation to update any forward-looking
information contained in this Presentation. Any forward-looking statements and projections made by third parties
included in this Presentation are not adopted by the Company and the Company is not responsible for such third party
statements and projections.
Safe Harbor
2

About PNB Housing Finance
3
4
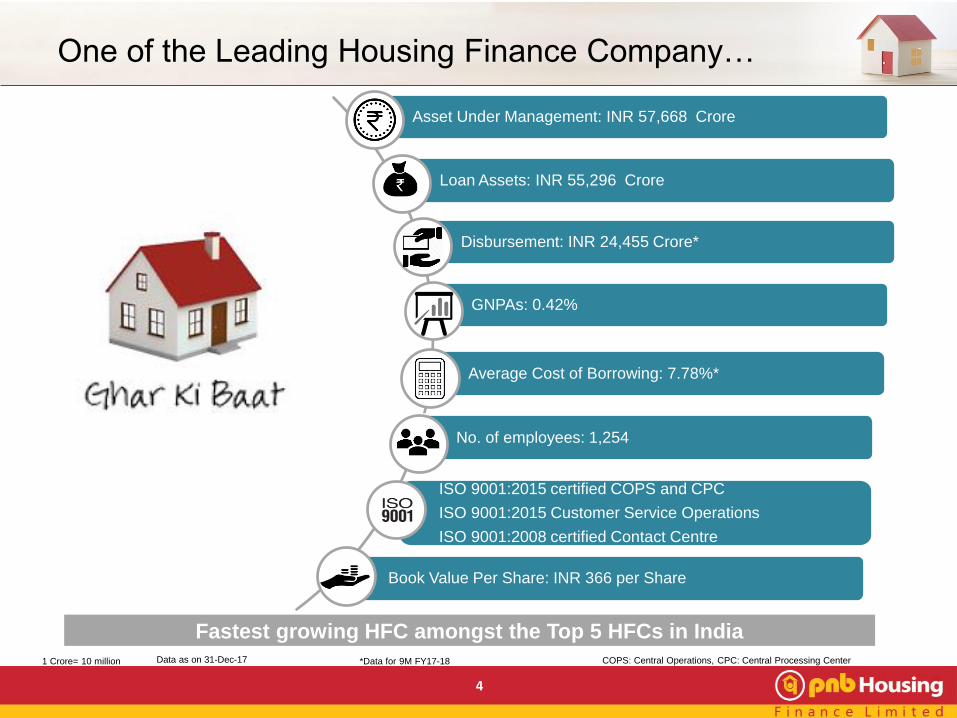
Disbursement: INR 24,455 Crore*
GNPAs: 0.42%
Fastest growing HFC amongst the Top 5 HFCs in India
*Data for 9M FY17-18
No. of employees: 1,254
One of the Leading Housing Finance Company…
ISO 9001:2015 certified COPS and CPC
ISO 9001:2015 Customer Service Operations
ISO 9001:2008 certified Contact Centre
Book Value Per Share: INR 366 per Share
Average Cost of Borrowing: 7.78%*
Loan Assets: INR 55,296 Crore
COPS: Central Operations, CPC: Central Processing Center1 Crore= 10 million Data as on 31-Dec-17
Asset Under Management: INR 57,668 Crore
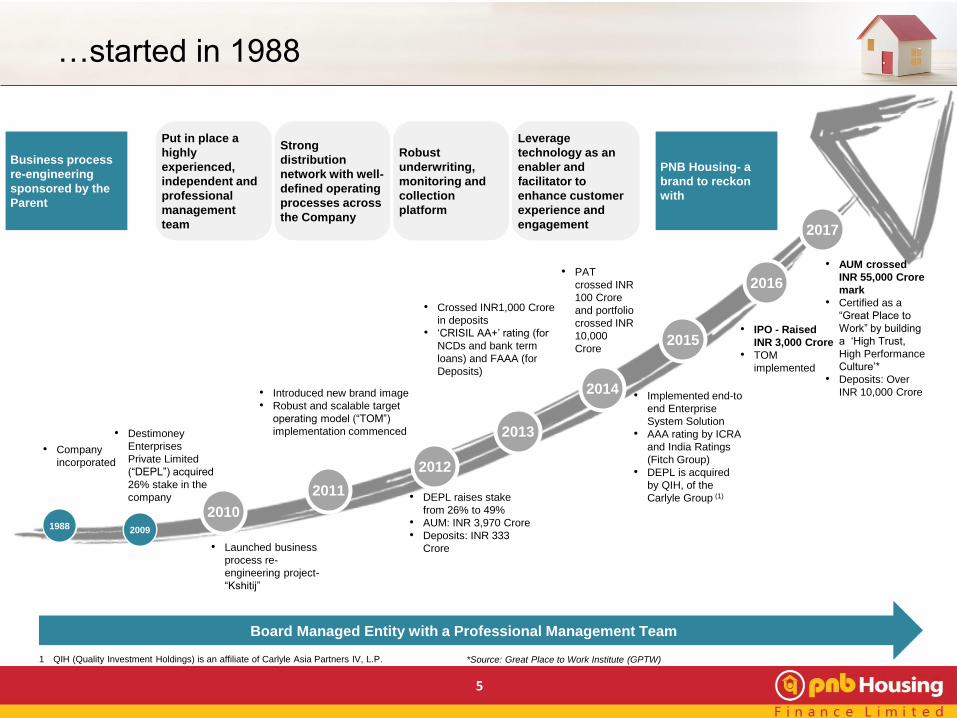
• Company
incorporated
• Destimoney
Enterprises
Private Limited
(“DEPL”) acquired
26% stake in the
company
• Crossed INR1,000 Crore
in deposits
• ‘CRISIL AA+’ rating (for
NCDs and bank term
loans) and FAAA (for
Deposits)
• Introduced new brand image
• Robust and scalable target
operating model (“TOM”)
implementation commenced
1988 2009
2010
2011
2012
2013
2014
2015
2016
• Launched business
process re-
engineering project-
“Kshitij”
• DEPL raises stake
from 26% to 49%
• AUM: INR 3,970 Crore
• Deposits: INR 333
Crore
• PAT
crossed INR
100 Crore
and portfolio
crossed INR
10,000
Crore
• Implemented end-to
end Enterprise
System Solution
• AAA rating by ICRA
and India Ratings
(Fitch Group)
• DEPL is acquired
by QIH, of the
Carlyle Group (1)
Business process
re-engineering
sponsored by the
Parent
Put in place a
highly
experienced,
independent and
professional
management
team
Robust
underwriting,
monitoring and
collection
platform
Leverage
technology as an
enabler and
facilitator to
enhance customer
experience and
engagement
Board Managed Entity with a Professional Management Team
1 QIH (Quality Investment Holdings) is an affiliate of Carlyle Asia Partners IV, L.P.
Strong
distribution
network with well-
defined operating
processes across
the Company
PNB Housing- a
brand to reckon
with
• IPO - Raised
INR 3,000 Crore
• TOM
implemented
5
2017
• AUM crossed
INR 55,000 Crore
mark
• Certified as a
“Great Place to
Work” by building
a ‘High Trust,
High Performance
Culture’*
• Deposits: Over
INR 10,000 Crore
*Source: Great Place to Work Institute (GPTW)
…started in 1988

HFC Sector well placed…
6
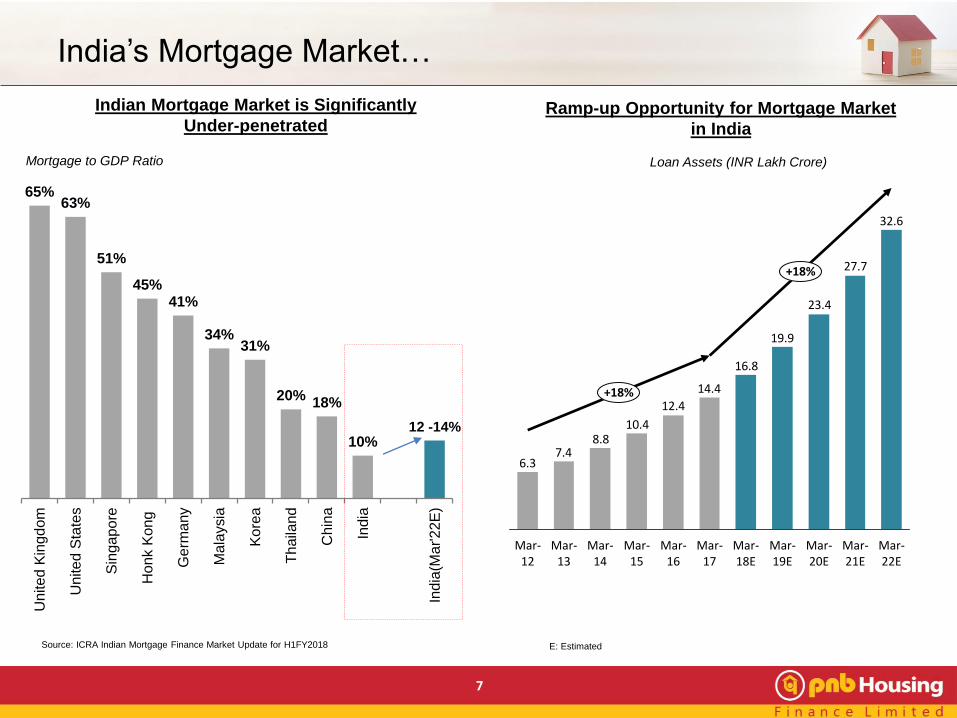
65%63%
51%
45%41%
34%31%
20%18%
10%12 -14%
Un
ite
d K
ingd
om
Un
ite
d S
tate
s
Sin
ga
po
re
Ho
nk K
ong
Germ
any
Ma
laysia
Ko
rea
Thaila
nd
Ch
ina
India
India
(Ma
r'2
2E
)
7
Indian Mortgage Market is Significantly
Under-penetratedRamp-up Opportunity for Mortgage Market
in India
Loan Assets (INR Lakh Crore)Mortgage to GDP Ratio
Source: ICRA Indian Mortgage Finance Market Update for H1FY2018 E: Estimated
India’s Mortgage Market…
32.6
27.7
23.4
19.9
16.8
14.4
12.4
10.48.8
7.46.3
Mar-20E
Mar-19E
Mar-21E
Mar-22E
+18%
Mar-12
Mar-17
Mar-13
Mar-16
Mar-14
Mar-18E
Mar-15
+18%
8
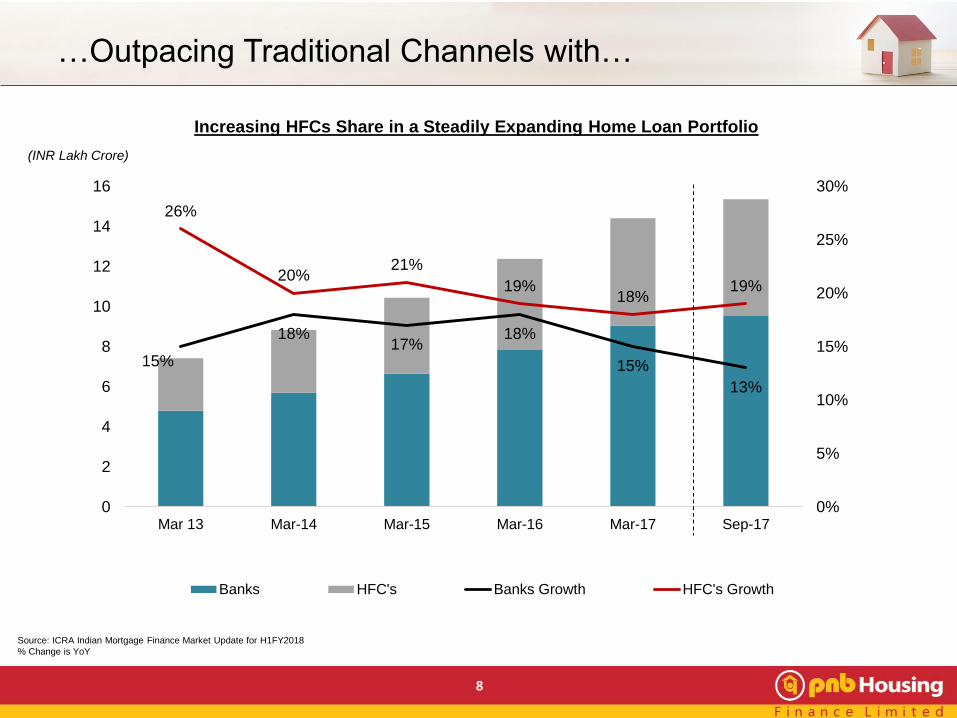
Increasing HFCs Share in a Steadily Expanding Home Loan Portfolio
(INR Lakh Crore)
Source: ICRA Indian Mortgage Finance Market Update for H1FY2018
% Change is YoY
15%
18%17%
18%
15%
13%
26%
20%21%
19%18%
19%
0%
5%
10%
15%
20%
25%
30%
0
2
4
6
8
10
12
14
16
Mar 13 Mar-14 Mar-15 Mar-16 Mar-17 Sep-17
Banks HFC's Banks Growth HFC's Growth
…Outpacing Traditional Channels with…

9
38%
18%
11%
10%
6%
2% 2% 1% 4%
HDFC Ltd LIC HF
IBHF DHFL
PNBHFL Gruh
Can Fin Repco HF
Others
Total Loan of all HFCs: INR 8.5 Lakh Crore
as on 30-Sep-17
Source: ICRA Indian Mortgage Finance Market Update for H1FY2018
% Change is YoY
Key HFC Metrics
Total No. of HFCs (Dec-17) : 91
Total Loan (Sep-17): INR 8.5 Lakh Crore
3 Years CAGR (Mar-17): 21.3%
Portfolio Composition of All HFCs
as on 31-Mar-17
67%
15%
10%
5% 3%
Home Loan LAP Construction Finance LRD Others
Deposit taking HFCs (Dec-17): 18
Portfolio Growth of HFCs
Top 5 HFCs: 82%
19%21%
19% 18% 19%
21%
26% 26% 27%30%
20%
22% 21% 20%23%
Mar-14 Mar-15 Mar-16 Mar-17 Sep-17
Home Loans Other Loans Overall Portfolio
….Sustainable Growth of HFCs

Government Initiatives
10
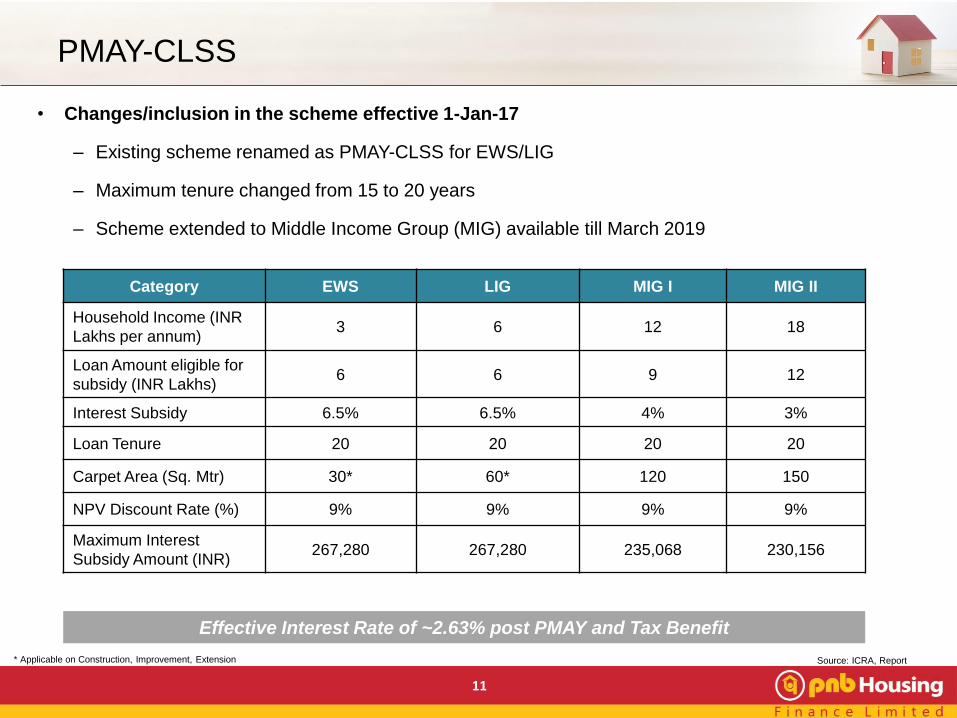
• Changes/inclusion in the scheme effective 1-Jan-17
– Existing scheme renamed as PMAY-CLSS for EWS/LIG
– Maximum tenure changed from 15 to 20 years
– Scheme extended to Middle Income Group (MIG) available till March 2019
11
Category EWS LIG MIG I MIG II
Household Income (INR
Lakhs per annum)3 6 12 18
Loan Amount eligible for
subsidy (INR Lakhs)6 6 9 12
Interest Subsidy 6.5% 6.5% 4% 3%
Loan Tenure 20 20 20 20
Carpet Area (Sq. Mtr) 30* 60* 120 150
NPV Discount Rate (%) 9% 9% 9% 9%
Maximum Interest
Subsidy Amount (INR)267,280 267,280 235,068 230,156
Effective Interest Rate of ~2.63% post PMAY and Tax Benefit
Source: ICRA, Report* Applicable on Construction, Improvement, Extension
PMAY-CLSS
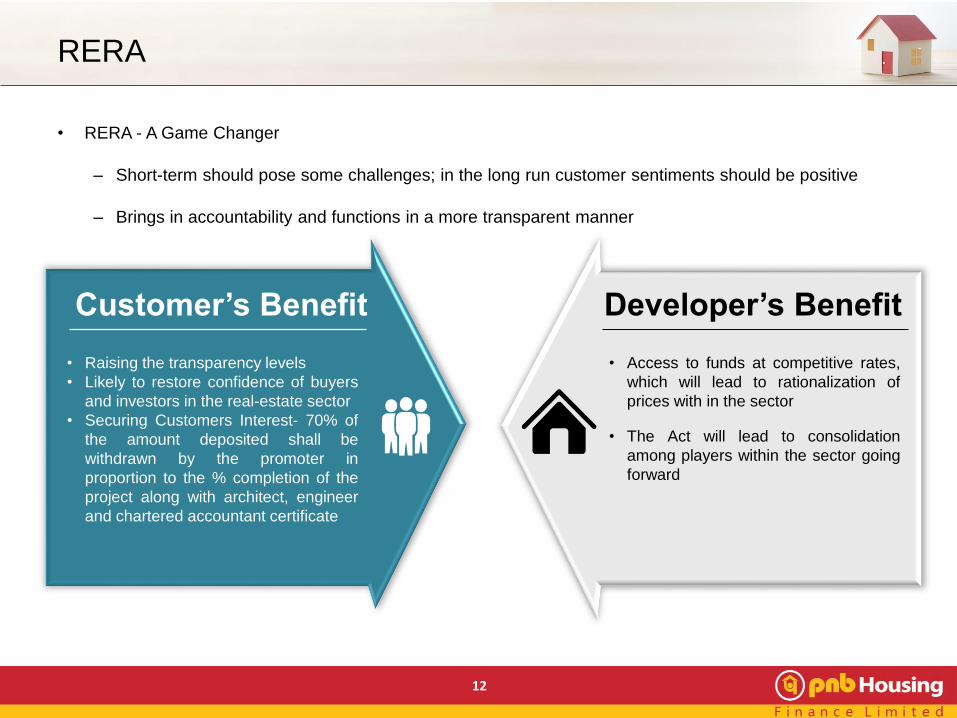
• RERA - A Game Changer
– Short-term should pose some challenges; in the long run customer sentiments should be positive
– Brings in accountability and functions in a more transparent manner
12
Customer’s Benefit
• Raising the transparency levels
• Likely to restore confidence of buyers
and investors in the real-estate sector
• Securing Customers Interest- 70% of
the amount deposited shall be
withdrawn by the promoter in
proportion to the % completion of the
project along with architect, engineer
and chartered accountant certificate
Developer’s Benefit
• Access to funds at competitive rates,
which will lead to rationalization of
prices with in the sector
• The Act will lead to consolidation
among players within the sector going
forward
RERA

Financial Performance of the Company
13
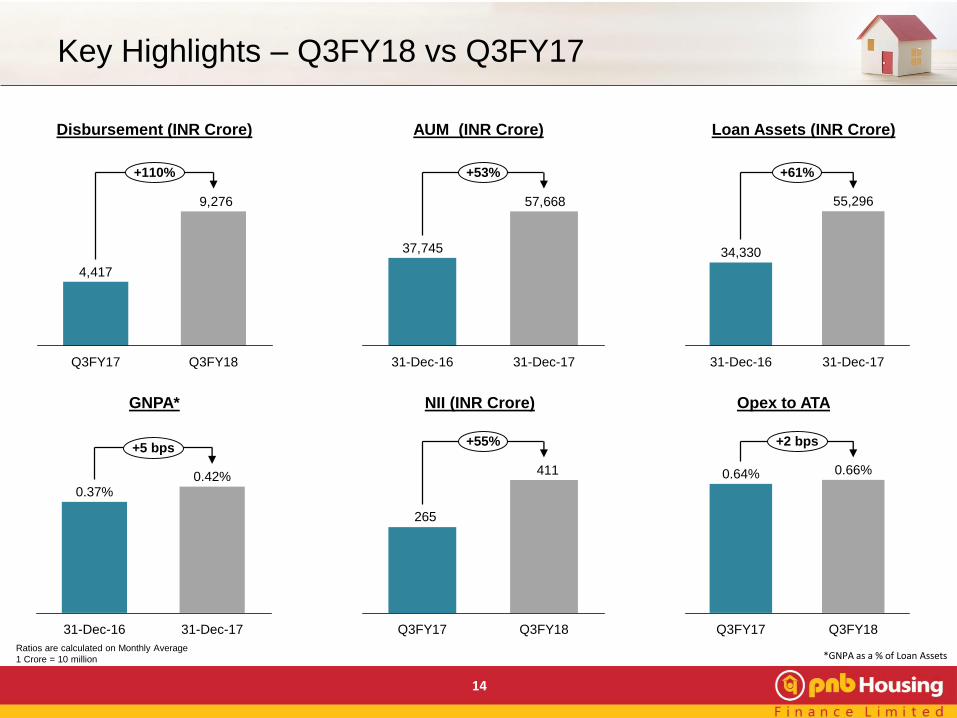
14
Ratios are calculated on Monthly Average
1 Crore = 10 million *GNPA as a % of Loan Assets
9,276
4,417
Q3FY17 Q3FY18
+110%
Disbursement (INR Crore)
57,668
37,745
+53%
31-Dec-1731-Dec-16
AUM (INR Crore)
31-Dec-16
55,296
31-Dec-17
+61%
34,330
Loan Assets (INR Crore)
GNPA*
31-Dec-17
+5 bps
0.42%0.37%
31-Dec-16
NII (INR Crore) Opex to ATA
0.66%
Q3FY18Q3FY17
0.64%
+2 bps
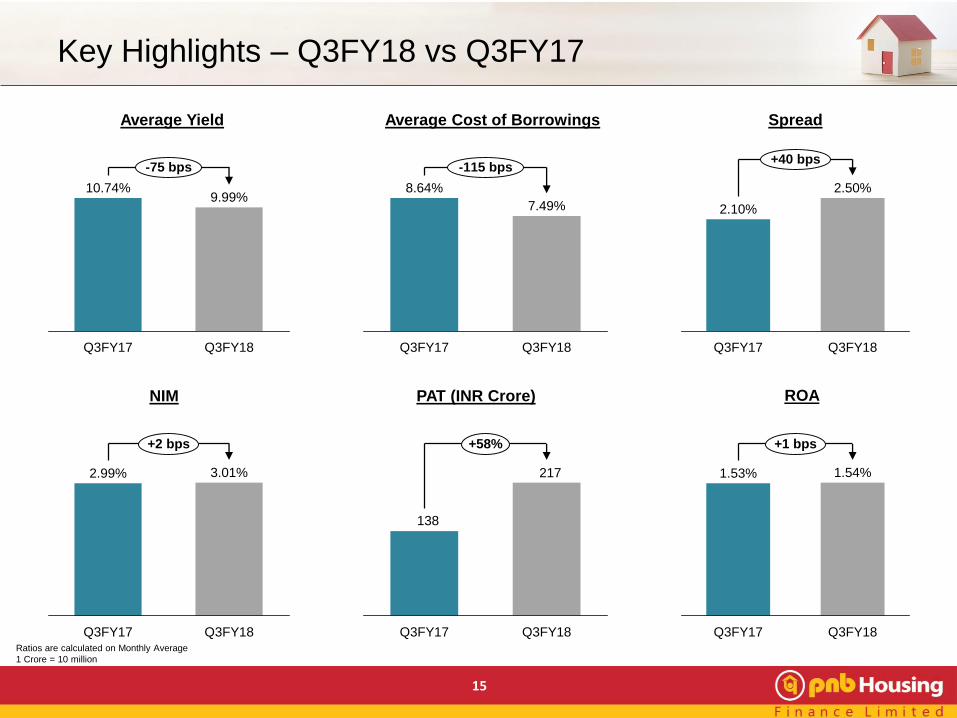
Key Highlights – Q3FY18 vs Q3FY17
411
265
Q3FY17 Q3FY18
+55%
15
PAT (INR Crore)NIM
Average Cost of BorrowingsAverage Yield Spread
217
138
Q3FY18Q3FY17
+58%
-75 bps
Q3FY18
10.74%9.99%
Q3FY17
-115 bps
Q3FY18
7.49%
8.64%
Q3FY17
3.01%
+2 bps
Q3FY18
2.99%
Q3FY17
2.50%
Q3FY17 Q3FY18
+40 bps
2.10%
+1 bps
Q3FY18
1.54%1.53%
Q3FY17
ROA
Key Highlights – Q3FY18 vs Q3FY17
Ratios are calculated on Monthly Average
1 Crore = 10 million
Expansion Led Growth and Robust TOM
16
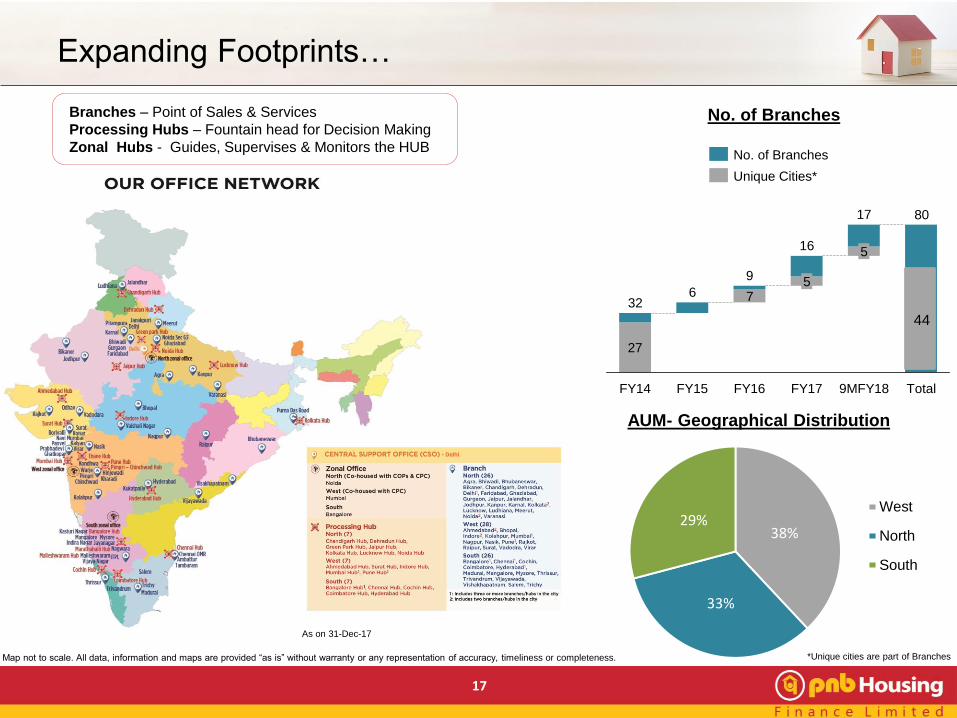
17
No. of Branches
Map not to scale. All data, information and maps are provided “as is” without warranty or any representation of accuracy, timeliness or completeness.
Branches – Point of Sales & Services
Processing Hubs – Fountain head for Decision Making
Zonal Hubs - Guides, Supervises & Monitors the HUB
38%
33%
29%West
North
South
AUM- Geographical Distribution
*Unique cities are part of Branches
27
7
80
6
FY17
5
FY15FY14
32
9MFY18
16
FY16
17
5
Total
9
Unique Cities*
No. of Branches
44
Expanding Footprints…
As on 31-Dec-17

18
Customer
Acquisition/ Service
DSA DST
File received at
HUB
Fountain Head for
Decision Making
Fraud Control Unit
Legal Team
Collection Team
Technical Service
Group
Underwriter reviews
the reports and does
financial assessment
UnderwriterNo
Yes
Digital
Platform
Field Investigation
Lead
Aggregators
…with Robust Hub and Spoke Target Operating Model…

19
(INR Crore)
24,455
20,639
14,456
9,440
FY17FY15 9MFY18FY16
CAGR+48%
16,81927,177
38,531
55,296
57,668
31-Mar-17 31-Dec-1731-Mar-16
41,492
CAGR+55%
27,555
31-Mar-15
17,297
AUM Loan Assets
Asset
Disbursement
1 Crore = 10 million
…leading to Strong Disbursement and Asset growth…
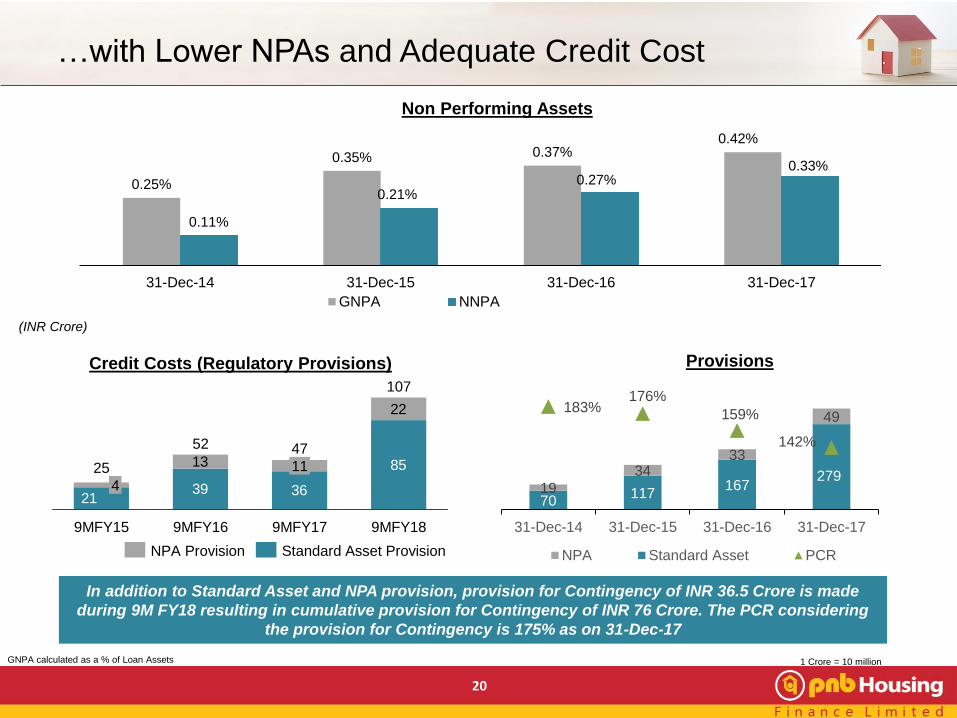
20
GNPA calculated as a % of Loan Assets
0.25%
0.35% 0.37%0.42%
0.11%
0.21%0.27%
0.33%
0.00%
0.10%
0.20%
0.30%
0.40%
0.50%
31-Dec-14 31-Dec-15 31-Dec-16 31-Dec-17
GNPA NNPA
39 36
8513
22
21
47
9MFY17 9MFY18
11
52
9MFY15 9MFY16
107
4
25
Credit Costs (Regulatory Provisions)
70117
167279
19
3433
49183%
176%
159%
142%
80%80%80%81%81%81%81%82%82%82%82%82%83%83%83%83%83%84%84%84%84%85%85%85%85%85%86%86%86%86%86%87%87%87%87%88%88%88%88%88%89%89%89%89%89%90%90%90%90%91%91%91%91%91%92%92%92%92%93%93%93%93%93%94%94%94%94%94%95%95%95%95%96%96%96%96%96%97%97%97%97%97%98%98%98%98%99%99%99%99%99%100%100%100%100%101%101%101%101%101%102%102%102%102%102%103%103%103%103%104%104%104%104%104%105%105%105%105%105%106%106%106%106%107%107%107%107%107%108%108%108%108%108%109%109%109%109%110%110%110%110%110%111%111%111%111%112%112%112%112%112%113%113%113%113%113%114%114%114%114%115%115%115%115%115%116%116%116%116%116%117%117%117%117%118%118%118%118%118%119%119%119%119%120%120%120%120%120%121%121%121%121%121%122%122%122%122%123%123%123%123%123%124%124%124%124%124%125%125%125%125%126%126%126%126%126%127%127%127%127%127%128%128%128%128%129%129%129%129%129%130%130%130%130%131%131%131%131%131%132%132%132%132%132%133%133%133%133%134%134%134%134%134%135%135%135%135%135%136%136%136%136%137%137%137%137%137%138%138%138%138%139%139%139%139%139%140%140%140%140%140%141%141%141%141%142%142%142%142%142%143%143%143%143%143%144%144%144%144%145%145%145%145%145%146%146%146%146%146%147%147%147%147%148%148%148%148%148%149%149%149%149%150%150%150%150%150%151%151%151%151%151%152%152%152%152%153%153%153%153%153%154%154%154%154%154%155%155%155%155%156%156%156%156%156%157%157%157%157%158%158%158%158%158%159%159%159%159%159%160%160%160%160%161%161%161%161%161%162%162%162%162%162%163%163%163%163%164%164%164%164%164%165%165%165%165%165%166%166%166%166%167%167%167%167%167%168%168%168%168%169%169%169%169%169%170%170%170%170%170%171%171%171%171%172%172%172%172%172%173%173%173%173%173%174%174%174%174%175%175%175%175%175%176%176%176%176%176%177%177%177%177%178%178%178%178%178%179%179%179%179%180%180%180%180%180%181%181%181%181%181%182%182%182%182%183%183%183%183%183%184%184%184%184%184%185%185%185%185%186%186%186%186%186%187%187%187%187%188%188%188%
1060
110160210260310
31-Dec-14 31-Dec-15 31-Dec-16 31-Dec-17
NPA Standard Asset PCR
…with Lower NPAs and Adequate Credit Cost
1 Crore = 10 million
Provisions
(INR Crore)
In addition to Standard Asset and NPA provision, provision for Contingency of INR 36.5 Crore is made
during 9M FY18 resulting in cumulative provision for Contingency of INR 76 Crore. The PCR considering
the provision for Contingency is 175% as on 31-Dec-17
Non Performing Assets
Standard Asset ProvisionNPA Provision

Sustainable Portfolio Mix
21
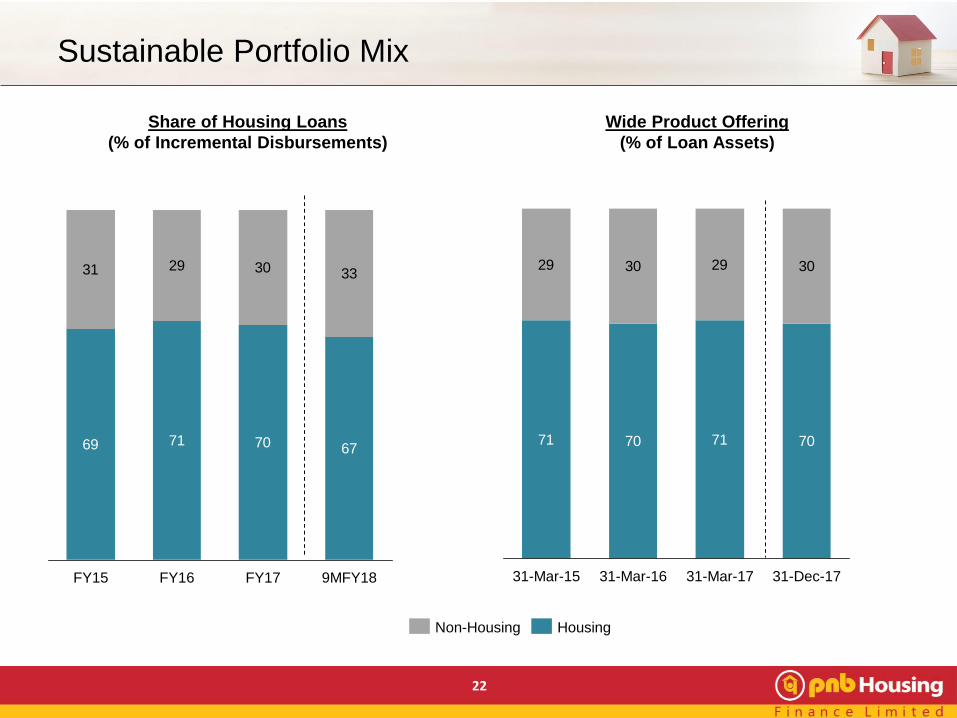
Share of Housing Loans
(% of Incremental Disbursements)
Wide Product Offering
(% of Loan Assets)
69 71 70
31 29 30
67
33
9MFY18FY17FY16FY15
HousingNon-Housing
22
71 70 71
29 30 29
70
30
31-Dec-1731-Mar-15 31-Mar-1731-Mar-16
Sustainable Portfolio Mix
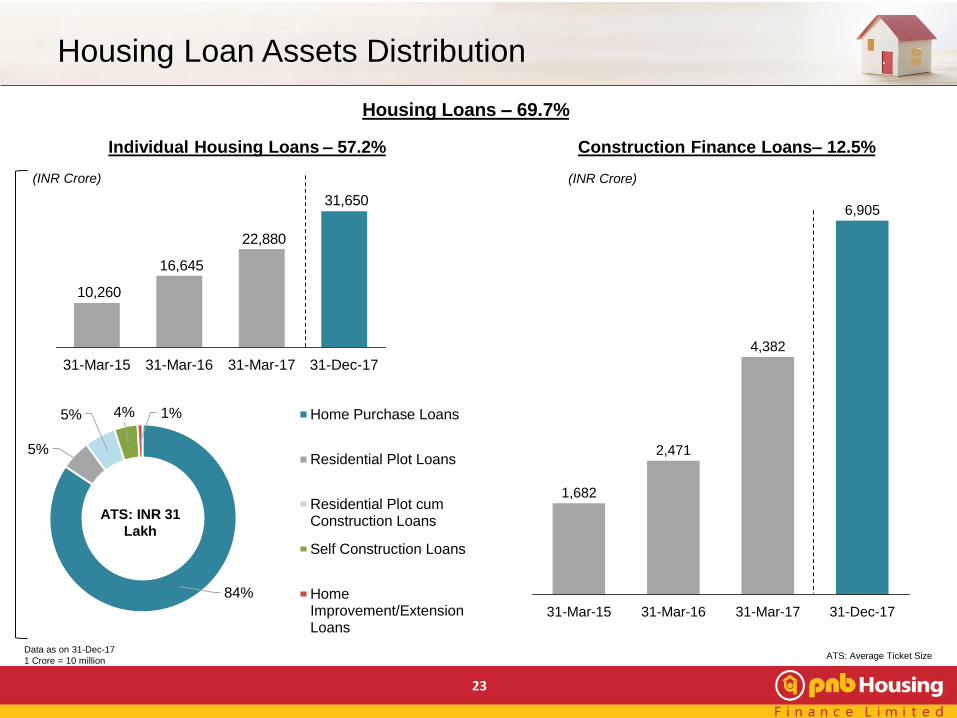
Construction Finance Loans– 12.5%Individual Housing Loans – 57.2%
84%
5%
5% 4% 1% Home Purchase Loans
Residential Plot Loans
Residential Plot cumConstruction Loans
Self Construction Loans
HomeImprovement/ExtensionLoans
ATS: INR 31
Lakh
Data as on 31-Dec-17
1 Crore = 10 million
Housing Loans – 69.7%
31,650
22,880
16,645
10,260
31-Mar-17 31-Dec-1731-Mar-1631-Mar-15
4,382
31-Mar-15 31-Mar-17
2,471
1,682
31-Mar-16 31-Dec-17
6,905
23
(INR Crore) (INR Crore)
ATS: Average Ticket Size
Housing Loan Assets Distribution

53%
21%
15%
11%
LAP LRD CTL NRPL
ATS:
INR 80 Lakh
ATS: Average Ticket Size
16,741
11,269
8,025
4,878
31-Mar-1731-Mar-1631-Mar-15 31-Dec-17
24
Non-Housing Loans - 30.3%
(INR Crore)
Data as on 31-Dec-17
1 Crore = 10 million
Non- Housing Loan Assets Distribution
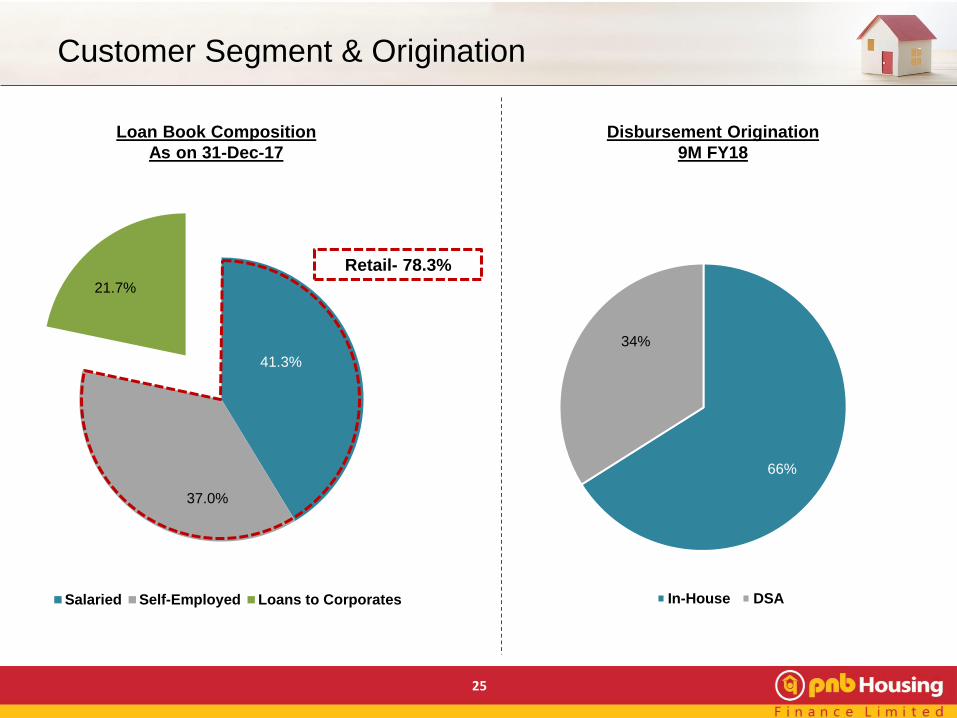
Disbursement Origination
9M FY18
Loan Book Composition
As on 31-Dec-17
25
41.3%
37.0%
21.7%
Salaried Self-Employed Loans to Corporates
66%
34%
In-House DSA
Retail- 78.3%
Customer Segment & Origination
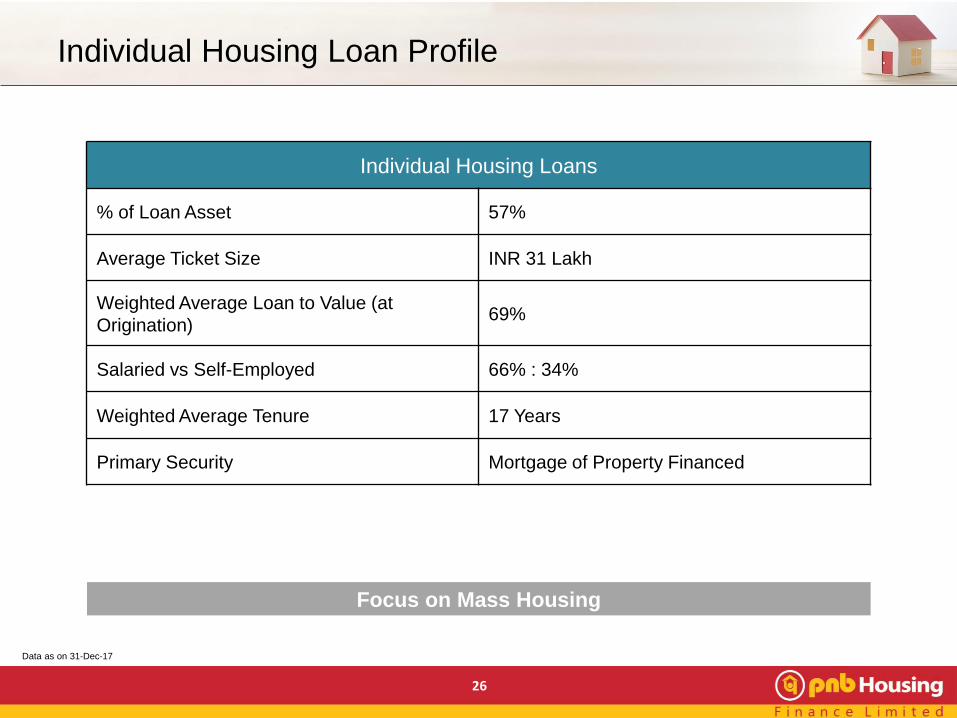
Individual Housing Loans
% of Loan Asset 57%
Average Ticket Size INR 31 Lakh
Weighted Average Loan to Value (at
Origination)69%
Salaried vs Self-Employed 66% : 34%
Weighted Average Tenure 17 Years
Primary Security Mortgage of Property Financed
26
Individual Housing Loan Profile
Data as on 31-Dec-17
Focus on Mass Housing

Loan Against Property
% of Loan Asset 16%
Average Ticket Size INR 49 Lakh
Weighted Average Loan to Value (at
Origination)48%
Salaried vs Self-Employed proportion 18% : 82%
Weighted Average Tenure 12 Years
Primary Security Mortgage of Property Financed
27
Loan Against Property Profile
Data is for LAP in retail segment
Data as on 31-Dec-17
Conservative and Robust Credit Underwriting Process

Operational and Financial Performance
28
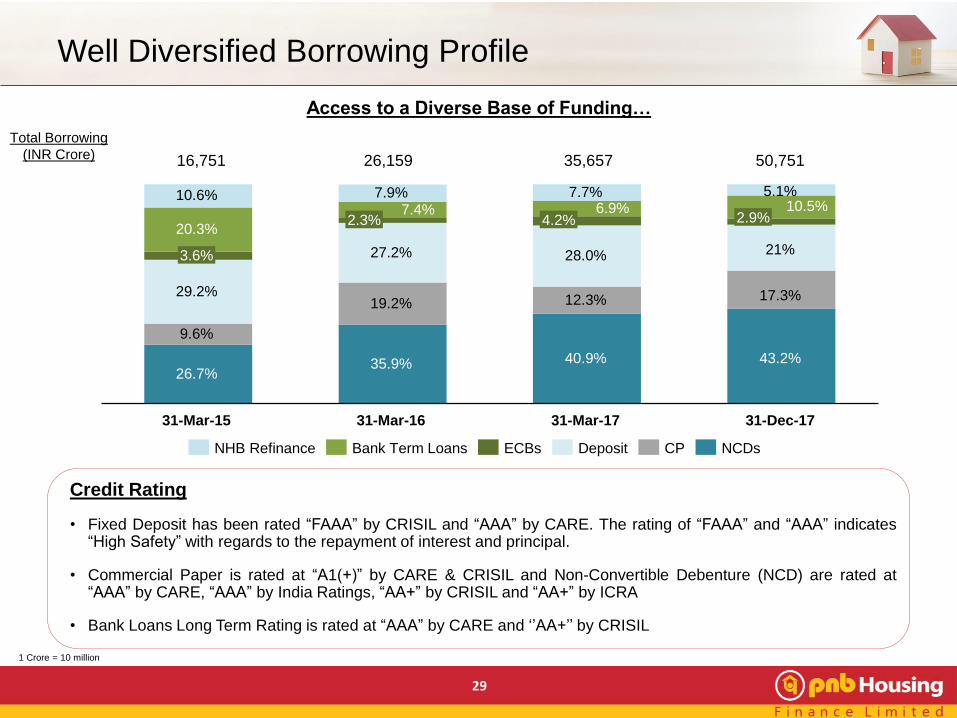
Credit Rating
• Fixed Deposit has been rated “FAAA” by CRISIL and “AAA” by CARE. The rating of “FAAA” and “AAA” indicates“High Safety” with regards to the repayment of interest and principal.
• Commercial Paper is rated at “A1(+)” by CARE & CRISIL and Non-Convertible Debenture (NCD) are rated at“AAA” by CARE, “AAA” by India Ratings, “AA+” by CRISIL and “AA+” by ICRA
• Bank Loans Long Term Rating is rated at “AAA” by CARE and ‘’AA+’’ by CRISIL
29
NHB Refinance CPECBsBank Term Loans NCDsDeposit
3.6%
7.7%
29.2%
6.9%
27.2%
7.4%
19.2%
35.9%
31-Mar-15
28.0%
4.2%
9.6%
2.3%
26.7%
31-Mar-16
20.3%
10.6% 7.9%
40.9%
31-Dec-1731-Mar-17
12.3%
2.9%
43.2%
10.5%
21%
17.3%
5.1%
16,751 35,65726,159
Total Borrowing
(INR Crore)
Access to a Diverse Base of Funding…
50,751
1 Crore = 10 million
Well Diversified Borrowing Profile
30
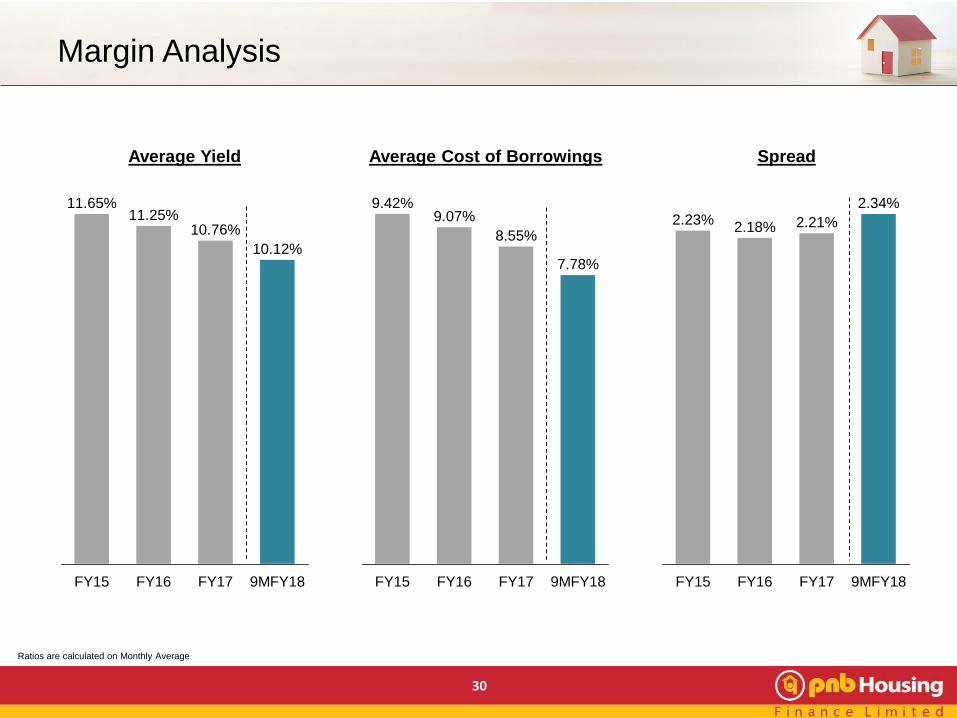
10.12%
10.76%
FY17FY16 9MFY18
11.65%11.25%
FY15 9MFY18FY17FY16
9.07%
FY15
8.55%
7.78%
9.42%
FY17FY16 9MFY18
2.18% 2.21%
FY15
2.23%2.34%
Average Yield Average Cost of Borrowings Spread
Ratios are calculated on Monthly Average
Margin Analysis
31
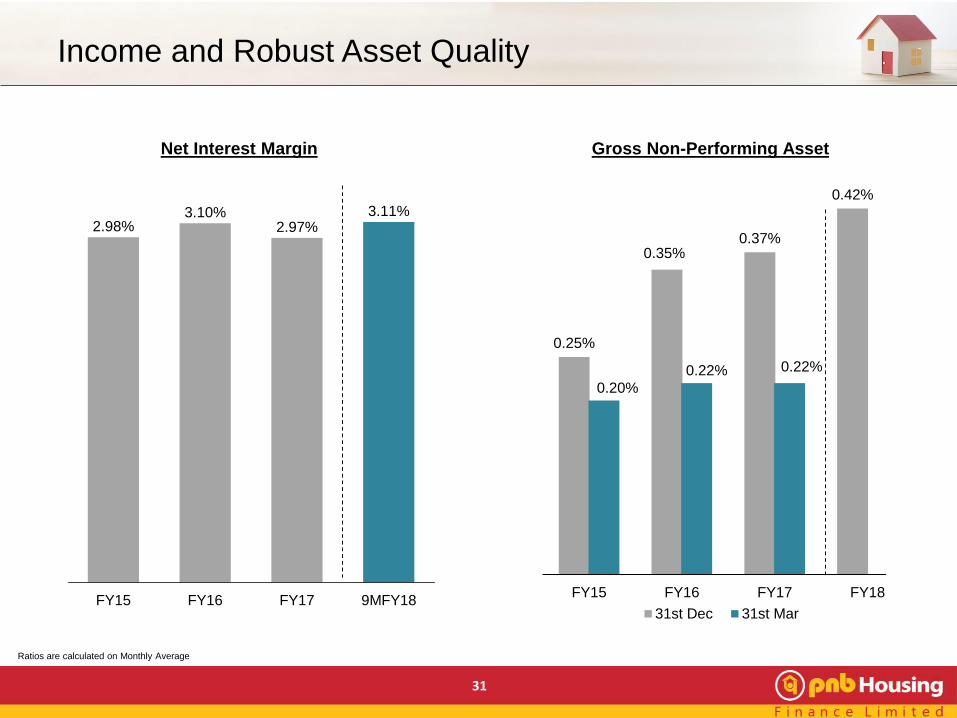
Net Interest Margin
3.11%
FY15 FY17
2.97%3.10%
2.98%
FY16 9MFY18
0.25%
0.35%0.37%
0.42%
0.20%
0.22% 0.22%
0%
0%
0%
0%
0%
0%
0%
0%
0%
0%
FY15 FY16 FY17 FY18
31st Dec 31st Mar
Gross Non-Performing Asset
Income and Robust Asset Quality
Ratios are calculated on Monthly Average

32
Cost to Income RatioOpex to ATA Ratio
Return on Asset Return on Equity
Operating Leverage playing out with Better Return Profile
14.92%
9MFY18**FY17*FY16
17.12%
FY15
16.08%
13.92%
FY17
0.65%0.73%
FY16 9MFY18
0.98%
0.83%
FY15
25.15%
FY15 9MFY18FY16
30.87%
FY17
22.43%
18.32%
9MFY18**FY15
1.28%
FY17
1.37%1.46%
FY16
1.62%
Ratios are calculated on Monthly AverageOpex to ATA is calculated as Operating Expenditure(Employee Cost + Other Expenses + Depreciation - Acquisition Cost - CSR cost)/Average Total Assets as per Balance sheetCost to Income Ratio is calculated as Operating Expenditure(Employee Cost + Other Expenses + Depreciation - Acquisition Cost - CSR cost) / (Net Revenue-Acquisition Cost)Return on Asset is on Average Total Assets as per Balance sheet* Capital of INR 3,000 Crore raised through IPO of 3,87,19,309 fresh equity shares** Annualized

Maintaining Prudence…
33
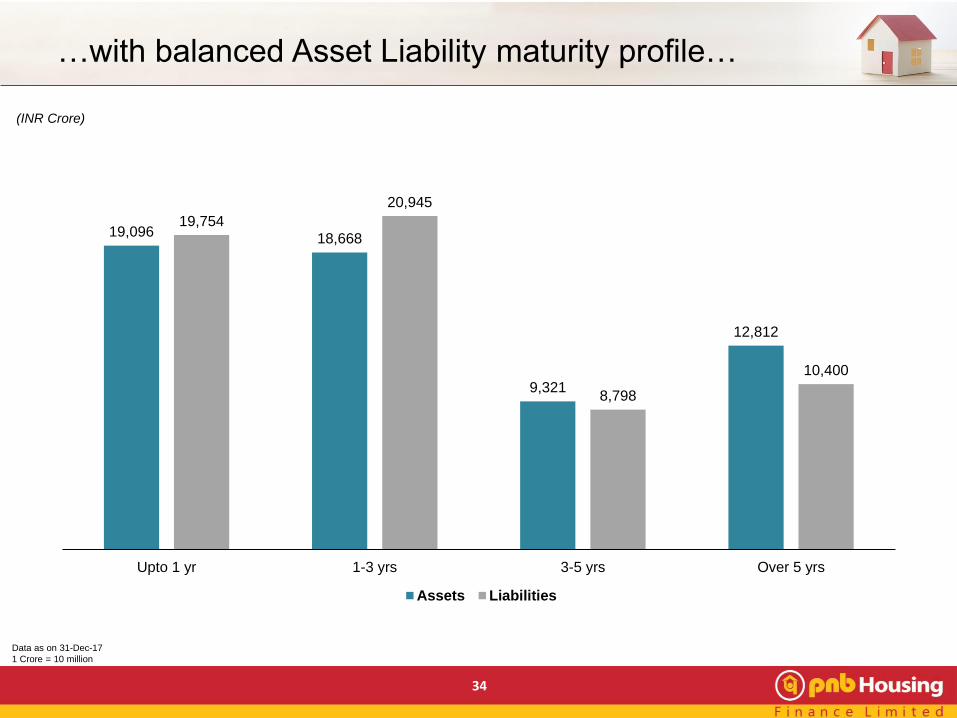
(INR Crore)
34
Data as on 31-Dec-17
1 Crore = 10 million
19,096 18,668
9,321
12,812
19,754
20,945
8,798
10,400
Upto 1 yr 1-3 yrs 3-5 yrs Over 5 yrs
Assets Liabilities
…with balanced Asset Liability maturity profile…

35
Capital to Risk Asset Ratio
Average Gearing (x)
Ratio is calculated on Monthly Average
7.24
8.72
10.7710.73
31-Mar-1731-Mar-1631-Mar-15 31-Dec-17
…and adequate Capital & Comfortable Gearing
17.39%
31-Dec-17
3.35%
5.14%
4.06%12.70%
13.33%
31-Mar-1731-Mar-16
3.66%
31-Mar-15
21.62%
13.76%
10.41% 9.04%
16.48%
Tier 2 Tier 1

Shareholding
36
37
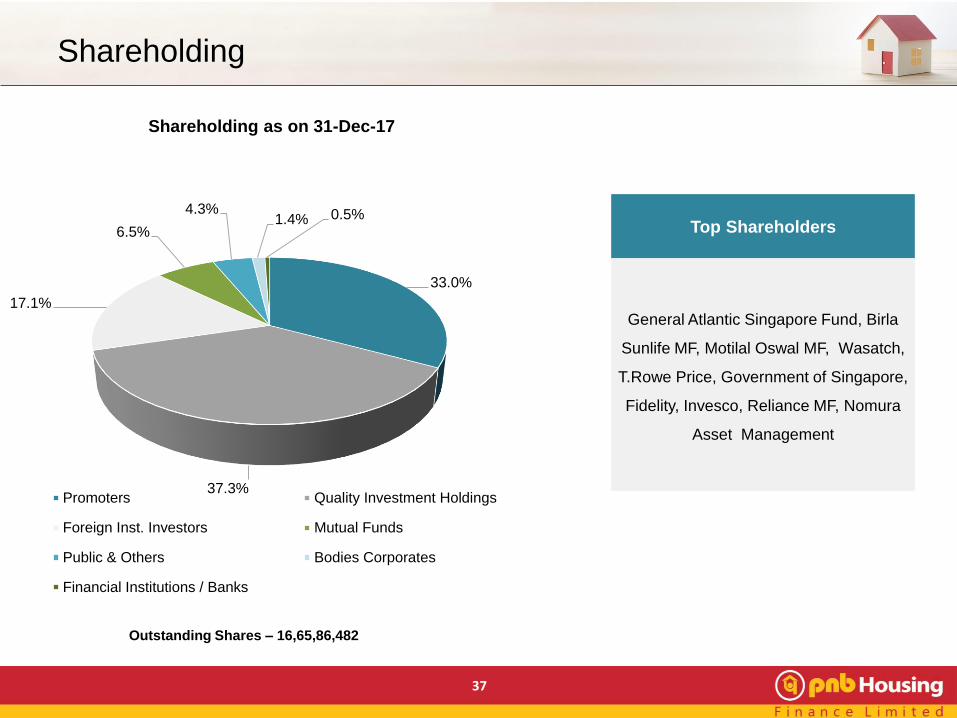
Shareholding
Top Shareholders
General Atlantic Singapore Fund, Birla
Sunlife MF, Motilal Oswal MF, Wasatch,
T.Rowe Price, Government of Singapore,
Fidelity, Invesco, Reliance MF, Nomura
Asset Management
33.0%
37.3%
17.1%
6.5%
4.3%1.4% 0.5%
Shareholding as on 31-Dec-17
Promoters Quality Investment Holdings
Foreign Inst. Investors Mutual Funds
Public & Others Bodies Corporates
Financial Institutions / Banks
Outstanding Shares – 16,65,86,482

Detailed Financials
38
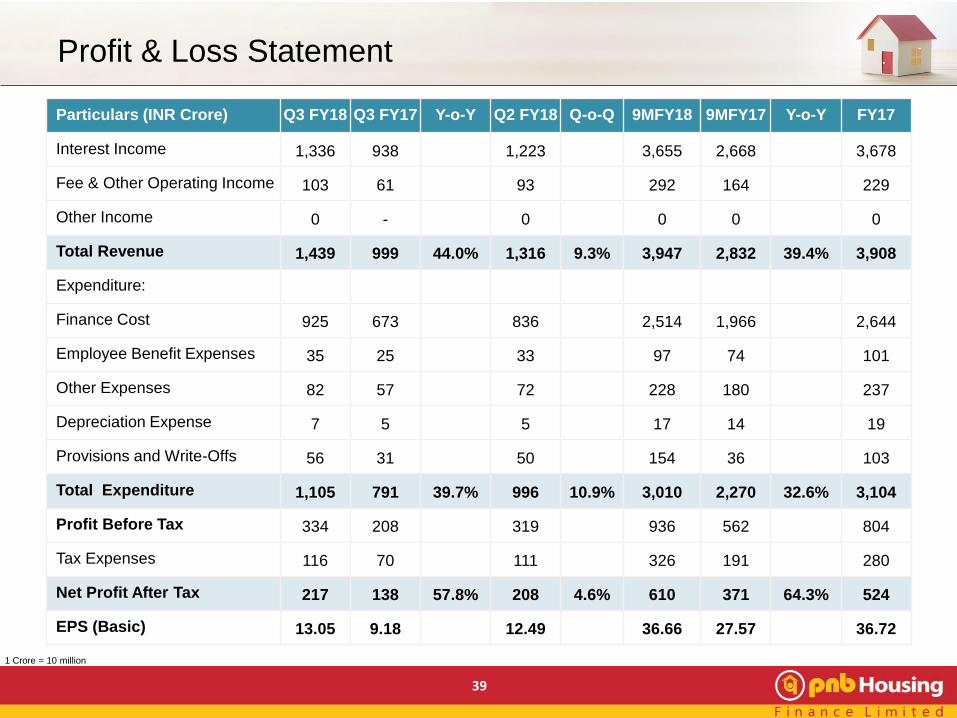
Profit & Loss Statement
39
Particulars (INR Crore) Q3 FY18 Q3 FY17 Y-o-Y Q2 FY18 Q-o-Q 9MFY18 9MFY17 Y-o-Y FY17
Interest Income 1,336 938 1,223 3,655 2,668 3,678
Fee & Other Operating Income 103 61 93 292 164 229
Other Income 0 - 0 0 0 0
Total Revenue 1,439 999 44.0% 1,316 9.3% 3,947 2,832 39.4% 3,908
Expenditure:
Finance Cost 925 673 836 2,514 1,966 2,644
Employee Benefit Expenses 35 25 33 97 74 101
Other Expenses 82 57 72 228 180 237
Depreciation Expense 7 5 5 17 14 19
Provisions and Write-Offs 56 31 50 154 36 103
Total Expenditure 1,105 791 39.7% 996 10.9% 3,010 2,270 32.6% 3,104
Profit Before Tax 334 208 319 936 562 804
Tax Expenses 116 70 111 326 191 280
Net Profit After Tax 217 138 57.8% 208 4.6% 610 371 64.3% 524
EPS (Basic) 13.05 9.18 12.49 36.66 27.57 36.72
1 Crore = 10 million
40
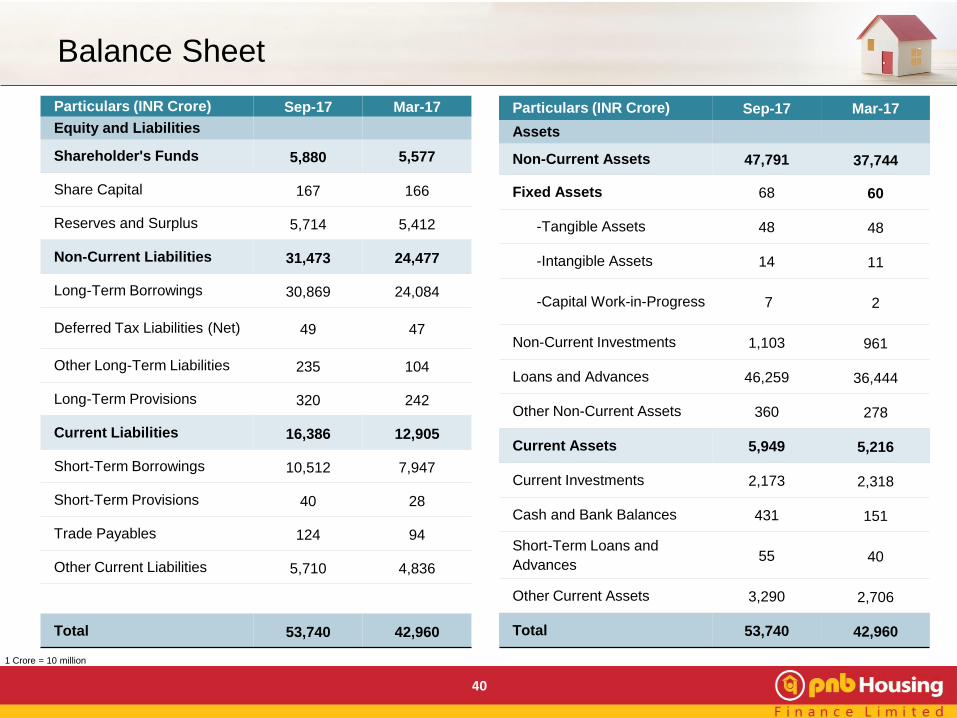
Particulars (INR Crore) Sep-17 Mar-17
Equity and Liabilities
Shareholder's Funds 5,880 5,577
Share Capital 167 166
Reserves and Surplus 5,714 5,412
Non-Current Liabilities 31,473 24,477
Long-Term Borrowings 30,869 24,084
Deferred Tax Liabilities (Net) 49 47
Other Long-Term Liabilities 235 104
Long-Term Provisions 320 242
Current Liabilities 16,386 12,905
Short-Term Borrowings 10,512 7,947
Short-Term Provisions 40 28
Trade Payables 124 94
Other Current Liabilities 5,710 4,836
Total 53,740 42,960
Particulars (INR Crore) Sep-17 Mar-17
Assets
Non-Current Assets 47,791 37,744
Fixed Assets 68 60
-Tangible Assets 48 48
-Intangible Assets 14 11
-Capital Work-in-Progress 7 2
Non-Current Investments 1,103 961
Loans and Advances 46,259 36,444
Other Non-Current Assets 360 278
Current Assets 5,949 5,216
Current Investments 2,173 2,318
Cash and Bank Balances 431 151
Short-Term Loans and
Advances55 40
Other Current Assets 3,290 2,706
Total 53,740 42,960
Balance Sheet
1 Crore = 10 million

Saksham – Contributing to the Society
41

42
Enhancing Human Potential
• Partnered with The Confederation of Real Estate
Developers Association of India (CREDAI) to conduct
Onsite & Offsite skills training programmes for
construction workers
Reaching Out, Reaching Far
• Collaborated with Mobile Creches and various real
estate developers to offer day care services to the
children of construction workers on various
construction sites and provide them with education,
hygiene and nutrition
Investing in Education
• Partnered with VIDYA, a NGO working for the
underprivileged children
• Adopted two school with Vidya- Rainbow Montessori
School (Bal Vihar) and Primary School of South Delhi
Municipal Corporation
Glimpses of Social Interventions
Improving Access to Health Care: Supporting Public hospitals with an aim to improve their Infrastructure

43
…winning Awards & Accolades
Awarded ‘Excellence in Customer Relation’ at GIHED CREDAI Property Show 2017. This award
testaments our belief in customer relations.
Our IPO has been awarded “IPO of the Year” by Finance Monthly Magazine (M&A Award)- A
leading international business publication. This award is a testimony of investor confidence in our
Organisation and recognition of ‘Kshitij – Our transformation journey over last 6 years’.
Honored in the field of “IT Security” at CSO 100 Awards organized by CSO 100 Award and IDG
Security. This accreditation is a testament of our dedication and commitment to serve our customers
and stakeholders by giving them an unparalleled security.
Mr. Nitant Desai (Chief Centralized Operation & Technology Officer) has been awarded amongst
Top 100 CIOs of India
PNB Housing Finance won bronze award at Outdoor Advertising Awards 2017, in the financial
services category for its innovative outdoor campaign executed during the IPO. The award was
presented by OAC (Outdoor Advertising Convention), one of the most credible outdoor advertising
award & knowledge sharing industry platform.
Awarded ‘Best Project Finance Company of the Year’ at Construction Times Builders Award. The
honour was bestowed by Shri Vijay Shivtare, Hon’ble Minister of State, Water Resources and Water
Conservation, Maharashtra and Shri Rahul Shiwale, Hon’ble Member of Parliament, in a grand
ceremony in Mumbai.
“Leading Housing Finance Company 2017” at National Awards for Best Housing Finance Companies
organized by CMO Asia on 24th November, 2017 in Mumbai.

Strong Management Team…
44
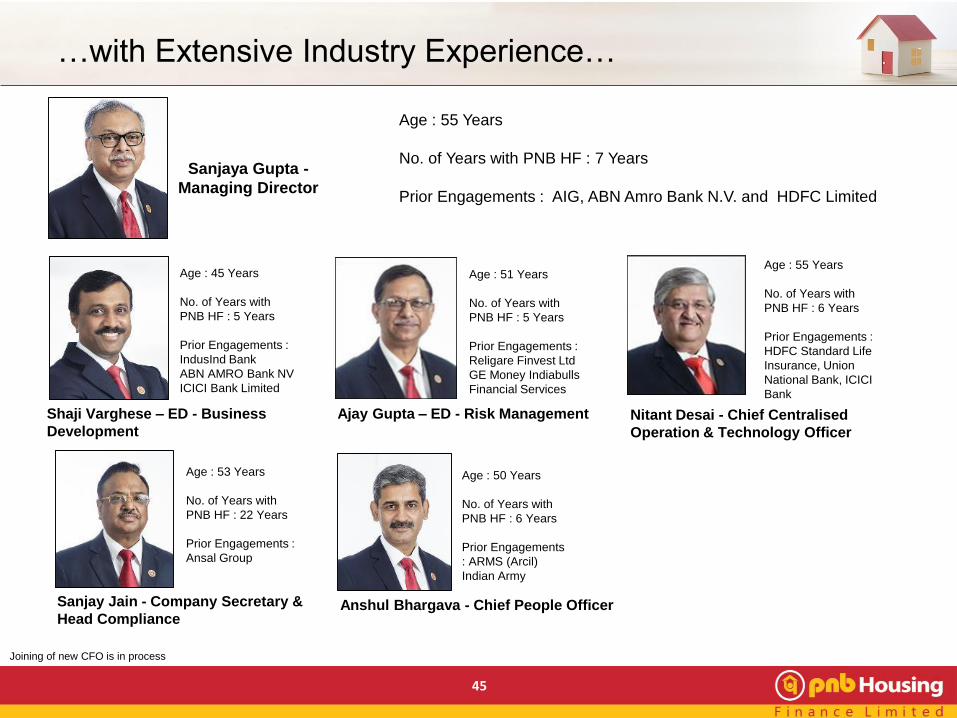
…with Extensive Industry Experience…
45
Age : 45 Years
No. of Years with
PNB HF : 5 Years
Prior Engagements :
IndusInd Bank
ABN AMRO Bank NV
ICICI Bank Limited
Age : 51 Years
No. of Years with
PNB HF : 5 Years
Prior Engagements :
Religare Finvest Ltd
GE Money Indiabulls
Financial Services
Shaji Varghese – ED - Business
Development
Ajay Gupta – ED - Risk Management
Age : 55 Years
No. of Years with
PNB HF : 6 Years
Prior Engagements :
HDFC Standard Life
Insurance, Union
National Bank, ICICI
Bank
Age : 53 Years
No. of Years with
PNB HF : 22 Years
Prior Engagements :
Ansal Group
Age : 50 Years
No. of Years with
PNB HF : 6 Years
Prior Engagements
: ARMS (Arcil)
Indian Army
Nitant Desai - Chief Centralised
Operation & Technology Officer
Sanjay Jain - Company Secretary &
Head ComplianceAnshul Bhargava - Chief People Officer
Sanjaya Gupta -
Managing Director
Age : 55 Years
No. of Years with PNB HF : 7 Years
Prior Engagements : AIG, ABN Amro Bank N.V. and HDFC Limited
Joining of new CFO is in process
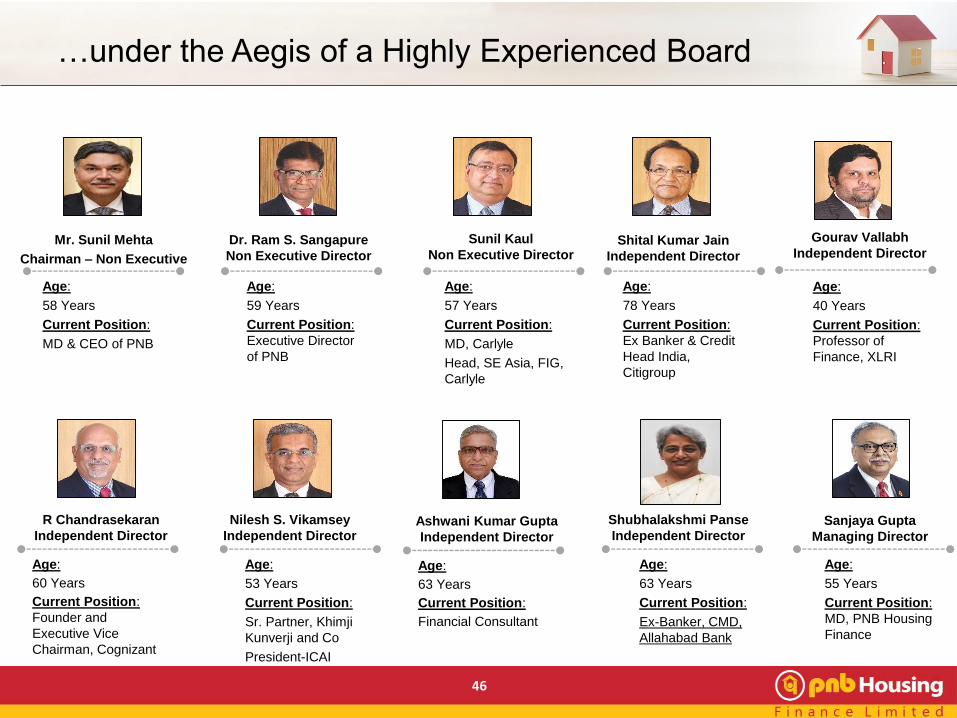
…under the Aegis of a Highly Experienced Board
46
Mr. Sunil Mehta
Chairman – Non Executive
Dr. Ram S. Sangapure
Non Executive Director
Sunil Kaul
Non Executive Director
R Chandrasekaran
Independent Director
Nilesh S. Vikamsey
Independent Director
Shubhalakshmi Panse
Independent DirectorSanjaya Gupta
Managing Director
Age:
58 Years
Current Position:
MD & CEO of PNB
Age:
53 Years
Current Position:
Sr. Partner, Khimji
Kunverji and Co
President-ICAI
Age:
63 Years
Current Position:
Ex-Banker, CMD,
Allahabad Bank
Age:
55 Years
Current Position:
MD, PNB Housing
Finance
Age:
59 Years
Current Position:
Executive Director
of PNB
Age:
57 Years
Current Position:
MD, Carlyle
Head, SE Asia, FIG,
Carlyle
Shital Kumar Jain
Independent Director
Age:
78 Years
Current Position:
Ex Banker & Credit
Head India,
Citigroup
Ashwani Kumar Gupta
Independent Director
Age:
63 Years
Current Position:
Financial Consultant
Gourav Vallabh
Independent Director
Age:
40 Years
Current Position:
Professor of
Finance, XLRI
Age:
60 Years
Current Position:
Founder and
Executive Vice
Chairman, Cognizant
47
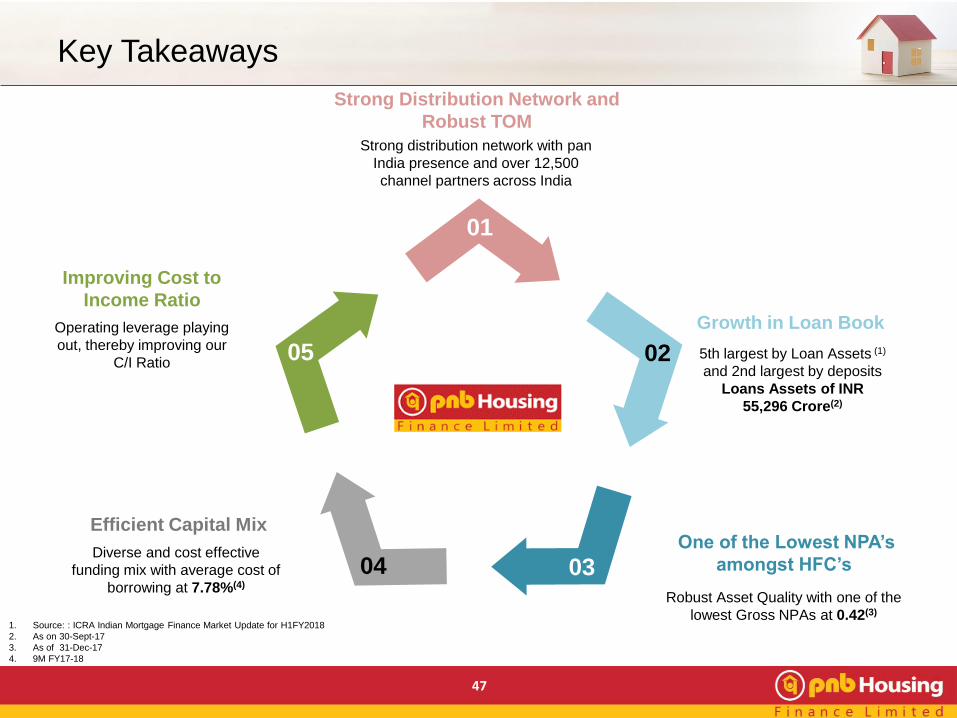
Key Takeaways
Strong distribution network with pan
India presence and over 12,500
channel partners across India
Strong Distribution Network and
Robust TOM
Diverse and cost effective
funding mix with average cost of
borrowing at 7.78%(4)
Efficient Capital Mix
Robust Asset Quality with one of the
lowest Gross NPAs at 0.42(3)
One of the Lowest NPA’s
amongst HFC’s
5th largest by Loan Assets (1)
and 2nd largest by deposits
Loans Assets of INR
55,296 Crore(2)
Growth in Loan BookOperating leverage playing
out, thereby improving our
C/I Ratio
Improving Cost to
Income Ratio
Bring your presentation to life.
Download this awesome diagram.
Text Here
01
04 03
0205
1. Source: : ICRA Indian Mortgage Finance Market Update for H1FY2018
2. As on 30-Sept-17
3. As of 31-Dec-17
4. 9M FY17-18

Annexure
48
49
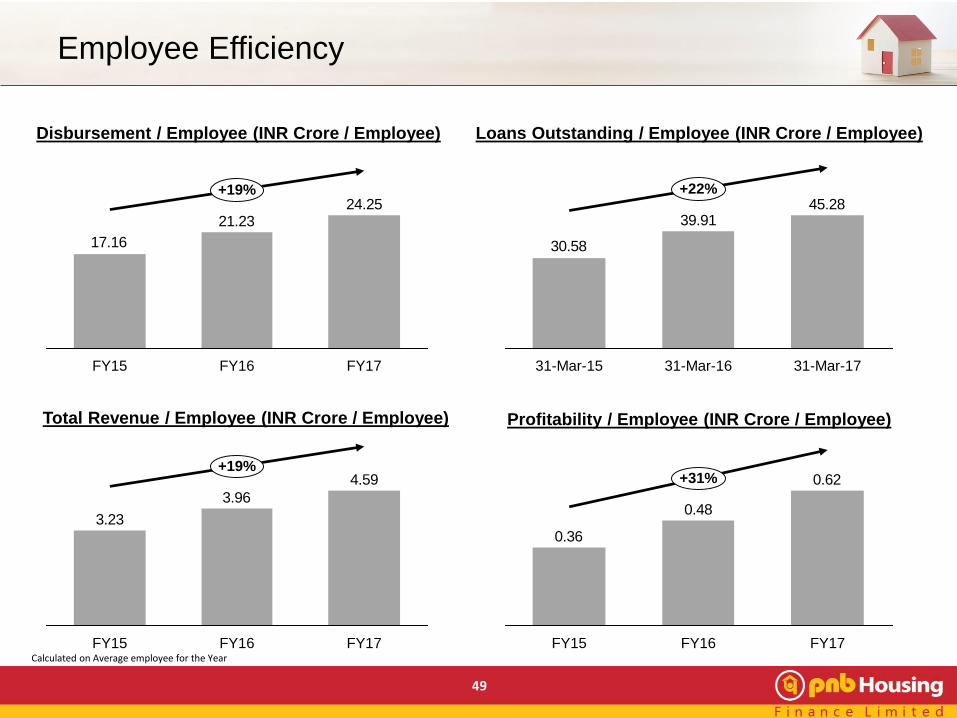
Employee Efficiency
Loans Outstanding / Employee (INR Crore / Employee)
Profitability / Employee (INR Crore / Employee)
Disbursement / Employee (INR Crore / Employee)
Total Revenue / Employee (INR Crore / Employee)
24.2521.23
17.16
FY16
+19%
FY15 FY17
45.2839.91
30.58
31-Mar-15 31-Mar-1731-Mar-16
+22%
4.59
3.96
3.23
FY15 FY16
+19%
FY17
0.62
0.48
0.36
+31%
FY17FY15 FY16Calculated on Average employee for the Year

50
Glossary
ATA Average Total Assets
ATS Average Ticket Size
AUM Asset Under Management
BVPS Book-value per Share
C/I Cost to Income
CRAR Capital to Risk Asset Ratio
CP Commercial Paper
CTL Corporate Term Loan
DPS Dividend per Share
DSA Direct Selling Agents
ECB External Commercial Borrowing
EPS Earning Per Share
GNPA Gross Non-Performing Asset
HFCs Housing Finance Companies
LAP Loan against Property
LRD Lease Rental Discounting
NCDs Non-Convertible Debentures
NII Net Interest Income
NIM Net Interest Margin
NNPA Net Non-Performing Asset
NPA Non-Performing Asset
NRPLs Non-Residential Premises Loans
PAT Profit After Tax
PCR Provision Coverage Ratio
ROA Return on Asset
ROE Return on Equity
51
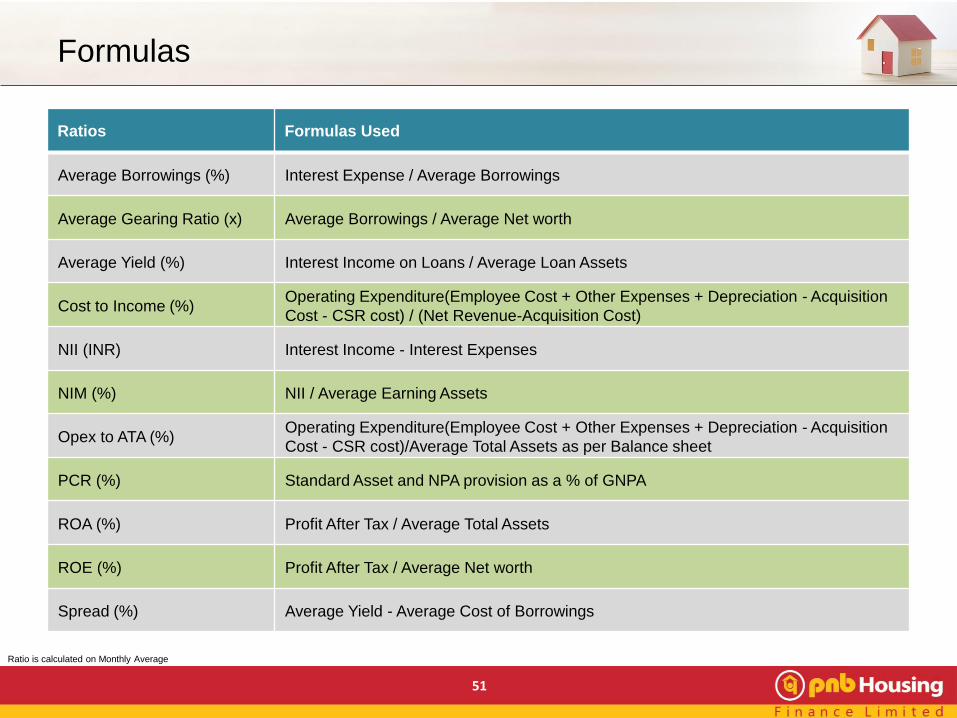
Formulas
Ratios Formulas Used
Average Borrowings (%) Interest Expense / Average Borrowings
Average Gearing Ratio (x) Average Borrowings / Average Net worth
Average Yield (%) Interest Income on Loans / Average Loan Assets
Cost to Income (%)Operating Expenditure(Employee Cost + Other Expenses + Depreciation - Acquisition
Cost - CSR cost) / (Net Revenue-Acquisition Cost)
NII (INR) Interest Income - Interest Expenses
NIM (%) NII / Average Earning Assets
Opex to ATA (%)Operating Expenditure(Employee Cost + Other Expenses + Depreciation - Acquisition
Cost - CSR cost)/Average Total Assets as per Balance sheet
PCR (%) Standard Asset and NPA provision as a % of GNPA
ROA (%) Profit After Tax / Average Total Assets
ROE (%) Profit After Tax / Average Net worth
Spread (%) Average Yield - Average Cost of Borrowings
Ratio is calculated on Monthly Average
Thank You
Company:
PNB Housing Finance Limited
CIN: L65922DL1988PLC033856
Ms. Deepika Gupta Padhi (Head-Investor Relations)
Phone: +91 11 23445214
www.pnbhousing.com