investor presentation - hyundai · pdf fileinvestor presentation february 2017 . cautionary...
TRANSCRIPT
Investor Presentation February 2017

Cautionary Statement with Respect to Forward-Looking Statements
1
In the presentation that follows and in related comments by Hyundai Motor’s management, our use of the
words “expect,” “anticipate,” “project,” “estimate,” “forecast,” “objective,” “plan,” “goal,” “outlook,” “target,”
“pursue” and similar expressions is intended to identify forward looking statements.
The financial data discussed herein are presented on a preliminary basis before the audit from our Independent
Auditor; final data will be included in HMC’s Independent auditor’s report. While these statements represent our
current judgment on what the future may hold, and we believe these judgments are reasonable, actual results
may differ materially due to numerous important factors. Such factors include, among others, the following :
changes in economic conditions, currency exchange rates or political stability; shortages of fuel, labor strikes
or work stoppages; market acceptance of the corporation’s new products; significant changes in the
competitive environment; changes in laws, regulations and tax rates; and the ability of the corporation to
achieve reductions in cost and employment levels to realize production efficiencies and implement capital
expenditures at levels and times planned by management.
We do not intend or assume any obligation to update any forward-looking statement, which speaks only as of
the date on which it is made.

Table of Contents
2
• Executive Summary
• Key Strengths for HMC
• Future Strategies
• Market Update by Region
• Appendix


Executive Summary
4
Balanced Sales Growth
and Diversified Portfolio
Strong Performance
through the Cycle
Structural Improvement in
Core Competitiveness
Superior Performance Relative to
Peer Groups
Volume Growth
Value Growth
Cost Structure Improvement
New Technology
Current Outstanding Performance Prudent Future Strategies


6
4.0%
4.2%
5.3%
5.6% 5.7% 5.7% 5.7%
5.6% 5.5%
2008 2009 2010 2011 2012 2013 2014 2015 2016
3,701 4,099
4,392 4,621
4,835 4,843 4,914
2010 2011 2012 2013 2014 2015 2016
Global Sales Trend Global Market Share Trend
Source : Company data (Retail sales excluding CKD sales) Source : IHS
Brand Value Growth Quality Index Trend (Initial Quality Study) (Unit: number of problems)
Source : J.D. Power
108 107 106
94 95 92
5 9
5 1 2 2
2011 2012 2013 2014 2015 2016
(Ranks among non-premium)
Source : Interbrand
5.0 6.0 7.5 9.0 10.4 11.3 12.5
9.3%
19.3%
24.4% 20.5%
15.6%
8.5% 11.1%
0%
5%
10%
15%
20%
25%
30%
0
5
10
15
20
25
2010 2011 2012 2013 2014 2015 2016
HMC Brand Value (Billion US$) HMC Value Growth (%)
Focus on Value Growth Strategy
(U$ 5B in ‘10 → 12.5B in ’16, 149%↑)
1. Balanced Growth
7
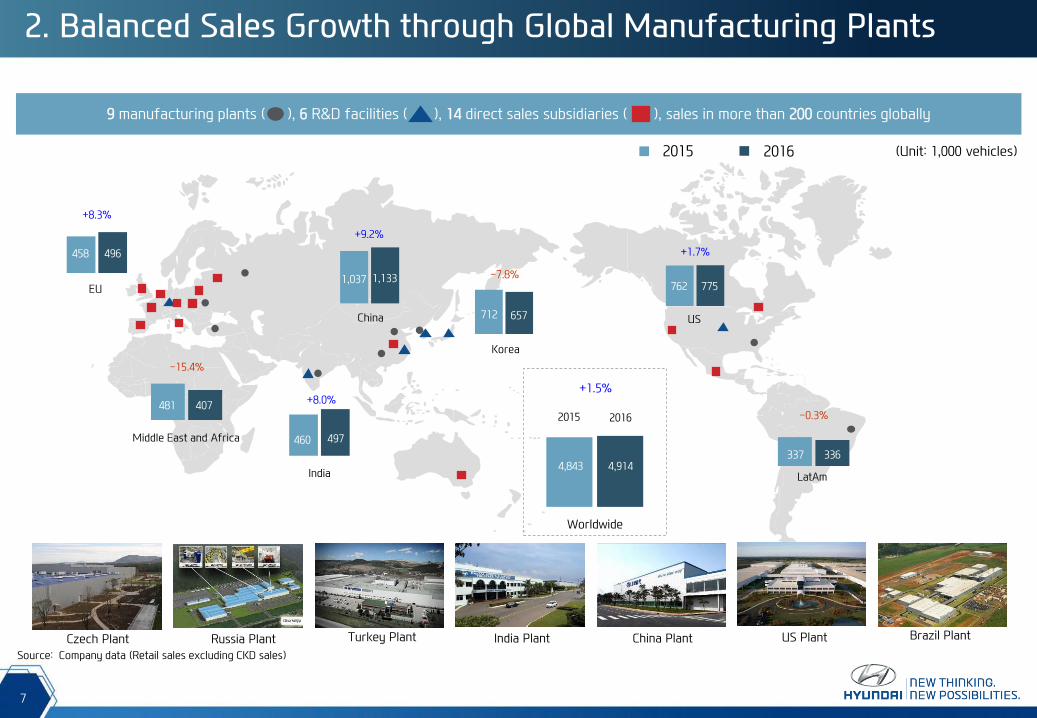
2. Balanced Sales Growth through Global Manufacturing Plants
(Unit: 1,000 vehicles) 2015 2016
Turkey Plant India Plant China Plant US Plant Czech Plant Russia Plant
US
775 762
Korea
657 712
EU
496 458
India
497 460
China
1,133 1,037
Worldwide
2015 2016
4,843 4,914
9 manufacturing plants ( ), 6 R&D facilities ( ), 14 direct sales subsidiaries ( ), sales in more than 200 countries globally
Source: Company data (Retail sales excluding CKD sales)
Brazil Plant
+1.5%
-7.8%
+9.2%
+8.3%
+8.0%
+1.7%
LatAm
336 337
-0.3%
Middle East and Africa
407 481
-15.4%

2. Balanced Sales Growth by Diversified Business Portfolio
8
Geographically Diversified Portfolio (%) Marketable Product Mix* (%)
15.6
21.8
33.3
13.4
38.0
28.1
2.8
7.2
3.3
8.6
9.6
28.7
21.5
12.2
38.4
37.2
14.6
16.5
3.8
3.9
7.0
12.8
12.2
9.6
0 20 40 60 80 100
Honda
Toyota
GM
VW
Domestic North America Europe China Asia (ex-China) Others
Source: Company data for HMC 2015 Global Retail Sales, Competitor information from IHS and company data (CY2015 data)
*A+B+C=Mini+Sub Compact+Compact; D+E+F=Mid-Size+Large+Luxury; RV=SUV+MPV, Others=PUP and others
14.7 18.5 13.4 22.0 13.4 18.0 Hyundai
42.7
40.3
29.3
60.8
13.1
12.7
11.8
18.0
43.7
33.6
28.2
16.2
0.6
13.4
30.7
5.0
0 20 40 60 80 100
Honda
Toyota
GM
VW
A+B+C D+E+F RV Others
54.1 17.0 22.7 6.2 Hyundai

9
3. Strong Risk Management (Improved Resilience to FX Fluctuations)
Reduced FX exposures by lowering exports from Korea and improving localizations of suppliers at overseas plants
Portion of Exports from Korea Plant Number of suppliers with overseas operations
Source: Company data
60%
71% 70% 70% 72% 75% 76% 77% 79%
40%
29% 30% 30% 28% 25% 24% 23% 21%
2008 2009 2010 2011 2012 2013 2014 2015 2016
Korea Domestic & Overseas Plant Sales Export from Korea Plant
22 65
171 172
310 344
461
19
57
116
247
218
232
265
2000 2002 2004 2006 2008 2010 2015
1st tier suppliers 2nd tier suppliers
41
122
287
419
528
576
726

10
3. Strong Risk Management (Utilization)
HMC Global Utilization Trend 2016 Utilization by Plant (Unit: %)
100.6
107.4 105.8
104.1
101.9 101.7
98.1
2010 2011 2012 2013 2014 2015 2016
119.5
115.0
103.8 103.5 102.4 102.3
95.2
89.8
HMMC HAOS BHMC HMMR HMMA HMI HMB HMC
(Unit: %)
Securing strong operating profits by maintaining high utilization over all production plants in the globe
Source: Company data

11
4. Brand Enhancement
5,033
6,005
7,473
9,004
10,409
11,293
12,547
65
61
53
43
40 39
35
2010 2011 2012 2013 2014 2015 2016
Enhancement in Brand Value (Ranks)
(Unit: US$ in Millions)
+19%
Brand value has increased an average of 16% each year, since the implementation of Modern Premium in 2011.
Awards and Accolades
+20%
+24%
+16%
+8%
+11%
Date Titles Regions Models
’16.12 Top rank in Auto Bild’s
Quality Report EU Hyundai
’16.12 2017 10 Best Engines Award U.S. 1.4L Kappa Turbo Engine
‘16.11 Achieved maximum 5-star safety
rating from Euro NCAP EU IONIQ
‘16.11 N. America Car & Truck of Year
Top 3 Nominees U.S. G90
‘16.10 5 Star Safety Rating U.S. G80
‘16.09 Best Luxury Sedan Award U.S. G90
‘16.08 Best Buy 2016 Brazil HB20
‘16.07 Int’l Design Excellence Awards U.S. Elantra
‘16.05 2016 SUV of the Year France Tucson
‘16.03 Red Dot Design Award Germany IONIQ
‘16.02 Drivers’ Choice Award U.S. Tucson
‘16.02 iF Design Award 2015 Germany Elantra, Tucson
‘16.01 2016 Car of The Year U.K. i10
‘15.12 2016 10 Best Engines Award U.S. Sonata PHEV
‘15.12 Indian Car of the Year 2016 India Creta
‘15.10 5 Star Safety Rating Award EU Tucson
‘15.10 New Car of the Year China ix25
Source: Interbrand

12
5. Consistent Profitability Relative to Peers
HMC has shown comparable operating performance relative to competitors during the past years
Source: Public filings
Note: Based on consolidated financials, Calendarized financials for Japanese Firms.
Consolidated Operating Margin Trend
10.0%
6.0%
4.9%
5.5%
4.8%
-19.9%
6.3%
9.5%
5.9%
4.7%
6.3%
9.4%
3.3%
5.8%
8.5%
6.3% 5.5% 5.8%
9.6%
1.0% 0.2%
6.9%
-1.9%
6.2%
4.4%
10.3%
3.2%
5.1%
6.0% 5.4%
6.4%
4.1%
8.3%
6.6%
5.1%
1~3Q ‘16 2012 2013 2014 2015
14
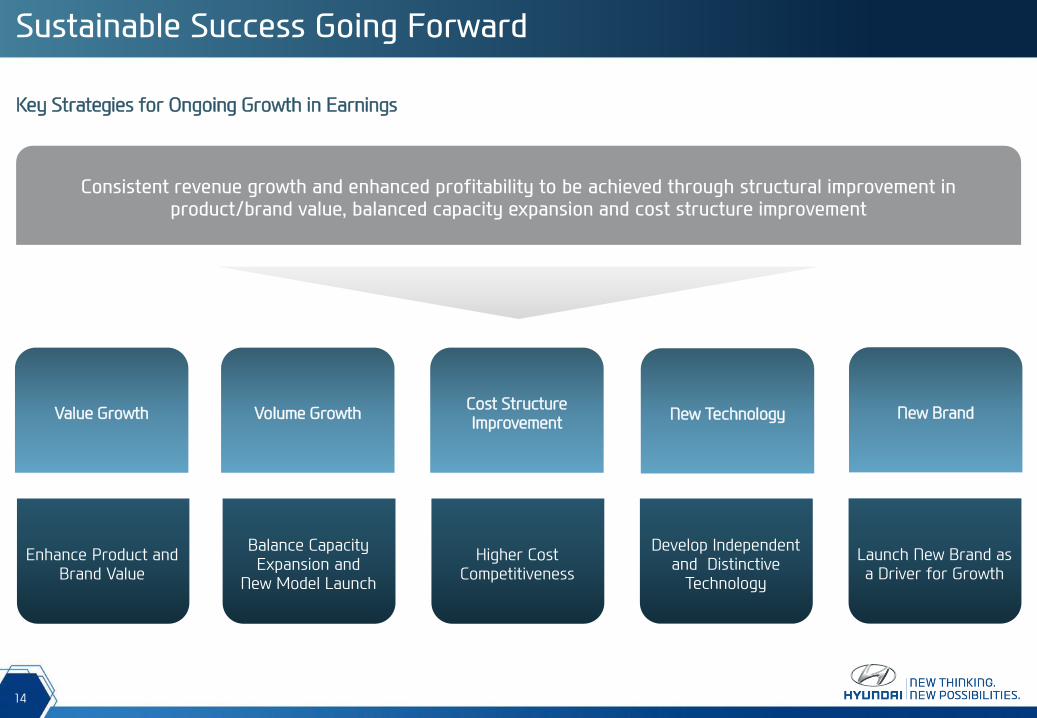
Sustainable Success Going Forward
Key Strategies for Ongoing Growth in Earnings
Consistent revenue growth and enhanced profitability to be achieved through structural improvement in product/brand value, balanced capacity expansion and cost structure improvement
Volume Growth Value Growth Cost Structure Improvement
New Technology
Balance Capacity Expansion and
New Model Launch
Enhance Product and Brand Value
Higher Cost Competitiveness
Develop Independent and Distinctive
Technology
New Brand
Launch New Brand as a Driver for Growth
15
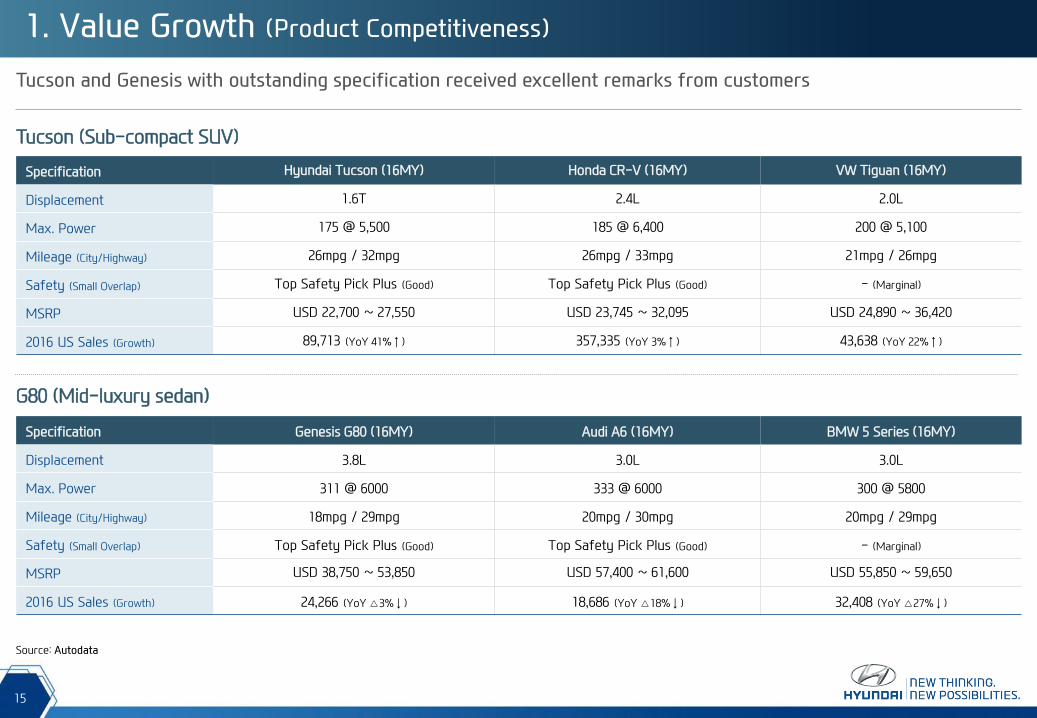
1. Value Growth (Product Competitiveness)
Tucson and Genesis with outstanding specification received excellent remarks from customers
Tucson (Sub-compact SUV)
G80 (Mid-luxury sedan)
Specification Hyundai Tucson (16MY) Honda CR-V (16MY) VW Tiguan (16MY)
Displacement 1.6T 2.4L 2.0L
Max. Power 175 @ 5,500 185 @ 6,400 200 @ 5,100
Mileage (City/Highway) 26mpg / 32mpg 26mpg / 33mpg 21mpg / 26mpg
Safety (Small Overlap) Top Safety Pick Plus (Good) Top Safety Pick Plus (Good) - (Marginal)
MSRP USD 22,700 ~ 27,550 USD 23,745 ~ 32,095 USD 24,890 ~ 36,420
2016 US Sales (Growth) 89,713 (YoY 41%↑) 357,335 (YoY 3%↑) 43,638 (YoY 22%↑)
Specification Genesis G80 (16MY) Audi A6 (16MY) BMW 5 Series (16MY)
Displacement 3.8L 3.0L 3.0L
Max. Power 311 @ 6000 333 @ 6000 300 @ 5800
Mileage (City/Highway) 18mpg / 29mpg 20mpg / 30mpg 20mpg / 29mpg
Safety (Small Overlap) Top Safety Pick Plus (Good) Top Safety Pick Plus (Good) - (Marginal)
MSRP USD 38,750 ~ 53,850 USD 57,400 ~ 61,600 USD 55,850 ~ 59,650
2016 US Sales (Growth) 24,266 (YoY △3%↓) 18,686 (YoY △18%↓) 32,408 (YoY △27%↓)
Source: Autodata

16
Transaction prices of major models in the US market have improved with structural improvement
Transaction Prices in the US Market
Compact Sedan (Unit: USD 1,000)
Mid-size Sedan Compact SUV
26.0
29.8
30.3
30.7
30.7
30.2 30.4
26.7
27.6 27.8
28.1
2010 2011 2012 2013 2014 2015
Santa Fe Cherokee Equinox
18.3
23.6
24.2
25.1
21.2
23.9
23.5 23.8
22.7
25.0
24.3 24.2
2008 2009 2010 2011 2012 2013 2014 2015
Sonata Camry Accord
15.4
19.9
20.2 20.1
17.4
18.6
19.1 18.9
18.7
19.5
19.4 19.4
2008 2009 2010 2011 2012 2013 2014 2015
Elantra Corolla Civic
1. Value Growth (Higher Transaction Price)
Source: PIN data (Annual average transaction price in the US market)

17
2. Volume Growth
HMC’s global sales to increase with capacity expansions
Capacity Expansion and Sales Plan
Source: Company data * Above sales figures are based on shipments ** BHMC : Beijing-Hyundai Motor Company (excluding China #5 plant to operate in end-2017) / Others : Sichuan-Hyundai Motor Company, Others
Production Capacity Expansion Sales Plan by Plants
(Unit: 1,000 Vehicles) 2015 2016 2017 (P) 2016 2017 (P) Change (%)
Korea 1,870 1,870 1,870 1,667 1,748 +4.9
China (BHMC) 1,050 1,100 1,250 1,142 1,250 +9.5
India 650 650 650 662 672 +1.5
US 370 370 370 387 380 -1.7
Czech 300 300 300 358 350 -2.4
Turkey 200 200 200 230 230 +0.0
Russia 200 200 200 207 228 +9.9
Brazil 170 170 170 161 177 +9.6
Others 55 55 55 43 45 +4.6
Overseas 2,995 3,045 3,195 3,191 3,332 +4.4
Total 4,865 4,915 5,065 4,858 5,080 +4.6

40
33
19
2002 2009 2013
18
Platform integration will reduce development costs and deliver greater economies of scale
Integration Schedule Reduction of Model Development Time
Models per Type of Platform Increasing portion of models with integrated platform
2002 2009 2011 2015
Integrated Platforms 0 6 6 6
Total No. of Platforms 22 18 11 6
Total No. of Models 28 32 36 48
Avg. of 40 months → 19 months
Source: Company Data
Micro-Small Small-Mid Mid-Large LCV FR-Mid FR-Large
Mass Production
New 91%
Old 9%
2014 2012
Old 38%
New 75%
Old 25%
2015
New 87%
Old 13%
3. Cost Structure Improvement (Platform Integration)
Niche Market
Platform Integration
19
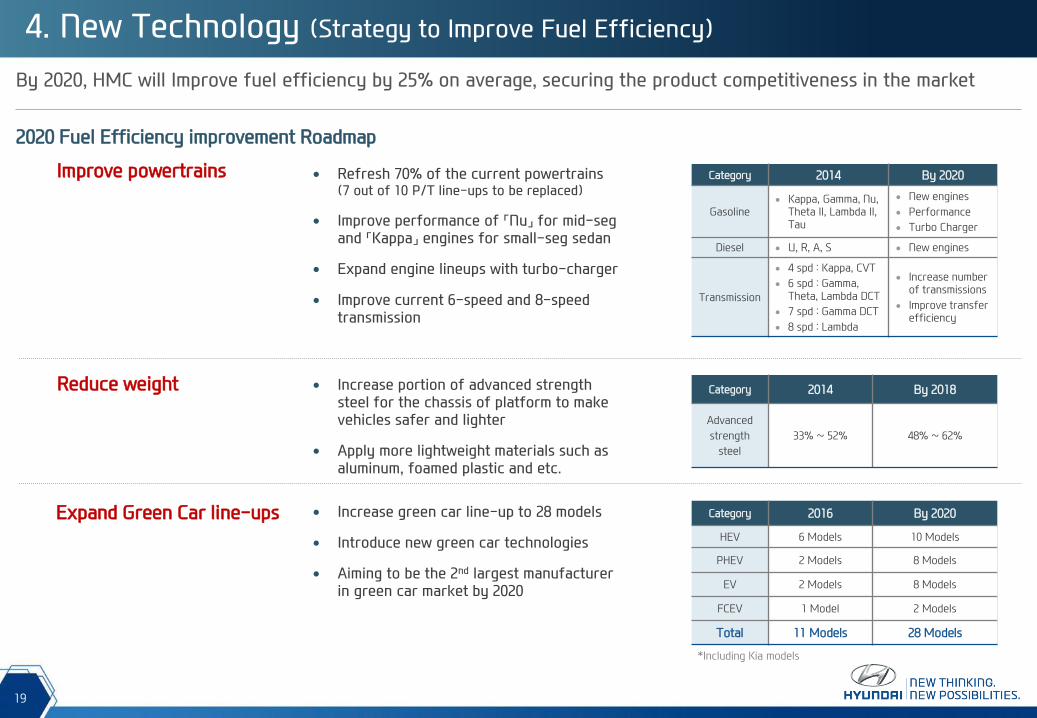
By 2020, HMC will Improve fuel efficiency by 25% on average, securing the product competitiveness in the market
2020 Fuel Efficiency improvement Roadmap
Improve powertrains
Reduce weight
Expand Green Car line-ups
Refresh 70% of the current powertrains (7 out of 10 P/T line-ups to be replaced)
Improve performance of 「Nu」 for mid-seg and 「Kappa」 engines for small-seg sedan
Expand engine lineups with turbo-charger
Improve current 6-speed and 8-speed transmission
Increase portion of advanced strength steel for the chassis of platform to make vehicles safer and lighter
Apply more lightweight materials such as aluminum, foamed plastic and etc.
Increase green car line-up to 28 models
Introduce new green car technologies
Aiming to be the 2nd largest manufacturer in green car market by 2020
Category 2014 By 2020
Gasoline Kappa, Gamma, Nu,
Theta II, Lambda II, Tau
New engines
Performance
Turbo Charger
Diesel U, R, A, S New engines
Transmission
4 spd : Kappa, CVT
6 spd : Gamma, Theta, Lambda DCT
7 spd : Gamma DCT
8 spd : Lambda
Increase number of transmissions
Improve transfer efficiency
Category 2014 By 2018
Advanced
strength
steel
33% ~ 52% 48% ~ 62%
Category 2016 By 2020
HEV 6 Models 10 Models
PHEV 2 Models 8 Models
EV 2 Models 8 Models
FCEV 1 Model 2 Models
Total 11 Models 28 Models
*Including Kia models
4. New Technology (Strategy to Improve Fuel Efficiency)

20
Mid / Long-term Green Car Development Strategy
Combustion
Electric
Combustion + Electric
Green Car Development Trend
Establish a flexible platform to swiftly react to market changes
[Fuel]
Respond to fuel efficiency regulations
Secure competitive fuel efficiency
Lead regulation / green car Technology
[Size]
Small
Mid
Large
Expand Green Car line-up to 28 models by 2020 to become the world's 2nd largest manufacturer of green cars
Line-up Strategy
Category 2016 By 2020
Rank 4th 2nd
Number of Green Cars
11 models 28 models
4. New Technology (Green Car Development Roadmap)
Low-mid
Mid
New Car Launch Mid-large

21
Electric Motor
Powered by advanced lithium-ion battery
4. New Technology (HEV)
HMC independently developed and obtained distinctive technology on hybrid system
Hybrid Vehicle Gradual expansion of HEV applied automotives (mid-size, SUV,
heavy vehicles)
Enhancing fuel efficiency (Top level)
Focusing on HEV system improvement and obtaining distinctive components technology
Introduced HEV dedicated model, IONIQ HEV in January 2016
Parallel Hybrid Drive System
Simpler in structure compare with other
types of hybrid
HEV Performance Comparison
Source: Company data
Specification Hyundai IONIQ (Blue) Toyota Prius (Eco) Ford C-Max
Net Power 141 ps 121 ps 141 ps
Battery (kWh) 1.56 LiPo 0.75 Li 1.40 Li
Fuel Efficiency (combined) 58 mpg 56 mpg 39 mpg
System Parallel System Power Split System Power Split System
Developing Green Cars : HEV
IONIQ HEV
Displacement : 1.6ℓ
Net Power : 141 ps
Fuel Efficiency : 58 mpg
Launched in 2016
Hybrid Vehicle Strategy
22
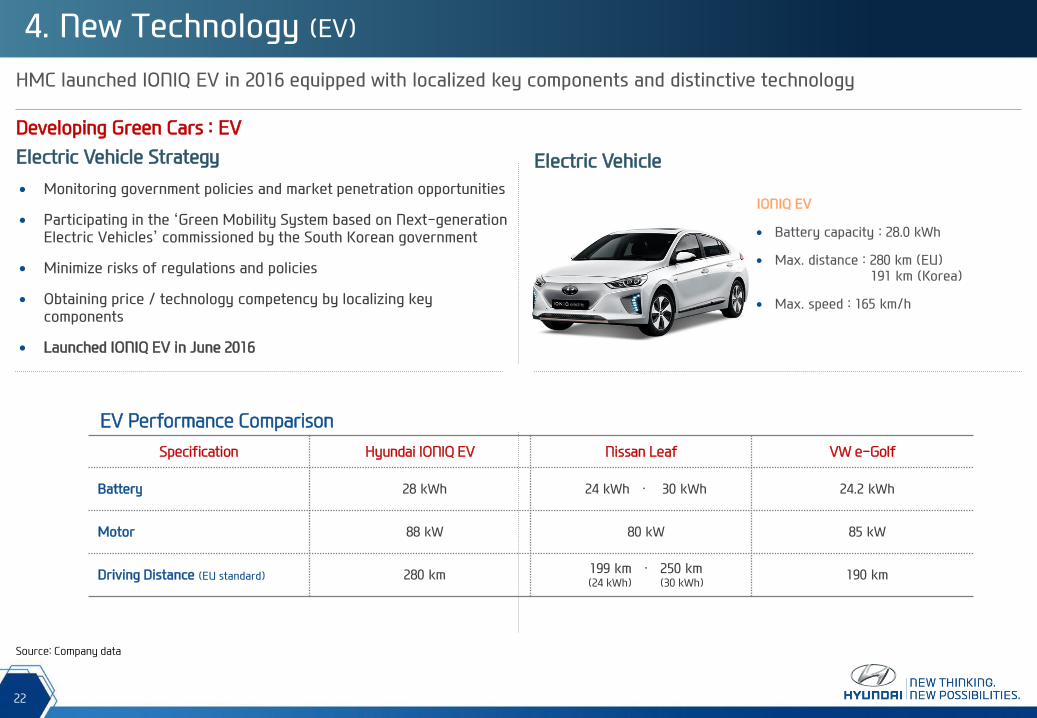
4. New Technology (EV)
HMC launched IONIQ EV in 2016 equipped with localized key components and distinctive technology
Developing Green Cars : EV
Electric Vehicle Strategy Electric Vehicle
IONIQ EV
Battery capacity : 28.0 kWh
Max. distance : 280 km (EU) 191 km (Korea)
Max. speed : 165 km/h
Monitoring government policies and market penetration opportunities
Participating in the ‘Green Mobility System based on Next-generation Electric Vehicles’ commissioned by the South Korean government
Minimize risks of regulations and policies
Obtaining price / technology competency by localizing key components
Launched IONIQ EV in June 2016
Source: Company data
EV Performance Comparison
Specification Hyundai IONIQ EV Nissan Leaf VW e-Golf
Battery 28 kWh 24 kWh · 30 kWh 24.2 kWh
Motor 88 kW 80 kW 85 kW
Driving Distance (EU standard) 280 km 199 km · 250 km (24 kWh) (30 kWh)
190 km

23
4. New Technology (FCEV)
Year Program
2006 - Operated Demonstration program in collaboration with
Korean Government
2004 ~ 2009 - Participated in North America FCEV demonstration
program led by the U.S. Department of Energy
2012 - Participated FCEV demonstration programs operated by
European Government(Norway, Sweden, Denmark, Iceland)
2013 - Began to deliver FCEV to city of Copenhagen, Denmark and
Skåne, Sweden, etc.
2014 - Began to deliver FCEV to retail customers
HMC has strengthened its reputation as a technology leader through the world’s first mass production of FCEV
Developing Green Cars : FCEV
Fuel Cell Electric Vehicle FCEV Vehicle
Development Roadmap Major Participation in Demonstration Program
Tucson ix FCEV
Max. distance: 415 km
Max. speed: 160 km/h
Fuel efficiency: 76.8km/kg
World’s 1st mass production in Mar ‘13 HMC Toyota Honda Daimler
Production year 2013 2015 2016 2017(E)
Phase 1 (- 2006) — Develop
Stack Technology
Phase 2 (2007-2011) — Improve
Performance
Phase 3 (2012-) — Commence
Small Production
Santa Fe FCEV
Tucson FCEV
Fuel Cell Electric Bus
Tucson FCEV (2nd Gen.)
Fuel Cell Electric Bus (2nd Gen.)
Tucson ix FCEV (3rd Gen.)
Began production of Tucson ix FCEV
Source: Company data
Assuring “FCEV Leading Maker” position by participating in the demonstration program
Major components are independently developed, i.e. “FCEV Stack”
The first auto maker to successfully begin commercial production several years ahead of competitors

24
4. New Technology (Autonomous vehicle)
HMC targeted to commercialize fully autonomous driving vehicles by 2030
Development Philosophy
Level 1 & Level 2
Development status Levels of Driving Automation (SAE)
“Intelligent Safety Vehicle”
Automated Lane Change
Intersection Entry/Exit
Highway TG Entry/Exit
HDA (Highway Driving Assist)
TJA (Traffic Jam Assistance)
Advanced Driver Assistance System
Level 3
Provide ultimate safety not only to the driver but also to the passengers / pedestrians / other drivers, by having vehicle proactively analyzing driving environments and assist driver when necessary
Lev. Definition Note
5 Full Automation In advanced research
4 High Automation First show in CES 2017
3 Conditional Automation Completed advanced
development
2 Partial Automation Partially in market (HDA, etc.)
1 Driver Assistance In market (LKAS, SCC, AEB, etc.)
*SAE (Society of Automotive Engineers) : 미국자동차기술자협회
25
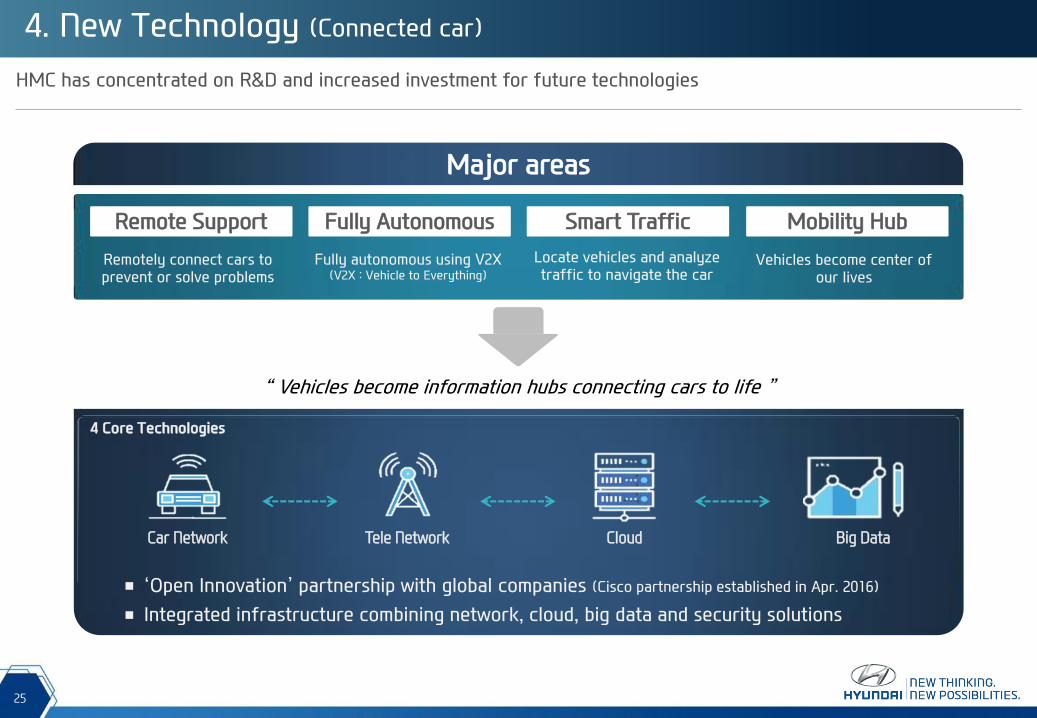
4. New Technology (Connected car)
HMC has concentrated on R&D and increased investment for future technologies
Remote Support Fully Autonomous Smart Traffic Mobility Hub
Major areas
Remotely connect cars to prevent or solve problems
Fully autonomous using V2X (V2X : Vehicle to Everything)
Locate vehicles and analyze traffic to navigate the car
Vehicles become center of our lives
Car Network Tele Network Cloud Big Data
■ ‘Open Innovation’ partnership with global companies (Cisco partnership established in Apr. 2016)
■ Integrated infrastructure combining network, cloud, big data and security solutions
4 Core Technologies
“ Vehicles become information hubs connecting cars to life ”

26
HMC introduced new global luxury brand ‘Genesis’ as a driver for growth
Why Genesis?
Unlock the untapped profit opportunity Elevate entire brand and organization
10.4 10.3
7.5 6.2
5.1 5.1 5.0 4.4
3.2 2.4
-1.9
BMW Toyota Daimler Nissan Ford Renault PSA Honda GM FCA VW
Penetrating fast growing premium market Establish virtuous business circle
5.8 6.5 7.0 7.6
8.3 8.8 9.2 9.5 9.8 10.3 10.7
2010 2011 2012 2013 2014 2015 2016 2017 2018 2019 2020
(Unit : millions)
Source: IHS, Company data
5. New Brand (Introduction of Genesis)

27
Genesis Brand to achieve full line-up of 6 models by 2020
Genesis 1st gen. (Hyundai)
Genesis 2nd gen. (Hyundai)
Launched Genesis brand & EQ900 (G90)
G80 (Genesis)
Phase 3 (‘ 21 ~ ) Phase 2 ( ~ ‘ 20) Phase 1 ( ~ ‘17)
Line-up : 3 models
Sales Channel Share existing sales network
and resources
Line-up : 6 models
Sales Channel Selectively open exclusive dealers and operate online sales channel
Line-up : Diversify powertrain
Sales Channel Separately operate exclusive dealers
2008 2013 2015 2016
History
Roadmap
5. New Brand (Strategy of Genesis)

28
N will bring racetrack-capable vehicles to customers who truly love cars
5. New Brand (High Performance Vehicle, N sub-brand)
Three Principles of N brand Major Concept Models
RM16
Displacement: 2.0T GDI
Max. Power: 300 PS
Max. Torque: 39kg.m
N 2025 Vision Gran Turismo
Displacement : Hydrogen Fuel Cell
Max. Power: 884 PS
Balanced Performance
Delivers the value of harmonized performance
Emotional Delight
Maximize driver’s emotional delight of driving
Inspired Technology
Technology originated from WRC
RM14 Concept RM 16 Concept
Vision Gran Turismo
Introduce N sub-brand
Project RM (Racing Midship)
Inception of R&D N sub-brand launch
2014 2015 2012 - 2016 2017
1st N sub-brand model to be launched


30
Korea
Sales and M/S Trend (Retail Sales) (Unit: 1,000 vehicles)
1,579 1,542 1,539
1,660
1,834 1,821
43.3% 43.3% 41.6% 41.3%
38.9% 36.1%
2011 2012 2013 2014 2015 2016
Industry M/S
170 162 136 125 123 120
250 231
209 251 250 220
77 112 135
133 163
143
185 162 161
174 176
174
2011 2012 2013 2014 2015 2016
CV RV Mid + Large PV Small PV
682 667 641
684
Market Strategy
Corresponding Measures on Increase of Imported Vehicles 712
Source: KAMA, Company data
New Model Launch
IONIQ HEV (Jan 2016) : Green-car dedicated new model should reinforce our green car market presence
IONIQ EV (Jun 2016) : EV version of IONIQ
Grandeur (Nov 2016) : One of our best selling sedan has been refreshed
New SUV-B model and Genesis G70 will be launched in 2017
Increase Line-ups
Improve technology
Enhance Competitiveness
Introduction of premium brand the Genesis
New SUV model launch will help to improve model mix
Diversify power train and green car technology
Maintain high standard of quality
Test drive for comparison with imported model
Develop features for customers
657

31
United States
Source: Company data
(Unit: 1,000 vehicles)
251 298
339 313 327 318
264
277 251
258 253 236
131
128 131 155 182 221
2011 2012 2013 2014 2015 2016
RV Mid + Large PV Small PV
646
703 721
Market Strategy
New Model Launch
Premium Vehicle Sales
12,778 14,492
15,600 16,522 17,479 17,550
5.1% 4.9% 4.6% 4.4% 4.4% 4.4%
2011 2012 2013 2014 2015 2016
Industry M/S
13,604
16,448 18,850
22,687
19,804 19,133
24,917 24,266
3,193 3,972 3,578 3,415 2,332 2,143
5.6% 6.3%
7.6% 7.8% 7.0% 7.2%
10.4% 11.6%
5.7% 7.1%
6.1% 5.0% 3.7%
3.2%
2009 2010 2011 2012 2013 2014 2015 2016
G80 G90 G80 M/S G90 M/S
726 762
Sales and M/S Trend (Retail Sales)
Elantra (Feb 2016) : One of the best selling sub-compact sedan was refreshed in 1Q of 2016
Santa Fe (Jun 2016) : Start of production from HMMA
G90 (Sep 2016) : Introduction of all new model from Premium brand ‘Genesis’
(Unit: vehicle)
775

32
Europe
Sales and M/S Trend (Retail Sales) (Unit: 1,000 vehicles)
Market Strategy
15,264 13,960 13,771
14,543 15,968 17,072
2.6%
3.2% 3.0% 3.0% 2.9% 2.9%
2011 2012 2013 2014 2015 2016
Industry M/S
142 147 141 164 180 187
102 109 101 82
91 81
139 145
135 144
162 204
20 43
30 28
26
24
2011 2012 2013 2014 2015 2016
A+B seg C seg RV D seg & Others
403
444
407 417
458
Source: Company data
Tucson Sales Trend
Direct 69%
Direct 76%
Indirect 24%
55,768
75,538 86,787 86,573
94,166
113,923
155,389
15.4%
18.7% 19.5% 21.2%
22.6%
24.9%
31.3%
2010 2011 2012 2013 2014 2015 2016
Tucson % of Europe sales
Improve sales capability by strengthening finance services and introduce all new i30
Green-car dedicated new model, IONIQ HEV and EV will reinforce our green car market presence
Expand dealer exposure to major cities and improve facilities of existing dealers with applying GDSI
Improve brand value through FCEV, participation in WRC and launching N sub-brand
(Unit: vehicle) 496

472 567 611 653
537 568
113
117 136
200
230 190 154
172
284
268 296
385
2011 2012 2013 2014 2015 2016
Small PV Mid PV SUV
33
China
Source: Company data * Market demand based on Passenger Vehicle, ** Sales data based on factory sales
Sales and M/S Trend (Unit: 1,000 vehicles)
1,063
740
856
1,031
11,935
14,913
17,371 19,232
20,819 23,834
6.2% 5.7% 5.9% 5.8%
5.1% 4.8%
2011 2012 2013 2014 2015 2016
Industry M/S
1,120
Market Strategy
New Model Launch
Strategic Models Sales Trend
1,014 960 805 880
17 135
155 148
25
103 113
2013 2014 2015 2016
ix25 Mistra Global Models
Lingdong (Mar 2016) : One of the best selling sedan
Sonata HEV (Jun 2016) : The launch of 1st green car model from local production
Yuena (Oct 2016) : The C1 segment sedan has been refreshed with the start of China 4th plant
Yuedong (Mar 2017) : Our one of best selling strategic sedan (C2-seg) will build another sales momentum
In 2017, three different strategic models will be launched including Yuedong.
1,142
34
New Model Launch Schedule
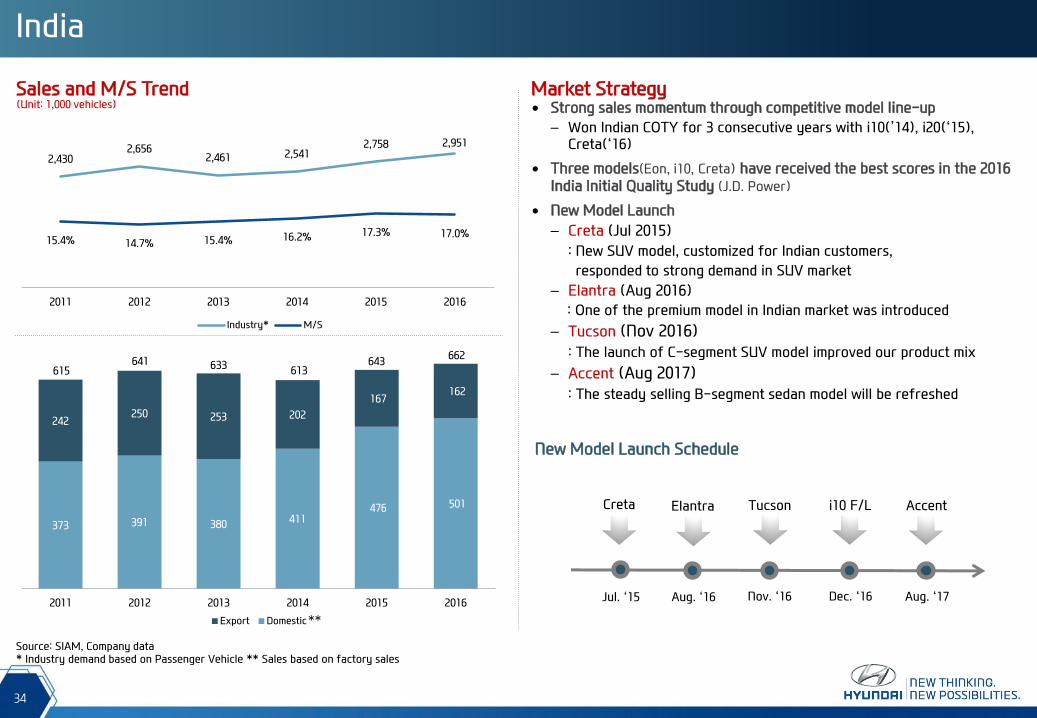
India
Source: SIAM, Company data * Industry demand based on Passenger Vehicle ** Sales based on factory sales
Sales and M/S Trend (Unit: 1,000 vehicles)
2,430 2,656
2,461 2,541 2,758 2,951
15.4% 14.7% 15.4% 16.2% 17.3% 17.0%
2011 2012 2013 2014 2015 2016
Industry* M/S
373 391 380 411 476 501
242 250 253 202
167 162
2011 2012 2013 2014 2015 2016
Export Domestic**
643 615
641 633 613
Market Strategy
Creta
Jul. ‘15
Aug. ‘16
Elantra
Nov. ‘16
Tucson
Dec. ‘16
i10 F/L
Strong sales momentum through competitive model line-up
– Won Indian COTY for 3 consecutive years with i10(’14), i20(‘15), Creta(‘16)
11
Three models(Eon, i10, Creta) have received the best scores in the 2016 India Initial Quality Study (J.D. Power) 1
New Model Launch
– Creta (Jul 2015)
: New SUV model, customized for Indian customers,
responded to strong demand in SUV market
– Elantra (Aug 2016)
: One of the premium model in Indian market was introduced
– Tucson (Nov 2016)
: The launch of C-segment SUV model improved our product mix
– Accent (Aug 2017)
: The steady selling B-segment sedan model will be refreshed
662
Aug. ‘17
Accent

35
185 208
253 292
316
419 448
482 495 500 481
407
2005 2006 2007 2008 2009 2010 2011 2012 2013 2014 2015 2016
Other Emerging Markets
Achieving a consistent sales volume growth over the years
Africa-middle East and LatAm
Sales Breakdown by Major Emerging Markets
Sales Volume (000’s)
Korea 13.4%
North America 18.6%
Europe 13.6%
China & India 33.2%
Latin America 6.8%
Asia-Pacific 4.3%
Africa-Middle East 8.3%
Turkey 1.1%
Africa & Middle East
Latin America
177 185
237 258 268
363 367 337 336
37 67 80 85 80
188 195 176 170
2008 2009 2010 2011 2012 2013 2014 2015 2016
South America BrazilSource: Company data, 2016 HMC Global Retail Sales (exclude CKD sales)

37
Balance Sheet (K-IFRS Consolidated)
(Billion KRW) End - 2015 End - 2016 diff. chg.
Assets 165,368 178,836 +13,468 +8.1%
Current Assets(a) 67,529 72,450 +4,920 +7.3%
Liabilities(b) 98,487 106,491 +8,005 +8.1%
Current Liabilities(c) 41,214 43,610 +2,396 +5.8%
Debt(d) 64,932 73,444 +8,512 +13.1%
Provision 6,742 6,973 +231 +3.4%
Equity(e) 66,881 72,345 +5,463 +8.2%
Capital Stock 1,489 1,489 - +0.0%
Capital Surplus 3,520 4,203 +682 +19.4%
Retained Earnings 60,035 64,361 +4,326 +7.2%
Current Ratio(a/c) 163.9 % 166.1 %
Liability to Equity(b/e) 147.3 % 147.2 %
Debt to Equity(d/e) 97.1 % 101.5 %
EBITDA / Interest Expenses 35.3 x 31.4 x

38
Income Statement (K-IFRS Consolidated)
(Billion KRW) ‘15. 4Q ‘16. 1Q ‘16. 2Q ‘16. 3Q ‘16. 4Q yoy qoq
Revenue 24,765 22,351 24,677 22,084 24,538 △0.9% +11.1%
Gross Profit 4,719 4,239 5,023 3,894 4,533 △3.9% +16.4%
Margin (%) 19.1 19.0 20.4 17.6 18.5
SG&A 3,204 2,897 3,261 2,826 3,512 +9.6% +24.3%
Portion (%) 12.9 13.0 13.2 12.8 14.3
Operating Income 1,515 1,342 1,762 1,068 1,021 △32.6% △4.4%
Margin (%) 6.1 6.0 7.1 4.8 4.2
Income before tax 2,063 2,163 2,382 1,495 1,267 △38.6% △15.2%
Margin (%) 8.3 9.7 9.7 6.8 5.2
Net Income 1,529 1,768 1,764 1,119 1,069 △30.1% △4.5%
Margin (%) 6.2 7.9 7.1 5.1 4.4
Depreciation 515 529 527 537 573
Amortization 243 273 284 304 334
EBITDA 2,273 2,144 2,573 1,908 1,927