investor presentation - gerresheimer
TRANSCRIPT

Investor Presentation
October 2020

This presentation may contain certain forward-looking statements, including assumptions, opinions and views of the
Company or cited from third party sources. Various known and unknown risks, uncertainties and other factors could
cause the actual results, financial position, development or performance of the Company to differ materially from the
estimations expressed or implied herein.
The Company does not guarantee that the assumptions underlying such forward-looking statements are free from
errors nor does the Company accept any responsibility for the future accuracy of the opinions expressed in this
presentation or the actual occurrence of the forecast development.
No representation or warranty (express or implied) is made as to, and no reliance should be placed on, any
information, including projections, estimates, targets and opinions, contained herein, and no liability whatsoever is
accepted as to any errors, omissions or misstatements contained herein, and, accordingly, none of the Company or
any of its parent or subsidiary undertakings or any of such person‘s officers, directors or employees accepts any
liability whatsoever arising directly or indirectly from the use of this document.
Disclaimer
Investor Presentation 213.10.2020

3
Gerresheimer at a Glance
Strategic Direction
Q3 Earnings Review
Outlook and Executive Summary
Market Environment
3
2
1
Agenda
4
5

Pharmaceutical solutions made of glass and plastics
Primary packaging products and medical devices for storage, dosage and safe administration
of drugs as well as packaging for the cosmetics industry
A leading partner for the global pharma and healthcare industry
Gerresheimer at a Glance
4Investor Presentation13.10.2020

Solid Financial Profile
Gerresheimer at a Glance
5
Advanced Technologies
(GAT)
Dedicated to developing and
producing intelligent drug delivery
systems and value added devices
Technology & Platform Operator
Own R&D capabilities
Contract Design Manufacturing
Medical Devices (incl. tooling)
Primary Packaging Plastics
Prescription Business
(Centor, US)
Syringes Systems
Plastics & Devices
(P&D)
Revenues 2019
EUR 758.3mAdj. EBITDA 2019
EUR 196.4mRevenues 2019
EUR 6.4m
Adj. EBITDA 2019
EUR -23.4m
Moulded Glass Pharma
Moulded Glass Cosmetics
(incl. Beverages)
Tubular Glass Pharma
(Converting)
Primary Packaging Glass
(PPG)
Revenues 2019
EUR 631.6mAdj. EBITDA 2019
EUR 122.9m
Gerresheimer Group (incl. headquarters)
Leverage at 3.2xas of May 31, 2020
Adj. EBITDA 2019
EUR 297mRevenues 2019
EUR 1.40bn
Investor Presentation13.10.2020

Global Footprint and Solid Customer Base
Gerresheimer at a Glance
6
Global footprint
37 plants in
15 countries
Delivering to
91 countries over 6
continents
Over
1,500customers
Supplying all
Top 10 Pharma customers
Largest customer makes up for ~7% of total revenues
REVENUE SPLIT BY REGIONS
Europe (ex. GER): 33%
Germany: 22%
Americas: 27%
Emerging markets1: 16%
Other regions: 1%
33%
22%
27%
16%1%
REVENUE SPLIT BY SECTOR
Pharma & Healthcare: 81%
Cosmetics: 13%
Others: 6%
81%
13%
6%
Clearly identified revenues streams
Investor Presentation13.10.2020

15.5bn Products Produced Per Year – Nearly 500 per Second
Gerresheimer at a Glance
INHALERSAMPOULES
7
CARTRIDGESINJECTION VIALS
~ 400m pieces
PLASTIC BOTTLES
(INCL. CENTOR)
PHARMA GLASS
BOTTLES
COSMETICSSYRINGES
~ 5.5bn pcs ~ 2.5bn pcs ~ 1bn pcs
~ 3bn pcs ~ 2bn pcs ~ 100m pcs ~ 1bn pcs
13.10.2020 Investor Presentation

8
Gerresheimer at a Glance
Strategic Direction
Q3 Earnings Review
Outlook and Executive Summary
Market Environment
3
2
1
Agenda
4
5
2
1

Social and Macroeconomic Trends Fostering Growth
Strategic Direction
Rise of chronic diseases
& aging population
Increasing access to healthcare
in Emerging Countries
Growth in urban population
and upper society
New drugs especially
in Biosimilars and Biotech
Increasing trend to self and
individual medication
Increase importance of
sustainability
Faster growth in
generic drugs
Increasing health costs
and stricter regulatory
Growing trend to
consolidation
9Investor Presentation13.10.2020

Clear Definition of Target Markets in Pharma & Healthcare
10
Filling machines
Formulation
PHARMA
VALUE
CHAINResearch
Product &
Process
Development
ProductionPrimary
PackagingLogistics
Marketing &
SalesServices
Delivery
Systems &
Assembly
Blisters
Su
pp
lie
rs
MUST
HAVESSuperior product and
Technologies1 Cost leadership2 Min. #3 for market shares3
HA
RD
WA
RE
CO
NS
UM
AB
LE
SS
ER
VIC
ES
Tools, Assembly lines for devices
Primary packaging glass & plastic,syringes,closures
Inhalation,injection
Device design& dev.
Gx
stra
teg
ic re
leva
nt m
ark
et
(Pre-) assembly
Logistics
Infusion, trans-dermal, implants, eye treatment, ear-nose-throat
Product analytics(e.g. sterility)
Filling
Gx accessible market
Investor Presentation13.10.2020

1. Tubular Glass + Moulded Glass Pharma
2. Strategic relevant markets, Gerresheimer estimates
Gerresheimer is Operating in Large and Attractive Markets
Strategic Direction
11
The strategic relevant core market for Gerresheimer is today ~ € 15bn
CosmeticsGlass
PharmaGlass1
PharmaPlastic
Syringes
Drug DeliveryDevices
~ 1.8
LOW SINGLE DIGIT
~ 2.2 ~ 5.8 ~ 0.9
MID SINGLE DIGIT
~ 4.0Estimated Market
Size 2017² (in € bn)
Market CAGR '17-’22²
(in %)
Investor Presentation13.10.2020

Leading Market Positions in Attractive Niche Markets
Strategic Direction
12
DIVISION PLASTICS & DEVICESPRIMARY
PACKAGING GLASS
PRODUCTPlastic
Packaging1Inhalation
(DPI)2Diabetes
Diagnostics3 PensSyringe
Systems
MG Pharma
(Type I)
Ampoules,Vials,
Cartridges
EUROPE #1 #1 #2 #2 #2 #2 #3
NORTH
AMERICA#1 #1 #2 #1 #1
EMERGING
MARKETS
#1(South America
and India)
#1(South
America)
#2(India)
#1(China)
1. North America: plastic vials for oral prescription drugs
2. DPI = Dry Powder Inhaler (World market)
3. Lancets and lancing devices
Investor Presentation13.10.2020

We provide Solutions across all Key Product Categories
Strategic Direction
13
DIVISION PLASTICS & DEVICES PRIMARY PACKAGING GLASS GAT
PRODUCTPlastic
PackagingInhalation
(DPI)2Diabetes
Diagnostics3 PensSyringe
Systems
MG Pharma
(Type I)
OTC Liquids and
Syrups (Type II &
III)
TGInjectables
Sensile Medical
Gerresheimer ✓ ✓ ✓ ✓ ✓ ✓ ✓ ✓ ✓
Schott ✓ ✓
Becton
Dickinson1 ✓ ✓
Nipro1✓ ✓
Ompi ✓ ✓
Jabil Circuit
(Nypro)1 ✓ ✓ ✓ ✓
Consort Medical1 ✓
West Pharma1✓ ✓
Nemera ✓ ✓
Berry Plastics1✓
Facet ✓
Ypsomed1✓ ✓
Desjonquères ✓ ✓
Rocco Bormioli ✓ ✓ ✓
Insulet ✓
1. Public company // 2. DPI = Dry Powder Inhaler (World market) // 3. Lancets and lancing devices
Source: Company estimates
Investor Presentation13.10.2020

Consider net financial debt to
adjusted EBITDA ratio of 2.5 as
appropriate for Gerresheimer
Temporary variation tolerated in case
of relevant M&A
Committed to investment grade rating
in the long term
Sound Financial Policy
Strategic Direction
14
Focus on Sustainable
and Profitable Growth
ORGANIC INVESTMENT
Capex spend at ~8-10% of sales for
growth and maintenance projects
Controlled capacity extension
Clear payback and IRR criteria
Stringent and selective approach to
acquisitions
Strategic fit, management profile and
financial track record as key initial
considerations
Clear financial guidelines
M&ADIVIDEND
Committed to redistributing profit back
to shareholders
Dividend policy implies payout ratio of
20 -30% of adjusted Net Income after
minorities
RATING & LEVERAGE
Investor Presentation13.10.2020

15
Gerresheimer at a Glance
Strategic Direction
Q3 Earnings Review
Outlook and Executive Summary
Market Environment
3
2
1
Agenda
4
5
3
1

On Track: We Deliver on our Promises
Q3 Earnings Review: Key Take-Aways Q3 2020
16
Third quarter as expected:
accomplishing growth despite Covid-19
Backend-loaded fiscal year: very strong Q4 ahead
Financial highlights in Q3:
Revenues of EUR 349m
Organically +2.1% in core business1
Adjusted EBITDA of EUR 75m, adj. EBITDA margin 21.5%
Strong free cash flow in Q3: EUR 38m representing
strong earnings quality
Guidance confirmed
Pushing forward the implementation of our growth strategy
1. The core business consists of the Plastics & Devices and the Primary Packaging Glass Divisions; for adjusted EBITDA purposes also including head office/consolidation.
Investor Presentation13.10.2020

Gx® Biological Solutions Pushed Forward
Advanced Solutions for Biotechs
17
Dedicated unit with technical
and development expertise
Best possible packaging
configuration
Lab services, regulatory
and qualification support
now available in Europe
and US
Full-service provider for
small, mid and large biotech
companies
The right product solutionsGx® Biological Solutions
serving customers’ needs:
Highly dynamic
market environment
Gx® Biological Solutions:The industry is witnessing a
paradigm shift from small
molecules towards
biologicals and
new modalities
Market for small molecules
will remain strong
The fast-growing
biologicals
sector will generate
significant growth
opportunities for
Gerresheimer
Serving biotech customers
with the whole Gerresheimer
portfolio
Main contributors for growth:
RTF vials
Elite vials
RTF syringes
Investor Presentation13.10.2020

Further Capacity Increase for Vials and Syringes Fully Ongoing
Gx as Reliable Partner for Pharma and Healthcare
18
Capacity increase to serve
global demand
Clearly standing by
our responsibility
Growing injectables market as
global mega trend
Investments brought forward:
Vials: New machines being
installed, including new RTF
vials machine in Buende
Syringes: RTF 5 line
ramping up, RTF 6 line to
start production mid-2021
Vaccination as global
mega trend
Covid-19 is expected to
boost the market
Therapeutics are switching
from chemical to biological
Recurrent vaccination
increases demand
for syringes
Assumption for Covid-19
vials proving conservative
Global demand of 2-3bn
units for Covid-19
vaccination in 2021/2022
Customers demanding
single and multi-dose vials
At least 800m units foreseen
to be delivered over the next
two years
Investor Presentation13.10.2020
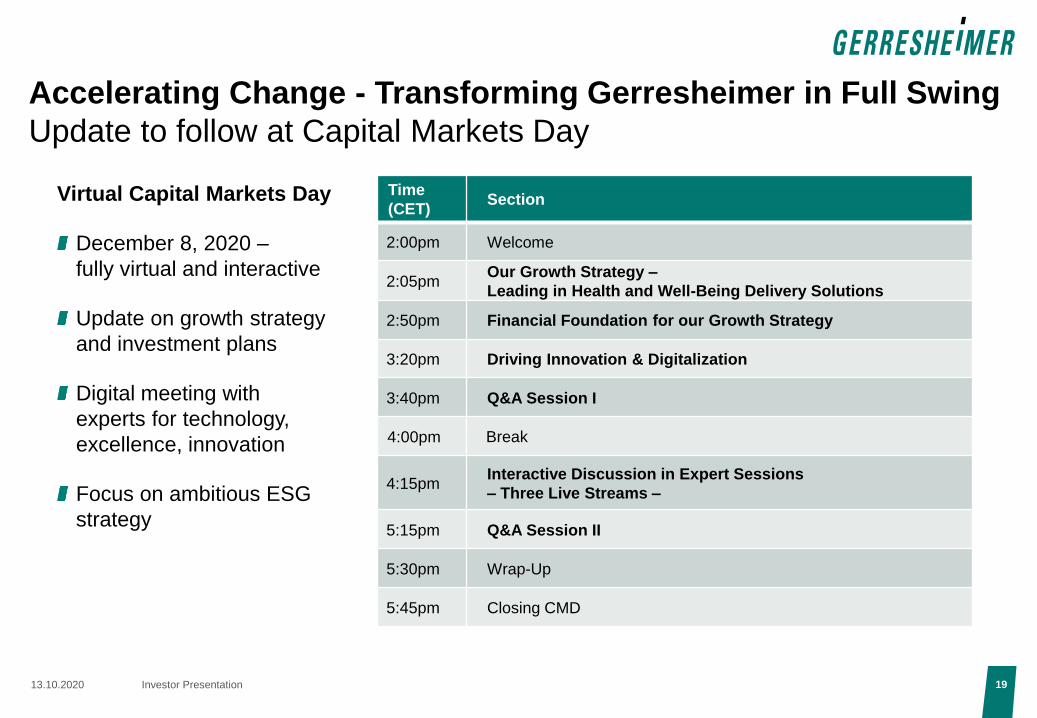
Accelerating Change - Transforming Gerresheimer in Full Swing
Update to follow at Capital Markets Day
19
Time
(CET)Section
2:00pm Welcome
2:05pmOur Growth Strategy –
Leading in Health and Well-Being Delivery Solutions
2:50pm Financial Foundation for our Growth Strategy
3:20pm Driving Innovation & Digitalization
3:40pm Q&A Session I
4:00pm Break
4:15pmInteractive Discussion in Expert Sessions
– Three Live Streams –
5:15pm Q&A Session II
5:30pm Wrap-Up
5:45pm Closing CMD
Virtual Capital Markets Day
December 8, 2020 –
fully virtual and interactive
Update on growth strategy
and investment plans
Digital meeting with
experts for technology,
excellence, innovation
Focus on ambitious ESG
strategy
Investor Presentation13.10.2020

Q3 2020 – Solid Basis Anticipating Very Strong Q4
P&L Overview
20
(EUR m) Q3 2020 Q3 2019 YoY Analysis
Revenues 349.2 358.6 0.4%1)
Organic growth of +2.1% in core
business including temporary Covid-19
one-time hit in cosmetics of a mid-single
digit Euro amount
Adj. EBITDA 75.0 72.2 1.8%1)
Profitability increase due to good core
business performance; excellent organic
growth of +8.6% in core business
One-off effects 3.1 -1.1
EBITDA 78.1 71.1
Depreciation, amortization & impairment -34.3 -37.3 Due to lower fair value amortization
Net finance expense -5.5 -7.0
Income taxes -12.7 -7.8
Net income 25.6 19.0
Adjustment 5.1 11.7
Adj. net income 30.7 30.7
Adj. EPS 0.97 0.96
1. Organically, adjusted for exchange rate effects and acquisitions and divestments as well as regarding adj. EBITDA excluding the effects from the first-time application of
IFRS 16.
Investor Presentation13.10.2020

Robust Core Business: Organic Growth Despite Covid-19
Q3 2020 Divisions
21
EUR m
45.7
52.1
Q3 2019 Q3 2020Adj. EBITDA
P&D
Organic
growth
+4.3%193.7 193.8
Q3 2019 Q3 2020Revenues
Organic
growth
+13.5% — Strong growth in PPP and syringes, short-term
phasing effects in MDS
— Margin improvement to 26.9% on the back of
organic adj. EBITDA growth of 13.5%
30.131.9
Q3 2019 Q3 2020Adj. EBITDA
PPG
Organic
growth
-0.5%159.2
155.8
Q3 2019 Q3 2020Revenues
Organic
growth
+3.5%— Negative Covid-19 one-time hit of around
EUR 6m in the cosmetics business
— Organic revenue growth of +5% disregarding the
cosmetic business
— Margin improvement to 20.5% on the back of
organic adj. EBITDA growth of 3.5%
6.3
0.6
Q3 2019 Q3 2020
Revenues
Q3 2019 Q3 2020
Adj. EBITDA
GAT
— Advanced Technologies as innovation driver and
long-term investment case
— Change of revenue model: From contract
developer for PharmaCo to a revenue sharing
partner of PharmaCo
1.8
-2.7
Investor Presentation13.10.2020

Outperformance in Free Cash Flow
Cash Flow in Q3 2020
22
(EUR m) Q3 2020 Q3 2019 Change Analysis
Adjusted EBITDA 75.0 72.2 2.8 Driven by good core business
Change in net working capital 4.7 -12.4 17.1Focus on operational Working Capital
performance
Net capex -28.8 -43.6 14.8 Supported by sale of Kuessnacht site
Net interest paid -2.3 -2.4 0.1
Net taxes paid -8.2 -8.2 -
Pension benefits paid -2.4 -3.2 0.8
Other -0.3 -5.2 4.9
Free Cash Flow before M&A 37.7 -2.8 40.5
Investor Presentation13.10.2020

Leverage Stable – Promissory Note Agreement Signed
End of Q3 2020: Financial Status
23
NET FINANCIAL DEBT AND ADJ. EBITDA LEVERAGE
Net financial debt according to the credit agreement in force1)
Adj. EBITDA leverage (x)
976.0 980.7
May 31 2020 Aug 31 2020
3.2 3.2
NET FINANCIAL DEBT ACCORDING TO CREDIT
AGREEMENT IN FORCE1)
In EUR m May 2020 Aug 2020
Revolving credit facility 360.2 365.5
Promissory loans (2017) 250.0 250.0
Promissory loans (2015) 425.0 425.0
Local borrowings 33.1 33.6
Installment purchase liabilities 1.7 1.7
Cash and cash equivalents (94.0) (95.1)
Net financial debt according to credit
agreement in force1) 976.0 980.7
EXPIRY DATE MAIN FACILITIES
550.0
189.5
305.5
109.0
25.545.5
FY 2020 FY 2021 FY 2022 FY 2023 FY 2024 FY 2025 FY 2026 FY 2027
RCF Promissory loans
— Successful refinancing the promissory loans maturing
in November 2020
— EUR 325m promissory loan agreement signed
— Conditions towards former promissory loan improved
— Highly oversubscribed: sustained confidence in
Gerresheimer’s business model
— Closing expected for early November 2020
STATUS OF CURRENT PROMISSORY LOAN
TRANSACTION
1. Without base liabilities
Investor Presentation13.10.2020

24
Gerresheimer at a Glance
Strategic Direction
Q3 Earnings Review
Outlook and Executive Summary
Market Environment
3
2
1
Agenda
4
5
4
1

Very Strong Quarter Ahead
Outlook Q4 2020
25
Mid to high-single digit growth
Support of phasing effects from Q3
P&D
High-single digit to double digit growth
First delivery of Covid-19 vials
Innovation materializing: first sales in Gx® Elite Glass
First recovery in cosmetics business
PPG
Exploration of further technologies, opportunities and
new projects
SQ Innovation project on track
GAT
Investor Presentation13.10.2020

Guidance Confirmed
26
At Group
level
(FXN)
Revenue Growth
Adjusted EBITDA
Capex
(% of revenues)
FY 2020
Mid-single
digit growth
~21%1
~ 12%
Mid-term
Mid-single
digit growth
~ 23%
8 - 10%
Investor Presentation13.10.2020

Focus on Growth
27
For our long-term profitable growth journey we are securing new
orders, additional capacities and leveraging market trends
Q3 2020: Core business on track
Very strong quarter ahead
Investor Presentation13.10.2020

Executive Summary
28
▪ Strong customers focus from the non-cyclical pharma
and healthcare market with long-term growth prospects
supported by megatrends
▪ Market-leading positions in attractive niche markets
▪ Robust business supporting stable operating margins
through the cycle
▪ Good track record of generating solid free cash flow
with high forecast accuracy
▪ Solid financial profile and comfortable headroom
▪ Guidance FY 2020 confirmed striving for sustainable
profitable growth
Investor Presentation13.10.2020

29
Gerresheimer at a Glance
Strategic Direction
Q3 Earnings Review
Outlook and Executive Summary
Market Environment
3
2
5
Agenda
4
1

Current customer overview 1
30
ABOUT 7% generated
with our Top 1 customer
48% of revenues generated with
our Top 20 Pharma & Generics
customers in 2018
35% of revenues generated with
our Top 10 Pharma & Generics
customers in 2018
Mylan
Boehringer Ingelheim
Bayer
Roche
Fresenius
Pfizer
Avon
L‘Oreal
Sanofi
Novartis
Teva
Merck
Beiersdorf
J&J
Novo
Nordisk
Astra
P&G
Coty
GsK
1. Customers names have been inputted randomly and clock-wise presentation does not correspond to revenues ranking
Investor Presentation13.10.2020

… as well as in Cosmetics
31
Filling machines
Moulded Glass Packaging Samples & Decoration
Components
(Pumps & Caps)
Formulation Innovative bottle design & development
COSMETIC
VALUE
CHAINResearch
Product &
Process
Development
Production
Primary
Packaging &
Decoration
LogisticsMarketing &
SalesServices
Delivery
Systems &
Assembly
Gx
stra
teg
ic
rele
va
nt m
ark
et
Componentpre-assembly & sealing
Plastic
Bottles
Product analytics
Filling
Gx accessible marketSu
pp
lie
rs
MUST
HAVESSuperior product and
Technologies1 Cost leadership2 Min. #3 for market shares3
HA
RD
WA
RE
CO
NS
UM
AB
LE
SS
ER
VIC
ES
Investor Presentation13.10.2020

Underlying market growth
32
1. IQVIA (former Quintiles IMS) January 2020.
2. Generic units are included in Medicine units.
Expected development of Pharma market volumes1
CAGR ’20-‘24 (in %)
Medicine
standard
units
Generic
standard
units2
Global 1.5% 1.9%
Developed markets -0.3% 0.1%
Pharmerging markets 2.6% 3.1%
ROW 0.6% 0.9%
Global volume growth ‘19 1.4% 2.6%
Investor Presentation13.10.2020

33
Financial Calendar 2020
FINANCIAL CALENDAR
December 8, 2020 Capital Markets Day
February 18, 2021 Annual Report 2020
April 8, 2021 Publication 1st Quarter 2021
June 9, 2021 Annual General Meeting 2021
July 13, 2021 Interim Report 2nd Quarter 2021
October 12, 2021 Publication 3rd Quarter 2021
13.10.2020 Investor Presentation

Overview of Abbreviations and Definitions
ABBREVIATIONS AND DEFINITIONS
Adj. EBITDA Net income before income taxes, net finance expense, amortization of fair value adjustments, depreciation and amortization, impairment losses,
restructuring expenses and one-off income and expenses
Adjusted EPS Adjusted earnings per share after non-controlling interests, divided by 31.4m shares
Adjusted net income Net income before non-cash amortization of fair value adjustments, non-recurring effects of restructuring expenses, portfolio adjustments, the balance of
one-off income and expenses – including significant non-cash expenses – and the related tax effects
CAGR Compound Annual Growth Rate
Capex Investments in tangible and intangible assets
EBIT Earnings before interest and taxes
EBITA Earnings before interest, taxes and amortization
EBITDA Earnings before interest, taxes, depreciation and amortization
FXN "Foreign currency neutral" - based on budgeted FX-rates
Gx ROCE Adjusted EBITA divided by capital employed (total assets minus investments, investments accounted for using the equity method and other loans, minus
cash and cash equivalents, minus pensions (without pension provisions), deferred tax liabilities, and income tax liabilities, minus prepayments received,
trade payables, and other non- interest bearing liabilities)
Gx RONOA The ratio of adjusted EBITA to average net operating assets, comprising the sum of property, plant and equipment and net working capital
Adj. EBITDA Leverage The relation of net financial debt to adjusted EBITDA of the last twelve months, according to the credit facility agreement currently in place
Net financial debt Short and long term debt minus cash and cash equivalents
Net finance expense Interest income and expenses related to the net financial debt of the Gerresheimer Group. It also includes net interest expenses for pension provisions
together with exchange rate effects from financing activities and from related derivative hedges.
Net working capial
(NWC) Inventories plus trade receivables minus trade payables plus/minus prepayments
Op. CF margin Adjusted EBITDA plus/minus the change in net working capital, minus capex and in relation to revenues
Operating cash flow Adjusted EBITDA plus/minus change in net working capital, minus capex
P/E Ratio Company's share price divided by the adj. EPS
RCF Revolving credit facility
yoy year-on-year
34Investor Presentation13.10.2020

Our Vision
Gerresheimer will become the leading global partner
for enabling solutions that improve health and well-being.
Our success is driven by the passion of our people.