investor presentation fourth quarter 2019 - mti-mmgroup.comof the presentation and mti’sliability...
TRANSCRIPT

Investor Presentation Fourth Quarter 2019
2
This Presentation is intended for information purposes only and does not constitute or form part of an offer for sale or subscription or an invitation or
solicitation of an offer to subscribe for or purchase securities of any kind and neither this document nor anything contained herein shall form the basis of
any contract or commitment from any party whatsoever. Information, including but not limited to financial information, in this presentation should not be
considered as a recommendation in relation to holding, purchasing or selling shares, securities or any other instruments in or, in entities related to, MTI or
any other company.
This Presentation contains important and privileged information on MTI which is solely owned by MTI and may not be relied on or used by any person
whosoever for any purpose, and therefore shall be kept secret and confidential by any receiving party. This document includes forward-looking
statements. The words "believe", "anticipate", "expect", "intend", "aim", "plan", "predict", "continue", "assume", "positioned", "may", "will", "should",
"shall", "risk" and other similar expressions that are predictions of or indicate future events and future trends identify forward-looking statements. These
forward-looking statements include all matters that are not historical facts. In particular, the statements regarding strategy and other future events or
prospects are forward-looking statements. Recipients of this document should not place undue reliance on forward-looking statements because they
involve known and unknown risks, uncertainties and other factors that are in many cases beyond the control of the Company. By their nature, forward-
looking statements & projections involve risks and uncertainties because they relate to events and depend on circumstances that may or may not occur in
the future. Forward-looking statements are not guarantees of future performance and the Company's actual results of operations, financial condition and
liquidity, and the development of the industry in which the Company operates may differ materially from those made in or suggested by the forward-
looking statements contained in this document. The cautionary statements set forth above should be considered in connection with any subsequent
written or oral forward-looking statements that the Company, or persons acting on its behalf, may issue. Various factors could cause actual results to differ
materially from those expressed or implied by the forward-looking statements in this document including worldwide economic trends, the economic and
political climate of Egypt, the Middle East and changes in business strategy and various other factors.
All information contained in this presentation, including but not limited to information relating to the Egyptian consumer and financial markets, are
compiled from sources known to be reliable and/or publicly available data reasonably assumed to be accurate (the “Source Data”). The Source Data may
contain errors and/or inaccuracies; MTI provides no warranties or guarantees of any kind, expressed or implied, and accepts no responsibility whatsoever,
with regard to the accuracy, completeness or correctness of the Source Data used in the Presentation. This disclaimer is to be considered an integral part
of the Presentation and MTI’s liability in respect of this Presentation and is to be governed by Egyptian law under the jurisdiction of Egyptian courts.
Disclaimer

3
MTI at a Glance
34
Employees
128+ Distribution Vehicles
Revenues in 2019
Geographic Footprint90%
95% Population reach
Experience in distribution25+ years
40k+ Accessible points of sale across Egypt
A Leading local Distribution Giant Consolidated Financial Highlights
Ownership Structure
69%
31%
Family members Free floatEGP 9.8bn
1,800+
Distribution Hubs
3 Main Warehouses
EGP mn FY17 FY18 FY19 Y - o - Y
Revenue 6,124 7,626 9,830 28.9%
Gross Profit 428 523 930 77.8%
EBITDA 299 353 644 82.1%
Net Profit 339 271 459 69.4%

4
Line of Business
Product Segment Brand Portfolio
Consumer ElectronicsThe consumer electronics business currently includes distribution of mobile phones, televisions, air conditioners and home appliances.
TelecomThe telecom business includes the operation of Vodafone branded retail franchises and distribution of mobile services andaccessories to individual and business customers, including pre-paid and post-paid, e-top-up terminals/credit recharge. The e payment business has significant growth potential as it taps into almost any online payment service. It is a business that is always cash positive and is a platform from which numerous value-added services can be provided to small retail clients
Automotive
The automotive business is focused on the distribution of luxury cars, namely Jaguar, Land Rover, Bentley, and Maserati and motorcycles Ducati, Victory and Polaris.
Pipes and Tractors
MTI is engaged in the distribution of premium seamless pipes usedin large-scale infrastructure and oil & gas projects as well asthe assembly and distribution of agricultural tractors.

5
History of Growth
1996 2002
Nokia Business collapsed
SIEMENSceases mobile
phone business
2005 2017
MTI becomes Carrier’s Largest Distributer in Egypt
Consumer electronics
Starts trading Siemens cell phones
MTI becomes a non-exclusivedistributor to SIEMENS, becomesone of the major NOKIA dealers
2011 2012
Samsung approached MTI to become a distributor in the
mobile phone business
MTI decides to shift to Vodafone
Telecom 19981996
MTI started distribution on Mobinil
1995 1998 20102003Automotive 1997
Tractors & Pipes 1994
MTI assembles the Belarus tractors
1992
MTI started its seamless pipes trade
2017
MTI successfully inaugurated the new SOLIS tractors assembly line in January2017 to target a more affordable market segment in tractors
MTI started distribution of Huawei mobile phones
2018
MTI Started distribution of Bosch

6
Distribution NetworkConsumer Electronics
11,968 Points of Sale
5 Samsung Retail Stores
4 Branded Stores
8 Service Centers
2 Branded Bosch Stores
Tractor and Pipes
10 Points of Sale
1 Of which owned & operated
Points of Sale
Stores (owned & operated)
27,706
86
Points of Sale
Of which owned & operated
16
4
Telecom
Automotive AutomotiveAutomotive

7
FY2019 Financial Results ReviewSolid Financial growth
Consolidated Financial Results Summary
Revenue | EGP mn Gross Profit & Margin | EGP mn, % EBITDA & Margin | EGP mn, % Net Profit & Margin | EGP mn, %
7,626
9,830
-1000
100 0
300 0
500 0
700 0
900 0
110 00
FY18 FY19
523
930
6.9% 9.5%
-100%
-80%
-60%
-40%
-20%
0%
0
100
200
300
400
500
600
700
800
900
100 0
FY18 FY19
353
644
4.6% 6.6%
-100%
-80%
-60%
-40%
-20%
0%
20%
0
100
200
300
400
500
600
700
800
FY18 FY19
271
4593.6%
4.7%
0%
1%
2%
3%
4%
5%
0
100
200
300
400
500
600
FY18 FY19
YoY 28.9%
Sources: Company Data
Standalone Financial Results Summary
Revenue | EGP mn Gross Profit & Margin | EGP mn, % EBITDA & Margin | EGP mn, % Net Profit & Margin | EGP mn, %
6,820
7,684
620 0
640 0
660 0
680 0
700 0
720 0
740 0
760 0
780 0
800 0
FY18 FY19
492
792
7.2% 10.3%
-100%
-80%
-60%
-40%
-20%
0%
20%
0
100
200
300
400
500
600
700
800
900
FY18 FY19
334
546
4.9% 7.1%
-100%
-80%
-60%
-40%
-20%
0%
20%
0
100
200
300
400
500
600
700
FY18 FY19
258
390
3.8% 5.1%
-400%
-350%
-300%
-250%
-200%
-150%
-100%
-50%
0%
50%
0
50
100
150
200
250
300
350
400
450
500
FY18 FY19
YoY 12.7%

8
4th Quarter 2019 Financial Results ReviewSolid Financial growth
Consolidated Financial Results Summary
Standalone Financial Results Summary
Revenue | EGP mn Gross Profit & Margin | EGP mn, % EBITDA & Margin | EGP mn, % Net Profit & Margin | EGP mn, %
114
195219
8.6% 10.0% 12.5%
-100%
-80%
-60%
-40%
-20%
0%
20%
0
50
100
150
200
250
4Q18 3Q19 4Q19
69
125141
5.2% 6.4% 8.1%
-100%
-80%
-60%
-40%
-20%
0%
20%
0
20
40
60
80
100
120
140
160
180
200
4Q18 3Q19 4Q19
36
88 94
2.8% 4.5% 5.3%
-150%
-130%
-110%
-90%
-70%
-50%
-30%
-10%
10%
0
20
40
60
80
100
120
140
160
4Q18 3Q19 4Q19
1,320
1,9511,752
0
500
100 0
150 0
200 0
250 0
4Q18 3Q19 4Q19
Revenue | EGP mn
2,1262,389
2,093
-300
200
700
120 0
170 0
220 0
270 0
320 0
4Q18 3Q19 4Q19
145
218250
6.8% 9.1% 11.9%
-100%
-60%
-20%
20%
0
50
100
150
200
250
300
4Q18 3Q19 4Q19
Gross Profit & Margin | EGP mn, % EBITDA & Margin | EGP mn, %
88
137161
4.2% 5.8% 7.7%
-100%
-80%
-60%
-40%
-20%
0%
20%
0
50
100
150
200
250
4Q18 3Q19 4Q19
Net Profit & Margin | EGP mn, %
38
104 102
1.8% 4.3% 4.9%
-150%
-130%
-110%
-90%
-70%
-50%
-30%
-10%
10%
0
20
40
60
80
100
120
140
160
180
4Q18 3Q19 4Q19
Sources: Company Data

9
Consolidated Revenue Breakdown by LoB | % Standalone Revenue Breakdown by LoB | %
FY2019 Financial Results ReviewRevenue Breakdown by Line of Business
Sources: Company Data
70.3%
18.9% 10.2%
71.1%
14.2%14.3%
FY18FY19
FY18
EGP 7,625 mn
FY19
EGP 9,830 mn
Tractors & Pipers
AutoTelecom
66.8%
21.1%11.4%
63.1%
18.2%
18.2%
FY18FY19
FY18
EGP 6,820 mn
FY19
EGP 7,684 mn
Tractors & Pipers
AutoTelecom
Consumer Electronics Consumer Electronics

10
Consolidated Gross Profit Breakdown by LoB | % Standalone Gross Profit Breakdown by LoB | %
FY2019 Financial Results ReviewGross Profit by Line of Business
62.2%
12.7%
22.3%
59.6%
10.7%
28.8%
Tractors & Pipers
Auto
Telecom
FY18FY19
FY18
EGP 523 mn
FY19
EGP 930 mn
59.9%
13.3%
23.7%
52.7%
12.5%
33.7%
Tractors & Pipers
Auto
Telecom
FY18FY19
FY18
EGP 492 mn
FY19
EGP 792 mn
Consumer Electronics Consumer Electronics

CONSUMERELECTRONICS
Distribution of & smartphones in the Egyptian market, through Egypt’s largest distribution network, spanning +40,000 points of sale. MTI also offers after-sales services for smartphones.
21.7%
71.1%Of FY19Revenue
+40,000Points of Sale
40%Distributed Smartphones
Market share
13Samsung Service &
Express Centers
Distribution of Consumer Appliances through our network of +12,000 retail outlets, products include , & ACs,
TVs & the entire lineup
2Branded Bosch Stores
4Branded Samsung Stores
+20%MTI
Market share

12
FY2019 Financial Results ReviewMobiles Overview – Global Smart Phone Market
Global Smart Phone Market Share| %
Global Smart phone Users Per Region | # of Users in Mns
687 735 783 851
227 300 375 346354397
441 472279310
342 403483500
518533461
498537
576
-
500 .0
1,00 0.0
1,50 0.0
2,00 0.0
2,50 0.0
3,00 0.0
3,50 0.0
4,00 0.0
2016 2017 2018 2019
Latin and North America
Europe
Middle East and Africa
Asia Pacific
India
China
22% 22% 21% 18% 22% 20% 19% 18% 21% 21% 21% 18%
9% 11% 10% 10%11% 15% 14% 15%
17% 16% 18%14%
14% 11% 12% 18% 14% 11% 12% 17% 12% 10% 12%18%
7% 8% 8% 7% 7% 8% 9%8% 8% 9%
9% 8%
48% 48% 49% 47% 46% 46% 46% 42% 42% 44% 40% 42%
0%
20%
40%
60%
80%
100 %
120 %
1Q17 2Q17 3Q17 4Q17 1Q18 2Q18 3Q18 4Q18 1Q19 2Q19 3Q19 4Q19Samsung Huawei Apple Oppo Others
Sources: Counterpoint Research Market Monitor
2,491
3,1812,995
2,741
FY 2019 Global Smart phone Penetration Rate| %
Sources: Newzoo, Global Mobile Market Report
66%
60%
54%50%
46% 45% 44%
31% 30%25%
16%
0%
10%
20%
30%
40%
50%
60%
70%
Russia China Turkey Mexico Brazil Vitnam Thailand Indonesia Egypt India Pakistan
Sources: Newzoo, Global Mobile Market Report

13
FY2019 Financial Results ReviewMobiles Overview – Egypt Smart Phone Market
Mobile Sales | EGP mns
Mobile Volume Sales & Average Selling Price | # of Units in Mns, USD
2.22.6
3.0 3.0 3.0 3.03.2 3.3 3.3 3.2
3.8 3.6
136 136 141 149 163 170 175 185 185 195 200 200
(3 00.0)
(2 00.0)
(1 00.0)
-
100 .0
200 .0
-
0.5
1.0
1.5
2.0
2.5
3.0
3.5
4.0
4.5
5.0
1Q17 2Q17 3Q17 4Q17 1Q18 2Q18 3Q18 4Q18 1Q19 2Q19 3Q19 4Q19
5,3536,326
7,622 7,9298,732 8,914
10,06411,090 10,557 10,378
12,37611,479
-
2,00 0
4,00 0
6,00 0
8,00 0
10,0 00
12,0 00
14,0 00
1Q17 2Q17 3Q17 4Q17 1Q18 2Q18 3Q18 4Q18 1Q19 2Q19 3Q19 4Q19
Sources: GFK

14
797 927
4,556 4,846
0
1,0 00
2,0 00
3,0 00
4,0 00
5,0 00
6,0 00
4Q18 4Q19 FY18 FY19
1,602 1,271
5,361
6,991
0
1,0 00
2,0 00
3,0 00
4,0 00
5,0 00
6,0 00
7,0 00
8,0 00
4Q18 4Q19 FY18 FY19
FY2019 Financial Results ReviewConsumer Electronics
Consolidated Overview
Standalone Overview
96 125
324
552
6.0% 9.8% 6.0% 7.9%
-500.0%
-400.0%
-300.0%
-200.0%
-100.0%
0.0 %
0
100
200
300
400
500
600
4Q18 4Q19 FY18 FY19
Revenue | EGP mn Gross Profit & Margin | EGP mn, %
Revenue | EGP mn Gross Profit & Margin | EGP mn, %
Sources: Company Data
Consumer Electronics line of business whichrepresented 71% of the consolidated revenues inFY2019, increased by 30.4% Y-o-Y to reach EGP 6.9billion and the standalone revenues grew by 6.4% Y-o-Yto reach EGP 4.8 billion, mainly on the back of theMobile segment outstanding performance, with itsrevenues recorded an increase of 30.4% Y-o-Y and thehome appliances segment continued to deliver solidgrowth, with its revenues increased by 30.8% Y-o-Y. Themobile segment still representing the majorcontributor with 86% of total consolidated consumerelectronics revenues in FY2019 and the remaining 14%was coming from the home appliances segment.
65 94
293
417
8.2% 10.2% 6.4% 8.6%
-500.0%
-400.0%
-300.0%
-200.0%
-100.0%
0.0 %
0
50
100
150
200
250
300
350
400
450
500
4Q18 4Q19 FY18 FY19

TELECOM
+27,000Points of Sale
50%Vodafone Distribution
Market share
86Operated Vodafone Stores
Partnership with allowing MTI to act as a distributor for the prepaid scratch cards and electronic top up, as well as operating franchised Express shops
85.0%
14.2%Of FY19Revenue
192Operated Franchise Terminals
16
345 363 347
1,440 1,400
1001031061091121151181211241271301331361391421451481511541571601631661691721751781811841871901931961992022052082112142172202232262292322352382412442472502532562592622652682712742772802832862892922952983013043073103133163193223253283313343373403433463493523553583613643673703733763793823853883913943974004034064094124154184214244274304334364394424454484514544574604634664694724754784814844874904934964995025055085115145175205235265295325355385415445475505535565595625655685715745775805835865895925955986016046076106136166196226256286316346376406436466496526556586616646676706736766796826856886916946977007037067097127157187217247277307337367397427457487517547577607637667697727757787817847877907937967998028058088118148178208238268298328358388418448478508538568598628658688718748778808838868898928958989019049079109139169199229259289319349379409439469499529559589619649679709739769799829859889919949971,0 001,0 031,0 061,0 091,0 121,0 151,0 181,0 211,0 241,0 271,0 301,0 331,0 361,0 391,0 421,0 451,0 481,0 511,0 541,0 571,0 601,0 631,0 661,0 691,0 721,0 751,0 781,0 811,0 841,0 871,0 901,0 931,0 961,0 991,1 021,1 051,1 081,1 111,1 141,1 171,1 201,1 231,1 261,1 291,1 321,1 351,1 381,1 411,1 441,1 471,1 501,1 531,1 561,1 591,1 621,1 651,1 681,1 711,1 741,1 771,1 801,1 831,1 861,1 891,1 921,1 951,1 981,2 011,2 041,2 071,2 101,2 131,2 161,2 191,2 221,2 251,2 281,2 311,2 341,2 371,2 401,2 431,2 461,2 491,2 521,2 551,2 581,2 611,2 641,2 671,2 701,2 731,2 761,2 791,2 821,2 851,2 881,2 911,2 941,2 971,3 001,3 031,3 061,3 091,3 121,3 151,3 181,3 211,3 241,3 271,3 301,3 331,3 361,3 391,3 421,3 451,3 481,3 511,3 541,3 571,3 601,3 631,3 661,3 691,3 721,3 751,3 781,3 811,3 841,3 871,3 901,3 931,3 961,3 991,4 021,4 051,4 081,4 111,4 141,4 171,4 201,4 231,4 261,4 291,4 321,4 351,4 381,4 411,4 441,4 471,4 501,4 531,4 561,4 591,4 621,4 651,4 681,4 711,4 741,4 771,4 801,4 831,4 861,4 891,4 921,4 951,4 98
4Q18 3Q19 4Q19 FY18 FY19
FY2019 Financial Results ReviewTelecommunication
Telecommunication Overview
18 26 28
66
995.2%
7.2% 8.2%
4.6%7.1%
-20.0%
-15.0%
-10.0%
-5.0%
0.0 %
5.0 %
10. 0%
-10
10
30
50
70
90
110
4Q18 3Q19 4Q19 FY18 FY19
Revenue | EGP mn Gross Profit & Margin | EGP mn, %
Sources: Company Data
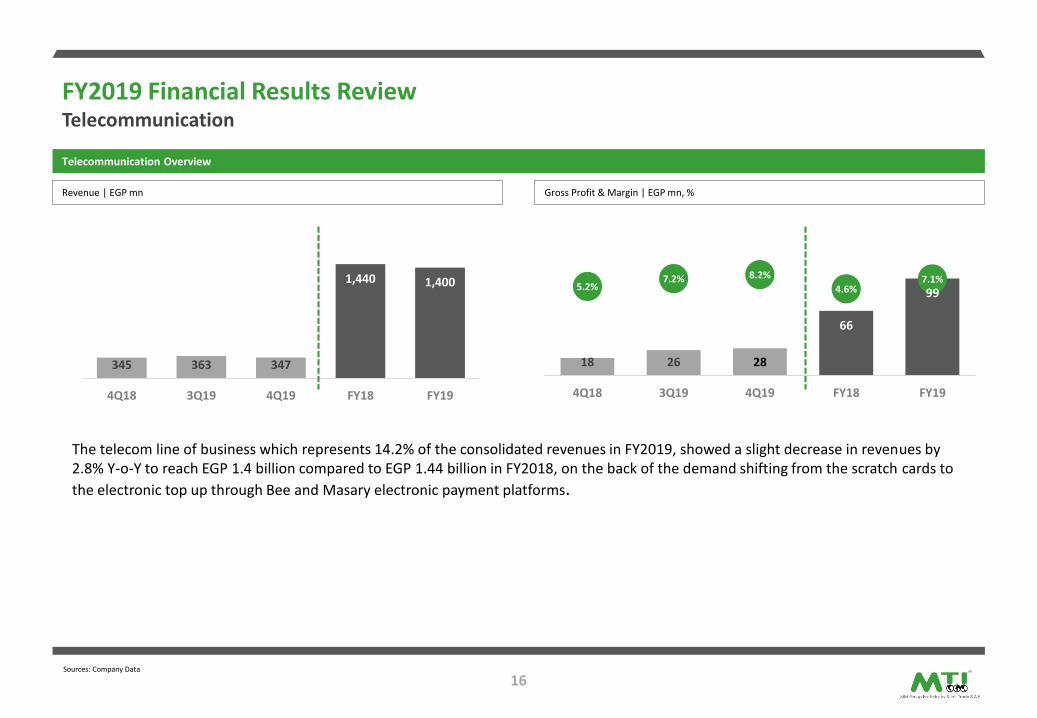
The telecom line of business which represents 14.2% of the consolidated revenues in FY2019, showed a slight decrease in revenues by 2.8% Y-o-Y to reach EGP 1.4 billion compared to EGP 1.44 billion in FY2018, on the back of the demand shifting from the scratch cards to
the electronic top up through Bee and Masary electronic payment platforms.

AUTOMOTIVE
16Points of Sale
#1Importer and Distributor of
Luxury cars in Egypt
4Owned & Operated POS
Largest importer and distributor of luxury cars & motorcycles in Egypt, exclusive agent for , , , &
80.0%
14.3%Of FY19Revenue
18
160 369 470
777
1,402
0
200
400
600
800
1,0 00
1,2 00
1,4 00
1,6 00
4Q18 3Q19 4Q19 FY18 FY19
FY2019 Financial Results ReviewAutomotive
Automotive Overview
Revenue | EGP mn Gross Profit & Margin | EGP mn, %
Sources: Company Data
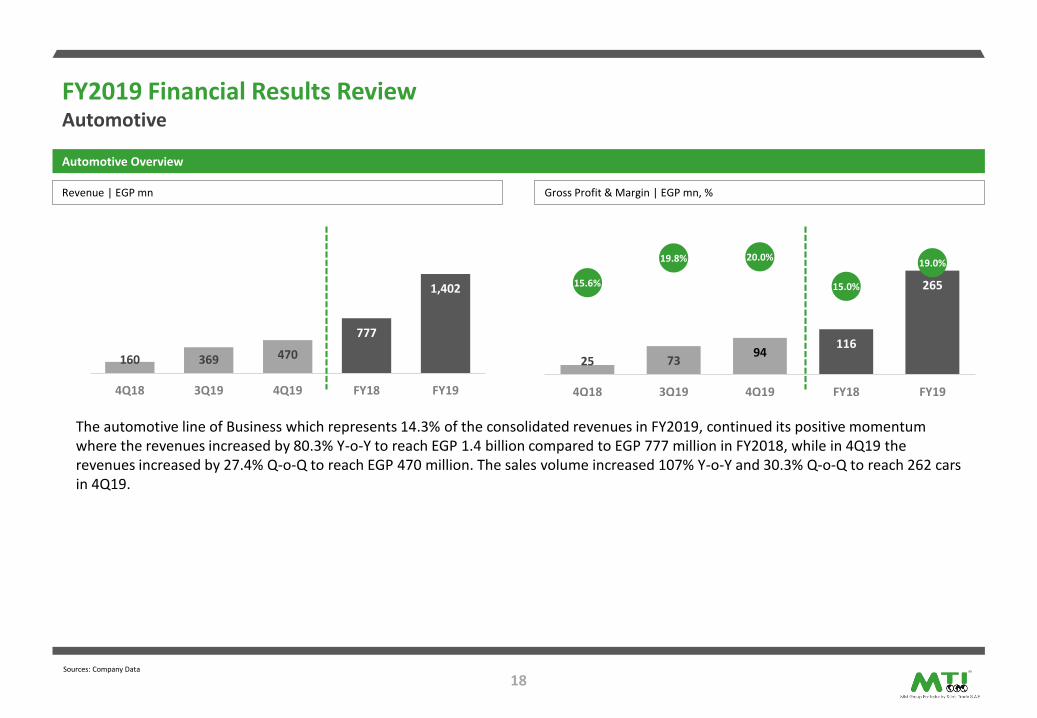
The automotive line of Business which represents 14.3% of the consolidated revenues in FY2019, continued its positive momentum where the revenues increased by 80.3% Y-o-Y to reach EGP 1.4 billion compared to EGP 777 million in FY2018, while in 4Q19 the revenues increased by 27.4% Q-o-Q to reach EGP 470 million. The sales volume increased 107% Y-o-Y and 30.3% Q-o-Q to reach 262 cars in 4Q19.
25 7394
116
26515.6%
19.8% 20.0%
15.0%
19.0%
0.0 %
2.0 %
4.0 %
6.0 %
8.0 %
10. 0%
12. 0%
14. 0%
16. 0%
18. 0%
20. 0%
0
50
100
150
200
250
300
4Q18 3Q19 4Q19 FY18 FY19

Assembly and distribution of agricultural tractors, namely& ; MTI is also one of the suppliers of seamless steel pipes in Egypt
TRACTORS & PIPES
98.0%
1Tractors Assembly Line
10Points of Sale
1Owned & Operated POS
0.4%Of FY19Revenue

20
19
7 7
46
37
0
5
10
15
20
25
30
35
40
45
50
4Q18 3Q19 4Q19 FY18 FY19
FY2019 Financial Results ReviewTractors & Pipes
Tractors & Pipes Overview
Revenue | EGP mn Gross Profit & Margin | EGP mn, %
Sources: Company Data
61 1
15
8
32.0%
16.0% 15.0%
33.1%
21.5%
0.0 %
5.0 %
10. 0%
15. 0%
20. 0%
25. 0%
30. 0%
35. 0%
-1
1
3
5
7
9
11
13
15
17
4Q18 3Q19 4Q19 FY18 FY19
The tractors and pipes line of business which represents 0.4% of the consolidated revenues in FY2019, decreased by 21.1% Y-o-Y to reachEGP 37 million compared to EGP 46 million in FY2018.

Kanawat is considered the fastest growing distributor in Egypt with a comprehensive market coverage and is one of the five authorized dealers for Samsung mobile and the second distributor of Nokia mobile phones in the Egyptian market and the exclusive distributor for the Chinese premium mobile accessories brand – Baseus, Japanese TV brand Synix and AC brand Daikin.
+350MBook Value in EGP
+2,500Points of Sale
+130MPaid in Capital in EGP
70.5%Ownership in Kanawat
15Retail Outlets – K Mobile
15Distribution Hubs

22
FY2019 Financial Results ReviewKanawat Financial Summary
Sources: Company Data
EBITDA & Margin | EGP mns, % Net Profit & Margin | EGP mns, %
Revenue | EGP mns Gross Profit & Margin | EGP mns, %
805439 361
2,685
2,169
-
500 .0
1,00 0.0
1,50 0.0
2,00 0.0
2,50 0.0
3,00 0.0
4Q18 3Q19 4Q19 FY18 FY19
31 22 30
115135
3.8% 5.1% 8.3% 4.3% 6.3%
-100.0%
-80.0%
-60.0%
-40.0%
-20.0%
0.0 %
-
20.0
40.0
60.0
80.0
100 .0
120 .0
140 .0
160 .0
180 .0
4Q18 3Q19 4Q19 FY18 FY19
19 11 19
8595
2.4% 2.6% 5.2% 3.2% 4.4%
-100.0%
-80.0%
-60.0%
-40.0%
-20.0%
0.0 %
-
20.0
40.0
60.0
80.0
100 .0
120 .0
140 .0
4Q18 3Q19 4Q19 FY18 FY19
11 3 9
6355
1.4% 0.7% 2.5% 2.3% 2.5%
-100.0%
-80.0%
-60.0%
-40.0%
-20.0%
0.0 %
-
10.0
20.0
30.0
40.0
50.0
60.0
70.0
80.0
90.0
100 .0
4Q18 3Q19 4Q19 FY18 FY19

Investments supporting and complementing MTI’s core distribution business, through which invests in Non-banking Financial Institutions such as , & and .
+340Paid in Capital in EGP mn
+44MTransactions Value per Day in
EGP
10.7%Direct Ownership in Masary
49.9%Ownership in Ebtikar
+120kPoints of Sale
+2BnPortfolio Size in EGP

24
Non Banking Financial Services
MTI B Investments & BPE Partners
Ebtikar for Financial Investment
49.9% 50.1%
Electronic PaymentMortgage Finance , Leasing
& Auto financeMicrofinance
Consumer finance
60% 45.4%
• Ebtikar,TCV and Acquire collectively through a holding company has acquired 87% of Tamweel Group.
• Tamweel Group is a platform of 5 companies that operate in leasing, Mortgage finance, Factoring, Insurance Brokerage, Collection and the most recent established Auto finance company.
100%
• Vitas Egypt received the final license to commence the microfinance operations in January 2019.
• Vitas Egypt aims to capitalizing on Egypt’s widely unbanked population through adopting international best practices.
69.8%
• Masary is a leading company operating in the Electronic Payments sector in Egypt with around 55,800 Points of Sale.
• Bee is a pioneering technology company in the field of payment solutions with around 63,300 Points of Sale.
10.7%

25
FY2019 Financial Results ReviewNon Banking Financial Services
Electronics Payments Overview
Sources: Company Data
Transactions Value | EGP Bn
Revenue & Commission | EGP mn, % Gross Profit & Margin | EGP mn, %
5 7
89
13
16
0
2
4
6
8
10
12
14
16
18
20
FY18 FY19
Bee Masary
YoY 23%
Avg. Daily Transactions Value | EGP mn
446487
3.4% 3.1%
-100%
-80%
-60%
-40%
-20%
0%
20%
0
100
200
300
400
500
600
FY18 FY19
161182
36.0% 37.0%
-200%
-150%
-100%
-50%
0%
50%
0
20
40
60
80
100
120
140
160
180
200
FY18 FY19
Number of POS Terminals | 000’
54 63
6256
116 119
0
20
40
60
80
100
120
140
FY18 FY19
Bee Masary
EBITDA & Margin | EGP mn, %
14 19
2325
3744
0
10
20
30
40
50
60
FY18 FY19
Bee Masary
YoY 19%
15
27
3.5% 5.5%
-200%
-150%
-100%
-50%
0%
50%
0
5
10
15
20
25
30
35
40
FY18 FY19

26
FY2019 Financial Results ReviewNon Banking Financial Services
Tamweel Overview
Sources: Company Data
Total Portfolio Size | EGP mn Interest Income & Margin | EGP mn, %
Net Interest Income & Margin | EGP mn, %
1,591
2,083
0
500
100 0
150 0
200 0
FY18 FY19
YoY 31%
New Originations| EGP mn
493
1,114
0
200
400
600
800
100 0
120 0
140 0
FY18 FY19
298
356
30.5% 29.2%
-1000%
-800%
-600%
-400%
-200%
0%
200 %
0
50
100
150
200
250
300
350
400
450
500
FY18 FY19
91104
6.5% 5.9%
-200%
-150%
-100%
-50%
0%
50%
0
20
40
60
80
100
120
140
160
180
200
FY18 FY19
YoY 126%
Debt to Equity | EGP mn, x
1,269
1,681298
3534.3
4.8
-
5.00
0
500
100 0
150 0
200 0
250 0
FY18 FY19Debt Equity
Book Value| EGP mn
304358
0
50
100
150
200
250
300
350
400
450
500
FY18 FY19
27
FY2019 Financial Results ReviewNon Banking Financial Services
Vitas Overview
Sources: Company Data
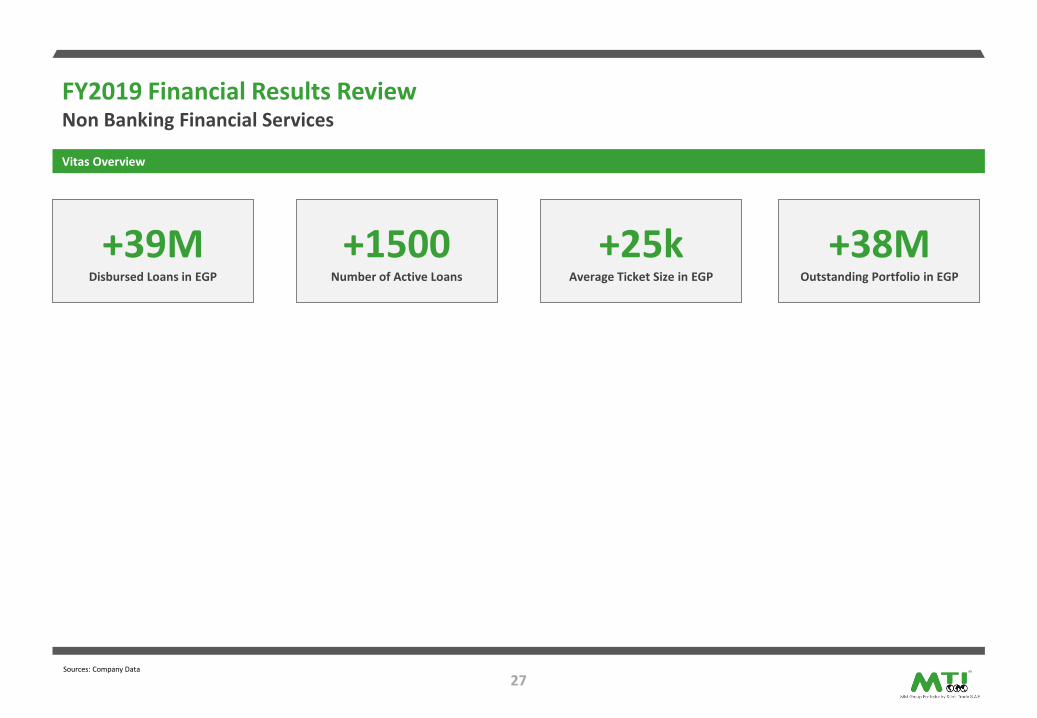
+39MDisbursed Loans in EGP
+38MOutstanding Portfolio in EGP
+25kAverage Ticket Size in EGP
+1500Number of Active Loans

28Sources: Mubasher Pro,
MTI Share PerformanceMTI vs EGX30 Rebased
5
6
7
8
9
10
11
12
13
EGP
per
Sh
are
MTI EGX30 Rebased

29
Investment Highlights
Strong distribution platform
• Strong distribution and retail network with nationwide geographical coverage and access to over ~40,000 points of sale, constituting a high entrybarrier to the market
Diverse portfolio of products
• Multiple lines of business with a diverse portfolio of products at differentstages of maturity leveraging strong brand partners
Responsiveness to rapidly changing environment
• Flexibility in adapting to changes in market dynamics and the ability to changebrand and product affiliations as market trends change course due to shifts intechnology and/or consumer preferences
Promising future prospects
• Future growth plans and healthy prospects across existing and new lines of business
~40kpoints of
sale
Dealerdatabase &
credit scoring
Fleet of128 cars
Strongcredit
controls & follow-up
37 distributionbranches & 108
retail outlets
Tracking & monitoring
systems

30
Management Biographies
Mr. Khaled Mahmoud (Executive Chairman and CEO)
Mr. Khaled Mahmoud has over 30 years of experience in the distribution and retail businesses across various business segments. He is also an experienced investor where he invests
opportunistically in private equity and investment securities across various industries both locally and internationally.
He serves on the board of several family investments of substantial size, such as Egypac, New Finepac, the Egyptian Company for Liner and Fluting Production ‘ELF’, which combined are
the leading producer of linerboard and corrugated packaging products in Egypt. He serves on the board of the Egyptian-Belgium Company for aluminium door and window systems
‘EGYBEL’, a pioneer in the local market.
Previously Mr. Khaled served as a board member of the Chamber of Commerce and the Egyptian National Competitiveness Council (ENCC). Khaled has held other several key positions
throughout his career as a former Board member in the Egyptian Junior Businessmen Association and Beltone Financial.
Mr.Khaled holds a B.S in Commerce and a MBA from Ain Shams University and is proficient in Arabic, English and French.
Mr. Khaled is the Managing Director of the consumer and telecom businesses. He brings over 30 years of experience in the Egyptian distribution industry, He joined MTI in 1992 as a member of
the Tractors and Pipes sales force. In 1998, he became the General Manager of the Telecom Business alongside the Tractors and Pipes business. Mr. Seoudi has been instrumental to the
success MTI as he helped expanding the businesses across various geographies. He has been a critical force in the development of the branch network and in instituting the operational controls
that enabled the growth of the business.
Mr. Khaled holds a BSc. of Commerce from Ain Shams University is proficient in Arabic, English and French.
Mr. Khaled Seoudi (CEO - Consumer Electronics and Telecom)
Eng. Ahmed has spent over 23 years MTI and is currently the Managing Director of the Automotive business. He joined MTI in 1992 with a mandate to launch new projects and new operations.
Ahmed has made valuable contributions in opening new channels of business for MTI with various global manufacturers from Russia, Ukraine and the Czech Republic. His focus shifted towards
the Automotive business in 2001 where he has succeeded in enhancing efficiency and profitability in the last 14 years. Prior to MTI, he was a Service Engineer at Baker & Hughes.
Eng. Ahmed holds a BSc. of Electrical Engineering from Ain Shams University and is proficient in Arabic, English and French.
Eng. Ahmed Gharib (CEO - Automotive)
Mrs. Zakia has over 25 years of experience at MTI. She has headed the Finance and Administration functions overseeing all financial aspects of the business.
Ms. Zakia has added great value to the business in the areas of budgeting, tax planning, costing and conservation/growth in assets. She has a proven track record in capital budgeting for new
projects undertaken by the Group
Mrs. Zakia Abbas (Chief Financial Officer)

31
Management Biographies Cont’d
Mr. Salah Mahmoud (Executive Director– Consumer Electronics)
Mr. Salah has over 8 years of experience at MTI where he has held various positions within the sales and marketing departments including; Mobile Network Operators Sales Manager,
Organized Retail Key Accounts Manager, Assistant Marketing Manager and Director of TV and Mobile business. Mr. Salah currently serves as the Executive Director of Consumer Electronics
business.
Mr. Salah holds a B.A in Economics from the American University in Cairo and is proficient in Arabic, English and French.
Mr. Ashraf EL Ghannam (Head of Investor Relations and Business Development)
Mr. Ashraf has over 13 years of experience in the financial field. He joined MTI in 2017 after the IPO to be responsible for establishing the IR department and to provide strategic insight and
financial assessments of potential growth & partnerships/M&A opportunities, as well as post-alliance analysis and integration capabilities. Before joining he held various positions in a leading
Industrial company and Investment Banks.
Mr. Ashraf holds a B.A in Actuarial Science from Cairo University and is proficient in Arabic and English.
Ms. Sally Kheir (Investor Relations Officer)
Ms. Sally has been with the Company since early 1998 in the beginning of 2016, she became responsible for Investor Relations and the management of information to and from key business
executives in the organization.
Ms. Sally holds a Bachelor of Arts from Helwan University and a Masters of International Business Administration from the École Supérieur Libre des Sciences Commerciales Appliquées
(ESLSCA) in Paris, France.

32
Board of Directors Biographies
Mr. Khaled Mahmoud has over 30 years of experience in the distribution and retail businesses across various business segments. He is also an experienced investor where he invests
opportunistically in private equity and investment securities across various industries both locally and internationally.
He serves on the board of several family investments of substantial size, such as Egypac, New Finepac, the Egyptian Company for Liner and Fluting Production ‘ELF’, which combined are
the leading producer of linerboard and corrugated packaging products in Egypt. He serves on the board of the Egyptian-Belgium Company for aluminium door and window systems
‘EGYBEL’, a pioneer in the local market.
Previously Mr. Khaled served as a board member of the Chamber of Commerce and the Egyptian National Competitiveness Council (ENCC). Khaled has held other several key positions
throughout his career as a former Board member in the Egyptian Junior Businessmen Association and Beltone Financial.
Mr.Khaled holds a B.S in Commerce and a MBA from Ain Shams University and is proficient in Arabic, English and French.
Mr. Khaled Mahmoud (Executive Chairman)
Mr. Hany Mahmoud has over 30 years of experience in the industrial/manufacturing sector. He is the chairman and CEO of MM Group paper and packaging companies, and has been a
primary catalyst of the Group. His expertise in strategic business planning and development has allowed him to grow the businesses exponentially, becoming the largest producer and
supplier in the Egyptian market. Hany has capitalized on a vast network of relationships with neighboring countries in the region to grow and develop the business.
Mr.Hany is a member of the 10th of Ramadan Investors Association.
Mr. Hany holds a B.A in Management and Trading from Ain Shams University.
Mr. Hany Mahmoud (Non-Executive Director)
Ms. Mervat Mahmoud (Non-Executive Director)
Ms. Mervat Mahmoud is a prominent entrepreneur in Egypt with over 26 years of expertise across various industries. She is the Chairman of several Egyptian companies such as
‘GYMAPPAREL’, a leading sportswear company and 2M company for shoes and leather products. She serves on the boards of several family investments of substantial size, such as
Egypac, New Finepac, the Egyptian Company for Liner and Fluting Production ‘ELF’, which combined are the leading producer of linerboard and corrugated packaging products in Egypt.
Mervat also is a Director of the Egyptian-Belgium company for aluminium door and window systems ‘EGYBEL’.
Ms. Mervat is an active member with the Federation of Egyptian Industries, as she is currently a board member for the Chamber of Leather Industries and a member of multiple
committees at the Federation, namely the Technical and Professional Training Development Committee, New and Renewable Energy Committee and the Human Resources Development
Committee.
Ms. Mervat holds a B.S from the Faculty of Arts at Helwan University

33
Board of Directors Biographies Cont’d
Dr. Ali Dayekh has over 30 years of experience in the construction and construction materials sector. He is the President and CEO at Saudi Group for Construction. He is a Member of theAdvisory Board of Gulf Capital, Credit Agricole Bank Egypt and Modern Industries Company and he is investing in a well diversified sectors like trading, banking, manufacturing, fashion and
finance in different countries.
Previously Dr. Ali served as a chairman of several companies in the contracting, construction and glass panels and frames construction industries such as Aleco ( Al Riyadh Electricity Company),
Silver Window Construction, Saudi Aluminum Factory, Al Arif contracting Saudi Arabia and Ali Dayekh Real estate development. In addition, he has been the founding partner in several
successful companies like Al Tayyar travels in KSA, Advanced polypropylene in KSA, Al Salam Bank in Bahrain and Algeria, Masheed Arabia company.
Dr. Ali received his Ph.D. in philosophy and Management research from Kensington University in USA and Bachelor of Business Administration from Richmond University in UK.
Dr. Ali Hassan Dayekh (Non-Executive Director)
Mr. Khaled is the Managing Director of the consumer and telecom businesses. He brings over 30 years of experience in the Egyptian distribution industry, He joined MTI in 1992 as a member of
the Tractors and Pipes sales force. In 1998, he became the General Manager of the Telecom Business alongside the Tractors and Pipes business. Mr. Seoudi has been instrumental to the
success MTI as he helped expanding the businesses across various geographies. He has been a critical force in the development of the branch network and in instituting the operational controls
that enabled the growth of the business.
Mr. Khaled holds a BSc. of Commerce from Ain Shams University is proficient in Arabic, English and French.
Mr. Khaled Seoudi (Executive Director)
Eng. Ahmed has spent over 23 years MTI and is currently the Managing Director of the Automotive business. He joined MTI in 1992 with a mandate to launch new projects and new operations.
Ahmed has made valuable contributions in opening new channels of business for MTI with various global manufacturers from Russia, Ukraine and the Czech Republic. His focus shifted towards
the Automotive business in 2001 where he has succeeded in enhancing efficiency and profitability in the last 14 years. Prior to MTI, he was a Service Engineer at Baker & Hughes.
Eng. Ahmed holds a BSc. of Electrical Engineering from Ain Shams University and is proficient in Arabic, English and French.
Eng. Ahmed Gharib (Executive Director)
Mr. Salah has over 8 years of experience at MTI where he has held various positions within the sales and marketing departments including; Mobile Network Operators Sales Manager,
Organized Retail Key Accounts Manager, Assistant Marketing Manager and Director of TV and Mobile business. Mr. Salah currently serves as the Executive Director of Consumer Electronics
business.
Mr. Salah holds a B.A in Economics from the American University in Cairo and is proficient in Arabic, English and French.
Mr. Salah Mahmoud (Executive Director)

34
Board of Directors Biographies Cont’d
Ms. Yasmin has more than 18 years of experience in the financial services industry, having held positions in regional investment banks including EFG-Hermes and Beltone Financial. During her
tenure at Beltone, where she was Deputy Head of Asset Management, and later, Head of Business Development, she was instrumental in launching innovative products that cater to varying client
risk-return requirements and managing equities. Prior to 2004, at EFG-Hermes, she was responsible for covering the Middle East and North Africa (MENA) markets and managing one of the first
funds investing in the MENA region.
Ms. Yasmin graduated from the American University in Cairo with a BA in Economics.
Ms. Yasmin Aly (Independent Director)
Dr. Ziad has over 30 years of experience in the financial law, governance, compliance, and economic legislation.
He is a former Member of Parliament representing Assiut (2012) and was the Deputy Prime Minister for Economic Development and Minister of International Cooperation (2013-2014),
Executive Chairman of the Egyptian Financial Supervisory Authority (“EFSA”) (2009-2011) and the Executive Chairman of the Egyptian General Authority for Investment and Free Zones
(2004-2007). He is also a former non-executive member of the Board of Directors of the Central Bank of Egypt (2004-2011), the National Bank of Egypt (2005-2010), and a former Senior
Legal Advisor to the Central Bank of Egypt (2011). From 2000 to 2004, Dr. Bahaa-Eldin was a practicing lawyer in Egypt, and from 1997 to 2000 the Senior Legal Advisor to the Minister of
Economy. Prior to this, he was in private legal practice in Cairo and Washington, DC. Dr. Bahaa-Eldin was also an adjunct lecturer at the Faculty of Law at the Cairo University (1998-2004).
He is the founder and member of the Board of Directors of the Ahmed Bahaa-Eldin Cultural Foundation, and is a member of the Board of Trustees of the American University in Cairo.
Dr. Ziad received his Ph.D. in Financial Law from the London School of Economics (1997), an LL.M. in International Business Law from King’s College London (1989), a BA in Economics
from the American University in Cairo (1987) and a Bachelor of Law degree from Cairo University (1986).
Dr. Ziad Bahaa Eldin (Independent Director)

FINANCIALS

36
MTI Standalone Income Statement
Income Statement MTI Standalone | EGP FY18 FY19 YoY 4Q18 4Q19 YoYSales 6,820,352,322 7,684,466,318 12.7% 1,320,423,926 1,752,153,901 32.7%Cost of Sales (6,328,232,986) (6,892,187,206) 8.9% (1,206,354,413) (1,532,689,670) 27.1%Gross Profit 492,119,336 792,279,112 61.0% 114,069,513 219,464,231 92.4%Margin % 7.22% 10.31% 8.64% 12.53%
Sales & Distribution Expenses (153,384,200) (239,863,056) 56.4% (44,159,809) (75,900,617) 71.9%General & Administrative Expenses (5,026,938) (6,037,594) 20.1% (1,264,698) (2,094,110) 65.6%SG&A / Sales % -2.32% -3.20% -3.44% -4.45%
EBITDA 333,708,198 546,378,462 63.7% 68,645,006 141,469,504 106.1%Margin % 4.89% 7.11% 5.20% 8.07%
Depreciation (9,509,476) (8,782,563) -7.6% (3,035,345) (1,799,377) -40.7%EBIT 324,198,722 537,595,899 66.0% 65,609,661 139,670,127 112.9%Margin % 4.75% 6.99% 4.97% 7.97%
Finance Expenses (15,591,566) (29,870,479) 91.6% (9,269,716) (10,085,954) 8.8%Credit Interest 7,263,419 13,058,370 79.8% 2,084,828 2,793,569 34.0%Provisions 9,165,192 (561,157) -106.1% 4,310,627 96,825 -97.8%Capital Gains - 144,881 NA - - NADividends 16,875,000 - NA - - NAIncome from Investment Property 5,989,513 6,853,899 14.4% 1,519,018 1,913,857 26.0%Gains from Sales of Investments at Fair Value (5,081,541) 3,464,643 168.2% (5,019,386) 698,368 -113.9%Gains from Sales of Investments Available for Sale 42,010 (53,341) -227% - - NAImpairments on AR and Inventory (loss)/Gain (1,816,480) (7,156,402) 294% (1,816,480) (7,156,402) 294.0%Solidarity Contribution to Medical Insurance Expense (8,182,905) (16,029,402) 95.9% (8,182,905) (1,111,726) -86.4%FX Gains & Losses (3,424,259) 3,508,154 202.5% (1,463,827) (3,199,519) 118.6%EBT 329,437,105 510,955,065 55.0% 47,771,820 123,618,875 158.8%Margin % 4.83% 6.64% 3.62% 7.06%
Income Tax & Deferred Tax (71,005,063) (120,586,127) 69.8% (11,489,837) (30,074,249) 161.7%Net Profit 258,432,042 390,368,938 51.1% 36,281,983 93,544,626 157.8%Margin % 3.79% 5.08% 2.75% 5.34%

37
MTI Consolidated Income Statement
Income Statement MTI Consolidated | EGP FY18 FY19 YoY 4Q18 4Q19 YoYSales 7,625,721,789 9,830,061,523 28.9% 2,125,793,393 2,096,108,664 -1.4%Cost of Sales (7,102,600,300) (8,899,739,649) 25.3% (1,980,721,727) (1,845,793,238) -6.8%Gross Profit 523,121,489 930,321,874 77.8% 145,071,666 250,315,426 72.5%Margin % 6.9% 9.5% 6.8% 11.9%
Sales & Distribution Expenses (161,772,782) (268,638,407) 66.1% (52,548,391) (83,736,529) 59.4%General & Administrative Expenses (8,149,401) (18,067,632) 121.7% (4,364,375) (5,571,634) 27.7%SG&A / Sales % -2.2% -2.9% -2.7% -4.3%
EBITDA 353,199,306 643,615,835 82.2% 88,158,900 161,007,263 82.6%Margin % 4.6% 6.6% 4.2% 7.7%
Depreciation (10,444,649) (13,921,343) 33.3% (3,970,518) (3,438,531) -13.4%EBIT 342,754,657 626,694,492 82.8% 84,188,382 157,568,732 87.2%Margin % 4.5% 6.4% 3.9% 7.5%
Finance Expenses (15,591,566) (34,895,123) 123.8% (9,269,716) (13,003,328) 40.3%Credit Interest 7,349,051 13,189,872 79.5% 2,170,460 2,818,979 29.9%Provisions 9,165,192 (561,157) -106.1% 4,310,627 96,825 -97.8%Capital Gains - 144,881 NA - - NAInvestment Income 22,774,517 30,748,502 35.0% (5,640,624) 781,878 -113.9%Income from Investment Property 5,989,513 6,853,899 14.4% 1,519,018 1,913,587 26.0%Gains from Sales of Investments at Fair Value (5,081,541) 3,464,643 -168.2% (5,019,386) 698,368 -113.9%Gains from Sales of Investments Available for Sale 42,010 (53,341) -227.0% - - NAImpairments on AR and Inventory (loss)/Gain (1,816,480) (7,640,933) 320.6% (1,816,480) (7,156,402) 294.0%Solidarity Contribution to Medical Insurance Expense (11,391,779) (21,452,994) 88.3% (11,391,779) (2,016,124) -82.3%FX Gains & Losses (3,971,963) (5,169,942) 30.2% (2,011,531) (4,662,091) 131.8%Minority Interest (4,281,107) (16,124,293) 277.0% (4,281,335) (3,317,734) -22.5%EBT 345,940,504 598,198,506 72.9% 52,757,636 133,722,690 153.5%Margin % 4.5% 6.1% 2.5% 6.4%
Income Tax & Deferred Tax (74,694,818) (138,731,654) 85.7% (15,179,592) (31,505,213) 107.5%Net Profit 271,245,686 459,466,852 69.4% 37,578,044 102,217,477 172.0%Margin % 3.6% 4.7% 1.8% 4.9%
38
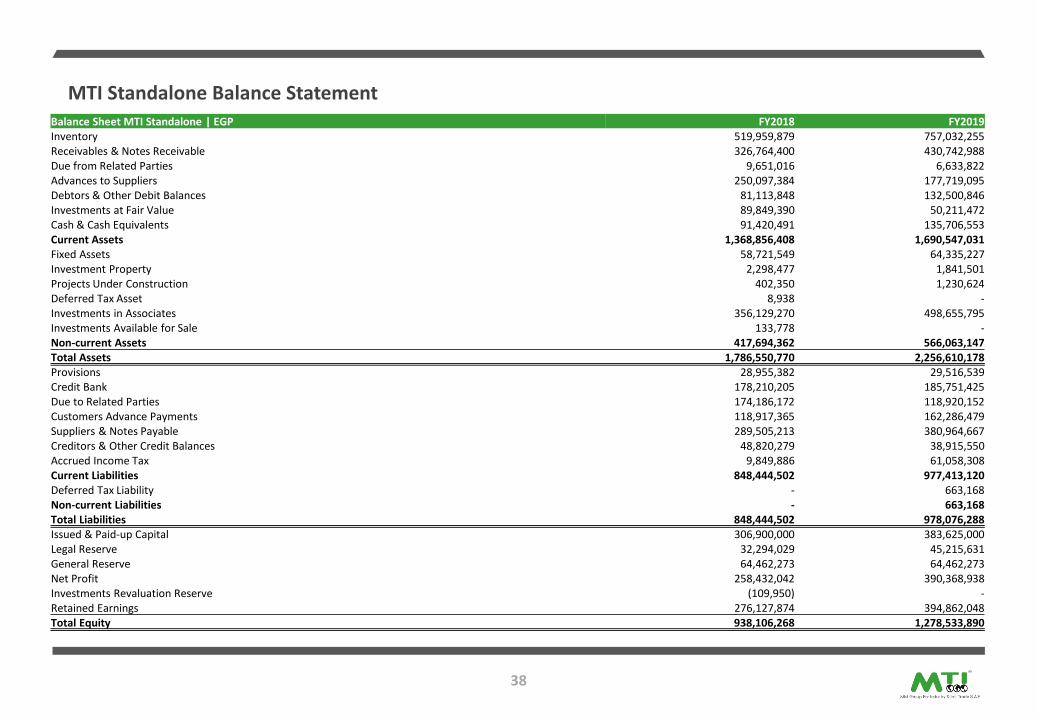
Balance Sheet MTI Standalone | EGP FY2018 FY2019Inventory 519,959,879 757,032,255 Receivables & Notes Receivable 326,764,400 430,742,988 Due from Related Parties 9,651,016 6,633,822 Advances to Suppliers 250,097,384 177,719,095 Debtors & Other Debit Balances 81,113,848 132,500,846 Investments at Fair Value 89,849,390 50,211,472 Cash & Cash Equivalents 91,420,491 135,706,553 Current Assets 1,368,856,408 1,690,547,031 Fixed Assets 58,721,549 64,335,227 Investment Property 2,298,477 1,841,501 Projects Under Construction 402,350 1,230,624 Deferred Tax Asset 8,938 -Investments in Associates 356,129,270 498,655,795 Investments Available for Sale 133,778 -Non-current Assets 417,694,362 566,063,147 Total Assets 1,786,550,770 2,256,610,178 Provisions 28,955,382 29,516,539 Credit Bank 178,210,205 185,751,425 Due to Related Parties 174,186,172 118,920,152 Customers Advance Payments 118,917,365 162,286,479 Suppliers & Notes Payable 289,505,213 380,964,667 Creditors & Other Credit Balances 48,820,279 38,915,550 Accrued Income Tax 9,849,886 61,058,308 Current Liabilities 848,444,502 977,413,120 Deferred Tax Liability - 663,168Non-current Liabilities - 663,168Total Liabilities 848,444,502 978,076,288 Issued & Paid-up Capital 306,900,000 383,625,000 Legal Reserve 32,294,029 45,215,631 General Reserve 64,462,273 64,462,273 Net Profit 258,432,042 390,368,938 Investments Revaluation Reserve (109,950) -Retained Earnings 276,127,874 394,862,048 Total Equity 938,106,268 1,278,533,890
MTI Standalone Balance Statement

39
MTI Consolidated Balance SheetBalance Sheet MTI Consolidated | EGP FY2018 FY2019Inventory 798,722,808 1,101,305,669 Receivables & Notes Receivable 402,024,044 507,408,742 Due from Related Parties 9,392,660 4,279,957 Advances to Suppliers 397,056,796 314,570,811 Debtors & Other Debit Balances 101,619,578 204,781,102 Investments at Fair Value 89,849,390 50,211,472 Cash & Cash Equivalents 98,040,434 149,381,124 Current Assets 1,896,705,710 2,331,938,877 Fixed Assets 65,011,485 76,496,834 Investment Property 2,298,477 1,841,501 Projects Under Construction 402,350 1,230,624 Deferred Tax Asset 230,413 -Investments in Associates 250,739,867 401,048,237 Investments Available for Sale 133,778 -Non-current Assets 318,816,370 480,617,196 Total Assets 2,215,522,080 2,897,165,088 Provisions 28,955,382 29,516,539 Credit Bank 178,210,205 280,314,215 Due to Related Parties 201,561,175 116,547,206 Customers Advance Payments 155,313,675 187,884,850 Suppliers & Notes Payable 431,262,030 535,961,282 Creditors & Other Credit Balances 54,275,302 48,904,115 Accrued Income Tax 28,657,593 78,479,670 Current Liabilities 1,078,235,362 1,277,607,877 Deferred Tax Liability - 1,165,858 Non-current Liabilities - 1,165,858 Total Liabilities 1,078,235,362 1,278,773,735 Issued & Paid-up Capital 306,900,000 383,625,000 Legal Reserve 32,294,029 45,215,631 General Reserve 64,462,273 64,462,273 Net Profit 271,245,686 459,466,852Non-controlling Interest 113,730,348 104,206,372 Investments Revaluation Reserve (109,950) -Retained Earnings 348,764,332 476,806,210 Total Equity 1,137,286,718 1,533,782,338

Thank you
Investor Relations Contact Information :
Ashraf El Ghannam, Head of Investor Relations and Business Development
Sally Kheir, Investor Relations Officer
Mob. : +2 0100 555 3070
Tel. : +2 (02) 24024332
email: [email protected]
Web site : www.mti-mmgroup.com