investor presentation - enplus corporate · pdf fileinvestor presentation january 2018. 2 2 12...
TRANSCRIPT

Investor Presentation
January 2018

2
3832262 12Overview of En+ Group
Market Dynamics & Outlook
Results Summary
AppendixGovernance & Sustainability
19Innovating for a Low Carbon Economy

Overview of En+ Group Market Dynamics & Outlook Governance & Sustainability Results Summary AppendixInnovating for a Low Carbon Economy
The En+ Investment Case
OPERATIONAL EXCELLENCESTRONG CASHFLOW DRIVING
GROWTH & RETURNSSUPPORTIVE MARKET
FUNDAMENTALS ROBUST GOVERNANCE &
SUSTAINABILITY FRAMEWORK
• Global leader in aluminium production and renewable energy via 15GWt of HPP
• Vertically integrated green business model
• Unique asset base and operational excellence contributing to cost leadership
• Strong cash flow generation based on Tier 1 world class assets
• Robust capital allocation framework
• Transparent and sustainable shareholder returns
• Low carbon economy -Aluminium demand to double in a 2°C scenario1
• Global aluminium market to remain in deficit, with China actively cutting production
• Spare capacity of existing HPP can be utilised to meet increased demand upon ramp up of Rusal brownfield smelters
• Strong demand for sustainable power solutions
• 5 independent and minority non-executive directors2
• Commitment to environmental and social programmes
• Driving innovation to create industrial transformation
Operational excellence driving sustainable performance
(1) Mean Cumulative Demand, 2013–2050, for the Technologies Examined in “The Growing Role of Minerals and Metals for a Low Carbon Future” (Impact on cumulative demand of relevant metals by 2050, under the 2DS scenario, as a fraction of cumulative demand if the 2013 production levels are sustained to 2050. (2) En+ Group signed a non-binding term sheet with Amokenga Holdings Limited ("AHL"), a subsidiary of Glencore plc ("Glencore"), for the conversion of Glencore's 8.75% shareholding in UC RUSAL into GDRs representing ordinary shares of the Company. The conversion is expected to occur following the IPO. The conversion is subject to the execution of definitive transaction agreements and all necessary governmental and regulatory approvals. Mr. Ivan Glasenberg to be appointed as NED following the completion of transaction..
3

Overview of En+ Group Market Dynamics & Outlook Governance & Sustainability Results Summary AppendixInnovating for a Low Carbon Economy
Russia34%
USA12%
Europe30%
Asia10%
Others14%
822 545 829
1,489
1,077
1,534
2016 9M 2016 9M 2017
Energy segment Metals segment
4
Worldwide Presence with Core Assets in Siberia
Bauxite
Aluminium smelters
Alumina
Hydro Power Plants
Moly, copper, iron ore
Foil, Powders, Silicon
Nepheline ore
GUINEA
GUYANA
Moscow
NIGERIA
A U S T R A L I A
SWEDEN
UKRAINEIRELAND
ITALY ARMENIA
C H I N A
KAZAKHSTAN
R U S S I A
JAMAICA
Trans-Siberian Railway (main line)
New Silk Road (sea transport route)
New Silk Road (railway route)
Baikal-Amur Mainline
Northeast Passage
Key Norilsk Nickel production assets
Cryolite and Cathodes
2016 Revenue by region & currency 1
Geographical diversity and high proportion of USD revenue streams
USD9,776 mn
Priced in RUB
Priced in USD & Others
Adj. EBITDA2 by segment(USD mn)
(1) From external customers. (2) Adjusted EBITDA means, for any period, the results from operating activities adjusted for amortisation and depreciation, impairment of non-current assets and gain/loss on disposal of property, plant and equipment for the relevant period, in each case attributable to the Group, business segment or any reportable segment, as the case may be. Group figures exclude intersegmental revenues. (3) After elimination of intersegmental revenues
2,311m 1,622m 2,316m
78%
22%
3

Overview of En+ Group Market Dynamics & Outlook Governance & Sustainability Results Summary AppendixInnovating for a Low Carbon Economy
5
Global Leader in Hydro Power and Aluminium
1.4
2.1
2.2
2.4
2.5
2.6
3.3
3.6
3.7
5.8
Jiuquan iron & steel group
Norsk Hydro
East Hope Group
Alcoa
Emirates Global Aluminium
Chalco
Xinfa Group
Rio Tinto
En+ Group (Metals Segment)
China Hongqiao Group
Leading independent player in our market segments
5.5
7.9
8.2
11.3
12.7
15.1
22.5
27.4
29.9
36.4
38.7
45.5
Engie Brasil
EDP
Verbund
Iberdrola
SDIC Power
En+ Group (EnergySegment)
EDF
Enel
RusHydro
HydroQuebec
Eletrobras
China YangtzePower
Top power companies by installed hydro capacity globally 2016 GW where available1
• #1 independent hydro power generator by installed capacity
State 100
State 85
State 99
State 33
State 78
State 16
Private 77
Private 25
State3 32
State 95
State 79
State 47
Hydro share (%)
Global leader in hydro power generationLeading aluminium producers globally 2016 Aluminium production mt
And aluminium production (ex-China)
x
Source: En+ Group, CRU, companies' public filings(1) Capacity data for China Yangtze, Eletrobras, RusHydro, SDIC Power as of 2015; (2) Subsidiary of China Three Gorges Corporation; (3)State owned China Three Gorges Corporation and CNIC are the largest shareholders with 21.4% and 3.0% stakes.
2
Overview of En+ Group Market Dynamics & Outlook Governance & Sustainability Results Summary AppendixInnovating for a Low Carbon Economy
6
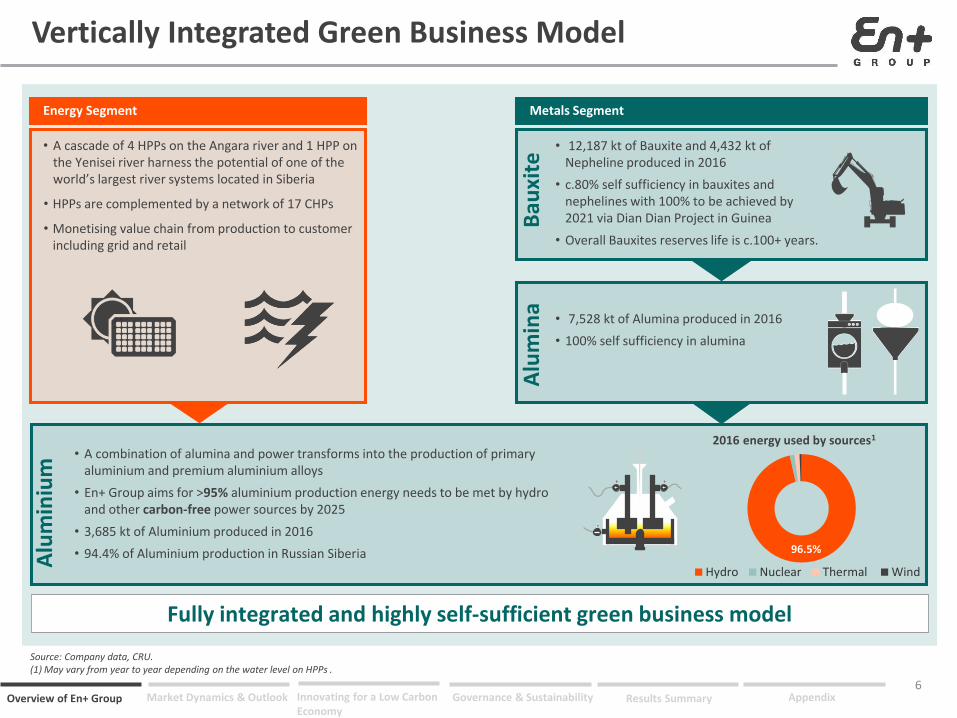
Vertically Integrated Green Business Model
Source: Company data, CRU.(1) May vary from year to year depending on the water level on HPPs .
Fully integrated and highly self-sufficient green business model
Energy Segment
• A cascade of 4 HPPs on the Angara river and 1 HPP on the Yenisei river harness the potential of one of the world’s largest river systems located in Siberia
• HPPs are complemented by a network of 17 CHPs
• Monetising value chain from production to customerincluding grid and retail
Metals Segment
Bau
xite
Alu
min
a
Alu
min
ium
• 12,187 kt of Bauxite and 4,432 kt of Nepheline produced in 2016
• c.80% self sufficiency in bauxites and nephelines with 100% to be achieved by 2021 via Dian Dian Project in Guinea
• Overall Bauxites reserves life is c.100+ years.
• 7,528 kt of Alumina produced in 2016
• 100% self sufficiency in alumina
• A combination of alumina and power transforms into the production of primary aluminium and premium aluminium alloys
• En+ Group aims for >95% aluminium production energy needs to be met by hydro and other carbon-free power sources by 2025
• 3,685 kt of Aluminium produced in 2016
• 94.4% of Aluminium production in Russian Siberia 96.5%
Hydro Nuclear Thermal Wind
2016 energy used by sources1
Overview of En+ Group Market Dynamics & Outlook Governance & Sustainability Results Summary AppendixInnovating for a Low Carbon Economy
7
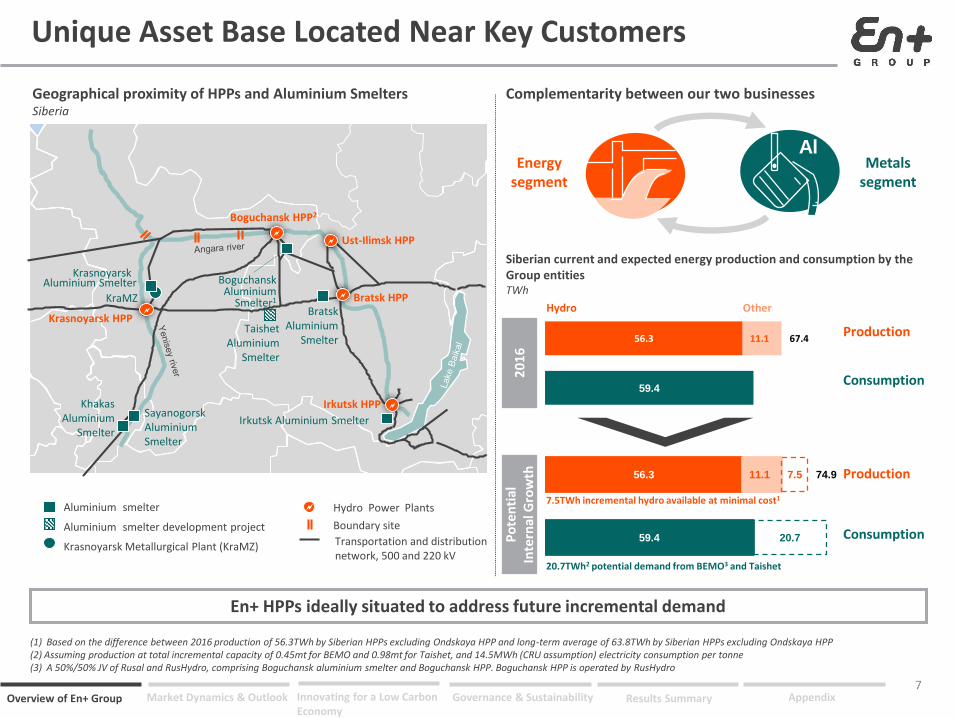
En+ HPPs ideally situated to address future incremental demand
Krasnoyarsk HPP
Ust-Ilimsk HPP
Boguchansk HPP2
Krasnoyarsk Aluminium Smelter
SayanogorskAluminium Smelter
KhakasAluminium
Smelter
Bratsk Aluminium
Smelter
Irkutsk HPP
Boguchansk Aluminium
Smelter1
Irkutsk Aluminium Smelter
KraMZ
Aluminium smelter
Aluminium smelter development project
Krasnoyarsk Metallurgical Plant (KraMZ)
Boundary site
Transportation and distributionnetwork, 500 and 220 kV
Bratsk HPP
Taishet Aluminium
Smelter
Hydro Power Plants
AlEnergy
segmentMetals
segment
Geographical proximity of HPPs and Aluminium Smelters Siberia
Complementarity between our two businesses
Production
Consumption
Siberian current and expected energy production and consumption by the Group entitiesTWh
Production
Consumption
20.7TWh2 potential demand from BEMO3 and Taishet
Hydro Other
(1) Based on the difference between 2016 production of 56.3TWh by Siberian HPPs excluding Ondskaya HPP and long-term average of 63.8TWh by Siberian HPPs excluding Ondskaya HPP(2) Assuming production at total incremental capacity of 0.45mt for BEMO and 0.98mt for Taishet, and 14.5MWh (CRU assumption) electricity consumption per tonne(3) A 50%/50% JV of Rusal and RusHydro, comprising Boguchansk aluminium smelter and Boguchansk HPP. Boguchansk HPP is operated by RusHydro
56.3 11.1 7.5 74.9
59.4 20.7
56.3 11.1 67.4
59.4
20
16
Po
ten
tial
In
tern
al G
row
th
7.5TWh incremental hydro available at minimal cost1
Unique Asset Base Located Near Key Customers

Overview of En+ Group Market Dynamics & Outlook Governance & Sustainability Results Summary AppendixInnovating for a Low Carbon Economy
8
1,000
1,200
1,400
1,600
1,800
2,000
0mt 15mt 30mt 45mt 60mt
0.78
2.40
4.143.73 3.72 3.63
2.63 2.56
1.96
En+ Group En+ Group(Metals
Segment)
Chalco Nalco AdityaBirla
Hongqiao Alcoa NorskHydro
Rio Tinto
Electricity costs(¢/KWh, 2016)
Global aluminium cash costs curve (based on liquid metal)(as of 2016; USD/t)
Source: Company, CRU for companies other than En+ Group and Rusal
Operating costs/capacity 20161
(USD mn/GW)
9
10
20
57
57
65
75
134
225
260
China Yangtze Power
En+ (HPPs)
RusHydro ex. RAOVostok
HydroQuebec
SDIC Power
En+ (Energy Segment)
RusHydro
Engie Brasil
Verbund
Eletrobras
2016 Adjusted EBITDA margin(%)
90
81
66
79
68
38
34
49
37
33
2
2
Driving the Lowest Cost Aluminium Production
Unique asset base of cost-efficient HPPs Driving significant cost advantage in aluminium
3
Source: CRU, Company
USD1,255Rusal
En+’s symbiotic business units result in best in class cost performance
On a look-through basis En+ Group is the lowest cost producer
Source: Company, Companies’ public filings, FactSet; Note: Adjusted EBITDA margin = Adjusted EBITDA / Revenue; EBITDA calculation and its respective adjustment vary as per each company’s own methodology(1) Operating costs are calculated as Revenue – Adjusted EBITDA. China Yangtze, SDIC Power, Rushydro, Eletrobras capacity figures as of 2015; (2) Excluding retail segment; (3) Company electricity costs on a look-through basis are calculated as Siberian HPP power generating costs (RUB 10 bln) divided by HPP generation (56.3 TWh) plus transmission tariff charged by Irkutsk Electric Grid Company to Rusal (0.346 RUB / KWh) at average USD/RUB rate of 67.03
800
1,000
1,200
1,400
0mt 5mt 10mt 15mt
USD/t First quartile (0-15mt)
USD985En+ *USD1,255
Rusal

Overview of En+ Group Market Dynamics & Outlook Governance & Sustainability Results Summary AppendixInnovating for a Low Carbon Economy
9
89.5
38.2
79.0
68.3
34.2
49.3
37.3
32.6
27.9
26.7
25.8
23.1
21.5
65.6
China YangtzePower
HydroQuebec
SDIC Power
RusHydro
Engie Brasil
Verbund
Eletrobras
Fortum
Iberdrola
EDP
EDF
Enel
En+ Power 33.118.7
14.0
13.0
11.4
11.0
8.3
2.2
23.6UC RUSAL
Norsk Hydro
Hindalco
Novelis
Alcoa
Chalco
Century
Adj. EBITDA margin for power companies 20161
(%)
Source: En+ Group, companies' public filingsNote: EBITDA calculation and its respective adjustments vary according to each company’s own methodology(1) China Yangtze, SDIC Power figures as of 2015; (2) Includes HPPs, CHPs, Retail, Grids and others; (3) Excluding retail segment.
HPPs 81.0
excl. RAO Vostok3
Energy segment 33.1
(Power2)
And Superior Adjusted EBITDA Margin
En+ Group has strong adj. EBITDA margins in both Energy and Metals segments
Lower costs and efficient operations produce sector leading margins
Adj. EBITDA margin for aluminium companies 2016(%)
En+ Group(Energy Segment)

Overview of En+ Group Market Dynamics & Outlook Governance & Sustainability Results Summary AppendixInnovating for a Low Carbon Economy
10
Robust Capital Allocation Framework
Portfolio of cost-efficient operating assets with resilient cash flows
Secular organic growth with low capital requirements
Deleveraging and cost of capital optimisation
Dividend Payment • 100% Rusal Dividend • 75% Energy Segment FCF
(min. USD 250mn p.a.)
InorganicGrowth
Operating Cash Flow
Organic Growth
Additional Shareholder Returns
Excess Cash Flow
Focus on driving shareholder value through the cycle

Overview of En+ Group Market Dynamics & Outlook Governance & Sustainability Results Summary AppendixInnovating for a Low Carbon Economy
11
Cash Generation Supporting Growth & Returns
En+ is sharply focused on cashflow generation and through the cycle shareholder returns
479 522 575 547
2014 2015 2016 9m 2017
Energy segment historical adjusted capex evolution5
(RUB bn)
10.2 8.9 8.3
6.0
2.5 1.4
0.9
12.7
10.3 9.2
6.0
2014 2015 2016 9m 2017
Power Other
Metals segment historical capex evolution (USD mn)
Average for 2014-2016: RUB10.7 bn
Average for 2014-2016: USD525 mn
614 139
1,181
732
642(372)
(103)
(381)
(547) (36) (127)
2,437 (753)
(650)
871
OpCF anddividends
from associatesand JVs
Net interest Capex Restructuringfee
Payments fromsettlement of
derivativeinstruments
FCF (excl.derivatives)
Energy segment Metals segment Dividends from associates and JVs
Strong En+ Group free cash flow(USD mn, 9M 2017)
Supporting attractive dividend policy
(1) Adjusted EBITDA (Results from operating activities adjusted for amortisation and depreciation, impairment charges and loss on disposal of property, plant and equipment for the relevant period) adjusted for the changes in net working capital, adjustments for non-cash items, income taxes paid; (2)Cash interest paid less cash interest received; (3) Capital expenditure represents cash flow related to investing activities – acquisition of property, plant and equipment and intangible assets; (4) Calculated as operating cash flow less net interest paid and less capital expenditure adjusted for payments from settlement of derivative instruments plus dividends from associates and joint ventures; (5) Capital expenditure represents cash flow related to investing activities – acquisition of property, plant and equipment and acquisition of intangible assets. For En+ Power capex is presented adjusted for one-off acquisitions of assets (2014 - USD64 mn acquisition of Ondskaya HPP, 2016 – acquisition of dams from RusHydro - USD163 mn including VAT). Calculations are based on the following RUB/ USD exchange rates: 2014 – 38.42, 2015 – 60.96, 2016 – 67.03
1
2 34
Pay a dividend on at least a semi-annual basis equal to the sum of:
1. 100% of dividends received from UC Rusal; and
2. 75% of Free Cash Flow of Energy segment, subject to a minimum of USD250 mn per annum
144 57
125
201
125
Pre-IPO
Post-IPO
UC Rusal Energy
Conservative approach to new projects
Goal to maintain capex flat in rouble terms
Energy segment’s investment programme is estimated at RUB12 bn (c.USD200 mn) per annum for the 2017-2021 period
Prudent investment with focus on value-added projects
Small-scale non-capital intensive modernisations
Prudent approach to capital expenditure through the cycle with high return thresholds
En+ dividend payments in 2017 (USD mn)
12
3832262 12Overview of En+ Group
Market Dynamics & Outlook
Results Summary
AppendixGovernance & Sustainability
19Innovating for a Low Carbon Economy
Overview of En+ Group Market Dynamics & Outlook Governance & Sustainability Results Summary AppendixInnovating for a Low Carbon Economy
13
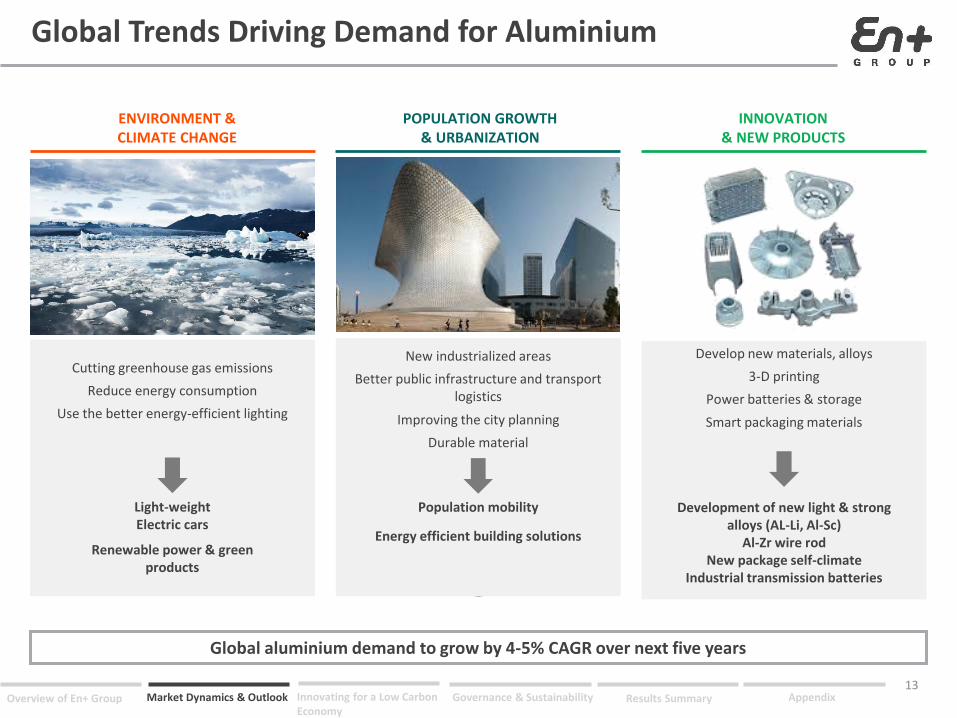
Global Trends Driving Demand for Aluminium
Global aluminium demand to grow by 4-5% CAGR over next five years
ENVIRONMENT & CLIMATE CHANGE
Cutting greenhouse gas emissions
Reduce energy consumption
Use the better energy-efficient lighting
Light-weightElectric cars
Renewable power & green products
POPULATION GROWTH & URBANIZATION
New industrialized areas
Better public infrastructure and transport logistics
Population mobility
Energy efficient building solutions
Improving the city planning
Durable material
INNOVATION & NEW PRODUCTS
Develop new materials, alloys
3-D printing
Power batteries & storage
Smart packaging materials
Development of new light & strong alloys (AL-Li, Al-Sc)
Al-Zr wire rodNew package self-climate
Industrial transmission batteries
Overview of En+ Group Market Dynamics & Outlook Governance & Sustainability Results Summary AppendixInnovating for a Low Carbon Economy
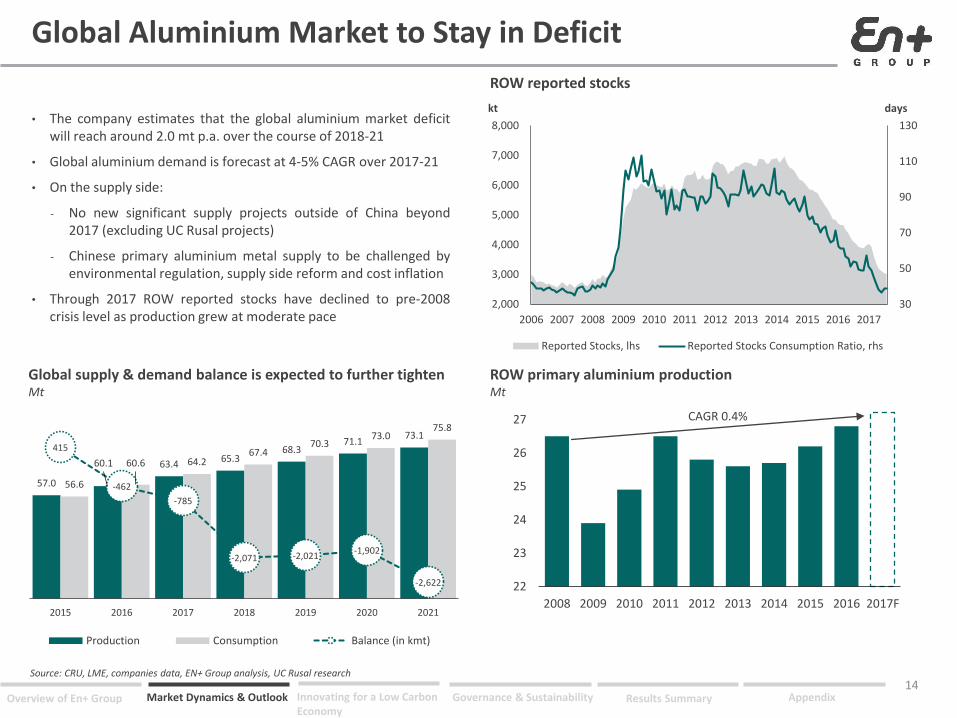
Global Aluminium Market to Stay in Deficit
• The company estimates that the global aluminium market deficitwill reach around 2.0 mt p.a. over the course of 2018-21
• Global aluminium demand is forecast at 4-5% CAGR over 2017-21
• On the supply side:
‐ No new significant supply projects outside of China beyond2017 (excluding UC Rusal projects)
‐ Chinese primary aluminium metal supply to be challenged byenvironmental regulation, supply side reform and cost inflation
• Through 2017 ROW reported stocks have declined to pre-2008crisis level as production grew at moderate pace
ROW reported stocks
Global supply & demand balance is expected to further tightenMt
ROW primary aluminium productionMt
Source: CRU, LME, companies data, EN+ Group analysis, UC Rusal research
22
23
24
25
26
27
2008 2009 2010 2011 2012 2013 2014 2015 2016 2017F
CAGR 0.4%
14
57.0
60.1 63.465.3
68.371.1
73.1
56.6
60.6 64.267.4
70.373.0
75.8
415
-462
-785
-2,071 -2,021-1,902
-2,622
2015 2016 2017 2018 2019 2020 2021
Production Consumption Balance (in kmt)
30
50
70
90
110
130
2,000
3,000
4,000
5,000
6,000
7,000
8,000
2006 2007 2008 2009 2010 2011 2012 2013 2014 2015 2016 2017
dayskt
Reported Stocks, lhs Reported Stocks Consumption Ratio, rhs

Overview of En+ Group Market Dynamics & Outlook Governance & Sustainability Results Summary AppendixInnovating for a Low Carbon Economy
China is Actively Cutting Production
30.4 32.7
2.33.8
2.4-6.2
2015 1H2016 2H2016 1H2017 2H2017 E 2017 E
China’s vows on curtailing illegal capacity and winter season production cuts are currently strictly implemented.This has put an end to unreasonable supply expansion, as well widening primary metal deficit and potentiallyopening a window for aluminium imports into China.
Complete reversal of Aluminium operating capacity growth trend in China (MT)
Effect of cuts during winter season 2017-18 on aluminium and alumina production (MT)1
• The government has identified ~4.5 Mt of illegal capacity
• Of which ~4.3 Mt has already been curtailed as of 30 September 2017
• Negative growth of operating capacity in 2H 2017 nullified capacityexpansion in 2H 2016 and 1H 2017
• Companies strictly follow governmental orders and maintainproduction discipline
• In addition to the winter cuts policy, starting from October 2017, MEPhas applied “special air emission standard” to the “2+26” cities.
• Shanxi province, including large alumina producer Lvliang, hasannounced joining the winter cuts policy.
• Stricter permissible air pollutants concentration levels have putadditional environmental pressure on refineries, smelters and theircaptive power plants
• Winter cuts implementation reveals higher-than-expected effect oncapacity closures
• The effect of winter cuts on alumina by far exceeds the effect onaluminium production
• Some regions launch the curtailment period ahead of the generaltimeline
• Government officials and industry analytics forecast the recurrence ofthe winter cut policy for 2018-19 winter season
0.4
1.90.6
2.8
1.0
4.7
Aluminium Alumina
2017 2018
Source: Aladdiny, MEP, UC Rusal research(1) Impacted by “2+26” regulation capacities for aluminium stand at c. 3 mn tonnes and for alumina at c. 13 mn tonnes
15
Overview of En+ Group Market Dynamics & Outlook Governance & Sustainability Results Summary AppendixInnovating for a Low Carbon Economy
0
100
200
300
400
500
Powder Aluminum tube (incl. accessories)
Aluminum foil Aluminum bar, rod, and profile - Extrusion
Aluminum plate, sheet, and strip - FRP
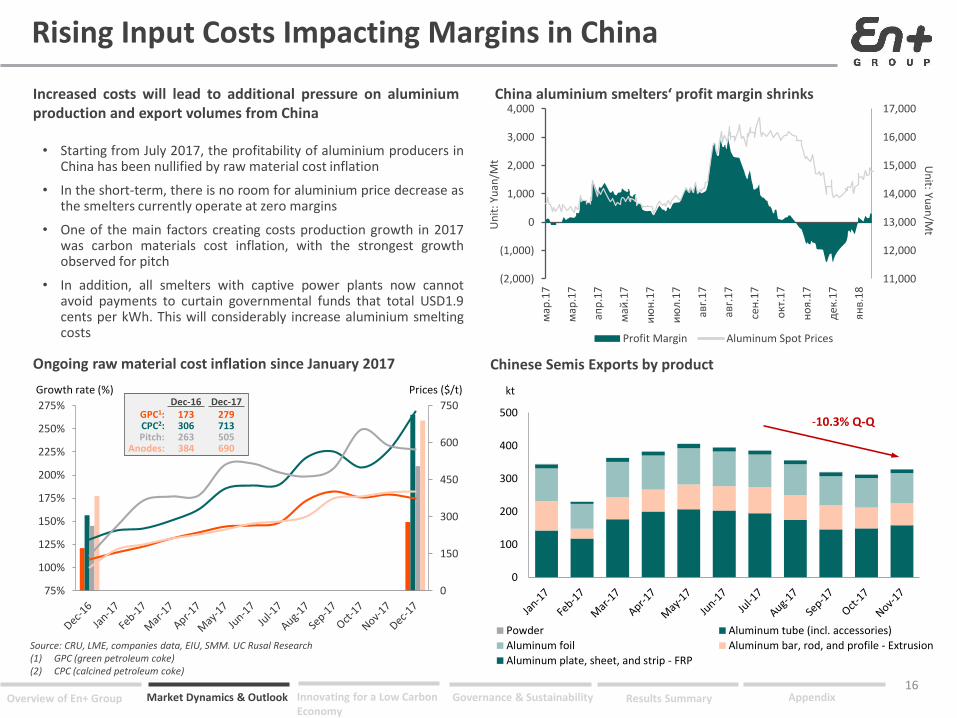
Rising Input Costs Impacting Margins in China
• Starting from July 2017, the profitability of aluminium producers inChina has been nullified by raw material cost inflation
• In the short-term, there is no room for aluminium price decrease asthe smelters currently operate at zero margins
• One of the main factors creating costs production growth in 2017was carbon materials cost inflation, with the strongest growthobserved for pitch
• In addition, all smelters with captive power plants now cannotavoid payments to curtain governmental funds that total USD1.9cents per kWh. This will considerably increase aluminium smeltingcosts
Increased costs will lead to additional pressure on aluminiumproduction and export volumes from China
Ongoing raw material cost inflation since January 2017
Prices ($/t)Growth rate (%)
Source: CRU, LME, companies data, EIU, SMM. UC Rusal Research(1) GPC (green petroleum coke)(2) CPC (calcined petroleum coke)
Chinese Semis Exports by product
-10.3% Q-QGPC1:CPC2:Pitch:
Anodes:
173306263384
279713505690
Dec-16 Dec-17kt
China aluminium smelters‘ profit margin shrinks
16
0
150
300
450
600
750
75%
100%
125%
150%
175%
200%
225%
250%
275%
11,000
12,000
13,000
14,000
15,000
16,000
17,000
(2,000)
(1,000)
0
1,000
2,000
3,000
4,000
мар
.17
мар
.17
апр
.17
май
.17
ию
н.1
7
ию
л.1
7
авг.
17
авг.
17
сен
.17
окт
.17
но
я.1
7
дек
.17
янв.
18
Un
it: Yuan
/MtU
nit
: Yu
an/M
t
Profit Margin Aluminum Spot Prices
Overview of En+ Group Market Dynamics & Outlook Governance & Sustainability Results Summary AppendixInnovating for a Low Carbon Economy
3.84
0.75 5.0
0.45
2016Production
BEMO Taishet Total PotentialProduction
Power Generation of En+ Group HPPs5
(TWh)
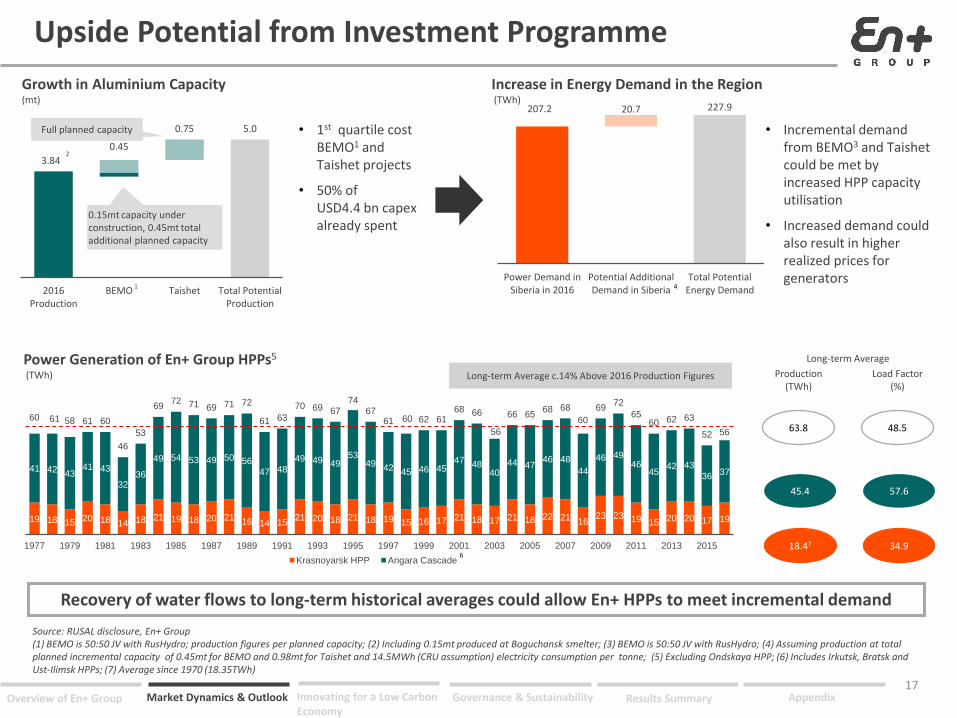
Upside Potential from Investment Programme
Source: RUSAL disclosure, En+ Group(1) BEMO is 50:50 JV with RusHydro; production figures per planned capacity; (2) Including 0.15mt produced at Boguchansk smelter; (3) BEMO is 50:50 JV with RusHydro; (4) Assuming production at total planned incremental capacity of 0.45mt for BEMO and 0.98mt for Taishet and 14.5MWh (CRU assumption) electricity consumption per tonne; (5) Excluding Ondskaya HPP; (6) Includes Irkutsk, Bratsk and Ust-Ilimsk HPPs; (7) Average since 1970 (18.35TWh)
Growth in Aluminium Capacity(mt)
Increase in Energy Demand in the Region(TWh)
• 1st quartile cost BEMO1 and Taishet projects
• 50% of USD4.4 bn capex already spent
• Incremental demand from BEMO3 and Taishetcould be met by increased HPP capacity utilisation
• Increased demand could also result in higher realized prices for generators
12
2
0.15mt capacity under construction, 0.45mt total additional planned capacity
Full planned capacity
207.2 20.7 227.9
Power Demand inSiberia in 2016
Potential AdditionalDemand in Siberia
Total PotentialEnergy Demand
Recovery of water flows to long-term historical averages could allow En+ HPPs to meet incremental demand
17
19 18 15 20 18 14 18 21 19 18 20 21 16 14 1521 20 18 21 18 19 15 16 17 21 18 17 21 18 22 21 16
23 23 19 15 20 20 17 19
41 42 4341 43
3236
49 54 53 49 50 56
47 48
49 49 4953
49 42 45 46 4547 48
4044 47
46 48
44
46 4946
4542 43
36 37
60 61 58 61 60
46
53
6972 71 69 71 72
61 63
70 69 6774
6761 60 62 61
68 66
56
66 6568 68
60
6972
6560 62 63
52 56
1977 1979 1981 1983 1985 1987 1989 1991 1993 1995 1997 1999 2001 2003 2005 2007 2009 2011 2013 2015
Krasnoyarsk HPP Angara Cascade
Long-term Average
Production(TWh)
Load Factor(%)
63.8 48.5
45.4 57.6
18.47 34.9
Long-term Average c.14% Above 2016 Production Figures
6
4

Overview of En+ Group Market Dynamics & Outlook Governance & Sustainability Results Summary AppendixInnovating for a Low Carbon Economy
Siberian Power Market Supply Demand Dynamics
Power demand growth is expected to exceed capacity additions. Ramp up of RUSAL’s BEMO2 and Taishet brownfield projects will further increase demand by 17.4TWh, representing 11.5% increase vs. 20161
Electricity Consumption(TWh)
Areas of Additional Demand Growth
Source: System Operator, Rosstat, SEEPX Energy (base case)(1) Assuming production at total planned additional capacity of 0.45mt for BEMO and 0.75mt for Taishet and 14.5MWh electricity consumption per tonne. 17.4TWh increase represents 11.5% of 2016 electricity consumption in Siberia; (2) BEMO is 50:50 JV with RusHydro
Capacity Supply(GW)
2016–2022 CAGR: 0.5%
Further 17.4TWh / 11.5%increase in demand from
BEMO and Taishet ramp up1
2016–2022 CAGR: 0.1%
+4.5 TWhincreaseby 2022
Boguchansk aluminum smelter (includes 0.15mt out of 0.6mt of production capacity)
Suzun, Tagul and Lodochny oil and gas fields
Mining gold ore at Noibinsk gold ore field by the end of 2018
New gold fields and a gold extracting plant
Construction of a gold mine at Vysokoye field
Construction of sport, transport, engineering and tourist infrastructure for 2019 Universities winter games
Krasnoyarsk Region
Irkutsk Region
+2.2 TWhincreaseby 2022
Electric and metallurgical plant in Bratsk
Modernization and expansion of Angarsk polymer plant
6 new oil pump stations to increase capacity of Eastern Siberia-Pacific Ocean oil pipeline, TransSiberian and Baikal-Amur railways, Development of new gold mining fields including the largest gold ore mining field Sukhoi Log
Other Regions
Development of Zhernov coal field in Novokuznetsk and Prokopievsk
Polymetallic ore fields development, first stage of Udokan mining and metallurgical plant
Launch of Bystrinsk mining and processing plant
Completion of Elegest mining and processing plant (end of 2017) in conjunction with Elegest-Kyzyl-Kuragino railroad construction
Other
Other
Other
45
47
49
51
53
2011 2012 2013 2014 2015 2016 2017 2018 2019 2020 2021 2022
Existing Capacity Newly Comissioned Capacity
200
205
210
215
220
2011 2012 2013 2014 2015 2016 2017 2018 2019 2020 2021 2022
18

3832262 12Overview of En+ Group
Market Dynamics & Outlook
Results Summary
AppendixGovernance & Sustainability
19Innovating for a Low Carbon Economy
19

Overview of En+ Group Market Dynamics & Outlook Governance & Sustainability Results Summary AppendixInnovating for a Low Carbon Economy
20
New and R&D Projects
• Construction of captive CHPs (up to 25 MW) for large industrial players
• Construction of captive solar power plants
• Implementation of Smart Grid (intelligent electricity micro-network) in distributed generation projects
• Smart Grid equipment production in Russia and promotion of smart meters
• Energy storage projects for power shortages compensation in grids and in-time load leveling in Smart Grid
• R&D of highly efficient solar perovskite panels
• Small Solar Power Plants with installed capacity up to 10 KW for retail clients
• Own Production of the components for solar power plants
• Developments of HPPs for residential and commercial use
• Construction of small HPPs with total installed capacity up to 150 MW
• Recovery of unexploitable HPPs with existing dams
• Exploration of new boundary sites
Distributed Generation
Smart GridProjects
Solar Energy
Small HPP Construction

Overview of En+ Group Market Dynamics & Outlook Governance & Sustainability Results Summary AppendixInnovating for a Low Carbon Economy
21
Aluminium in Low Carbon Economy
Aluminium is a key material in transportation, buildings, packaging and renewable technologies estimated with demand to double in a 2°C scenario when compared to a 4°C scenario
Circular EconomyDemand for aluminium products has doubled since 2000. Metal demand is projected to increase to about 97 mnt in 2020 (with about 31 mnt from recycled scrap). Aluminium can be recycled over and over again without significant loss of quality, and secondary aluminium requires only 5% of the energy of primary production. 75% of all aluminium ever produced is currently still in use
Sustainable Transport Aluminium helps to reduce the weight of cars, buses, trucks, planes, and trains. In turn, energy consumption is reduced during transport. Vehicles built with aluminium can achieve up to a 20% reduction in energy consumption throughout their life cycle and up to a 17% reduction in CO2 emissions
Green Buildings Aluminium is a key component in LEED- and BREEAM-certified green buildings. Aluminium is superior to steel and iron in its ability to reflect the infrared (heat) rays of the sun, dramatically improving energy efficiency
Low Carbon Packaging Plastic production relies heavily on fossil fuels and is slated to account for 20% of all oil consumption by 2050. Aluminiumpackaging therefore plays a pivotal role in moving the world towards more sustainable materials
Renewable Technologies Aluminium is necessary for manufacturing wind turbines, solar photovoltaic technologies, and lithium ion batteries
Source: World Bank. The Growing Role of Minerals and Metals for a Low Carbon Future June 2017.
Overview of En+ Group Market Dynamics & Outlook Governance & Sustainability Results Summary AppendixInnovating for a Low Carbon Economy
22
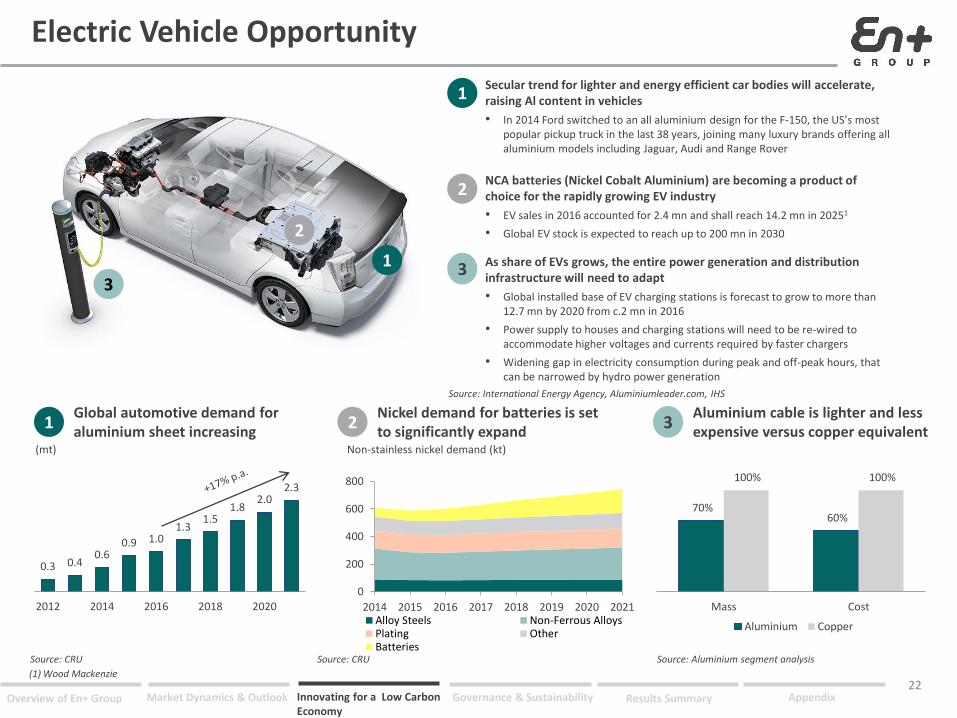
Electric Vehicle Opportunity
0
200
400
600
800
2014 2015 2016 2017 2018 2019 2020 2021Alloy Steels Non-Ferrous AlloysPlating OtherBatteries
0.3 0.40.6
0.9 1.01.3
1.51.8
2.02.3
2012 2014 2016 2018 2020
(mt)
3
2
1
1Secular trend for lighter and energy efficient car bodies will accelerate, raising Al content in vehicles
• In 2014 Ford switched to an all aluminium design for the F-150, the US’s most popular pickup truck in the last 38 years, joining many luxury brands offering all aluminium models including Jaguar, Audi and Range Rover
2NCA batteries (Nickel Cobalt Aluminium) are becoming a product of choice for the rapidly growing EV industry
• EV sales in 2016 accounted for 2.4 mn and shall reach 14.2 mn in 20251
• Global EV stock is expected to reach up to 200 mn in 2030
3 As share of EVs grows, the entire power generation and distribution infrastructure will need to adapt
• Global installed base of EV charging stations is forecast to grow to more than 12.7 mn by 2020 from c.2 mn in 2016
• Power supply to houses and charging stations will need to be re-wired to accommodate higher voltages and currents required by faster chargers
• Widening gap in electricity consumption during peak and off-peak hours, that can be narrowed by hydro power generation
70% 60%
100% 100%
Mass Cost
Aluminium Copper
Source: International Energy Agency, Aluminiumleader.com, IHS
Source: CRU Source: Aluminium segment analysisSource: CRU
1Global automotive demand for aluminium sheet increasing
2Nickel demand for batteries is set to significantly expand
3Aluminium cable is lighter and less expensive versus copper equivalent
Non-stainless nickel demand (kt)
(1) Wood Mackenzie
Overview of En+ Group Market Dynamics & Outlook Governance & Sustainability Results Summary AppendixInnovating for a Low Carbon Economy
23
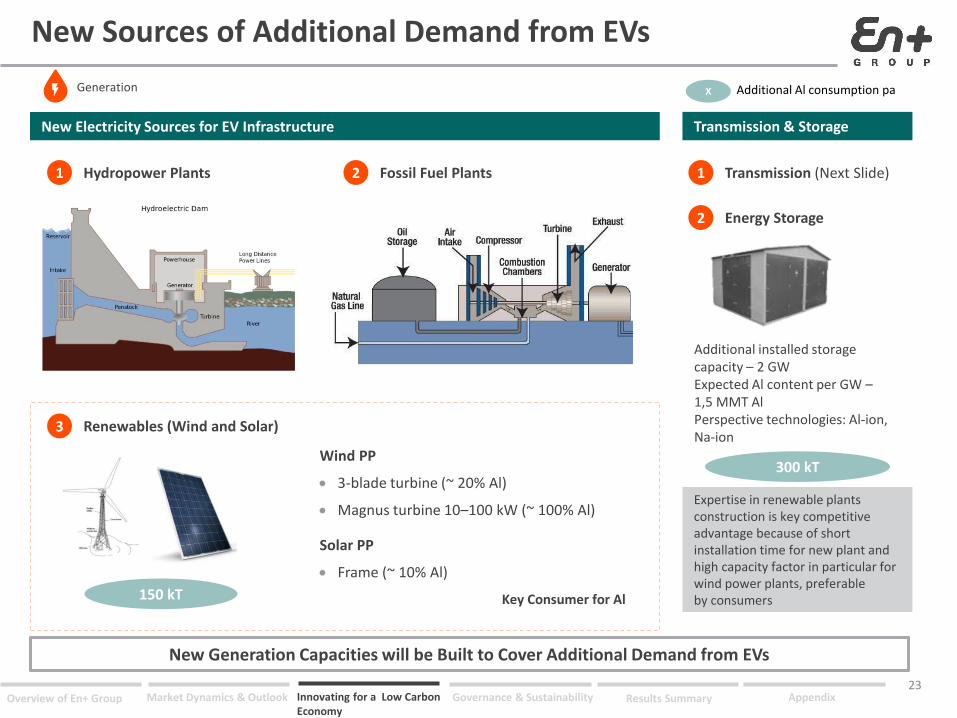
New Sources of Additional Demand from EVs
Additional Al consumption pa
New Electricity Sources for EV Infrastructure
Hydropower Plants1 Fossil Fuel Plants2 Transmission (Next Slide)1
Expertise in renewable plants construction is key competitive advantage because of short installation time for new plant and high capacity factor in particular for wind power plants, preferable by consumers
Energy Storage2
Additional installed storage capacity – 2 GWExpected Al content per GW –1,5 MMT AlPerspective technologies: Al-ion, Na-ion
150 kT
Renewables (Wind and Solar)3
Wind PP
3-blade turbine (~ 20% Al)
Magnus turbine 10–100 kW (~ 100% Al)
Solar PP
Frame (~ 10% Al)
300 kT
Key Consumer for Al
Transmission & Storage
New Generation Capacities will be Built to Cover Additional Demand from EVs
Generation X

Overview of En+ Group Market Dynamics & Outlook Governance & Sustainability Results Summary AppendixInnovating for a Low Carbon Economy
24
The Demand from New “Electric” WorldG
lob
al A
lum
inu
m C
on
sum
pti
on
Past Present Future
Technology disruptionRapid GrowthEarly Adoption
• Drones were early adaptors for electric engines based on batteries due to low weight of models
• Electric vehicles are the most valuable segment from aluminium consumption perspectives due to increasing infrastructure coverage (chargers et.) and lower cost of ownership compared to ICE cars now
• There are prototypes for other transport – trains, planes and ships, based on batteries but a radial decrease in battery price and rise in power density should occur for these projects to become economically viable
Time
Vehicles are the Pioneers for Wider Adoption of Industrial Batteries and Increase Aluminium Demand in the New “Electric” World
Overview of En+ Group Market Dynamics & Outlook Governance & Sustainability Results Summary AppendixInnovating for a Low Carbon Economy
25
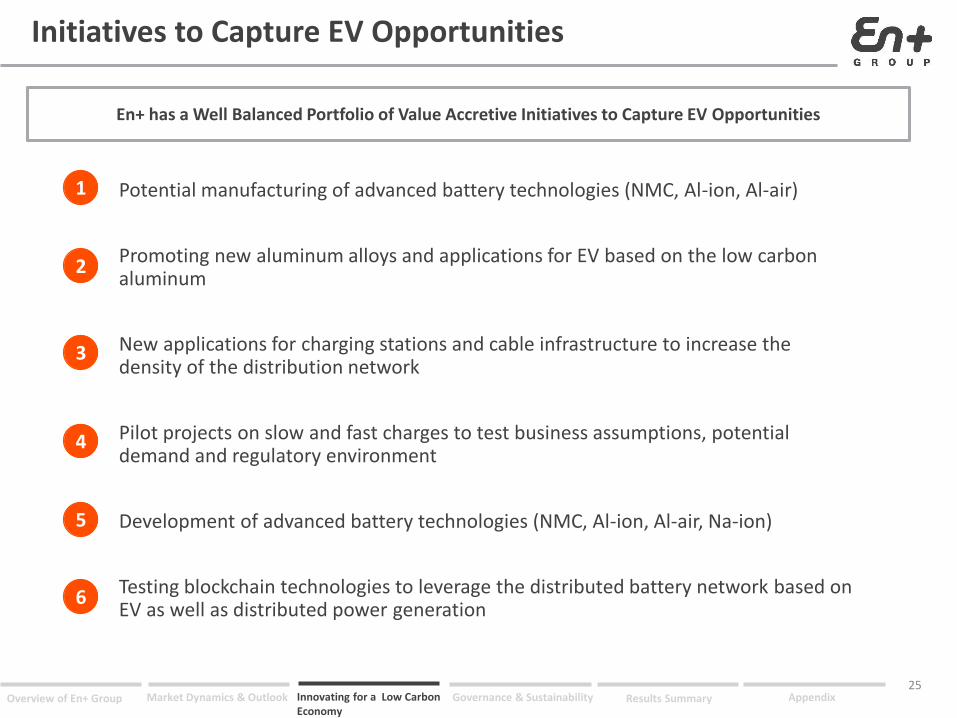
Initiatives to Capture EV Opportunities
Potential manufacturing of advanced battery technologies (NMC, Al-ion, Al-air)
Promoting new aluminum alloys and applications for EV based on the low carbon aluminum
New applications for charging stations and cable infrastructure to increase the density of the distribution network
Pilot projects on slow and fast charges to test business assumptions, potential demand and regulatory environment
Development of advanced battery technologies (NMC, Al-ion, Al-air, Na-ion)
Testing blockchain technologies to leverage the distributed battery network based on EV as well as distributed power generation
1
2
3
4
5
6
En+ has a Well Balanced Portfolio of Value Accretive Initiatives to Capture EV Opportunities

26
3832262 12Overview of En+ Group
Market Dynamics & Outlook
Results Summary
AppendixGovernance & Sustainability
19Innovating for a Low Carbon Economy

Overview of En+ Group Market Dynamics & Outlook Governance & Sustainability Results Summary AppendixInnovating for a Low Carbon Economy
73
2 Major Shareholder’s Appointees
Independent NEDs
Robust Corporate Governance
Composition of the board Board committees
Riccardo Orcel (VTB representative)• Mr. Orcel joined VTB in 2011 and currently acts as Head of Global
Banking, International Coverage, VTB International
• Mr. Orcel has over 30 years of experience in the banking industry primarily at VTB and 17 years at Merrill Lynch
Guang Ming Zhao (AnAn Group representative)• Executive Director and CEO of AnAn International Limited
• Previously served as Senior Deputy Manager and Senior Manager of the Investment Department at China Huarong Asset Management Co., Ltd.
• Audit(Chairman: Philippe Mailfait (INED))
• Remuneration(Chairman: Gulzhan Moldazhanova (NED))
• Corporate Governance and Nominations(Chairman: Philippe Mailfait (INED))
51 Independent and Minority Shareholder Non-executive Directors
Rt. Hon. Lord Barker of Battle: Chairman• Served as UK Minister of State for Energy & Climate Change 2010-2014
• Elected to Parliament in 2001, serving on the Environmental Audit Select Committee 2001-2005
Dominique Fraisse: INED• Global Head of Energy & Natural Resources of Natixis CIB
• Served as Global Head of Energy & Commodities and was responsible for structured and commodity trade Finance 2013-2017
Philippe Mailfait: INED• Mr. Mailfait acts as an Independent Financial Advisor in Paris and
holds the position of Independent Director at different companies
• Has held executive positions at Banque Worms and Banque de Gestion Privee (Paris), Morgan Grenfell & Co. (London, Paris), and others
NEDs1
(1) En+ Group signed a non-binding term sheet with Amokenga Holdings Limited ("AHL"), a subsidiary of Glencore plc ("Glencore"), for the conversion of Glencore's 8.75% shareholding in UC RUSAL into GDRs representing ordinary shares of the Company. The conversion is expected to occur following the IPO. The conversion is subject to the execution of definitive transaction agreements and all necessary governmental and regulatory approvals. Mr. Ivan Glasenberg to be appointed as NED following the completion of transaction.
27

Overview of En+ Group Market Dynamics & Outlook Governance & Sustainability Results Summary AppendixInnovating for a Low Carbon Economy
Initiatives contributing to sustainable business development underpinning corporate and social responsibilityand commitment to low carbon production, as well as environmental stewardship
Key goals of the En+ Group’s environmental strategy
Low carbon aluminium
Reduction of GHG emissions
New technology
• To achieve 95% of carbon-free power in Rusal energy mix by 2025
• by 15% at smelters by 2025 from 2014 level
• by 10% at alumina refineries by 2025 from 2014 level
• by 12% at CHPs in Siberia by 2020 from 2016 level
• To achieve by 2025 an average level of specific direct and indirect energy related greenhouse gas emissions from reduction processes not exceeding 2.7 tonnes of CO2 per tonne of aluminium at Rusal’saluminium smelters
• Pursuing projects for the development of renewable pilot sources: Solar power plant in Abakan; Smart grids; Distribution generation
Using renewable and environmentally friendly hydro generated electricity, En+ Group is committed to having the lowest CO2 footprint in the industry
Focus On Sustainable Business Development
28

Overview of En+ Group Market Dynamics & Outlook Governance & Sustainability Results Summary AppendixInnovating for a Low Carbon Economy
Focus On Sustainable Business Development (Cont)
In-house R&D, engineering and design resources, which enable to develop cutting-edge technologies, state-of-the art equipment and advanced facilities
Inert anode technology
Modernizationof HPPs
• Ultra-high power proprietary RA-550 cells which have the highest environmental performance and efficiency
• Ground-breaking technology, capable of revolutionising the global industry
• Achieving increase in capacity as a result
RA-550 cells
Scandium oxide from red mud
Green Soderberg
• Unique technology to produce scandium oxide from red mud – a pilot unit launched at the Urals Al smelter
• New technology allows radically reduced emissions of fluorides, dust and tars, as well as increased efficiency
Advanced engineering / in-house technological development
Initiatives contributing to sustainable business development underpinning corporate and social responsibilityand commitment to low carbon production, as well as environmental stewardship
29

Overview of En+ Group Market Dynamics & Outlook Governance & Sustainability Results Summary AppendixInnovating for a Low Carbon Economy
Focus On Sustainable Business Development (Cont)
Track record of successful implementation of social initiatives
Social initiatives
Baikal preservation
Ecological volunteering
WWF partnership
Promotion of technical skills among children and students
• Establishment of the unique Baikal cultural and natural heritage protection program
• Development of ecological volunteering through corporate and ecological marathon and cleaning of the banks of lake Baikal
• In 2015 WWF in partnership with En+ Group issued a research report about perspectives of hydropower development at Amur river basin
• Development of robotics training centers based in local schools in Irkutsk region
Initiatives contributing to sustainable business development underpinning corporate and social responsibilityand commitment to low carbon production, as well as environmental stewardship
30
Overview of En+ Group Market Dynamics & Outlook Governance & Sustainability Results Summary AppendixInnovating for a Low Carbon Economy
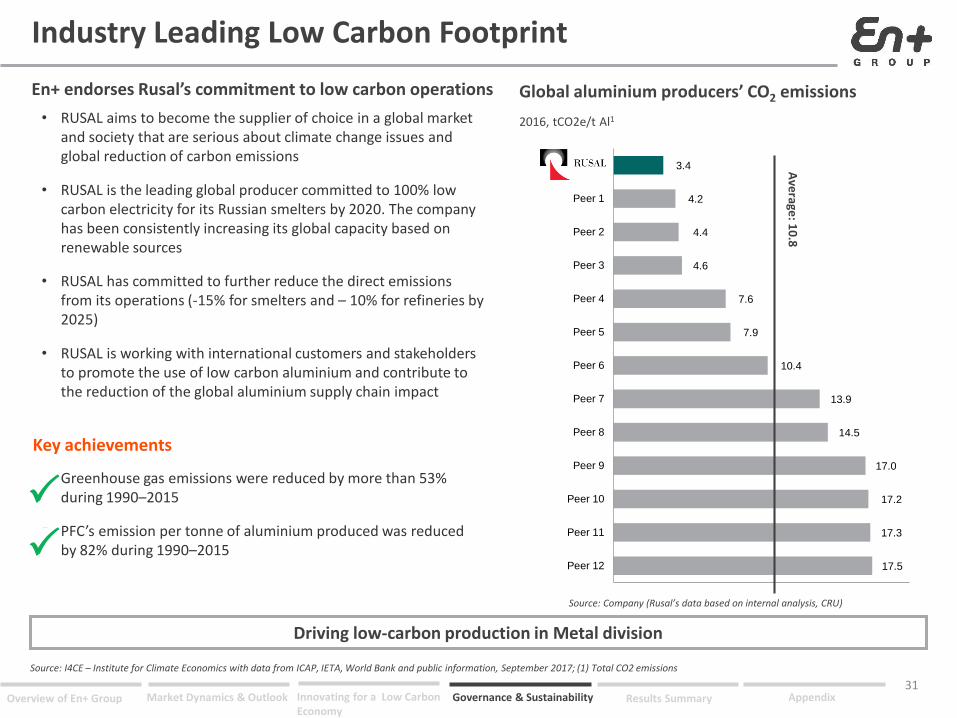
Industry Leading Low Carbon Footprint
Global aluminium producers’ CO2 emissions
17.5
17.3
17.2
17.0
14.5
13.9
10.4
7.9
7.6
4.6
4.4
4.2
3.4
Peer 12
Peer 11
Peer 10
Peer 9
Peer 8
Peer 7
Peer 6
Peer 5
Peer 4
Peer 3
Peer 2
Peer 1
RUSAL Ave
rage: 1
0.8
2016, tCO2e/t Al1
Source: Company (Rusal’s data based on internal analysis, CRU)
Source: I4CE – Institute for Climate Economics with data from ICAP, IETA, World Bank and public information, September 2017; (1) Total CO2 emissions
• RUSAL aims to become the supplier of choice in a global market and society that are serious about climate change issues and global reduction of carbon emissions
• RUSAL is the leading global producer committed to 100% low carbon electricity for its Russian smelters by 2020. The company has been consistently increasing its global capacity based on renewable sources
• RUSAL has committed to further reduce the direct emissions from its operations (-15% for smelters and – 10% for refineries by 2025)
• RUSAL is working with international customers and stakeholders to promote the use of low carbon aluminium and contribute to the reduction of the global aluminium supply chain impact
Key achievements
Greenhouse gas emissions were reduced by more than 53% during 1990–2015
PFC’s emission per tonne of aluminium produced was reduced by 82% during 1990–2015
Driving low-carbon production in Metal division
P
P
En+ endorses Rusal’s commitment to low carbon operations
31

32
3832262 12Overview of En+ Group
Market Dynamics & Outlook
Results Summary
AppendixGovernance & Sustainability
19Innovating for a Low Carbon Economy

Overview of En+ Group Market Dynamics & Outlook Governance & Sustainability Results Summary AppendixInnovating for a Low Carbon Economy
2017 Key Highlights
• En+ Group successfully completed its IPO both on the LSE and MOEX on 8 November 2017
• Largest IPO in the Metals & Mining and Utilities sectors worldwide in 2017
• Primary IPO proceeds used to fully repay the USD942 mn VTB debt-facility in the Energy segment after period end. As a result, segment’s total debt decreased to USD4,661 mn on a pro-forma basis post-IPO
• Further improvement of Metals segment debt cost and maturity profile
Implementation of robust corporate governance practices on track:
• 3 INEDs appointed in 2017
• Vladislav Solovyev appointed as a Non-Executive Director in December 2017
• Appointment of representative of AnAn Group – Guang Ming Zhao, as a Non-Executive Director in December 2017
• Intention to appoint a representative of Glencore – Ivan Glasenberg, as a Non-Executive Director following completion of swap transaction1
• En+ Group’s newly adopted dividend policy has the following parameters:
- 75% of Free Cash Flow of the Energy segment, subject to a minimum of USD250 mn per year
- 100% of dividends received from UC Rusal
• Declared USD125 mn of interim dividends in October 2017; record date of 30 November 2017; payment date 20 December 2017
USD1.5 bn IPO in November
Continuing focus on deleveraging
Dividends in line with new dividend policy
Board appointments
(1) Glencore is undertaking a swap transaction to swap its 8.75% stake in Rusal for shares in En+.
33

Overview of En+ Group Market Dynamics & Outlook Governance & Sustainability Results Summary AppendixInnovating for a Low Carbon Economy
68.2%
6.2%
4.5%
10.6%
3.7%6.8%
Primary aluminium and alloys Alumina and bauxite
Semi-finished products and foil Electricity
Heat Other
En+ Group – 9M And 3Q 2017 Financial Highlights
• The En+ Group’s total revenue for 9M 2017 reached USD8,716 mn, increasing by 21% YoY. In 3Q 2017, total revenue accounted for USD2,875 mn, increasing by 17% compared to 3Q 2016
• Key factor contributing to this substantial growth was the increase in realised aluminium prices, driven by LME component growth
• On the back of top-line growth and a continuous focus on operational efficiencies, 3Q 2017 En+ Group EBITDA increased by 41% as compared to 3Q 2016, reaching USD803 mn
• Despite RUB appreciation and inflationary pressures impacting the aluminium cost base, En+ Group EBITDA margin expanded by 5pp and reached 28% in 3Q 2017
• The Group’s net debt2 decreased to USD13,103 mn at the end of 3Q 2017 from USD13,811 mn at the end of 2Q 2017
USD mn 9M 16 9M 17 Change 3Q 16 3Q 17 Change
Revenues 7,203 8,716 21.0% 2,455 2,875 17.1%
Adj. EBITDA1 1,622 2,316 42.8% 571 803 40.6%
Adj. EBITDA margin 23% 27% 4 pp 23% 28% 5 pp
Net profit 561 898 60.1% 244 350 43.4%
Net profit margin 8% 10% 2 pp 10% 12% 2 pp
9M 2017 revenue breakdown by product
(1) Adjusted EBITDA for any period represents the results from operating activities adjusted for amortisation and depreciation, impairment charges and loss on disposal of property, plant and equipment for the relevant period
(2) Sum of loans and borrowings, bonds outstanding, guarantee for a related party and deferred liability for acquisition of PJSC Irkutskenergo (the Group’s subsidiary) shares less total cash and cash equivalents
USD 8,716 mn
34
Overview of En+ Group Market Dynamics & Outlook Governance & Sustainability Results Summary AppendixInnovating for a Low Carbon Economy
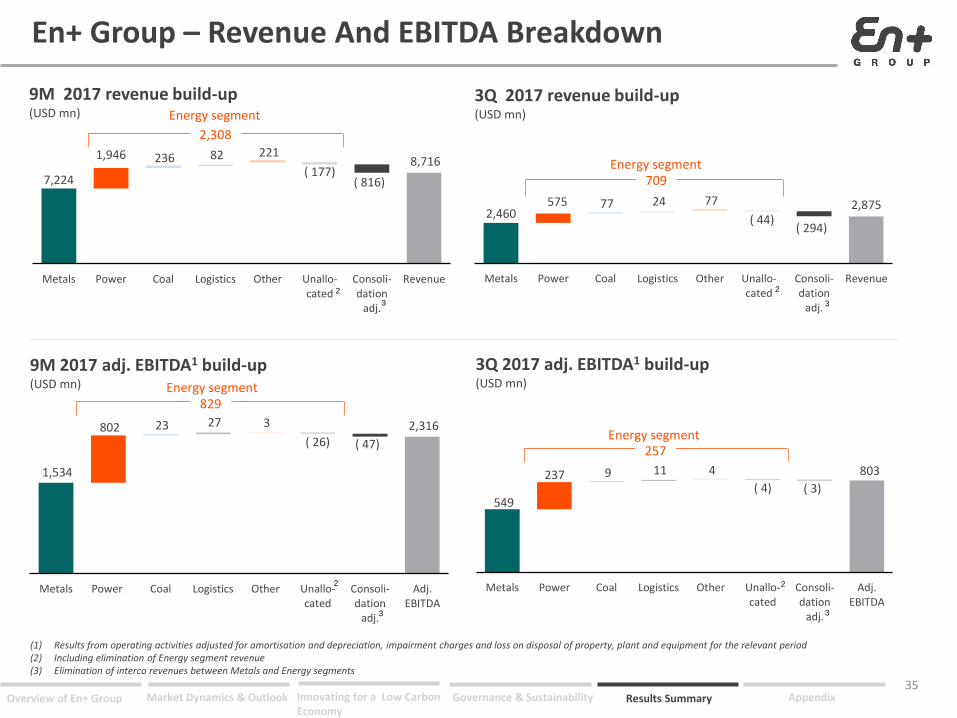
803
549
237 9 11 4
( 4) ( 3)
Metals Power Coal Logistics Other Unallo-cated
Consoli-dation
adj.
Adj.EBITDA
En+ Group – Revenue And EBITDA Breakdown
3Q 2017 revenue build-up(USD mn)
3Q 2017 adj. EBITDA1 build-up(USD mn)
(1) Results from operating activities adjusted for amortisation and depreciation, impairment charges and loss on disposal of property, plant and equipment for the relevant period(2) Including elimination of Energy segment revenue(3) Elimination of interco revenues between Metals and Energy segments
9M 2017 revenue build-up(USD mn)
9M 2017 adj. EBITDA1 build-up(USD mn)
2,316
1,534
802 23 27 3
( 26) ( 47)
Metals Power Coal Logistics Other Unallo-cated
Consoli-dation
adj.
Adj.EBITDA
8,716
7,224
1,946 236 82 221
( 177)( 816)
Metals Power Coal Logistics Other Unallo-cated
Consoli-dation
adj.
Revenue
2,8752,460
575 77 24 77
( 44)( 294)
Metals Power Coal Logistics Other Unallo-cated
Consoli-dation
adj.
Revenue
2,308
829
709
257
Energy segment
Energy segment
Energy segment
Energy segment
2
2 2
2
3
3 3
3
35

Overview of En+ Group Market Dynamics & Outlook Governance & Sustainability Results Summary AppendixInnovating for a Low Carbon Economy
Leading vertically integrated, sustainable low cost aluminium producer
Management Strategic Outlook
(1) 50/50 JV-partnership with RusHydro(2) Project feasibility is under review to complete 1st phase of project subject to non-recourse project financing/JV-partnership
Metals
Energy
Dividends
CAPEX
Leverage
Corporate governance
• Increase in self-sufficiency in bauxites and anodes
• Growing share of VAPs with target of 60% in sales mix by 2021
• Develop low-cost and low-risk brownfield expansion: BEMO1 and Taishet2
• The Energy segment is well positioned to deliver sustainable performance through the cycle and to capture regional electricity demand upside potential on the back of brownfield expansion projects’ completion in the Metals segment
• Commitment to pay dividends on at least semiannual basis as a sum of:
75% of Free Cash Flow of Energy segment (min. - USD250 mn per year)
100% of dividends received from UC Rusal
• Stable and controlled capex in Metals segment directed towards optimisation of core operations and delivery on strategic priorities (vertical integration and VAPs)
• Energy segment capex level consistent with historical average
• Continued focus on deleveraging, decreasing of cost of debt and extension of maturity in both segments
• Commitment to robust corporate governance practices
36

Overview of En+ Group Market Dynamics & Outlook Governance & Sustainability Results Summary AppendixInnovating for a Low Carbon Economy
The En+ Investment Case
37
(1) According to SEEPX; (2) According to CRU estimates; (3) Calculated, for any period, as cash flows generated from operating activities before capital expenditures and interest less interest paid and less capital expenditures adjusted for restructuring fees, payments from settlement of derivative instruments, one-off acquisitions plus dividends from associates and joint ventures.
Resilient Business with Unique Asset Base and Attractive Growth Prospects
1
2
3
4
5
6
Global Leader in Hydro Power Generation and Aluminium Production
• #1 Independent hydro power producer globally1
• #1 Aluminium producer in the world (ex-China)2
Vertically Integrated Green Business Model
• 63.8 TWh En+ Siberian HPPs long-term average power production vs. 59.4 TWh Rusal power consumption in Siberia in 20162
• 100% self-sufficiency in alumina and c.80% in bauxites and nephelines
Unique Asset Base and Operational Excellence Contributing to Cost Leadership
• Favourably located cost-efficient HPPs resulting in one of the lowest cost position in aluminium for En+ Group
Strong and Resilient Cash Flow Generation Underlying Sustainable Shareholder Returns
• 75% of Free Cash Flow3 of Energy segment in dividends supplemented by 100% of UC Rusal dividends
Experienced Management and Robust Corporate Governance
• Following international standards of corporate governance
• At least 3 independent directors
Upside Potential from Multiple Catalysts
• Spare capacity of existing HPPs can be utilised to meet increased demand upon ramp up of UC Rusal brownfield smelters

38
3832262 12Overview of En+ Group
Market Dynamics & Outlook
Results Summary
AppendixGovernance & Sustainability
19Innovating for a Low Carbon Economy

Overview of En+ Group Market Dynamics & Outlook Governance & Sustainability Results Summary AppendixInnovating for a Low Carbon Economy
39
En+ Group – Historical Financial Summary
USD mn 2016 2015 2014
Revenue 9,776 10,529 11,917
Adj. EBITDA1 2,311 2,732 2,168
Adj. EBITDA margin (%) 23.6% 25.9% 18.2%
PBT 1,665 840 (504)
Net profit 1,361 580 (624)
Net profit margin (%) 13.9% 5.5% (5.2%)
Net Debt2 13,939 11,826 12,400
Net Working Capital 3 1,678 1,597 1,257
FCF4 298 1,081 532
Source: Company information. (1)Adjusted EBITDA for any period represents the results from operating activities adjusted for amortisation and depreciation, impairment charges and loss on disposal of property, plant and equipment for the relevant period. (2) Net Debt represents the sum of secured and unsecured long-term and short-term debt (including borrowings, bonds, accrued interest, deferred liability for acquisition of shares in Irkutskenergo and provision for guarantee for related parties) less total cash and cash equivalents as at the end of the relevant period(3) Net Working Capital represents inventories plus short-term trade and other receivables (excluding dividend receivables from related parties) less trade and other payables (excluding short-term part of deferred liability for acquisition of shares in Irkutskenergo) as at the end of the relevant period.(4) cash flows generated from operating activities before capital expenditures and interest less interest paid and less capital expenditures adjusted for restructuring fees, payments from settlement of derivative instruments, one-off acquisitions plus dividends from associates and joint ventures.

Overview of En+ Group Market Dynamics & Outlook Governance & Sustainability Results Summary AppendixInnovating for a Low Carbon Economy
Contacts
40
For further information, please visithttp://eng.enplus.ru/or contact:
For media: E: [email protected]
For investors: E: [email protected]
T: +7 (495) 642 7937

Disclaimer
THIS DOCUMENT AND ITS CONTENTS ARE NOT FOR RELEASE, PUBLICATION OR DISTRIBUTION, IN WHOLE OR IN PART, DIRECTLY OR INDIRECTLY,IN OR INTO OR FROM THE UNITED STATES OF AMERICA, CANADA, AUSTRALIA, JAPAN OR ANY JURISDICTION WHERE SUCH DISTRIBUTION IS UNLAWFUL.This presentation may contain “forward-looking statements”, which are statements related to the future business and financial performance and future events or developments involving the En+ Group. Such forward-looking statements are based on the current expectations and certain assumptions of the En+ Group’s management, and, therefore, should be evaluated with consideration taken into of risks and uncertainties inherent in the En+ Group’s business. A variety of factors, many of which are beyond the En+ Group’s control, can materially affect the actual results, which may differ from the forward-looking statements. This presentation includes information presented in accordance with IFRS, as well as certain information that is not presented in accordance with the relevant accounting principles and/or that has not been the subject of an audit. En+ Group does not make any assurance, expressed or implied, as to the accuracy or completeness of any information set forth herein. Past results may not be indicative of future performance, and accordingly En+ Group undertakes no guarantees that its future operations will be consistent with the information included in the presentation. En+ Group accepts no liability whatsoever for any expenses or loss connected with the use of the presentation. Please note that due to rounding, the numbers presented may not add up precisely to the totals provided and percentages may not precisely reflect the absolute figures. Information contained in the presentation is valid only as at the stated date on the cover page. En+ Group undertakes no obligation to update or revise the information or any forward-looking statements in the presentation to reflect any changes after such date. This presentation is for information purposes only. This presentation does not constitute an offer or sale of securities in any jurisdiction or otherwise constitute an invitation or inducement to any person to underwrite, subscribe for or otherwise acquire securities of the En+ Group. If this presentation is provided to you in electronic form, although reasonable care was used to prepare and maintain the electronic version of the presentation, En+ Group accepts no liability for any loss or damage connected to the electronic storage or transfer of information.
41