investor presentation 1q 2011.ppt - metsä board results/2011... · investor presentation 1q 2011 1...
TRANSCRIPT

4.5.2011Investor presentation 1Q 20111
Contents
Investment highlights and update2 Investment Highlights3 Strategy15 Financial Targets17 1Q 2011 Results & Outlook29 Price Development31 Dividend34 InvestmentsFunding and debt information37 Divestments38 Funding and Debt45 Credit Facilities46 Rating History
General presentation47 General Info54 Business Portfolio63 Operations69 Deliveries71 Sourcing79 Owners81 Market Position

4.5.2011Investor presentation 1Q 20112
Investment Highlights
• Strong growing core in high-quality cartonboards– M-real the European market leader in folding boxboard– Good growth potential
• Material profitability turn-around in 2010
• Significant net debt reduction in recent years
• Strategic review ongoing– M-real the forerunner in paper merchanting and coated papers industry
restructuring in Europe– Asset divestments– Extensive cost savings and cash flow improvement programmes

Strategy

Investor presentation 1Q 20114
Consistent Strategic Direction Since 2006
• Cartonboards for consumer packaging the strategic core business
• Divestment of underperforming paper businesses
• Major cost savings through complexity reduction and efficiency improvement
• High pulp and energy self-sufficiency
• Customer orientation and proactive approach to increase prices Extensive restructuring programme 2006
Extension of the restructuring programme 2007
Divestment of Map Merchant Group 2007
New efficiency improvement programme 2007
Self-sufficiency in pulp 2008
Divestment of Graphic Papers 2008
Divestment of Metsä-Botnia’s Uruguayan operations 2009
Profit improvement programme 2010
New profit improvement programme 2011
Investor presentation 1Q 201155
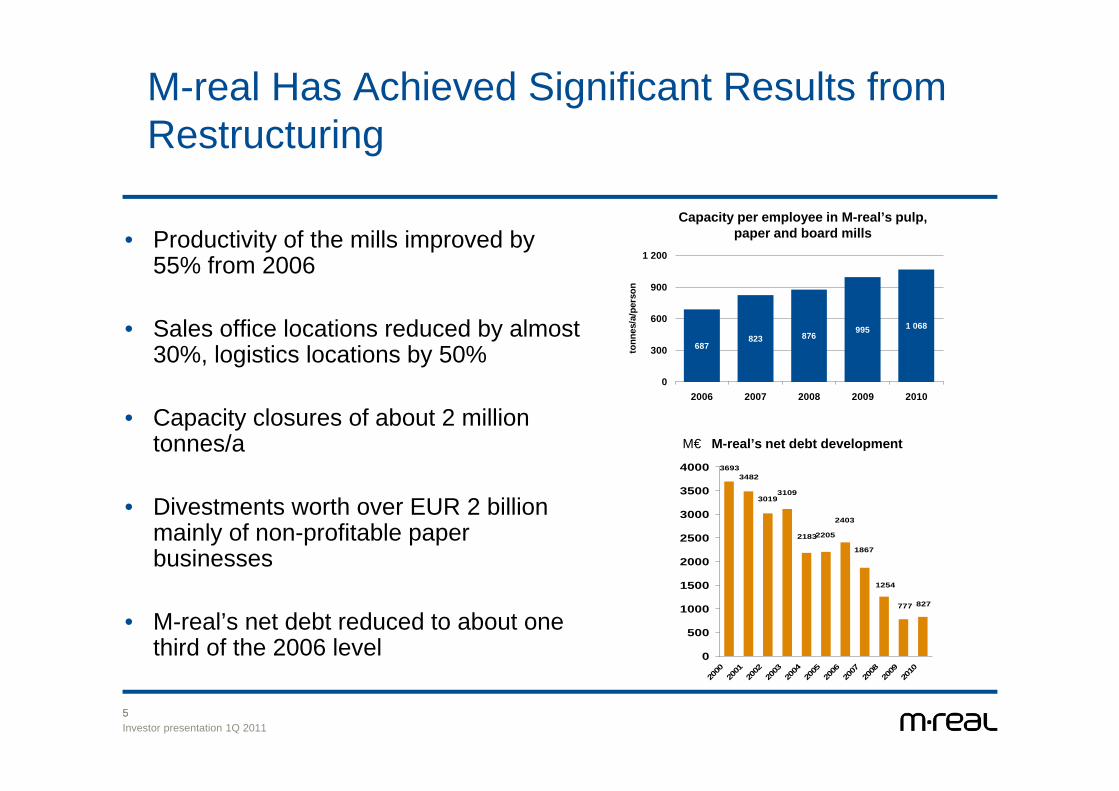
M-real Has Achieved Significant Results from Restructuring
• Productivity of the mills improved by 55% from 2006
• Sales office locations reduced by almost 30%, logistics locations by 50%
• Capacity closures of about 2 million tonnes/a
• Divestments worth over EUR 2 billion mainly of non-profitable paper businesses
• M-real’s net debt reduced to about one third of the 2006 level
687823
1 068995876
0
300
600
900
1 200
2006 2007 2008 2009 2010
tonn
es/a
/per
son
Capacity per employee in M-real’s pulp, paper and board mills
827777
1254
2183
31093019
34823693
2205
2403
1867
0
500
1000
1500
2000
2500
3000
3500
4000
2000
2001
2002
2003
2004
2005
2006
2007
2008
2009
2010
M-real’s net debt developmentM€
6
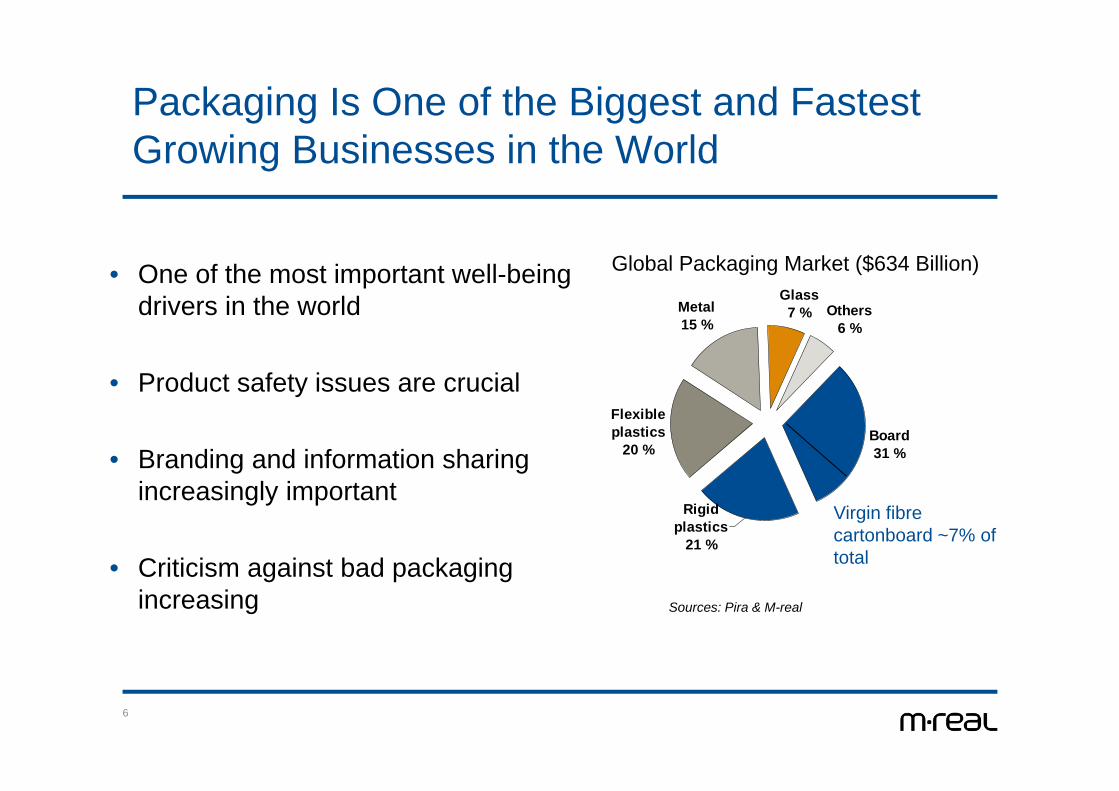
Packaging Is One of the Biggest and Fastest Growing Businesses in the World
• One of the most important well-being drivers in the world
• Product safety issues are crucial
• Branding and information sharing increasingly important
• Criticism against bad packaging increasing
Flexible plastics
20 %
Metal15 %
Glass7 % Others
6 %
Board31 %
Rigid plastics
21 %
Sources: Pira & M-real
Global Packaging Market ($634 Billion)
Virgin fibre cartonboard ~7% of total

Investor presentation 1Q 20117
Several Megatrends Supporting Good Packaging
• Demand for good packaging heavily increasing
• Good packaging is environmentally sustainable– Made out of renewable raw material and recyclable– High energy self-sufficiency in production– Low carbon footprint– Lightweight
• Good packaging is safe– Durable– No migration– Good printing surface
• Good packaging is economical

2.3.2011Investor presentation 1Q 20118
Virgin Fibre Board Is the Best Example of Good Packaging – Lowest Carbon Footprint
• Virgin fibre based lightweight cartonboards the most environmentally sound packaging material
• Wood fibre based products replace non-renewable materials like plastic and aluminium
• Virgin fibre board replaces also recycled fibre based packaging materials
0
2000
4000
6000
8000
10000
12000
14000
M-real's CartaSolida
HDPE PET PLA (Biobasedpolymer)
Aluminium
kg/to
nne
Source: M-real and Sustainable Packaging Coalition - SPC
Cartonboard has the lowest carbon footprint
2.3.2011Investor presentation 1Q 20119
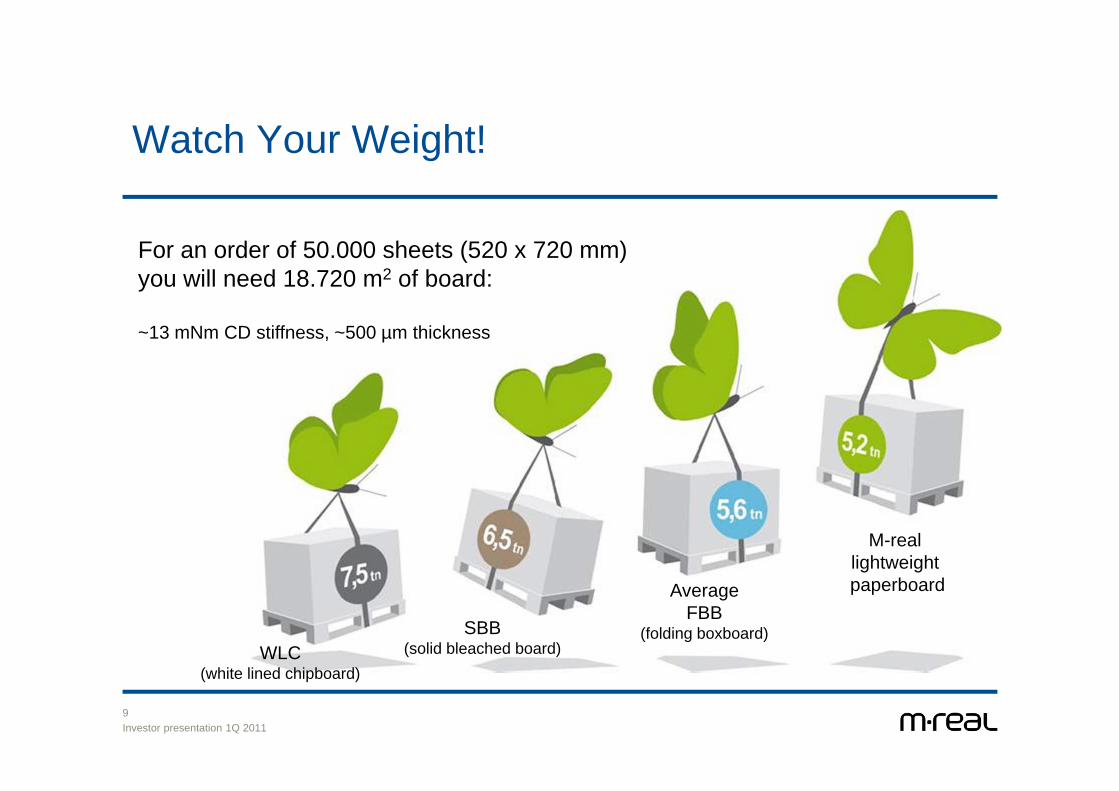
Watch Your Weight!
For an order of 50.000 sheets (520 x 720 mm) you will need 18.720 m2 of board:
~13 mNm CD stiffness, ~500 µm thickness
M-real lightweight paperboardAverage
FBB(folding boxboard)SBB
(solid bleached board)WLC(white lined chipboard)

2.3.2011Investor presentation 1Q 201110
M-real Targets Growth in Its Core Business Packaging
• Huge growth potential in wood fibre based packaging applications when replacing non-sustainable packaging materials
• M-real a strong producer of virgin fibre based cartonboard and white top linerboard as well as packaging related speciality papers
• Access to wood raw material, superior fibre knowhow and pulp self-sufficiency M-real’s important competitive advantages

2.3.2011Investor presentation 1Q 201111
M-real is Investing in Its Cartonboard Business
• 26 m€ investment in 80 kton/a capacity expansion at Simpele
• 16 m€ investment in Kemiart Liners to increase the share of coated products
• M-real invests 30 m€ to expand capacity annually by approximately
70.000 tonnes at Äänekoski and Kyröskoski
– Potential to further increase capacity of existing mills by some 70.000 t/a
• Evaluations regarding further development steps in cartonboard
business continue

2.3.2011Investor presentation 1Q 201112
M-real Strategic Review- M-real’s Response to the Changes in Business Environment
• In March 2006, M-real's Board of Directors initiated a strategic review
• M-real was the first major paper company to emphasize the need for industry consolidation and extensive restructuring
• M-real took the leading role in European paper merchanting restructuring in 2007
• M-real also took the leading role in European coated paper industry restructuring in 2008
• Extensive internal profit improvement programmes

2.3.2011Investor presentation 1Q 201113
Strategic Review of the Paper Business Proceeds
• M-real in strong position in participating restructuring of the European uncoated fine paper business
• M-real Zanders is a leading European speciality paper producer
• Potentially, also separate divestments of the non-profitable units
2.3.2011Investor presentation 1Q 201114
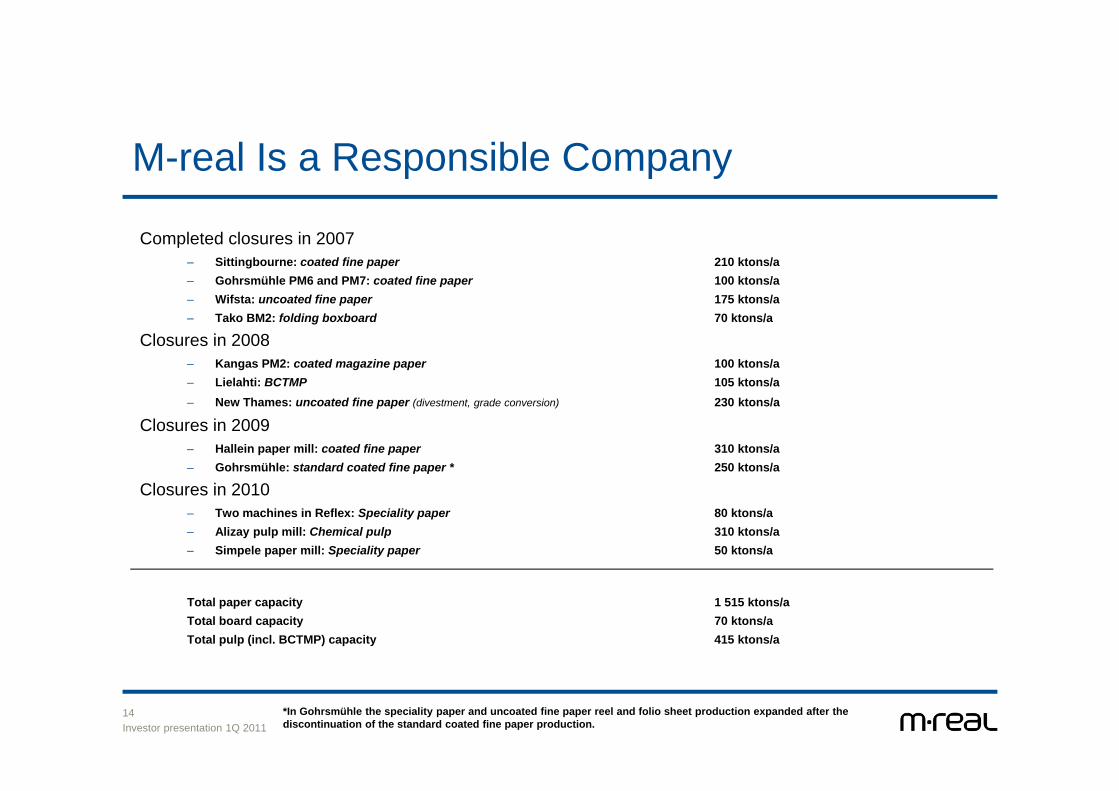
M-real Is a Responsible Company
Completed closures in 2007– Sittingbourne: coated fine paper 210 ktons/a– Gohrsmühle PM6 and PM7: coated fine paper 100 ktons/a– Wifsta: uncoated fine paper 175 ktons/a– Tako BM2: folding boxboard 70 ktons/a
Closures in 2008– Kangas PM2: coated magazine paper 100 ktons/a – Lielahti: BCTMP 105 ktons/a – New Thames: uncoated fine paper (divestment, grade conversion) 230 ktons/a
Closures in 2009– Hallein paper mill: coated fine paper 310 ktons/a – Gohrsmühle: standard coated fine paper * 250 ktons/a
Closures in 2010– Two machines in Reflex: Speciality paper 80 ktons/a– Alizay pulp mill: Chemical pulp 310 ktons/a– Simpele paper mill: Speciality paper 50 ktons/a
Total paper capacity 1 515 ktons/a Total board capacity 70 ktons/a Total pulp (incl. BCTMP) capacity 415 ktons/a
*In Gohrsmühle the speciality paper and uncoated fine paper reel and folio sheet production expanded after the discontinuation of the standard coated fine paper production.

Financial Targets

2.3.2011Investor presentation 1Q 201116
Financial Targets
• ROCE target set at a minimum of 10% on average over the business cycle• Net gearing not to exceed 100%
Minimum ROCE 10%* Maximum net gearing 100%
* Excluding non-recurring items
184%
119%137%
82%95%
126%99%90%84%83%78%83%
145%
99 00 01 02 03 04 05 06 07 08 09 10 1Q11
Maximum level of 100%
13,5%
6,2%
2,1%1,6%0,5%0,9%2,8%
-0,5%
-5,6%
7,6%7,8%10,2%
7,6%
99 00 01 02 03 04 05 06 07 08 09 10 1Q11
Minimum target of 10%

1Q 2011 results and Outlook

1818
Key Events in 1Q 2011
• Profitability improved from previous quarter
• Consumer Packaging ’s result improved to EBIT 17 % of sales
• Impact of accelerated cost inflation bigger than earlier expected in 1Q
• Decisions to increase Äänekoski and Kyröskoski folding boxboard capacity in total by 70 000 tonnes per annum
• New 70 m€ internal profit improvement programme was launched
• Price increases announced in linerboard, uncoated fine and speciality papers
• New plans to eliminate losses of paper business announced in May

19
623 585 618 606 602 676 685665662
250
500
750
1000
I II III IV I II III IV I
Sales Operating result excl. non-rec. itemsm€ m€
m€Result before taxes excl. non-rec. items
Key Figures – Quarterly
20102009
-65 -70
-227
39 54 37 4343
-75
-50
-25
0
25
50
75
I II III IV I II III IV I
-62
24 28
-83
-15
-70
15 2033
-100-75-50-25
02550
I II III IV I II III IV I
2011

2020
• Result improved vs. 4Q 2010 due to higher prices
• Increased energy costs had a negative result impact
• Demand seems to continue strong
• Liner price increase of about 6% implemented successfully
• New FBB price increase needed due to accelerated cost inflation
• Simpele investment shutdown and maintenance shutdowns at other mills impact negatively 2Q 2011 result
EBIT, excl non-recurring itemsm€
4Q 2010 1Q 2011
Salesm€
4Q 2010 1Q 2011
Consumer Packaging Result Improved

2121
• Result was weakened vs. 4Q 2010 by higher raw material and energy costs as well as unfavourable exchange rates
• Higher average prices improved results from 4Q 2010
• Demand expected to continue stable
• M-real has pushed for price increase but with very limited success
• New Husum turbine started in April
• Alizay mill is planned to be divested or, if divestment does not materialize, closed
Office Papers Result to Improve Clearly If Losses From Alizay Eliminated as Planned
EBIT, excl non-recurring itemsm€
181 184
0
50
100
150
200Salesm€
4Q 2010 1Q 2011
4Q 2010 1Q 2011
0

2222
Speciality Papers Operations Planned to Be Mostly Divested or Clearly Downsized
• Result was weakened vs. 4Q 2010 by higher raw material costs and lower average prices due to mix issues
• Result was improved by higher delivery volumes
• Demand expected to remain stable. No material near-term price changes in sight
• Planned divestment of Gohrsmühle mill or potential closure of WFU and unprofitable speciality paper production
• Planned closure of the remaining operations in Reflex
EBIT, excl non-recurring itemsm€
Salesm€
4Q 2010 1Q 2011
4Q 2010 1Q 2011
2323
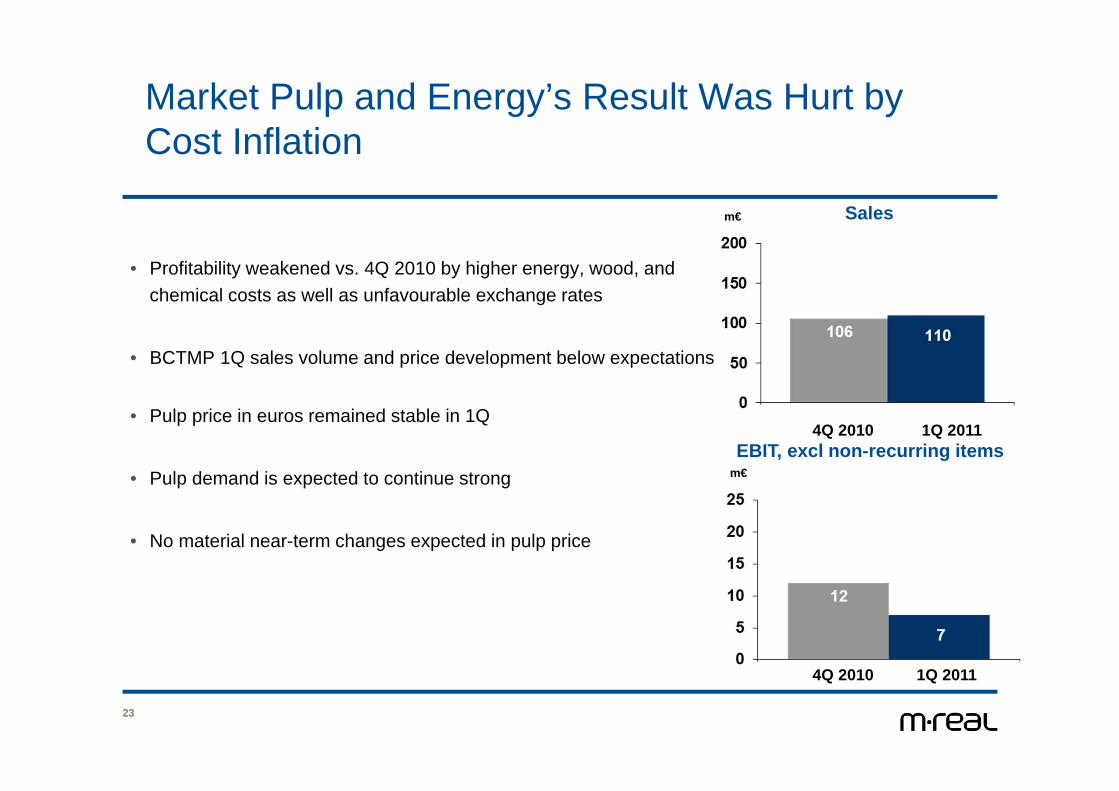
Market Pulp and Energy’s Result Was Hurt by Cost Inflation
• Profitability weakened vs. 4Q 2010 by higher energy, wood, and chemical costs as well as unfavourable exchange rates
• BCTMP 1Q sales volume and price development below expectations
• Pulp price in euros remained stable in 1Q
• Pulp demand is expected to continue strong
• No material near-term changes expected in pulp price
EBIT, excl non-recurring itemsm€
Salesm€
4Q 2010 1Q 2011
4Q 2010 1Q 2011

24
2011 Result Expected to Be Boosted by 90 m€ vs. 2010 Due to Internal Actions
Cumulative
Profit impact vs. 2010, m€total
target 2011 20121 Profit improvement programme 2011 70 30 70
2 Rollover impact of 2010 profit improvement programme 40 40 40
3 Rollover impact of older programmes 20 20 20
Total 130 90 130
M-real expects to mostly cover the accelerated cost inflation in 2011 by the profit impact of own actions
Cost inflation expected to be 4-5 % in 2011

25
Folding Boxbord Capacity Increase Investments to the Implementation Phase
• Demand growth for M-real’s ecological and safe virgin fibre board in food packaging faster than expected
• Simpele 80 000 t/a capacity increase investment to be finalized in early June 2011
• Kyröskoski 40 000t/a investment is scheduled for November 2011 and Äänekoski 30 000 t/a investment for April 2012
• M-real has still potential to further increase the cartonboard capacity at the existing mills
M-real Plans to Eliminate the Losses Generated by Its Paper Business
26
• M-real plans to divest the entire Gohrsmühle mill or alternatively parts of the mill separately based on a Paper Park concept
• If the divestment does not materialize M-real plans to close the unprofitable uncoated fine and speciality paper production at Gohrsmühle
- M-real plans to continue the production of Chromolux- label and packaging products (~50 000 t/a)
• M-real commences a public process to divest Alizay paper mill - If the divestment does not materialize by end September 2011, M-real considers closing the mill
• Reflex Premium Papers business planned to be sold and the remaining operation, carbonless paper converting, is planned to be closed
• Implementations of possible closures are subject to finalization of the consultation processes based on the local legislations

Financial Impact of the Planned Measures
27
• M-real’s annual sales would reduce by about 390 m€ and the operating result increase by about 60 m€ based on 2010 actual performances
- Most of the impact seen in 2012, full annual financial impact from 2013
• M-real’s annual paper production capacity would reduce by about 500 000 t/a
- WFU 430 000 t/a, specialities 70 000 t/a
- Amount of personnel would decrease by about 800
• Preliminarily expected negative non-recurring financial impacts about 170 m€
- Negative net cash impact about 50 m€
- Numbers will be further determined when the final decisions are taken
• Speciality Papers 2Q 2011 result to include about -20 m€ non-recurring items

28
Profitability Outlook
M-real’s 2Q 2011 operating result excluding non-recurring items is expected to
weaken slightly from 1Q 2011 due to the investment shutdown at
Simpele mill and the unfavorable exchange rate development

2.3.2011Investor presentation 1Q 201129
EUR / tn
Folding Boxboard Market Price in Europe2004 – 1Q 2011
800
900
1000
1100
2004 2005 2006 2007 2008 2009 2010 2011
Source: Pöyry Forest Industry Consulting
2.3.2011Investor presentation 1Q 201130
EUR / tn
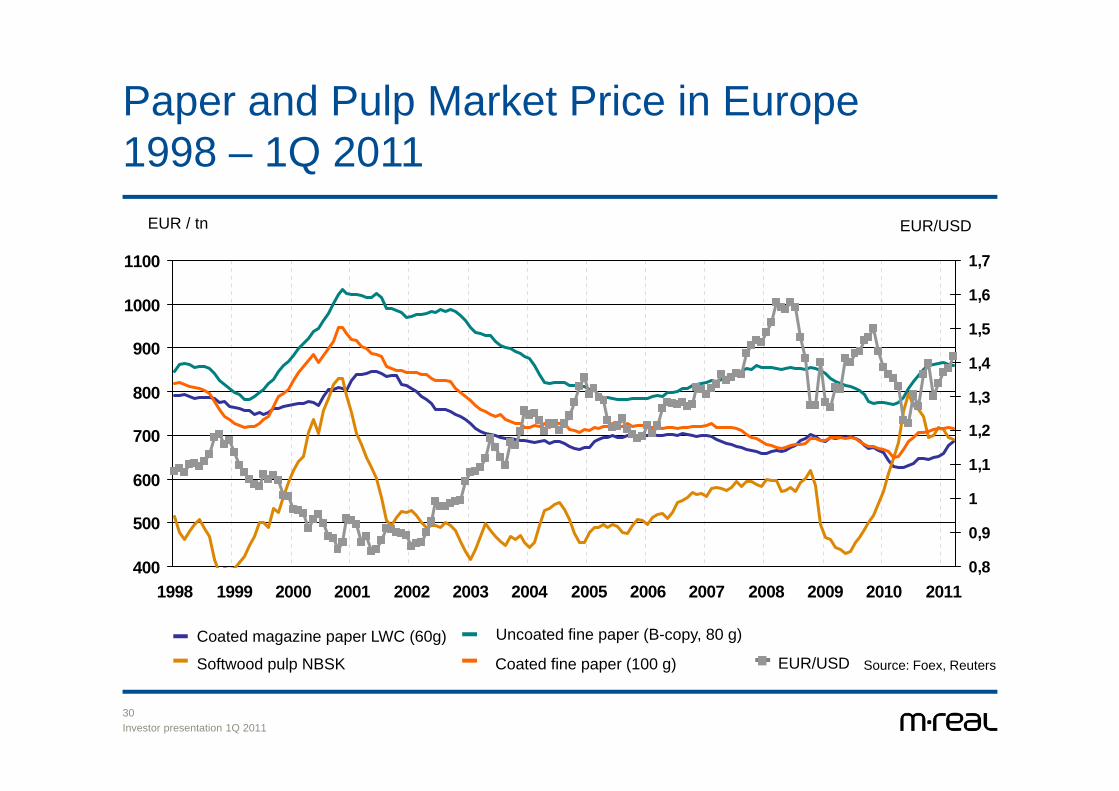
Paper and Pulp Market Price in Europe1998 – 1Q 2011
Coated fine paper (100 g)
Uncoated fine paper (B-copy, 80 g)
Softwood pulp NBSK
Coated magazine paper LWC (60g)
Source: Foex, ReutersEUR/USD
EUR/USD
400
500
600
700
800
900
1000
1100
1998 1999 2000 2001 2002 2003 2004 2005 2006 2007 2008 2009 2010 20110,8
0,9
1
1,1
1,2
1,3
1,4
1,5
1,6
1,7
Dividend

2.3.2011Investor presentation 1Q 201132
Dividend Policy
• Future dividends will take into account the need to achieve and maintain sufficient financial flexibility
• The Company remains committed to an attractive and competitive dividend
M-real's dividend policy is stable and rewarding to shareholders, and aims at paying a dividend of at least 1/3 of the Company's EPS on average over the business cycle, nonetheless taking into account the Company's gearing target

2.3.2011Investor presentation 1Q 201133
0,50
1,09 1,13
1,85
0,460,30
-0,79
-1,58
-1,09
0,26 0,37 0,380,51 0,51 0,51
0,25 0,00 0,00 0,000,09
-0,59
-1,21
-0,25-0,430,23 0,060,06
0,14 0,12 0,12
0,0%0,0%
4,3%
0,0%1,3%1,4%
2,1%2,8%3,3%
4,1%
5,6% 5,5%6,9%
8,6%
7,2%
-2
-1,5
-1
-0,5
0
0,5
1
1,5
2
2,5
3
1996 1997 1998 1999 2000 2001 2002 2003 2004 2005 2006 2007 2008 2009 2010
€ pe
r sha
re
-8 %
-6 %
-4 %
-2 %
0 %
2 %
4 %
6 %
8 %
10 %
12 %
Div
iden
d yi
eld,
%
Earnings per share Dividend per share Dividend yieldDividend yield calculated from annual average B-share volume weighted price
Dividend Yield

Investments

2.3.2011Investor presentation 1Q 201135
Capital Investments
-1 500
-1 000
-500
0
500
1 000
1 500
2 000
2 500
1996
1997
1998
1999
2000
2001
2002
2003
2004
2005
2006
2007
2008
2009
2010
2011
E
Mill
ion
€
Disposals
Acquisitions
Capitalexpenditure onfixed assets
Capital Investments about 100 m€ in 2011
*Indicative level for 2011
Funding and debt information

2.3.2011Investor presentation 1Q 201137
Significant Divestments- EUR 3.4 billion in assets divested since 2001
2004 Metsä Tissue 570
2002 Papierfabrik Albbruck 235
2001 MD Papier 300
2001 Noviant (19%) 41
3,387
Year Divestiture Enterprise Value
EUR millions
2005 Savon Sellu 20
2005 Forestia (95%) 163
2005 Botnia (8%) 164
2007 Botnia (9%) 2402007 Folding carton plants 602007 Map Merchant Group 3822008 New Thames mill 82**2008 100 000 B2 shares in PVO 802008 Graphic Papers 750
* Cash portion
**Incl. pension liabilities
2009 Metsä-Botnia’s Uruguayn operations 300*

38
Strong Financing Situation Continues
• Current net debt 799 m€ and net gearing 78 %
• Metsä-Botnia dividend to M-real 45 m€
• Early repayment of 49 m€ vendor note by Metsäliitto
• ONWC increased by about 40 m€ in 1Q due to higher volumes and average prices as well as preparations for Simpele shutdown
• Liquid funds 418 m€ at end 1Q 2011
• Average interest rate 5.1% at end 1Q
Net Debt, m€
799827
777
1254
2183
31093019
34823693
2205
2403
1867
0
500
1000
1500
2000
2500
3000
3500
4000
2000
2001
2002
2003
2004
2005
2006
2007
2008
2009
2010
1Q 11

2.3.2011Investor presentation 1Q 201139
Loans and Interest Rate
At the end of 1Q 2011• Average maturity of long term loans 2,4 years• Average interest rate of loans (including derivatives) 5,1 %• Interest rate maturity of loans (including derivatives) 7,7 months
• Of the loans about 83 per cent was subject to variable interest rates and 17 per cent to fixed interest rates

2.3.2011Investor presentation 1Q 201140
Total 1 120 m€ 31.3.2011
Long-term Interest Bearing Liabilities
5 %5 %3 %7 %
20 %
60 %
MTN ProgrammeBondsPension premium loansLoans from financial institutionsFinance leasesOther interest bearing liabilities

2.3.2011Investor presentation 1Q 201141
Short term interest bearing liabilities
Total 162 m€ 31.3.2011
Short-term Interest Bearing Liabilities4 %
96 %
Metsäliitto GroupShort-term bank loans and other

2.3.2011Investor presentation 1Q 201142
Interest bearing net liabilities 31.12.2003Interest Bearing Net Liabilities 31.3.2011 (m€)
• Long-term 1 120• Short-term 162Total interest bearing liabilities 1 282
• Liquidity and other interest bearing receivables 483
• Interest bearing net liabilities 799
2.3.2011Investor presentation 1Q 201143
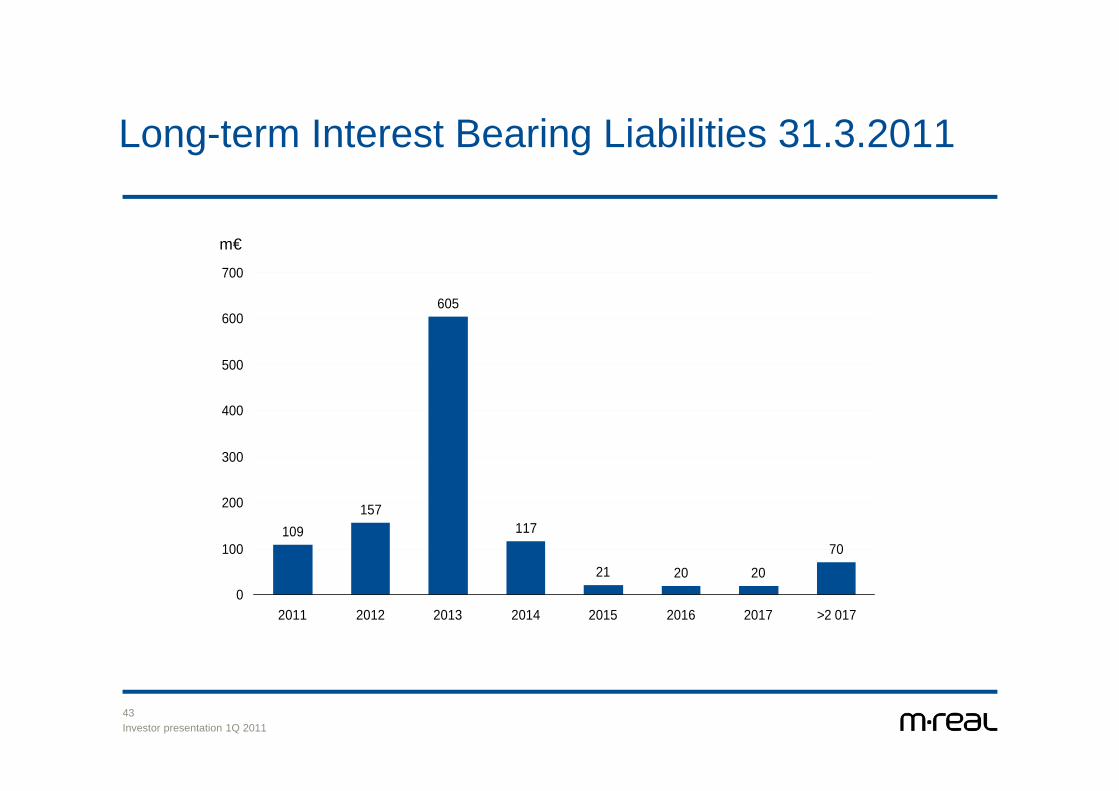
Long-term Interest Bearing Liabilities 31.3.2011
109157
605
117
21 20 20
70
0
100
200
300
400
500
600
700
2011 2012 2013 2014 2015 2016 2017 >2 017
m€
2.3.2011Investor presentation 1Q 201144
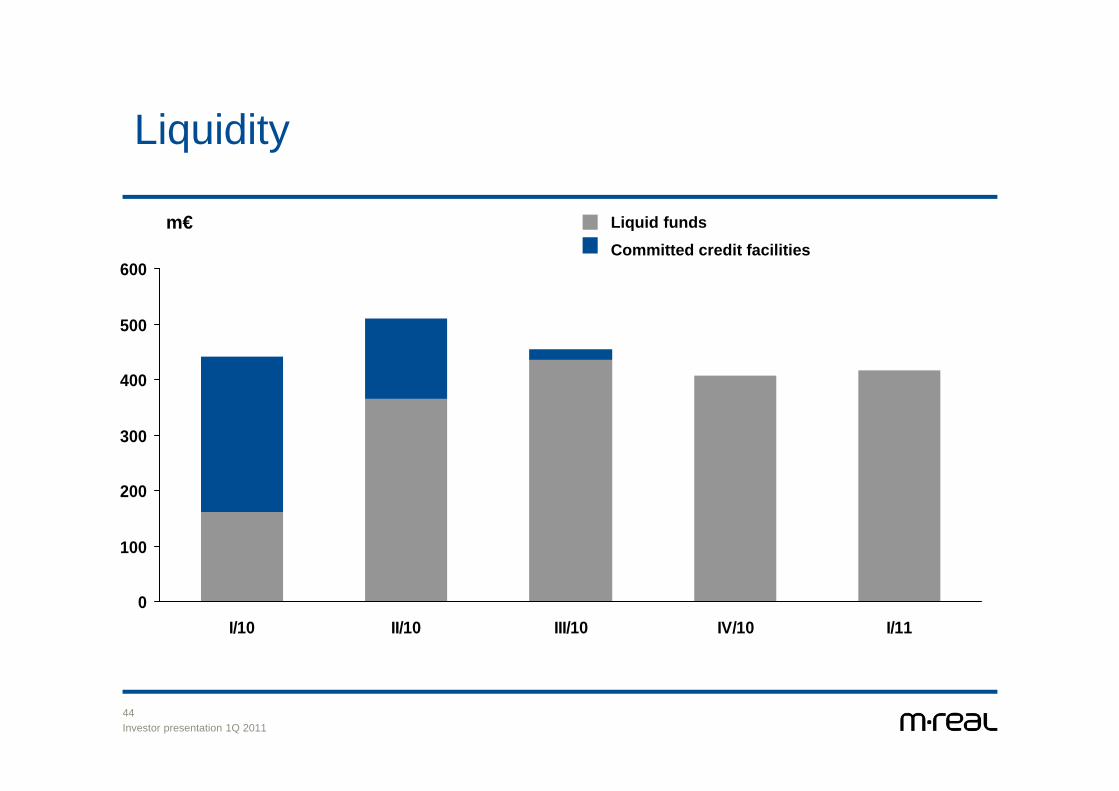
Liquidity
Committed credit facilitiesLiquid fundsm€
0
100
200
300
400
500
600
I/10 II/10 III/10 IV/10 I/11

2.3.2011Investor presentation 1Q 201145
Debt Programs
The following table sets forth the significant debt securities issued and outstanding of M-real as at March 31, 2011:
Average
Long-term borrowings Total amount Outstanding Interest Rate Maturity
USD 350 million Private Note Issue USD 350 USD 224 5.6% (1) 2012–2014EUR 500 million Bond Issue EUR 500 EUR 500 6.7% (1) 2013Global Medium-Term Note Program EUR 1 500 EUR 52 million private placements EUR 52 3,5 % 2011EUR 126 million bilateral loans EUR 126 EUR 126 1,7 % 2011–2013EUR 28 million finance leases EUR 28 EUR 28 2,2 % 2011–2017EUR 239 million pension loans EUR 239 EUR 232 5.4% (1) 2011–2020
Short-term funding programmes
EUR 350 million domestic CP-program EUR 350 EUR 0 – –EUR 150 milj. Belgian CP-program EUR 150 EUR 0 – –
Average interest rate of all M-real Group interest bearing liabilities including interest rate derivatives per 31.3.2011 is 5,1 %.
(currency in millions)

2.3.2011Investor presentation 1Q 201146
Ratings’ History2000
S&P: Short term ratings lowered to A3, Long term ratings placed to credit watch negativeMoody’s: Long and short term ratings outlook changed from stable to negative
2001S&P: Long term ratings lowered to BBB-,stable outlookMoody’s: Long and short term ratings lowered to Baa3/P3, negative outlook
2003S&P: Downgrade to BB+, stable outlookMoody’s: Downgrade to Ba1, negative outlook
2004S&P: Outlook changed from stable to negative, ratings affirmedMoody’s: Downgrade to Ba2, stable outlook
2005S&P: Downgrade to BB, stable outlookMoody’s: Outlook changed from stable to negative, ratings affirmed
2006S&P: Downgrade to BB-, negative outlookMoody’s: Downgrade to Ba3, negative outlookMoody’s: Downgrade to B2, negative outlookS&P: Downgrade to B+, negative outlook
2007Moody’s: Downgrade to B3, negative outlookS&P: Downgrade to B, negative outlookS&P: Downgrade to B-, stable outlook
2008S&P: Outlook to negative
2009S&P: Downgrade to CCC+, negative outlook Moody’s: Downgrade to Caa1, outlook negative
2010S&P: Outlook to stableMoody’s: Outlook to stableS&P: Upgrade to B-, stable outlookMoody’s: Upgrade to B3, outlook to positive
2011S&P: Outlook to positive

General presentation

2.3.2011Investor presentation 1Q 201148
M-real in Brief
• Annual sales about EUR 2.6 billion.• Approximately 4,500 employees.• Present in over 70 countries.• 13 production units in 5 European
countries.• Part of Metsäliitto Group and listed on
the NASDAQ OMX Helsinki Ltd.• Metsäliitto Group is one of the largest
forest industry groups in the world, owned by a cooperative of 130.000 private Finnish forest owners.
Consumer Packaging 45%Paper 38%Market pulp and energy 17%
Sales breakdown 2010
2.3.2011Investor presentation 1Q 201149
Offering for Consumer Packaging, Communications and Advertising
• Cartonboards and white-top kraftliners for packaging beautycare, healthcare, cigarettes, food, consumer durables etc.
• Graphic boards e.g. for book covers, postcards, greeting cards, CD or DVD covers
• Office papers from high-volume copying and printing to high-quality color presentations
• Speciality papers for advertising and corporate materials,flexible packaging, creative designs, labeling, self-adhesive laminates and for wallcovering industry
2.3.2011Investor presentation 1Q 201150
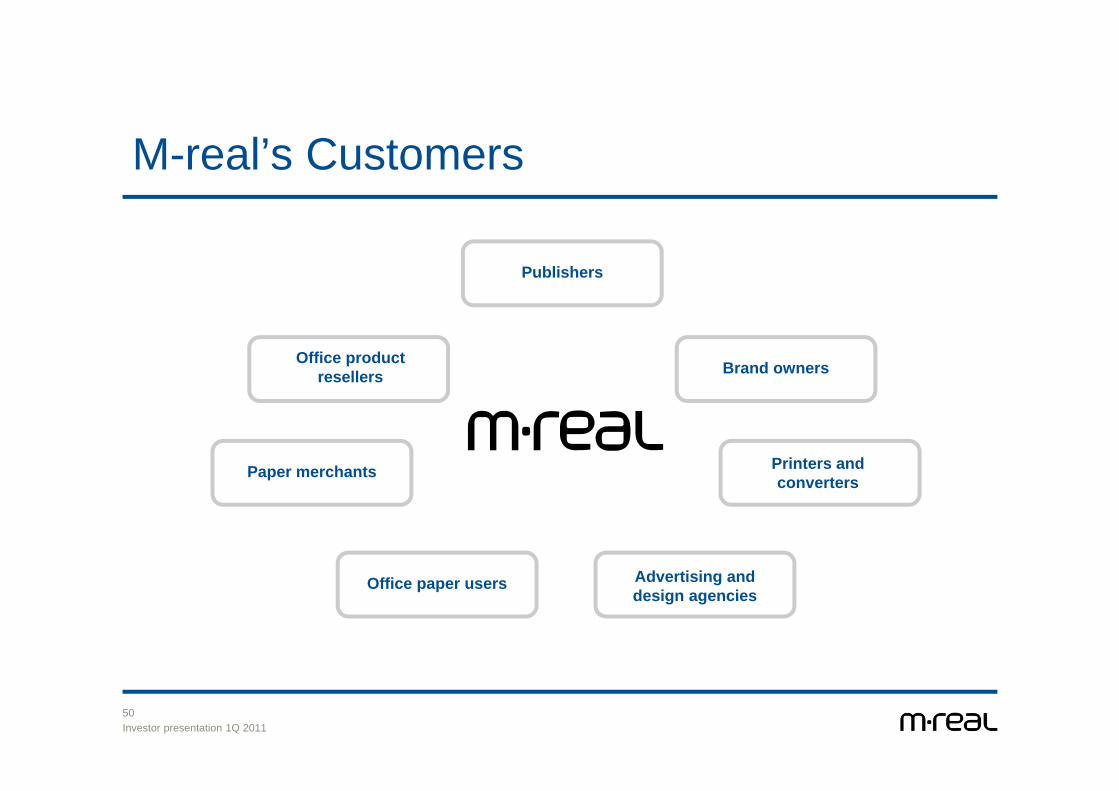
M-real’s Customers
Office product resellers
Publishers
Brand owners
Printers and converters
Advertising and design agencies
Office paper users
Paper merchants

2.3.2011Investor presentation 1Q 201151
17 %
32 %
12 %
9 %
12 %
6 %
9 %3 %
Paper PulpPaperboard PackagingTissue Mechanical Forest ProductsMerchanting Chemicals
45 %38 %
17 %
Focus on Core Businesses1995 Sales€2.3 billion
2010 Sales€2.6 billion
8 Businesses 3 Businesses

2.3.2011Investor presentation 1Q 201152
1997 20001998 1999
Acquisitions
Divestments
Biberist Paper Mill
Simpele Mill UK Paper
Modo Paper
Zanders
ChemicalsBusiness
Botnia Wood
CorrugatedPackaging
MD Papier Metsä Tissue
2001 2002
Albbruck
2003 2004
M-real Restructuring Story
2005
SavonSellu
Forestia
Kemiart Liners (53 %)
8% in Botnia
2006
PSM
2007
9% in Botnia
Cartonplants
Map
100 000 B2 shares
in PVO
20092008
New Thames
MB Uruguay
Graphic Papers
2010 2011
Part of Reflex mill

2.3.2011Investor presentation 1Q 201153
Annual Sales Development
26052432
3236
4440
56245241
54606044
65646923
5898
33193014
2313
4044
0
1000
2000
3000
4000
5000
6000
7000
8000
1996 1997 1998 1999 2000 2001 2002 2003 2004 2005 2006 2007 2008 2009 2010
EUR, million

Business Portfolio
2.3.2011Investor presentation 1Q 201155
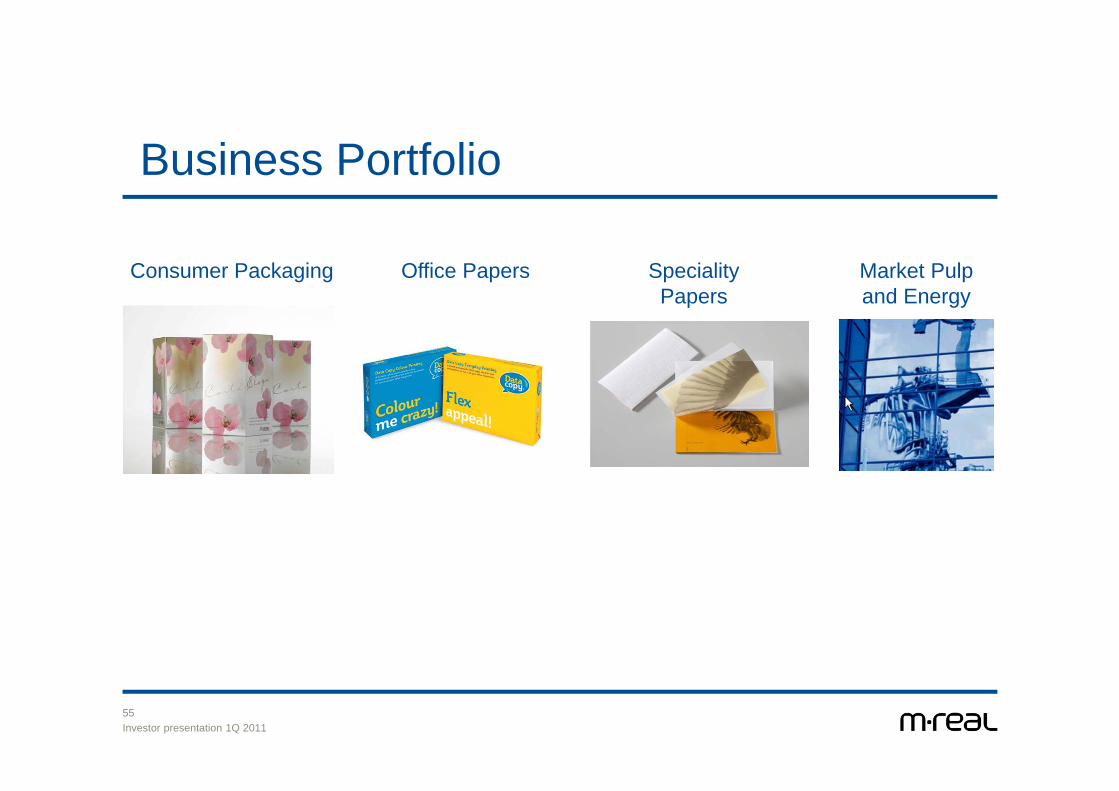
Business Portfolio
Consumer Packaging Speciality Papers
Office Papers Market Pulp and Energy

2.3.2011Investor presentation 1Q 201156
Consumer PackagingMainly Folding Boxboard and Linerboard
• Fibre-based high value-added packaging solutions for global brand owners in beautycare, healthcare, cigarette, food and consumer electronics industries as well as for graphical end-uses
• Relatively high earnings stability• High segment consolidation• Competitive folding boxboard mills with end use specified production
Capacity Share (%)
8 %
9 %
10 %
25 %
32 %
0 % 5 % 10 % 15 % 20 % 25 % 30 % 35 %
IP
Careo
Mayr-Melnhoff
Stora Enso
M-real
No. 1 Folding Boxboard Producer in Europe
Source: Pöyry Management Consulting Oy

2.3.2011Investor presentation 1Q 201157
Office PapersMainly Uncoated Fine Paper
Capacity Share (%)
9 %
10 %
11 %
14 %
14 %
0 % 5 % 10 % 15 %
M-real
UPM-Kymmene
Mondi
Stora Enso
Portucel
No. 5 Uncoated Fine Paper Producer in Europe
• High quality uncoated fine papers for printing and photocopying as well as for forms, envelopes, manuals and communication purposes
• Diversified customer base, e.g. merchants, retail chains, office equipment manufacturers and corporations
• Leading European office paper brands like DataCopy and Evolve as well as revolutionary lightweight SAVE!
Source: Pöyry Management Consulting Oy

2.3.2011Investor presentation 1Q 201158
Speciality Papers
• Leading European speciality paper producer with strong focus on packaging applications
• Packaging specialities• Flexible packaging• Luxury packaging• Labels
• Graphical specialities• Premium fine papers • Carbonless papers• Digital imaging papers
• Uncoated fine papers Packaging specialities 50%Graphical specialities 30%WFU 20%
Speciality paper sales
59
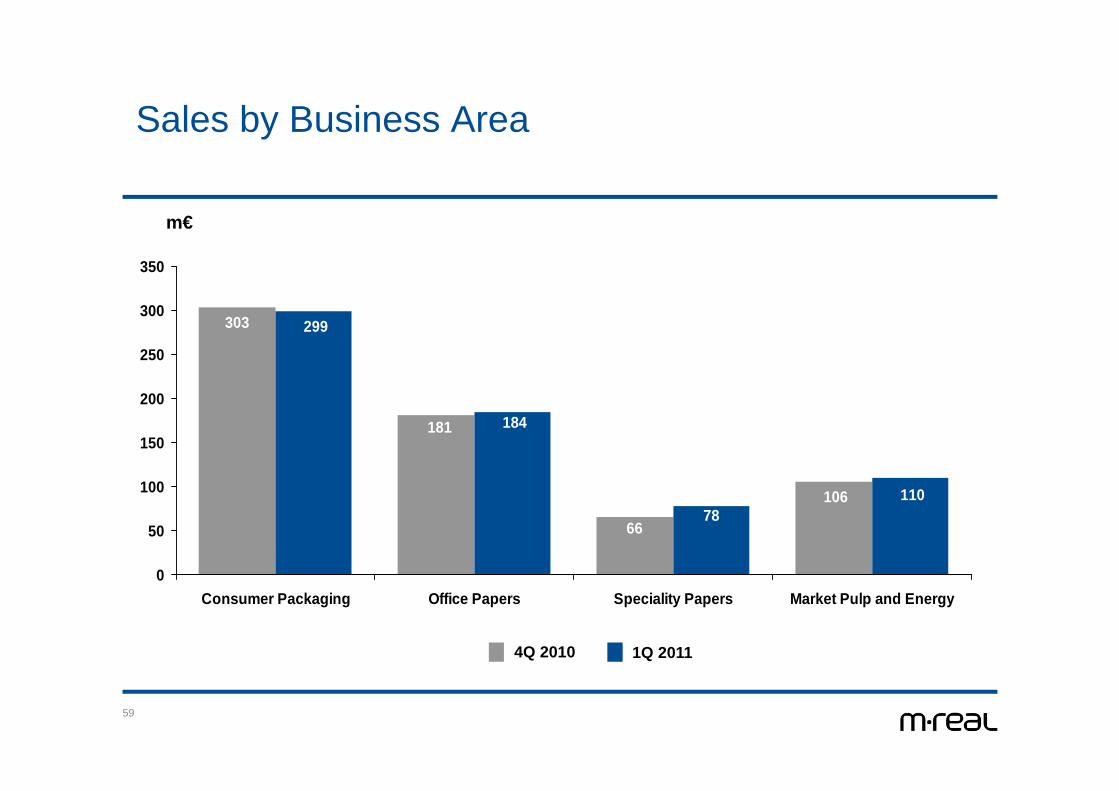
Sales by Business Area
m€
66
181
106
303
11078
184
299
0
50
100
150
200
250
300
350
Consumer Packaging Office Papers Speciality Papers Market Pulp and Energy
1Q 20114Q 2010
60
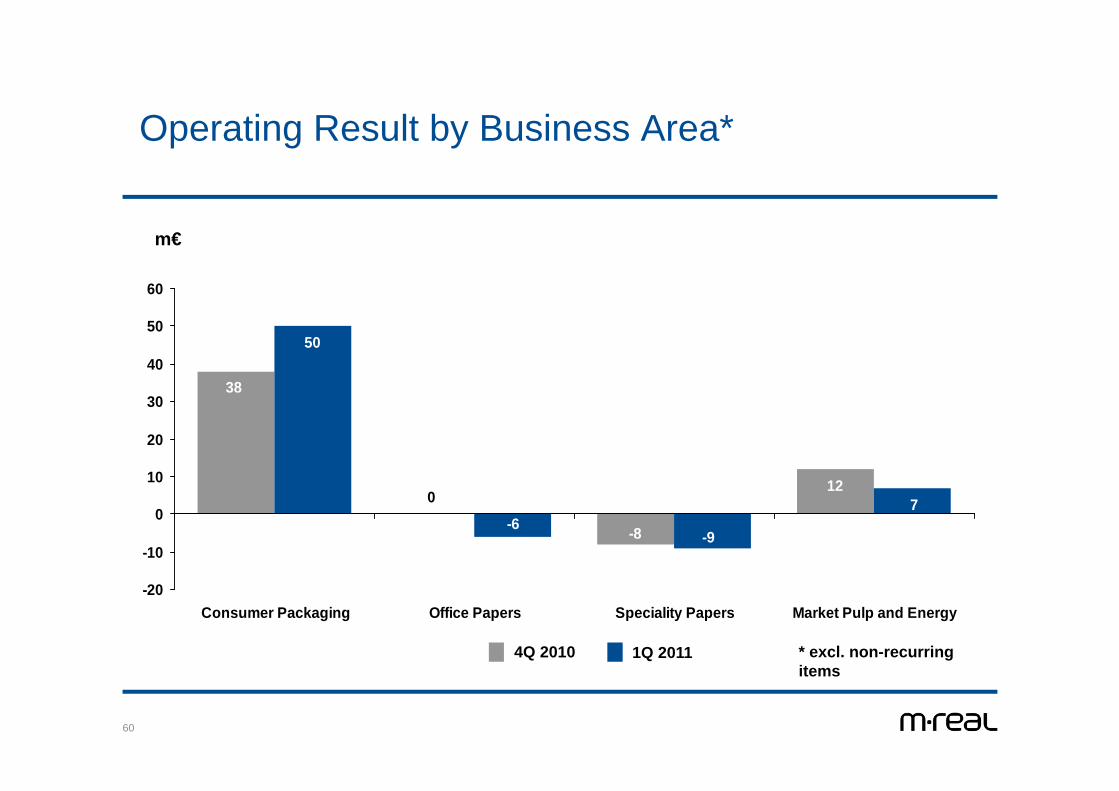
Operating Result by Business Area*
* excl. non-recurring items
-8
012
38
7
-9-6
50
-20
-10
0
10
20
30
40
50
60
Consumer Packaging Office Papers Speciality Papers Market Pulp and Energy
m€
1Q 20114Q 2010

61
Sales by Business Area
m€
82
160
95
257
110
78
184
299
0
50
100
150
200
250
300
350
Consumer Packaging Office Papers Speciality Papers Market Pulp and Energy
1Q 20111Q 2010
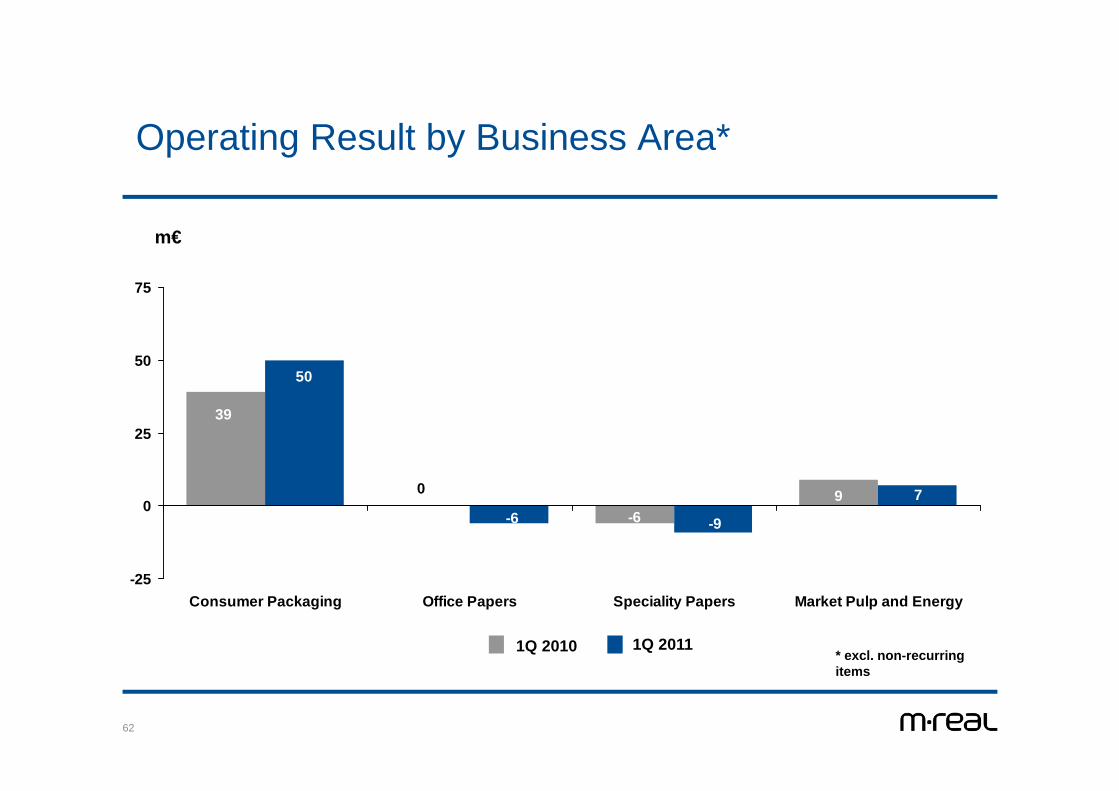
62
Operating Result by Business Area*
* excl. non-recurring items
m€
-6
0 9
39
7
-9-6
50
-25
0
25
50
75
Consumer Packaging Office Papers Speciality Papers Market Pulp and Energy
1Q 20111Q 2010

Operations
2.3.2011Investor presentation 1Q 201164
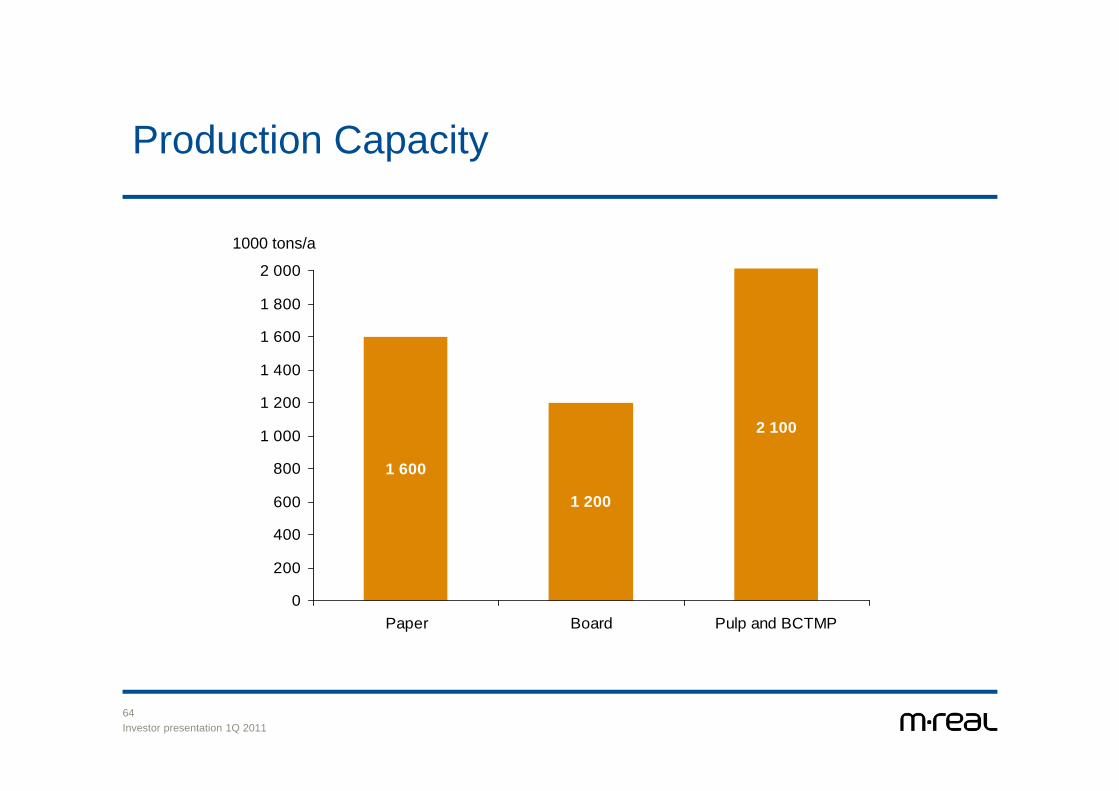
1 600
1 200
2 100
0
200
400
600
800
1 000
1 200
1 400
1 600
1 800
2 000
Paper Board Pulp and BCTMP
1000 tons/a
Production Capacity
2.3.2011Investor presentation 1Q 201165
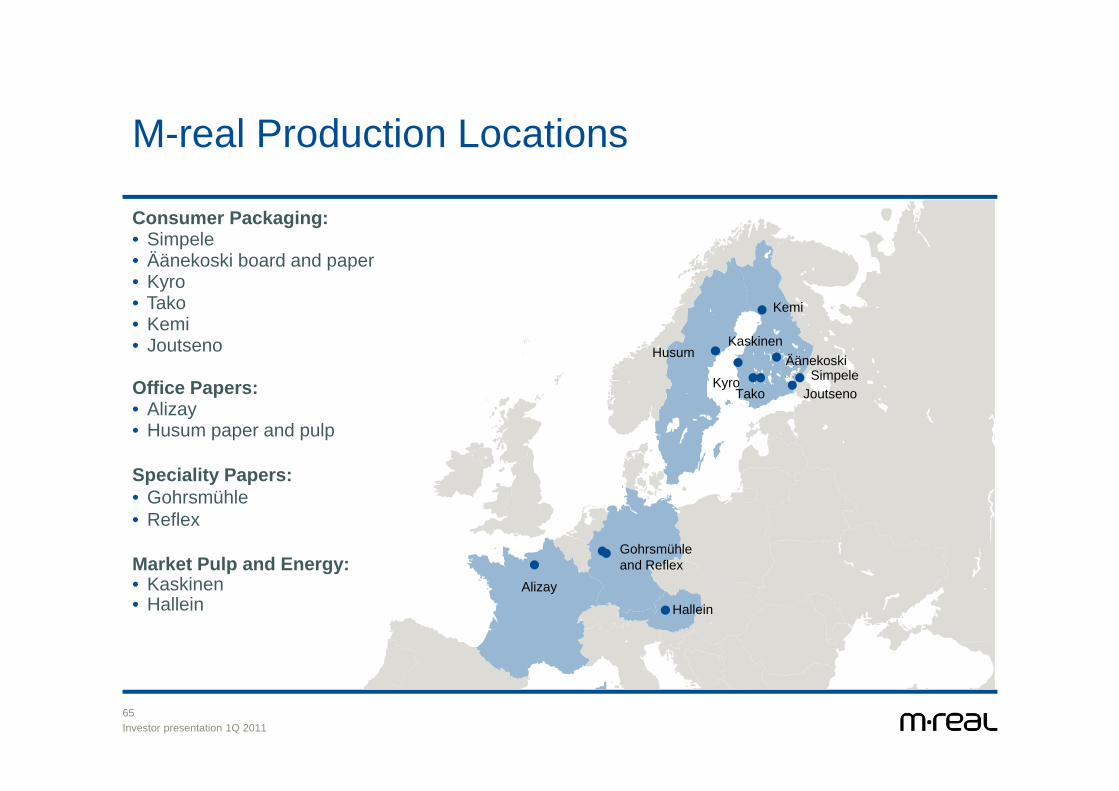
M-real Production Locations
Consumer Packaging:• Simpele• Äänekoski board and paper• Kyro• Tako • Kemi• Joutseno
Office Papers: • Alizay• Husum paper and pulp
Speciality Papers: • Gohrsmühle• Reflex
Market Pulp and Energy:• Kaskinen• Hallein
Alizay
Hallein
Husum
Gohrsmühle and Reflex
ÄänekoskiSimpele
Joutseno
Kemi
TakoKyro
Kaskinen
2.3.2011Investor presentation 1Q 201166
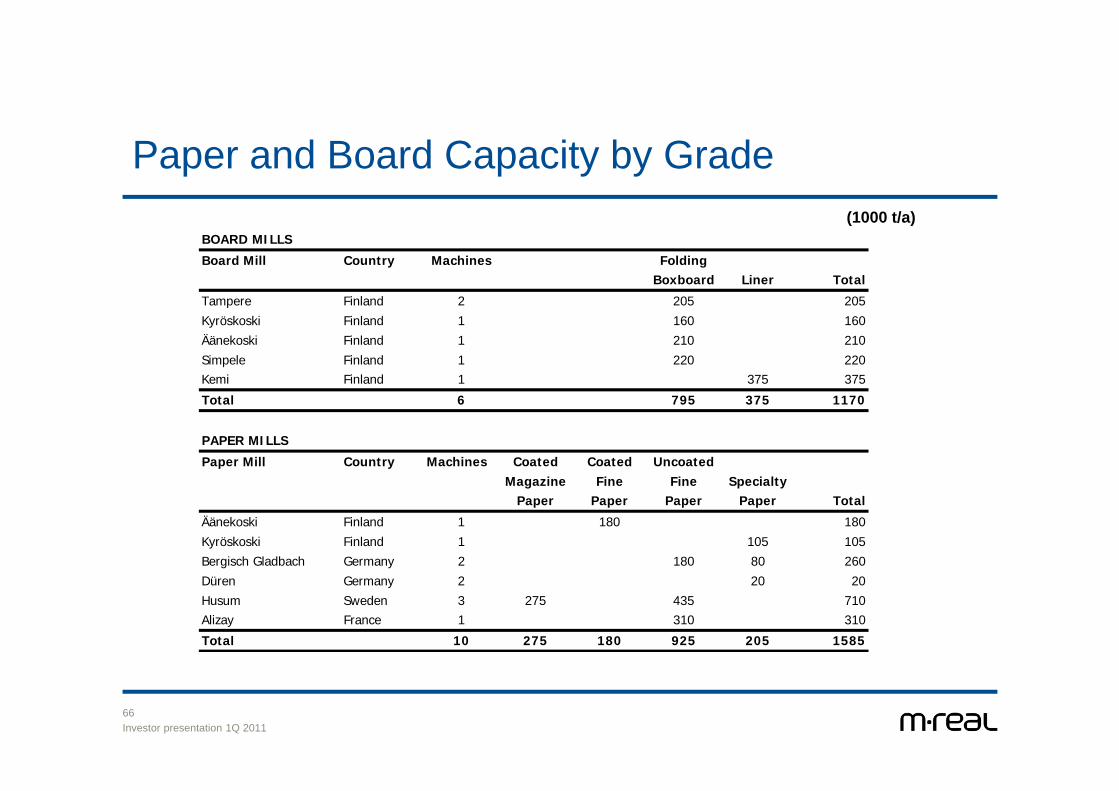
Paper and Board Capacity by Grade(1000 t/a)
BOARD MILLS
Board Mill Country Machines FoldingBoxboard Liner Total
Tampere Finland 2 205 205Kyröskoski Finland 1 160 160Äänekoski Finland 1 210 210Simpele Finland 1 220 220Kemi Finland 1 375 375
Total 6 795 375 1170
PAPER MILLS
Paper Mill Country Machines Coated Coated UncoatedMagazine Fine Fine Specialty
Paper Paper Paper Paper Total
Äänekoski Finland 1 180 180Kyröskoski Finland 1 105 105Bergisch Gladbach Germany 2 180 80 260Düren Germany 2 20 20Husum Sweden 3 275 435 710Alizay France 1 310 310
Total 10 275 180 925 205 1585

2.3.2011Investor presentation 1Q 201167
Pulp Capacity(1000 t/a)
PULP MILLS
Pulp Mill Country ChemicalPulp BCTMP Total
Husum Sweden 690 690Hallein Austria 160 160Joutseno Finland 280 280Kaskinen Finland 300 300
Total 850 580 1430
BOTNIA *
Mill Country ChemicalPulp Total
Äänekoski Finland 500 500Kemi Finland 590 590Rauma Finland 630 630Joutseno Finland 650 650
Total 2370 2370
* M-real share is 30% of the capacity

2.3.2011Investor presentation 1Q 201168
Personnel Development
4515453849036546
9508
1412515154
16490
203722107022237
17351
1388512637
11463
15572
0
5000
10000
15000
20000
25000
1996 1997 1998 1999 2000 2001 2002 2003 2004 2005 2006 2007 2008 2009 2010 1Q2011
Deliveries

2.3.2011Investor presentation 1Q 201170
Uncoated fine paperCartonboard
Annual Deliveries*
32 %
6 %
18 %
44 %
Western- Europe Eastern- Europe Americas Asia & Pacific
8 %
86 %
5 %1 %
* Indicative numbers

Sourcing
2.3.2011Investor presentation 1Q 201172
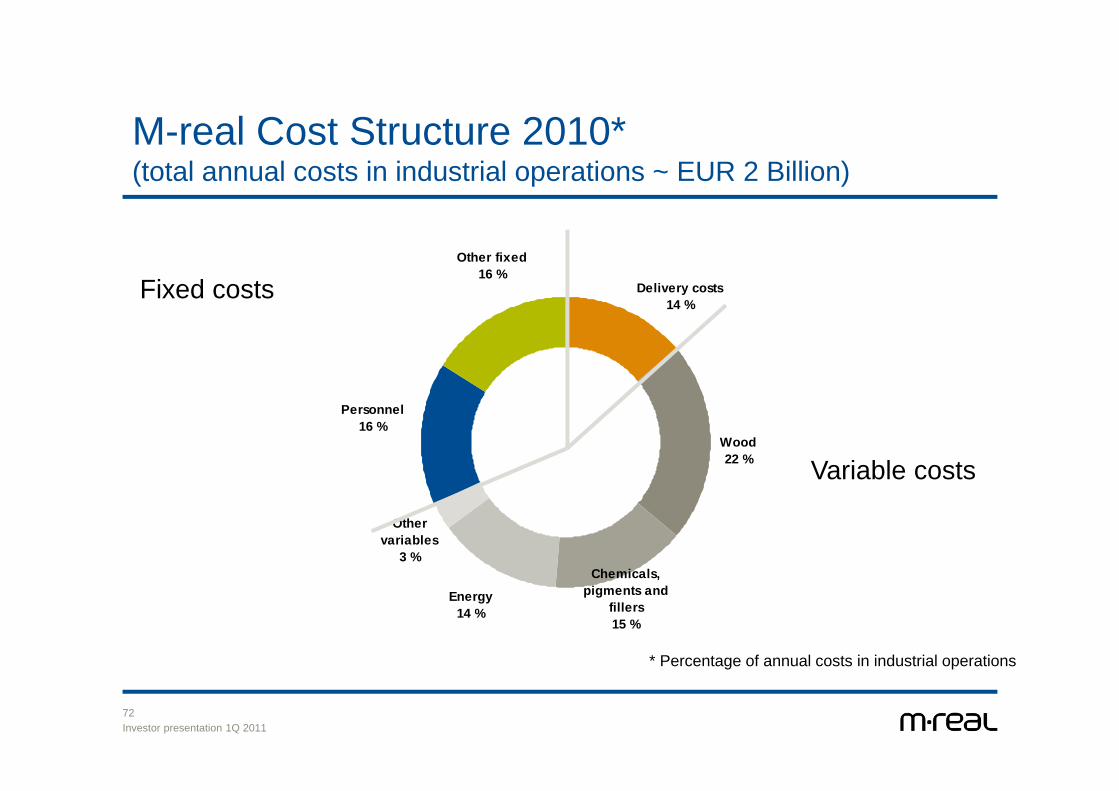
Personnel 16 %
Other fixed16 %
Delivery costs14 %
Wood22 %
Chemicals, pigments and
fillers15 %
Other variables
3 %
Energy14 %
M-real Cost Structure 2010* (total annual costs in industrial operations ~ EUR 2 Billion)
Fixed costs
Variable costs
* Percentage of annual costs in industrial operations

2.3.2011Investor presentation 1Q 201173
Electricity Sourcing 2010 (total 3 500 GWh)
Associated company
(PVO)29 %
Outsourced generation
2 %
Own generation
32 %Purchased energy37 %
2.3.2011Investor presentation 1Q 201174
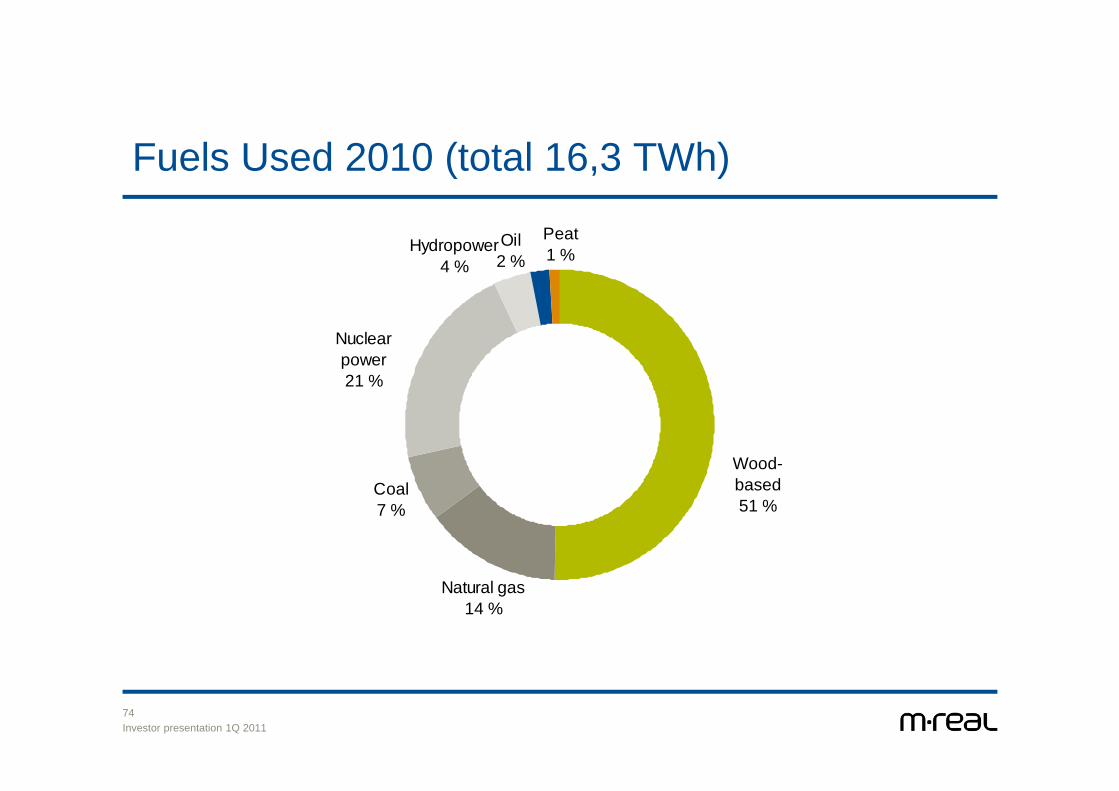
Fuels Used 2010 (total 16,3 TWh)
Wood-based51 %
Natural gas14 %
Coal7 %
Oil2 %
Peat1 %Hydropower
4 %
Nuclear power21 %

2.3.2011Investor presentation 1Q 201175
Wood Sourcing by Country
1 000 m3 2010Sweden 2210Finland 1243Austria 792Russia 573Latvia 443Estonia 236Lithuania 109Others 113Total 5719

2.3.2011Investor presentation 1Q 201176
Development of Softwood PulpwoodCost at Mill, Wood for Chemical Pulping
1980 – 2Q 2010
Source: Pöyry Management Consulting Oy
0
10
20
30
40
50
60EUR/m3sob, nominal
Finland, south, pineSweden, south, pineGermany, south, pineChile, radiata pineUSA South, SYPCanada East, SPF
2.3.2011Investor presentation 1Q 201177
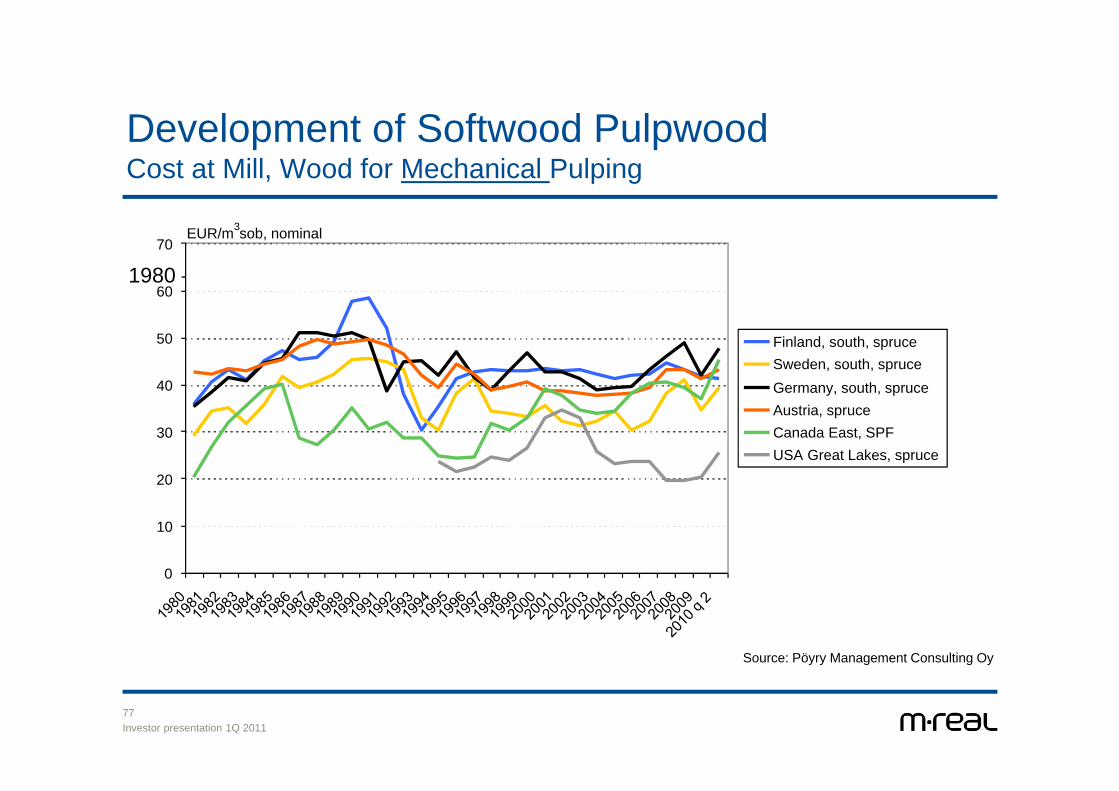
Development of Softwood PulpwoodCost at Mill, Wood for Mechanical Pulping
1980 – 2Q 2010
Source: Pöyry Management Consulting Oy
0
10
20
30
40
50
60
70EUR/m3sob, nominal
Finland, south, spruceSweden, south, spruceGermany, south, spruceAustria, spruceCanada East, SPFUSA Great Lakes, spruce
2.3.2011Investor presentation 1Q 201178
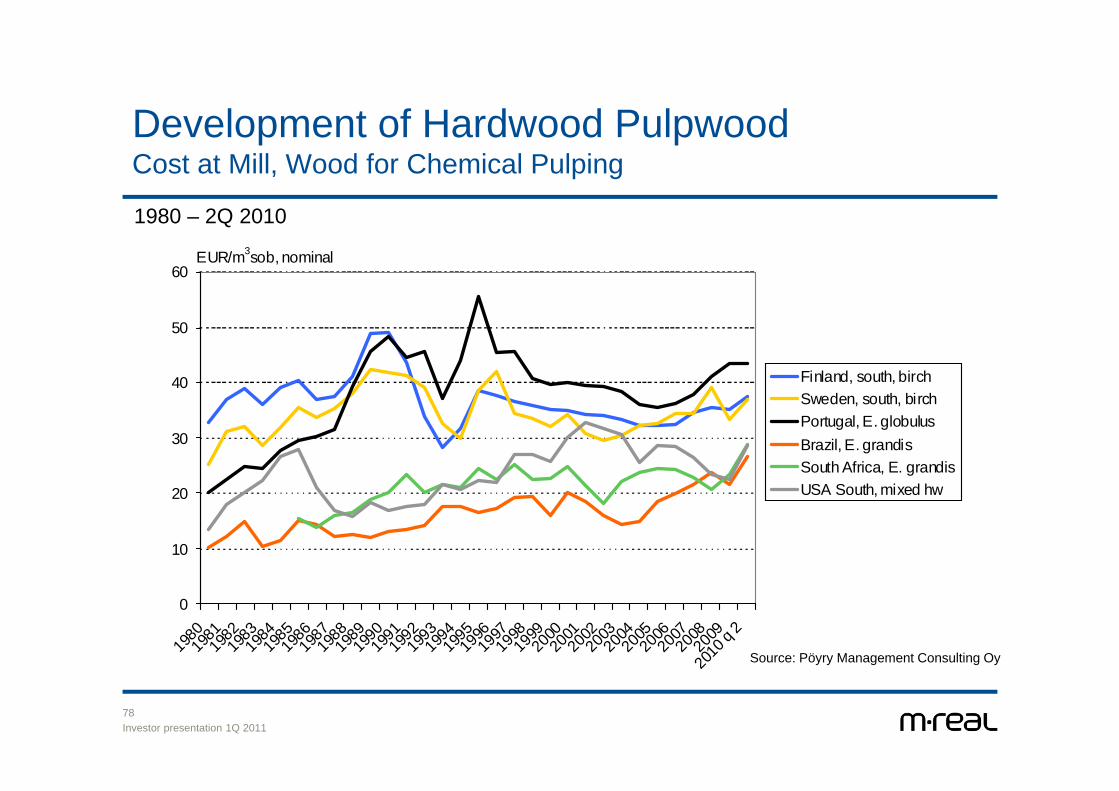
Development of Hardwood PulpwoodCost at Mill, Wood for Chemical Pulping
1980 – 2Q 2010
Source: Pöyry
0
10
20
30
40
50
60
1980
1981
1982
1983
1984
1985
1986
1987
1988
1989
1990
1991
1992
1993
1994
1995
1996
1997
1998
1999
2000
2001
2002
2003
2004
2005
2006
2007
2008
2009
2010
q 2
EUR/m3sob, nominal
Finland, south, birchSweden, south, birchPortugal, E. globulusBrazil, E. grandisSouth Africa, E. grandisUSA South, mixed hw
Source: Pöyry Management Consulting Oy

Owners

2.3.2011Investor presentation 1Q 201180
Ownership Structure 31.3.2011
Shares Votes
Source: Euroland

Market Position
2.3.2011Investor presentation 1Q 201182
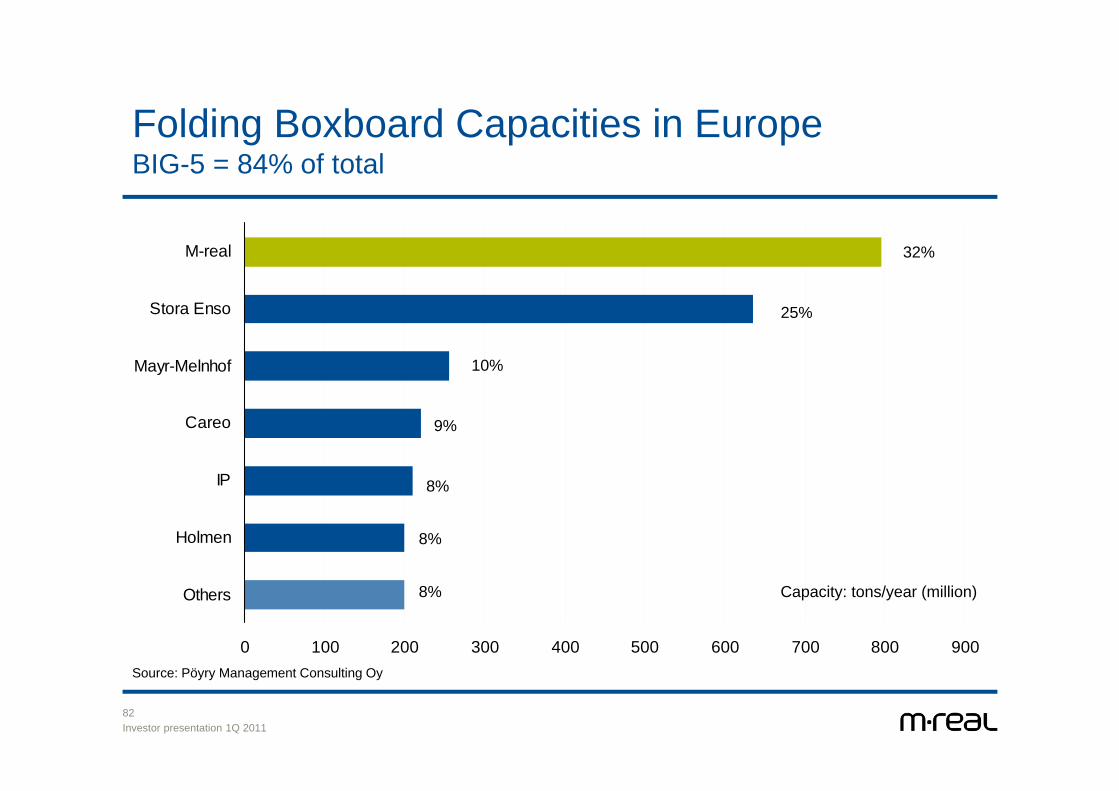
0 100 200 300 400 500 600 700 800 900
Others
Holmen
IP
Careo
Mayr-Melnhof
Stora Enso
M-real
Folding Boxboard Capacities in Europe BIG-5 = 84% of total
Source: Pöyry Forest Industry Consulting
Capacity: tons/year (million)
32%
25%
10%
9%
8%
8%
8%
Source: Pöyry Management Consulting Oy

2.3.2011Investor presentation 1Q 201183
0 500 1000 1500 2000 2500 3000 3500
Others
Sappi
Arctic Paper
International Paper
M-real
UPM
Mondi
Stora Enso
Portucel
Uncoated Fine Paper Capacities in EuropeBIG-5 = 57% of total
14%
14%
11%
10%
8%
8%
3%
3%
28%
Source: Pöyry Forest Industry Consulting, M-real
Capacity: tons/year (million)
Source: Pöyry Management Consulting Oy

Thank youwww.m-real.com