investor information 2016 - · pdf filethe ˜nancial ˜gures used in this report are...
TRANSCRIPT

INVESTORINFORMATION2016
Connecting to the futureTokyo Broadcast ing System Holdings, Inc.

Net Sales(Millions of Yen)
Operating Income(Millions of Yen)
Ordinary Income(Millions of Yen)
Pro�t Attributable to Owners of Parent(Millions of Yen)
Total Assets(Millions of Yen)
Contents
234569
Financial FiguresThe �nancial �gures used in this report are those used in the Japanese ”Tanshin,” which has been created in accordance with the provisions set forth in the Japanese Financial Instruments and Exchange Act. Thus, all �gures have been rounded down to the nearest million yen.
Forward-Looking Statements
To Our StakeholdersAt a GlanceOrganizationCorporate DataBusiness ReportConsolidated Financial Statements
1315172022
Major IndicesSegment InformationTBS TelevisionFinancial Data of Major Group Companies TBS Networks
Total Net Assets(Millions of Yen)
347,817354,338352,351346,538
18,91518,09617,671
14,313
653,732579,039559,626555,159
15/314/313/312/3 15/314/313/312/3
348,539
16/3
15,72815,69616,188
12,162
15/314/313/312/3
17,179
16/3
15/314/313/312/3 15/314/313/312/3
12,811
9,6449,173
11,671
16/3
14,497
15/314/313/312/3
649,970
16/3
456,118
385,971344,473322,597
15/314/313/312/3
458,208
16/3
22,678
16/3
This report contains forward-looking statements based on management’s assumptions and beliefs in light of the information currently available. These statements are subject to risks and uncertainties that could cause actual results to differ materially from those discussed in this report. Such risks include, but are not limited to, market trends, economic conditions and changes in industry regulations.
INVESTOR INFORMATION 2016Tokyo Broadcasting System Holdings, Inc.
1
Consolidated Financial Highlights

INVESTOR INFORMATION 2016Tokyo Broadcasting System Holdings, Inc.
2
To Our Stakeholders
At Tokyo Broadcasting System Television Inc. (TBS TV),
the average audience ratings for the fiscal year under
review exceeded the previous fiscal year’s performance in
both golden time and prime time. In our Nichiyo Gekijyo
(“Sunday Theater”) slot, which airs from 9:00 on Sunday
evenings, serialized dramas such as THE EMPEROR’S COOK
and Downtown Rocket have been big hits, firmly implanting
the image of TBS as the prime channel for TV drama.
Our subsidiary BS-TBS, INC., whose declared ideal is to
create programs to “really sit back and enjoy,” has also
established a number of its productions as firm favorites.
TBS Radio Inc., meanwhile, continues to attract stable
audiences.
In our Multi-Visual Ventures and Cultural Events Business,
preparations are now complete for the introduction to Japan of
a theater system with spectator seats that can revolve 360
degrees. The 360-degree theater, which will be the second of
its kind in the world and the first in Asia, is due to open in
spring 2017 at Toyosu in Tokyo under the name IHI STAGE
AROUND TOKYO.
Meanwhile, the multipurpose entertainment venue Akasaka
Sacas, offering a wide range of events that change with the
season, has developed into an event space that attracts family
visitors from all over Japan.
With the increasingly diverse range of media devices in use
nowadays, video-streaming services are growing in popularity.
This has brought major changes, notably an increase in
“time-shifted viewing,” in which the user downloads a
broadcast onto a storage device to watch later.
To adapt to these changes, Tokyo’s five commercial TV
broadcasting companies launched the free-of-charge
sponsored Internet broadcasting service “TVer.” This underlines
our awareness of the need to maintain a consistent User First
approach.
Guided by the commitment “From TBS,” our Group will
remain the forward-looking broadcaster it has always been.
June 2016
Shinji TakedaPresident & Representative Director
Tokyo Broadcasting System Holdings, Inc.
Tokyo Broadcasting System Television, Inc.
The following is a brief summary of business operations during the fiscal year ended March 31, 2016.

Our Business
Business Activities (Year ended March 31, 2016)
Broadcasting Business¥213.8 billion
Multi-Visual Ventures and Cultural Events Business¥119.1 billion
Real Estate Business¥15.4 billion
Terrestrial TVbroadcasting
Terrestrial radiobroadcasting
Satellitebroadcasting
Manufacture &sale of cosmetics
Real estateleasing
Miscellaneousretailing
Net & mobilecontents
Planning &production of audio & visual
contents
The Group covers a wide range of businesses essentially including broadcasting. We aim to become the best media group that provides the
most powerful contents and software in the areas of information, entertainment, lifestyle and culture.
61.4%34.2%
4.4%
INVESTOR INFORMATION 2016Tokyo Broadcasting System Holdings, Inc.
3
At a Glance

Tokyo Broadcasting System Holdings, Inc.
Broadcasting Business Multi-Visual Venturesand Cultural Events Business
Equity-method af�liate
NICHION, Inc.
TBS Ser vice, Inc.
OXYBOT, Inc.
TC Enter tainment Incorporated
Grand Marche, Inc.
TBS TriMedia, Inc.
StylingLife Holdings Inc. (with two other group companies)
C-TBS, Incorporated
WOWOW INC.
Totsu Inc.
TLC Co., Ltd.
Tokyo Broadcasting System Television, Inc.
TBS Radio Inc.
TBS Vision, Inc.
FF TOHO, INC.
TBS-TEX, Inc.
DREAMAX TELEVISION, INC.
AKASAKA GRAPHICS ART, INC.
Ar t Communication System, Inc.
TBS ProNex Inc.
Japan Ar tvideo Ser vice Collaborative, Inc.
TBS MEDIA RESEARCH INSTITUTE INCORPORATED
TBS International, Inc.
BS-TBS, INC.
Real Estate Business
Midoriyama Studio City, Inc.
TBS Kikaku Co., Ltd.
Akasaka Heat Supply Co., Ltd.
TBS Sunwork, Inc.
Vucast, Inc.
Tomo-Digi Corporation
INVESTOR INFORMATION 2016Tokyo Broadcasting System Holdings, Inc.
4
Organization As of April 1, 2016
INVESTOR INFORMATION 2016Tokyo Broadcasting System Holdings, Inc.
5
Corporate Data As of April 1, 2016
Date of EstablishmentHead Office
Paid-in CapitalNumber of Employees
Major Shareholders
May 10, 1951 (Registered on May 17)5-3-6 Akasaka, Minato-ku, Tokyo 107-8006, JapanURL: http://www.tbsholdings.co.jp/Stock Code: 9401, TSE First Section¥54,896,892,896Tokyo Broadcasting System Holdings, Inc. 312Tokyo Broadcasting System Television, Inc. 1,035TBS Radio Inc. 60
Name of shareholder Number of shares held (shares)
Percentage held(%)
The Master Trust Bank of Japan, Ltd.(Pension Account-Pension Trust Account held for DENTSU INC.) 9,310,500 5.32
Mainichi Broadcasting System, Inc. 8,848,100 5.06
The Master Trust Bank of Japan, Ltd.(Trust Account) 8,461,100 4.84
MITSUI & CO., LTD. 7,691,000 4.40
Sumitomo Mitsui Banking Corporation 5,745,267 3.28
Mitsui Fudosan Co., Ltd. 5,713,728 3.27
NTT DOCOMO, INC. 5,713,000 3.26
Panasonic Corporation 5,643,180 3.22
Nippon Life Insurance Company 5,006,235 2.86
UBS AG LONDON A/C IPBSEGREGATED CLIENT ACCOUNT 4,348,000 2.48
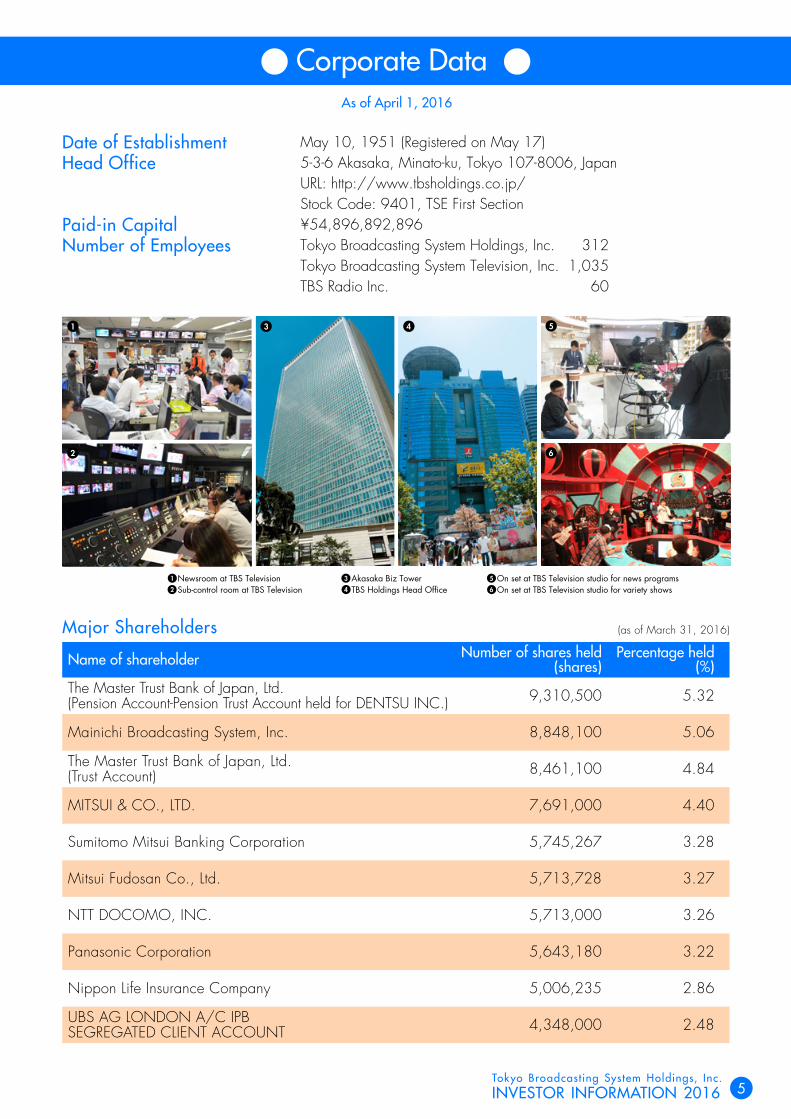
1 Newsroom at TBS Television2 Sub-control room at TBS Television
3 Akasaka Biz Tower4 TBS Holdings Head Office
5 On set at TBS Television studio for news programs6 On set at TBS Television studio for variety shows
(as of March 31, 2016)
1 3 5
2
4
6

INVESTOR INFORMATION 2016Tokyo Broadcasting System Holdings, Inc.
6
Business Report
1 Business Activities and ResultsDuring the fiscal year under review, Japan’s economy continued
on a path of modest recovery. Although some sluggishness was
observed in the recovery of personal consumption and capital
investment in the private sector, partly due to a slowdown in
emerging economies including China, employment and income
conditions are expected to improve on the back of the
government’s economic measures and quantitative and
qualitative monetary easing with a negative interest rate
adopted by the Bank of Japan.
Against this backdrop, consolidated net sales of the Group in
the fiscal year ended March 31, 2016 increased by 0.2%
from the previous fiscal year to ¥348,539 million, operating
income increased by 9.2% to ¥17,179 million, ordinary
income increased by 19.9% to ¥22,678 million, and profit
attributable to owners of parent increased by 13.2% to
¥14,497 million.
BroadcastingConsolidated net sales from the Broadcasting Business
segment increased by 0.4% from the previous fiscal year to
¥213,878 million, while operating income increased by
15.1% to ¥4,800 million.
Tokyo Broadcasting System Television, Inc., the core of the
Broadcasting Business, posted a 0.3% decline in time revenue
and a 0.4% decrease in spot revenue for the fiscal year under
review from the previous year. Regarding times sales, sales of
regular programs remained almost flat from the previous year,
while one-off programs, such as IAAF World Championships
Beijing 2015 in August and WBSC Premier12™ in November,
contributed to sales. Spot sales failed to exceed the previous
year on a full-year basis, although the volume of advertisements
sponsors targeted in the Kanto region outperformed the previous
year from late October.
BS-TBS, INC. continued to perform well, posting a 3.2%
increase in sales from the previous year through programming
and program production with the top priority on customer
satisfaction as the BS digital broadcasting market remained
firm. Despite factors including an increase in production costs
accompanying efforts to strengthen programming, such as the
production of the 15th anniversary “big and special” programs,
operating income also increased 7.2% from the previous year.
TBS Radio Inc. (formerly TBS Radio & Communications, Inc.)
continued to rank No. 1 in radio listener ratings research
conducted by Video Research Ltd. in the Tokyo metropolitan
area in February. Since the research undertaken for August
2001, the company has retained the top position for 88
consecutive terms covering 14 years and eight months. Amid
the continuing difficult situation surrounding radio broadcasting,
sales and operating income increased by 0.2% and decreased
by 28.7% for the fiscal year under review, respectively, from the
previous year, despite comprehensive efforts to enhance
profitability and control costs.
The Current Position of Tokyo Broadcasting System Holdings, Inc. and Its Subsidiaries
From April 1, 2015 to March 31, 2016
IAAF World Championships Beijing 2015© PHOTO KISHIMOTO
INVESTOR INFORMATION 2016Tokyo Broadcasting System Holdings, Inc.
7
Business Report
Multi-Visual Ventures and Cultural EventsNet sales from the Multi-Visual Ventures and Cultural Events
Business segment decreased by 0.3% from the previous fiscal
year to ¥119,181 million, while operating income increased
by 9.9% to ¥4,842 million.
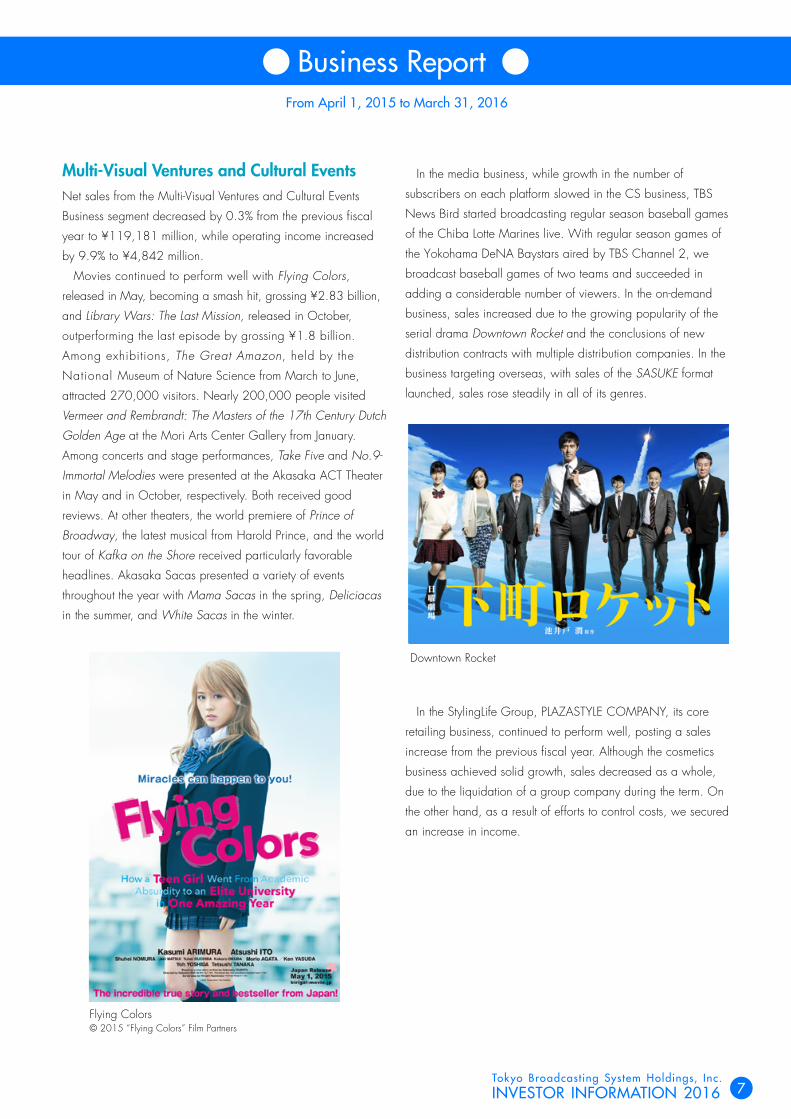
Movies continued to perform well with Flying Colors,
released in May, becoming a smash hit, grossing ¥2.83 billion,
and Library Wars: The Last Mission, released in October,
outperforming the last episode by grossing ¥1.8 billion.
Among exhibitions, The Great Amazon, held by the
National Museum of Nature Science from March to June,
attracted 270,000 visitors. Nearly 200,000 people visited
Vermeer and Rembrandt: The Masters of the 17th Century Dutch
Golden Age at the Mori Arts Center Gallery from January.
Among concerts and stage performances, Take Five and No.9-
Immortal Melodies were presented at the Akasaka ACT Theater
in May and in October, respectively. Both received good
reviews. At other theaters, the world premiere of Prince of
Broadway, the latest musical from Harold Prince, and the world
tour of Kafka on the Shore received particularly favorable
headlines. Akasaka Sacas presented a variety of events
throughout the year with Mama Sacas in the spring, Deliciacas
in the summer, and White Sacas in the winter.
Downtown Rocket
In the StylingLife Group, PLAZASTYLE COMPANY, its core
retailing business, continued to perform well, posting a sales
increase from the previous fiscal year. Although the cosmetics
business achieved solid growth, sales decreased as a whole,
due to the liquidation of a group company during the term. On
the other hand, as a result of efforts to control costs, we secured
an increase in income.
Flying Colors© 2015 “Flying Colors” Film Partners
In the media business, while growth in the number of
subscribers on each platform slowed in the CS business, TBS
News Bird started broadcasting regular season baseball games
of the Chiba Lotte Marines live. With regular season games of
the Yokohama DeNA Baystars aired by TBS Channel 2, we
broadcast baseball games of two teams and succeeded in
adding a considerable number of viewers. In the on-demand
business, sales increased due to the growing popularity of the
serial drama Downtown Rocket and the conclusions of new
distribution contracts with multiple distribution companies. In the
business targeting overseas, with sales of the SASUKE format
launched, sales rose steadily in all of its genres.
From April 1, 2015 to March 31, 2016

INVESTOR INFORMATION 2016Tokyo Broadcasting System Holdings, Inc.
8
Business Report
Real Estate BusinessNet sales from the Real Estate Business segment increased by
1.3% from the previous fiscal year to ¥15,479 million, and
operating income increased by 5.2% to ¥7,532 million.
Operational status remained sound at all offices and stores in
Akasaka Biz Tower and Akasaka The Residence. Regarding
Akasaka Sacas, we aim to cement its status as a mecca for a
creative broadcasting culture by continuing to hold various
events that bring the TBS Group and its programs closer to
customers and viewers.
2 Capital InvestmentTotal capital investment in the fiscal year under review was
¥11.0 billion.
Concerning equipment for producing television programs,
we upgraded imaging and sound systems in the Midoriyama
M5 Studio, which is a base for producing dramas. The TBS
Broadcasting Center in Akasaka, where comedy shows and
live programs are produced, upgraded imaging and sound
systems in the E-F Studio and the P Studio. To respond to
production of 4K programs in the future, we are introducing
image switchers that can be upgraded to 4K image systems.
Among internal core sales and broadcasting systems, a
file-based system for the production of news and information
programs was introduced. Coinciding with the commencement
of file-based operation, we reviewed the work flow of
conventional VTR-centered program production and have put all
tasks from recording raw materials and editing to distribution to
sub-control rooms into the file process system, making the work
flow more efficient. With the system in operation, all cameras
for recording news materials were replaced with memory-card-
based video camera recorders.
Regarding wireless equipment, we are upgrading FPU
equipment mainly for live broadcasting of road races and
specific radio mic equipment according to a radio frequency
shift plan. By the end of FY2017, we plan to have completed
the transitions of all related equipment.
In radio broadcasting, an FM relay station was opened at
Tokyo Skytree. The station, already popular under the nickname
Wide FM, is expected to become a key to disaster prevention
and respond to weak signal reception.
3 Capital ProcurementTotal interest-bearing debt of the Group at the end of the
fiscal year under review was ¥53.6 billion (excluding lease
obligations), consisting of ¥30.0 billion in current portion
of bonds and ¥23.6 billion in long-term loans payable
(including the current portion).
In order to ensure flexible access to operating capital,
as of the end of the fiscal year under review, StylingLife
Holdings Inc., a consolidated subsidiary of the Company,
had established the commitment line agreement, totaling
¥3.5 billion with multiple financial institutions (the balance
of the funds drawn is nil, and the available balance is
¥3.5 billion).
Besides the above, with the aim of streamlining of funds,
some account receivables are in the process of liquidation.
From April 1, 2015 to March 31, 2016
INVESTOR INFORMATION 2016Tokyo Broadcasting System Holdings, Inc.
9
Consolidated Financial Statements
Consolidated Balance Sheets (Unaudited)
As of March 31, 2016 and 2015Millions of yen
2015 2016Assets
Current assetsCash and deposits ¥ 55,773 ¥ 74,273Notes and accounts receivable—trade 38,309 38,850Securities 1,206 1,001Merchandise and finished goods 7,353 7,245Program rights and work in process 7,759 6,173Raw materials and supplies 589 561Prepaid expenses 11,124 10,880Deferred tax assets 3,381 3,666Other 5,733 7,004Allowance for doubtful accounts (104) (177)Total current assets 131,127 149,478
Noncurrent assets
Property, plant and equipmentBuildings and structures 196,995 199,705
Accumulated depreciation (95,923) (102,822)
Buildings and structures, net 101,072 96,883Machinery, equipment and vehicles 89,121 90,281
Accumulated depreciation (79,988) (79,094)
Machinery, equipment and vehicles, net 9,133 11,187Tools, furniture and fixtures 27,858 30,433
Accumulated depreciation (25,333) (27,635)
Tools, furniture and fixtures, net 2,524 2,797Land 84,010 84,008Lease assets 6,850 3,728
Accumulated depreciation (4,392) (1,826)
Lease assets, net 2,458 1,901Construction in progress 3,904 2,211Total property, plant and equipment 203,104 198,988
Intangible assetsSoftware 3,755 4,438Goodwill 21,699 20,392Lease assets 180 129Other 1,598 1,601Total intangible assets 27,234 26,560
Investments and other assetsInvestment securities 276,383 260,218Long-term loans receivable 292 226Deferred tax assets 1,995 1,212Long-term prepaid expenses 446 350Other 13,484 13,160Allowance for doubtful accounts (337) (225)
Total investments and other assets 292,265 274,942Total noncurrent assets 522,604 500,492
Total assets ¥ 653,732 ¥ 649,970

INVESTOR INFORMATION 2016Tokyo Broadcasting System Holdings, Inc.
10
Consolidated Financial Statements
Consolidated Balance Sheets (Unaudited)
As of March 31, 2016 and 2015Millions of yen
2015 2016Liabilities
Current liabilities
Notes and accounts payable—trade ¥ 32,716 ¥ 34,048
Short-term loans payable 200 —
Current portion of long-term loans payable 1,200 1,200
Current portion of bonds — 30,000
Accounts payable—other 9,495 11,768
Income taxes payable 3,752 4,671
Accrued consumption taxes 3,688 1,526
Accrued expenses 5,481 5,364
Provision for directors’ bonuses 107 108
Other provision 1,634 1,247
Other 4,796 5,342
Total current liabilities 63,072 95,278
Noncurrent liabilities
Bonds payable 30,000 —
Long-term loans payable 23,600 22,400
Provision for environmental measures 120 119
Net defined benefit liability 14,942 15,971
Lease obligations 893 829
Deferred tax liabilities 50,486 42,926
Other 14,498 14,236
Total noncurrent liabilities 134,541 96,483
Total liabilities 197,613 191,762
Net assets
Shareholders’ equity
Capital stock 54,986 54,986
Capital surplus 59,523 50,477
Retained earnings 244,714 255,701
Treasury stock (36,749) (20,674)
Total shareholders’ equity 322,474 340,490
Accumulated other comprehensive income
Valuation difference on available-for-sale securities 112,309 103,362
Deferred gains or losses on hedges 663 294
Foreign currency translation adjustment 57 8
Remeasurements of defined benefit plans 285 (69)
Total accumulated other comprehensive income 113,315 103,596
Non-controlling interests 20,328 14,121
Total net assets 456,118 458,208
Total liabilities and net assets ¥ 653,732 ¥ 649,970

INVESTOR INFORMATION 2016Tokyo Broadcasting System Holdings, Inc.
11
Consolidated Financial Statements
Consolidated Statements of Income (Unaudited)
As of March 31, 2016 and 2015Millions of yen
2015 2016Net sales ¥ 347,817 ¥ 348,539
Cost of sales 241,152 241,466
Gross profit 106,665 107,072
Selling, general and administrative expenses 90,936 89,983
Operating income 15,728 17,179
Non-operating income
Interest income 58 49
Dividends income 3,397 4,583
Equity in earnings of affiliates 968 1,030
Other 672 1,059
Total non-operating income 5,096 6,723
Non-operating expenses
Interest expenses 949 777
Loss on retirement of noncurrent assets 250 171
Other 709 275
Total non-operating expenses 1,909 1,224
Ordinary income 18,915 22,678
Extraordinary income
Gain on sales of investment securities 3,004 478
Gain on step acquisitions — 61
Total extraordinary income 3,004 539
Extraordinary loss
Impairment loss 157 130
Loss on valuation of investment securities 594 105
Loss on business withdrawal 547 —
Loss on sales of investment securities 119 —
Loss on sales of shares of subsidiaries and associates 62 —
Total extraordinary losses 1,482 235
Profit before income taxes 20,437 22,982
Income taxes—current 5,649 6,077
Income taxes—deferred 1,255 1,343
Total income taxes 6,904 7,421
Profit 13,533 15,561
Profit attributable to non-controlling interests 722 1,064
Profit attributable to owners of parent ¥ 12,811 ¥ 14,497

INVESTOR INFORMATION 2016Tokyo Broadcasting System Holdings, Inc.
12
Consolidated Financial Statements
Consolidated Statements of Cash Flows (Unaudited)
As of March 31, 2016 and 2015Millions of yen
2015 2016Cash flows from operating activities
Income before income taxes ¥ 20,437 ¥ 22,982Depreciation and amortization 14,621 14,385Amortization of long-term prepaid expenses 254 235Amortization of goodwill 1,497 1,439Gain on valuation of investment securities 594 105Gain on sales of investment securities (2,884) (478)Increase (decrease) in net defined benefit liability 368 (51)Loss on retirement of noncurrent assets 250 171Loss (gain) on step acquisitions — (61)Increase (decrease) in allowance for doubtful accounts (87) (104)Interest and dividends income (3,456) (4,632)Interest expenses 949 777Equity in (earnings) losses of affiliates (968) (1,030)Decrease (increase) in notes and accounts receivable—trade (39) (439)Decrease (increase) in inventories (482) 1,725Decrease (increase) in prepaid expenses (362) 306Increase (decrease) in notes and accounts payable—trade (1,555) 1,329Other, net 2,144 (3,656)Subtotal 31,282 33,003Interest and dividends income received 3,572 4,877Interest expenses paid (949) (776)Income taxes refund 532 942Income taxes paid (6,585) (5,709)Net cash provided by operating activities 27,851 32,337
Cash flows from investing activitiesPurchase of property, plant and equipment (8,247) (5,954)Purchase of intangible assets (969) (2,511)Purchase of investment securities (498) (464)Proceeds from sales of investment securities 7,859 661Purchase of stocks of subsidiaries and affiliates (376) (118)Proceeds from purchase of investments in subsidiaries resulting in change in scope of consolidation — (36)Other, net (94) (532)Net cash used in investing activities (2,326) (8,956)
Cash flows from financing activitiesDecrease in short-term loans payable — (200)Repayment of long-term loans payable (1,200) (1,200)Redemption of bonds (20,000) —Proceeds from disposal of treasury shares 462 365Cash dividends paid (3,389) (3,510)Cash dividends paid to non-controlling interests (265) (157)Other, net (849) (623)Net cash used in financing activities (25,242) (5,326)
Effect of exchange rate change on cash and cash equivalents 133 (49)Net increase (decrease) in cash and cash equivalents 415 18,005Cash and cash equivalents at beginning of period 56,312 56,728Cash and cash equivalents at end of period ¥ 56,728 ¥ 74,734

INVESTOR INFORMATION 2016Tokyo Broadcasting System Holdings, Inc.
13
Major Indices
15/3
60.27
13/3
Earnings per Share(Yen)
74.71
12/3
Ratio of Ordinary Income to Total Assets (%)
2.5
12/3
Equity Ratio(%)
63.366.7
55.5
12/3 13/3
Return on Equity(%)
3.6
12/3
Ratio of Operating Income to Net Sales(%)
12/3
Net Assets per Share(Yen)
2,025.89
12/3
2.9 2.8
3.2
13/3
3.2 3.2 3.1
13/3 14/3 13/3 14/3
4.54.4
3.5
4.6
58.7
14/3
2,158.00
13/3
61.22
14/3
2,263.65
14/3
14/3 16/3
3.379.12
15/3
83.12
16/3
15/3 16/3 15/3
4.9
16/3
15/3
68.3
16/3
2,689.56
15/3
2,545.60
16/3
3.5

INVESTOR INFORMATION 2016Tokyo Broadcasting System Holdings, Inc.
14
Major Indices
190,434,968
15/3
Number of Shares Issued at the End of the Term (Including Treasury Shares) (Shares)
190,434,968 190,434,968 190,434,968
12/3
Cash Flows from Operating Activities(Millions of yen)
12/3
Cash Flows from Financing Activities(Millions of yen)
12/3
Amount of Treasury Shares at the End of the Term(Shares)
12/3
Cash Flows from Investing Activities(Millions of yen)
12/3
Cash and Cash Equivalents, at End of Period(Millions of yen)
78,801
30,072
–16,993
12/3
38,225,599
–5,731
190,434,968
13/3 13/3
38,226,794
13/3
28,156
14/3
23,038
15/3
27,851
16/3
32,337
13/3
–13,649
13/3
–25,475
68,031
13/3
56,312
14/3
56,728
15/3
74,374
16/3
14/3 14/3
28,590,009
15/3
28,404,517
14/3
–11,326
14/3
–23,567
15/3
–25,242
16/3
–5,326
15/3
–2,326
16/3 16/3
15,981,914
16/3
–8,956

INVESTOR INFORMATION 2016Tokyo Broadcasting System Holdings, Inc.
15
Segment Information
Consolidated Results by Segment
Capital Expenditures and Depreciation
Consolidated FY2016
Capital expenditures ¥11,050
Depreciation 13,077
TBS Holdings FY2016
Capital expenditures ¥ 772
Depreciation 3,121
TBS Television FY2016
Capital expenditures ¥ 7,715
Depreciation 7,298
(Millions of yen)
(Millions of yen)
FY2016External
sales y/y change Operatingincome y/y change
Broadcasting Business ¥213,878 +892 ¥ 4,800 +629
Multi-Visual Ventures and Cultural Events Business 119,181 –371 4,842 +435
Real Estate Business 15,479 +201 7,532 +374
Consolidated Business ¥348,539 +721 ¥17,179 +1,450
INVESTOR INFORMATION 2016Tokyo Broadcasting System Holdings, Inc.
16
Segment Information
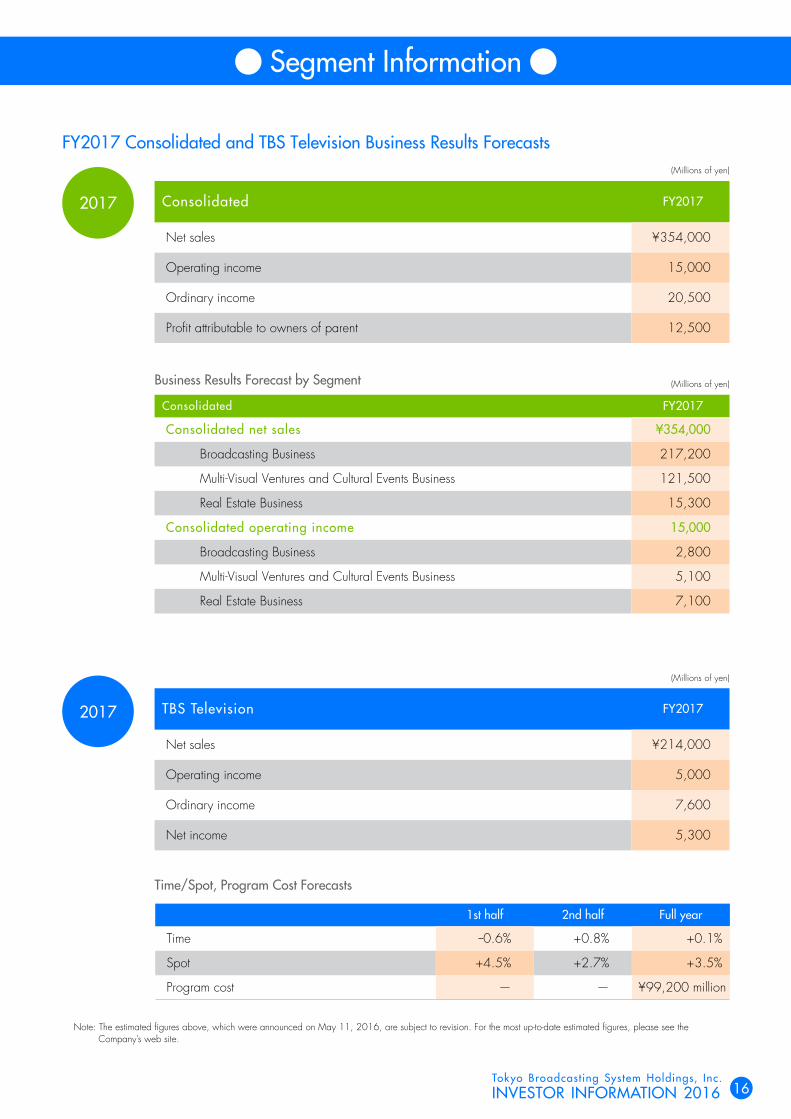
FY2017 Consolidated and TBS Television Business Results Forecasts
Note: The estimated figures above, which were announced on May 11, 2016, are subject to revision. For the most up-to-date estimated figures, please see the Company’s web site.
Time/Spot, Program Cost Forecasts
Business Results Forecast by Segment
TBS Television FY2017
Net sales ¥214,000
Operating income 5,000
Ordinary income 7,600
Net income 5,300
1st half 2nd half Full year
Time -0.6% +0.8% +0.1%
Spot +4.5% +2.7% +3.5%
Program cost — — ¥99,200 million
Consolidated FY2017
Consolidated net sales ¥354,000
Broadcasting Business 217,200
Multi-Visual Ventures and Cultural Events Business 121,500
Real Estate Business 15,300
Consolidated operating income 15,000
Broadcasting Business 2,800
Multi-Visual Ventures and Cultural Events Business 5,100
Real Estate Business 7,100
Consolidated FY2017
Net sales ¥354,000
Operating income 15,000
Ordinary income 20,500
Profit attributable to owners of parent 12,500
(Millions of yen)
(Millions of yen)
(Millions of yen)
2017
2017

INVESTOR INFORMATION 2016Tokyo Broadcasting System Holdings, Inc.
17
TBS Television 1
Breakdown of TBS Television Income
Year-on-Year Changes in Time/Spot Earnings
FY2016 y/y change
Television ¥181,032 +81
Time advertising 84,930 –259
Spot advertising 83,554 –294
Program sales in Japan 3,596 +187
Others 8,951 +447
Operations 26,350 +937
Real estate 2,969 –0
Total income ¥210,353 +1,017
Q1 Q2 Q3 Q4 Full year
● Time 93.4 101.4 102.4 101.7 99.7
● Spot 97.0 97.9 101.0 102.7 99.6
TBS share among five key broadcasters 19.0 18.3 18.6 18.4 18.6
(Millions of yen)
Time
Spot
99.8
100.1
98.4
100.2
82.6
91.3
94.9
98.1
136.7
86.2
77.7
109.3
95.8
102.1105.4
100.0
106.3
100.8
107.3
104.0 100.0
104.9
97.5
100.2
Apr. May Jun. Jul. Aug. Sep. Oct. Nov. Dec. Jan. Feb. Mar.
2015 2016
(%)
150
120
90
60
Asa Chan! SUNDAY MORNING HIRUOBI!

INVESTOR INFORMATION 2016Tokyo Broadcasting System Holdings, Inc.
18
TBS Television 2
Spot Advertising Sales Ranks by Business Category
TBS Television Business Segment IncomeSegment Full year y/y change Remarks
Operations division
Cultural business (events) ¥ 2,489 +166 Revenue increased in the full year, partly due to large events such as Vermeer and Rembrandt in the fourth quarter, although the number of events was lower than the previous year.
Show business 3,646 -458Revenue declined in reaction to the strong sales of Stars on Ice in the previous year, despite strong sales of TAKE FIVE and Number 9 – Immortal Melody, in addition to REON JACK in the fourth quarter.
Movies and animation business
Movies 1,714 -42Although revenue declined due to a rebound from the strong sales of DVDs of SPEC: Close in the previous year, profit increased thanks to the strong sales of Flying Colors and Library Wars: The Last Mission.
Animation 975 -275 Revenue fell due to the weak sales of newly released animations.
Content business division
Multi-visual business (DVDs) 1,960 +323 Revenue rose, mainly due to the strong sales of Ouroboros and Library Wars: Book of
Memories in the full year, in addition to Downtown Rocket that was released in March.
Overseas business 2,186 +592 Revenue increased significantly due to the effect of the global launch of SASUKE, in addition to sales in Asian markets that continued to be strong.
Pay-TV business 10,784 +1,053 The revenue of the CS business climbed, reflecting a stable increase in subscriber numbers for TBS Channel 2 and News Bird. TBS on demand also continued to show solid performance.
Licensing business 961 -236 Revenue declined as regular TV infomercials were sluggish, although the sales of Gudetama continued to be strong.
Smart Media business 1,630 -186 Revenue decreased because the mobile phone billing business was almost closed, in addition to the contraction of the gaming business.
Total ¥26,350 +937
FY2016 Growth rate Share
1 Information, telecommunications, and broadcasting +7.9 13.5
2 Foods +6.0 10.7
3 Alcoholic and other beverages –9.1 9.9
4 Pharmaceuticals +0.6 9.3
5 Cosmetics and toiletry +7.0 8.1
6 Financial services +6.3 6.9
7 Automobiles and transportation equipment –27.0 6.1
8 Precision instruments and office machines +15.0 6.0
9 Transportation and leisure –2.9 4.8
10 Distribution –0.1 4.4
(Millions of yen)
(%)
(Ranked in order of sales proceeds)
Pittanko Kankan Monitoring Bakuhou! THE Friday
INVESTOR INFORMATION 2016Tokyo Broadcasting System Holdings, Inc.
19
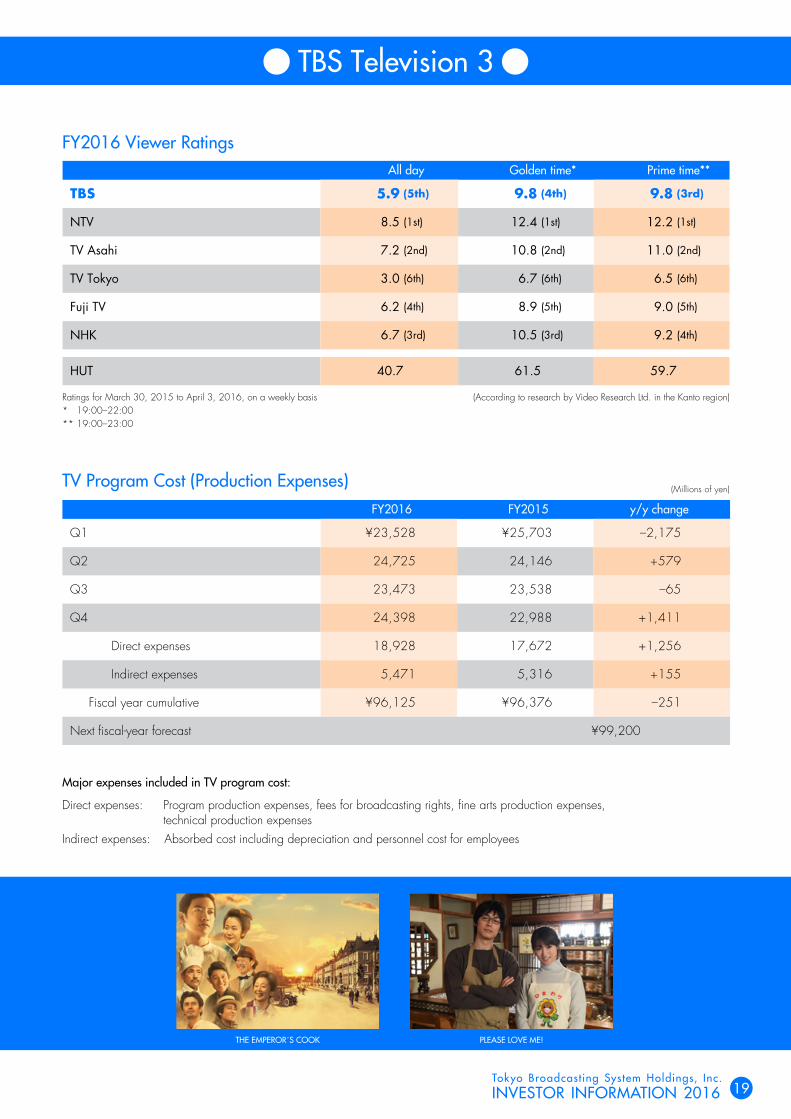
TBS Television 3
FY2016 Viewer Ratings
TV Program Cost (Production Expenses)FY2016 FY2015 y/y change
Q1 ¥23,528 ¥25,703 –2,175
Q2 24,725 24,146 +579
Q3 23,473 23,538 –65
Q4 24,398 22,988 +1,411
Direct expenses 18,928 17,672 +1,256
Indirect expenses 5,471 5,316 +155
Fiscal year cumulative ¥96,125 ¥96,376 –251
Next fiscal-year forecast ¥99,200
Ratings for March 30, 2015 to April 3, 2016, on a weekly basis* 19:00–22:00** 19:00–23:00
(According to research by Video Research Ltd. in the Kanto region)
Major expenses included in TV program cost:
Direct expenses: Program production expenses, fees for broadcasting rights, fine arts production expenses, technical production expensesIndirect expenses: Absorbed cost including depreciation and personnel cost for employees
(%)
(Millions of yen)
All day Golden time* Prime time**
TBS 5.9 (5th) 9.8 (4th) 9.8 (3rd)
NTV 8.5 (1st) 12.4 (1st) 12.2 (1st)
TV Asahi 7.2 (2nd) 10.8 (2nd) 11.0 (2nd)
TV Tokyo 3.0 (6th) 6.7 (6th) 6.5 (6th)
Fuji TV 6.2 (4th) 8.9 (5th) 9.0 (5th)
NHK 6.7 (3rd) 10.5 (3rd) 9.2 (4th)
HUT 40.7 61.5 59.7
THE EMPEROR´S COOK PLEASE LOVE ME!
INVESTOR INFORMATION 2016Tokyo Broadcasting System Holdings, Inc.
20
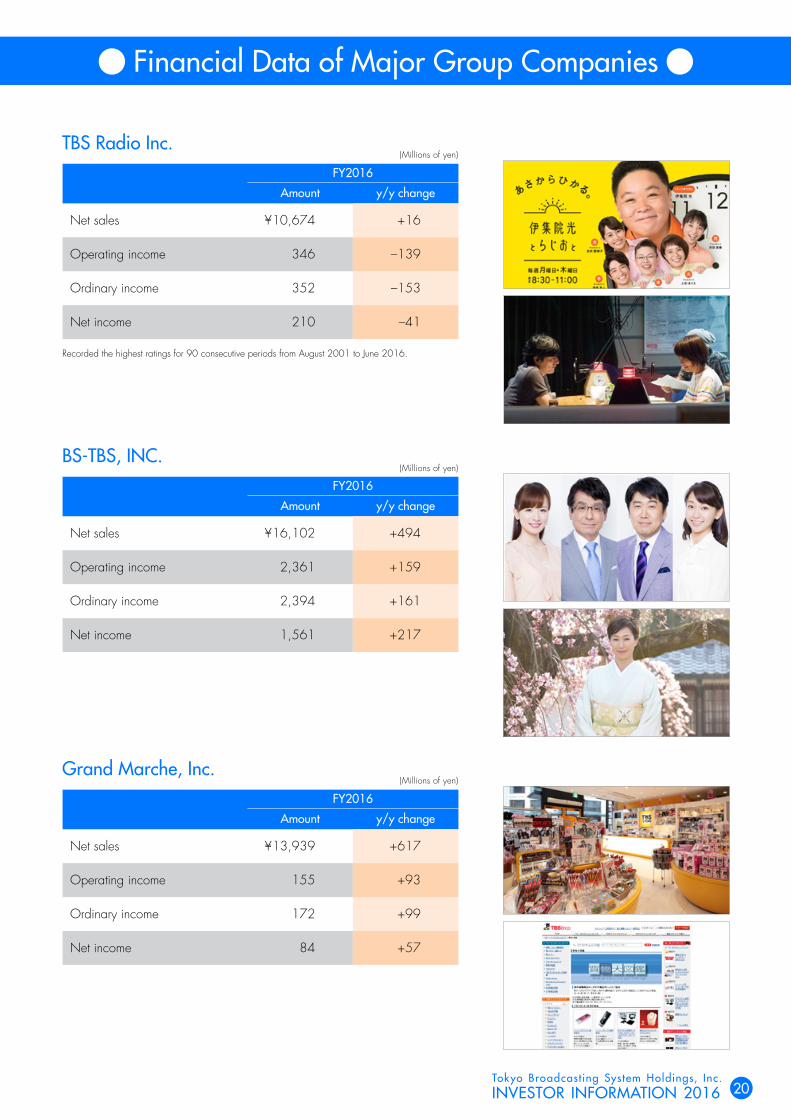
Financial Data of Major Group Companies
TBS Radio Inc.
BS-TBS, INC.
Grand Marche, Inc.
(Millions of yen)
(Millions of yen)
(Millions of yen)
FY2016
Amount y/y change
Net sales ¥10,674 +16
Operating income 346 –139
Ordinary income 352 –153
Net income 210 –41
FY2016
Amount y/y change
Net sales ¥16,102 +494
Operating income 2,361 +159
Ordinary income 2,394 +161
Net income 1,561 +217
FY2016
Amount y/y change
Net sales ¥13,939 +617
Operating income 155 +93
Ordinary income 172 +99
Net income 84 +57
Recorded the highest ratings for 90 consecutive periods from August 2001 to June 2016.

INVESTOR INFORMATION 2016Tokyo Broadcasting System Holdings, Inc.
21
Financial Data of Major Group Companies
StylingLife Holdings Inc. (Consolidated)FY2016
Amount y/y change
Net sales ¥65,379 –1,028
Operating income 2,314 +525
Ordinary income 2,735 +870
Net income 1,539 +1,450
(Millions of yen)
BARBAPAPA©2014A.T. & T.T.
INVESTOR INFORMATION 2016Tokyo Broadcasting System Holdings, Inc.
22
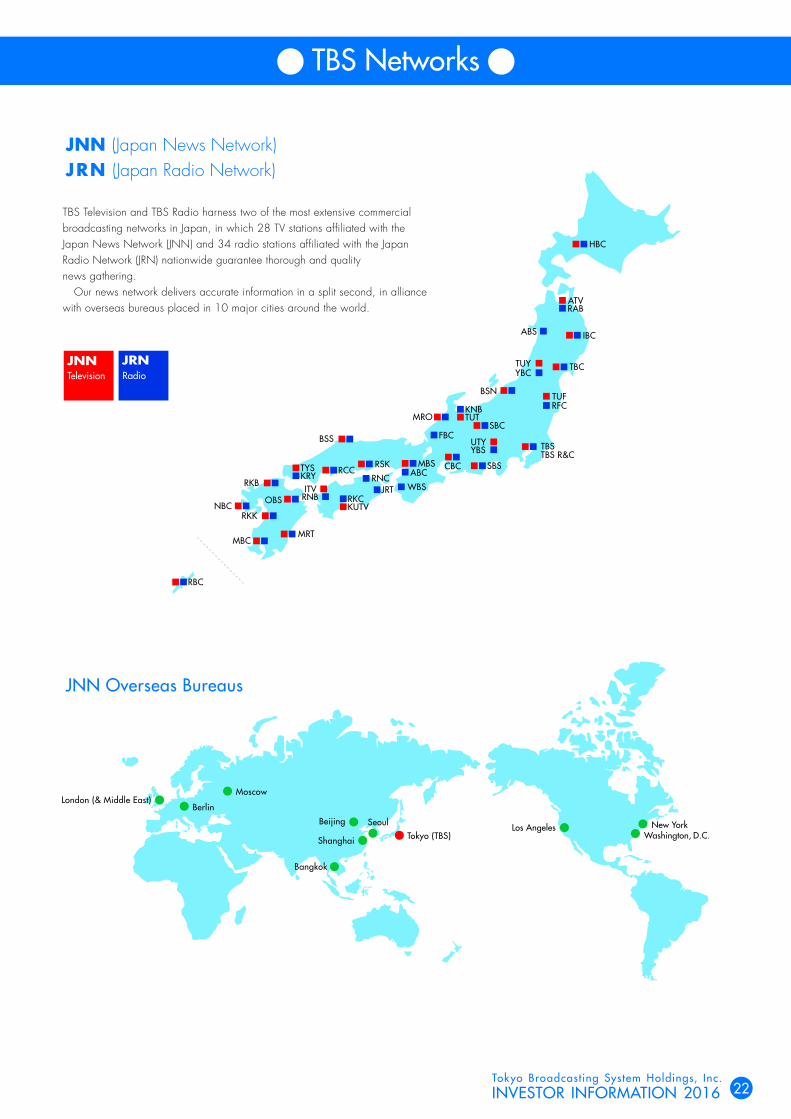
TBS Networks
JNN (Japan News Network)JRN (Japan Radio Network)
JNN Overseas Bureaus
London (& Middle East)Berlin
Beijing
Moscow
HBC
IBC
TBC
TUFRFC
ABS
TUYYBC
BSN
KNBMRO
FBC
MBS
BSS
TYS
RKB
NBCRKK
MBCMRT
RBC
OBSITV
RNB
KRYRSK
RNC
RKCKUTV
JRT
RCC ABC
WBS
CBC
SBC
UTYYBS
SBS
TUT
TBSTBS R&C
ATVRAB
Bangkok
Los AngelesWashington, D.C.
New YorkSeoulTokyo (TBS)Shanghai
TBS Television and TBS Radio harness two of the most extensive commercial broadcasting networks in Japan, in which 28 TV stations af�liated with the Japan News Network (JNN) and 34 radio stations af�liated with the Japan Radio Network (JRN) nationwide guarantee thorough and quality news gathering. Our news network delivers accurate information in a split second, in alliance with overseas bureaus placed in 10 major cities around the world.
JNN JRNTelevision Radio

Tokyo Broadcasting System Holdings, Inc.
5-3-6 Akasaka, Minato-ku, Tokyo 107-8006, Japan Phone: +81-3-3746-1111 Fax: +81-3-3588-6378
www.tbsholdings.co.jp/ir/en/