investor day 2017 - ses | beyond frontiers investing decision from financing decision target irrs in...
TRANSCRIPT

Investor Day 2017 |
28 June 2017
Investor Day 2017
London
Investor Day 2017 |
Agenda
2
Overview Karim Michel Sabbagh
President and CEO
Development Christophe De Hauwer
Chief Strategy and Development Officer
SES Video Ferdinand Kayser
CEO of SES Video
SES Networks Steve Collar
CEO of SES Networks
Q&A
Technology Martin Halliwell
Chief Technology Officer
Finance Padraig McCarthy
Chief Financial Officer
Q&A
Lunch

DELIVERING SUSTAINED AND PROFITABLE GROWTH
Karim Michel Sabbagh, President and CEO

Investor Day 2017 | 4
Covering 99.99%
of the globe and world’s population
>50 GEO satellites
offering multiple frequency bands
12 MEO satellites
(growing to 20 satellites by 2019)
>60 Teleports
supporting global ground network
Serving customers in more than
130 countries
Delivering value-added end-
to-end solutions
>EUR 2 billion annual
revenue (FY 2016)
EUR 7.8 billion
contract backlog (as at Q1 2017)
World’s Leading Satellite-enabled Solutions Provider

Investor Day 2017 |
Focusing on Globalisation and Verticalisation Key to Growth
5
Adapted from SES’s 2014 Investor Day
Successful model for niche
and/or non-for-profit players
Explicit government-level support
Generally lacking economies of
scale, facing high learning curve
and fixed cost barriers
Economies of scale across
segments and geographies
Wide innovation spectrum
Versatile cross-segmental capabilities system
Ability to adapt and evolve may be
constrained due to scale
Economies of scale within
selected segment(s)
Focused innovation drive
Coherent capabilities system
Exposure to selected segments
limits risk mitigation and synergies
APPLICATION
GE
OG
RA
PH
IC S
PA
N
Multiple vertical focus Generalist
Glo
ba
l R
eg
ion
al
SCALE SCALE
SC
OP
E
Regional focus with strong “home
market”
Positive economics at maturity phase
Saturated growth opportunities and
exposure to select geography limits risk
mitigation

Investor Day 2017 | 6
Delivering a flexible and scalable, global satellite-enabled network
Focusing on value-added, end-to-end solutions in four key verticals
Innovating at all levels of the business to create future-proof differentiation
Executing profitable growth strategy within SES’s financial framework
Executing Differentiated Strategy

Investor Day 2017 |
▲ EUR 1.7 billion re-invested into new and profitable investments (2014-2016)
▲ Maintained commitment to progressive dividend per share
▲ Executed growth accelerators, while net debt to EBITDA kept below 3.3 times (2014-2016)
Improving Business Mix Through Strategy Execution
7
2014 2015 2016 2017 (so far)
Consolidated O3b
Created MX1
First on flight-proven
rocket (SES-10) First on SpaceX (SES-8)
First electric propulsion
satellite (SES-9)
First hybrid and all-
electric satellite (SES-15)
First fully digital
payload (SES-17)
Reporting by vertical
Introduced Market
Solution Centres
First SES+ products
First in commercial UHD
Major IFC/IFC deal with
Global Eagle Ent.
LuxGovSat (SES-16)
SES-9 (Asia-Pacific) SES-10 (Latin America) SES-8 (Asia-Pacific)
First SES GS/O3b win
Evolved operating model
SES Video
HD+ Extra Screen
ASTRA 2G (MENA)
SLAs with Facebook
and TROJAN Network
SES Networks
WAAS/GOLD hosted
payload agreements
NATO AGS (LuxGovSat)
IFC/IFC deals with Gogo,
Panasonic Avionics, Thales
EGNOS payloads
First O3b MEO satellites

Investor Day 2017 |
Delivering Sustained and Profitable Growth
8
67%
13%
7%
11%
Video
Government
Mobility
Fixed Data
% of 2016
Revenue(1)
Growing HD and UHD
Expanding video platforms globally
Delivering hybrid solutions
Enabling clients to extend connectivity
Delivering end-to-end network solutions
Providing ‘home-equivalent’ experience
Delivering end-to-end network solutions
Expanding government applications
Delivering end-to-end network solutions
Growth drivers
1) Like for like (assuming that RR Media and O3b had been consolidated from 1 January 2016)
2) Source: NSR forecast revenue from satellite video capacity; playout, media asset management and teleport; online video platforms and ancillary services (2016-2022)
3) Source: NSR forecast revenue from satellite capacity (wide beam and HTS), network platform and service provision (2016-2022)
Market
opportunity
+2% CAGR To USD 20 billion
(by 2022)(2)
+3% CAGR To USD 8 billion
(by 2022)(3)
+14% CAGR To USD 5 billion
(by 2022)(3)
+7% CAGR To USD 4 billion
(by 2022)(3)

Investor Day 2017 |
SES’s differentiated value proposition
SES Video
▲ Prime neighbourhoods in all global markets
▲ Highly efficient and cost effective distribution platform
▲ Fully integrated digital model
▲ World-leading media services provider
▲ End-to-end DTH and OTT platform capabilities
SES Networks
( )
▲ Multi-layered, distributed (GEO-MEO) network
▲ Flexible global coverage across multiple frequencies
▲ Scaling up integrated, end-to-end capabilities
▲ Reliable and scalable global ground network
▲ Long-standing relationships with global governments
Aligning Go-to-market Organisation to Customer-centric Focus
9
Creating two natural business units – SES Video and SES Networks
Coalescing differentiated capabilities to bring the best of SES to each and every client

Investor Day 2017 |
Expanding, Enhancing and Innovating in Technology
10
Increasing flexibility and
scalability
▲ Adding hosted payloads to replacement missions
▲ Fully flexible digital processing in GEO and MEO
Collaborating with customers
during design phase
▲ EUR 1.1 billion contract backlog in Mobility
Reducing time to market and
increasing access to space
▲ First to launch on flight-proven
Falcon-9 rocket
Pursuing an open innovation
model and network architecture
▲ enhancing multi-screen experience
▲ Enabling customer’s full choice of solutions
Maximising capital efficiency
and profitability
▲ Delivering 20% reduction in normalised CapEx vs.
2014 (one year ahead of schedule)
SES-10
Credit: SpaceX

Investor Day 2017 |
Supporting Growth With a Consistent Financial Framework
11
Applying consistent
use of cash approach
▲ Current replacement requirements and committed growth pipeline
▲ Maintaining a progressive dividend per share
▲ Executing additional growth accelerators within financial framework
Financing decision to
maximise future ROIC
▲ Optimising SES’s long-term cost of capital and liquidity
▲ Retaining flexibility with access to wide range of attractive sources
▲ Maintaining net debt to EBITDA ratio below 3.3 times
Separate investing
decision from
financing decision
▲ Target IRRs in excess of 10%
▲ Securing anchor customers in advance of procurement
▲ Seeding new market opportunities with existing global network/assets
▲ Disciplined investment across value chain to deliver customer solutions
Well positioned to deliver sustained and profitable growth and returns

BOLD STRATEGY ROADMAP
Christophe De Hauwer, Chief Strategy and Development Officer

Investor Day 2017 |
Employing an Adaptive Strategy Roadmap
Placing Customer-centricity at the core
Developing an optimised and flexible technology model to best serve clients in
each of the market verticals
Optimised SES’s business models and capability system across the value chain to
build long term partnerships with customers
Shaping the ecosystem in the industry to continue to enhance, expand and innovate
13

Investor Day 2017 |
Placing Customer-centricity at the Core
Customers seeking for
flexible and scalable solutions
Increasingly technology
agnostic and capabilities
focused
Building SES’s expertise and
differentiated offering
1
2
3
5
4
Deep customer insight
Consistency and
alignment
Agility and
responsiveness
Operational
efficiency
Enable customer
success
Customer centricity
14

Investor Day 2017 |
Providing flexible and scalable products and solutions
Integrating technology evolution seamlessly
Improving economics do drive increased usage
Optimising SES’s Technology Model
SES-15
(hybrid)
SES-12
(hybrid)
SES- 16/
GovSat SES-14
(hybrid)
O3b
Block-3 SES-17
GEO/MEO-
Next
Payload Shaped
+HTS
Shaped
+HTS
+ DTP
Steerable
spot beams
Shaped
+HTS
+ DTP
HTS HTS
+ Full DTP
Full hybrid
+ Full DTP
Segments
Anchor
Aero IFC/IFE
WAAS
payload
Aero IFC/IFE LuxGovSat
for NATO
Aero IFC/IFE
GOLD
payload
Backhaul
Maritime
Government
Aero IFC/IFE
H1 2017 H2 2017 2018/‘19 2020/+
15

Investor Day 2017 |
Enhancing viewer experiences
Expanding video globally
Innovating with hybrid solutions
Any device, anytime, anywhere
Enhancing differentiation
Expanding network capabilities
Innovating with services with
new products and engagement
Increasing addressable market
SES
Video
Backend
provider
Infrastructure
provider
Experience
provider
SES
Networks
Infrastructure
provider
Network
platform
Service
provider
Optimising SES’s Business Model and Commercial Approach
16

Investor Day 2017 |
Shaping the Ecosystem in the Industry
Shaping SES’s strategy and business model in tandem with market / industry foresights
Enhanced monetisation, time-to-market
Improved monetisation potential from
12 inclined orbit satellites
5 Hosted payloads: leverage fleet, to offer low
cost to space and short time-to-market
Bold Innovation
Venture Capital
to maximise intelligence
Start-up incubator
to test new ideas / business models
Expanded capabilities
embrace hybrid SAT/IP environment “SES+” end-to-end products
17

Investor Day 2017 |
Build a strong capability system to execute on our strategy presently and in the
future
Lead the top four verticals with differentiated solutions that add value to our
customers and enable their businesses
Establish SES as the foremost provider of satellite enabled communications and
media solutions
Bold Strategy Roadmap
18

SHAPING FUTURE VIDEO EXPERIENCES
Ferdinand Kayser, CEO of SES Video

Investor Day 2017 |
Shaping the Future Video Experiences with Unique Offering
Enhancing the viewer experience by upgrading to HD/UHD
Expanding end-to-end capabilities and video neighbourhoods globally
Innovating to deliver the best experience to any device, anywhere, anytime
20
Investor Day 2017 |
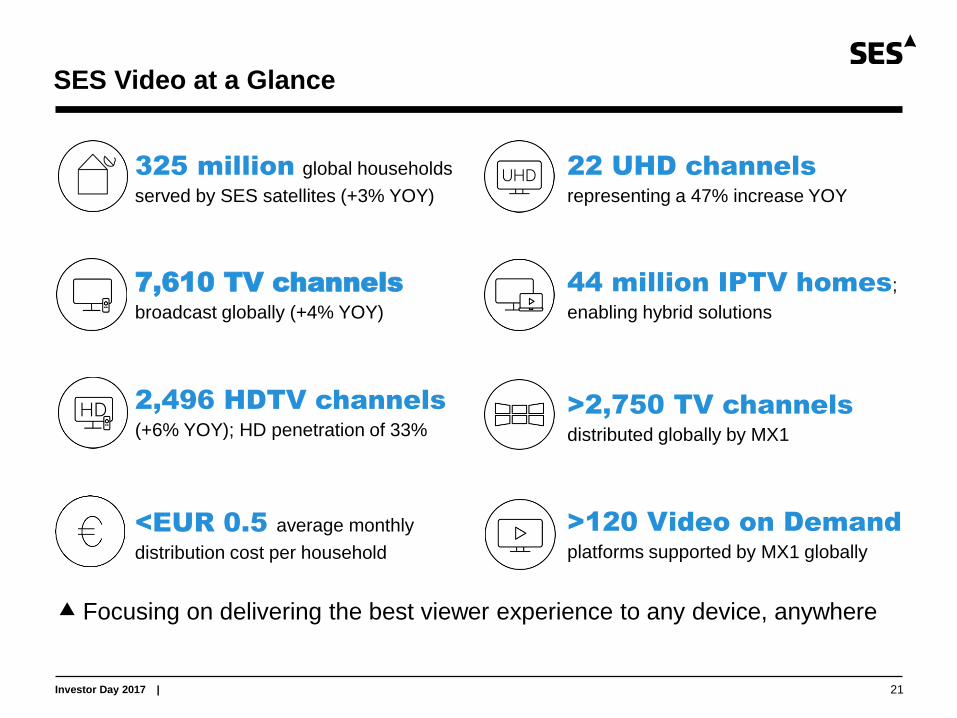
SES Video at a Glance
Focusing on delivering the best viewer experience to any device, anywhere
325 million global households
served by SES satellites (+3% YOY)
22 UHD channels
representing a 47% increase YOY
7,610 TV channels
broadcast globally (+4% YOY)
44 million IPTV homes;
enabling hybrid solutions
2,496 HDTV channels
(+6% YOY); HD penetration of 33%
>2,750 TV channels
distributed globally by MX1
<EUR 0.5 average monthly
distribution cost per household
>120 Video on Demand
platforms supported by MX1 globally
21

Investor Day 2017 |
Coverage
Global Scope
All devices
SES Video: Complete and Differentiated Capabilities
Media Service Scope
Conventional Video Services
Online Video Services
Service Capability
System capabilities
Service platform capabilities
Playout Media asset
management
Encoding/
Transcoding
Encoding/
Transcoding
Digital Rights
Management
Online Video
Platform
TV Tablet Smartphone Laptop
Encryption Uplink Direct-to-Home Direct to IPTV
headends
Direct-to-Cable
Distribution
Digital Terrestrial
Distribution Infrastructure
Satellite capacity
Online distribution capabilities
22

Investor Day 2017 |
2006 2007 2008 2009 2010 2011 2012 2013 2014 2015 2016
Linear TV OTT
Evolving and Complementary Viewing Experiences
1) Not chronological
2) Source: Ampere Consumer, Q1 2017 - 21,000 respondents in North America and Europe. ‘Pay TV’ includes utility cable TV services provided through housing associations
Linear and non-Linear Video Consumption
Daily TV viewing time in Europe
Mediametrie 2017 – OTT from Ampere Q1 2017 : average of UK - France – Germany
Increasing complementarity of expanded linear and non-linear viewing experiences
61% of U.S and 33% of European households(2) combine Pay TV and VoD today
3h36
3h53
0h49
Linear(1)
OTT services and devices(1)
23

Investor Day 2017 |
1) 2016: Same scope excludes RR Media contribution – MPEG-4 and HD TV are based on Q1 ‘17 channel count
Enhanced Growth Outlook for European Video
156 million European households
+2% CAGR since 2012, including 30 million IPTV
Stable ARPUT in total Europe even higher
on premium positions (19.2°E/28.2°E), with limited
upcoming renewals
Limited CapEx requirements before 2023
>15% CAGR HD penetration increase since
2013, to 740 HD channels in Q1 ’17
100 100 102 101
2013 2014 2015 2016
Robust Performance and transition to HD
Revenue evolution: 2013 = 100 (at constant FX)
52% 36%
MPEG-4 channels
21%
HDTV channels
29%
(1)
~8 years of remaining contract length
among our top 5 customers
10-12 years typical contract length
24

Investor Day 2017 |
Enhance Video Experience: HD Penetration in Europe
1) Illustrative analysis based on Q1 2017 channel count. Implies following channels/TPE (36 MHz equivalent): SD MPEG2 = 11; SD MPEG4 = 22; HD MPEG4 = 6; UHD HEVC=3
~15-40 TPEs of incremental bandwidth
consumed when:
40-45% of total channels in HD; and
60-70% of channels in MPEG-4
Represents up to 10% of SES’s current satellite
capacity in Europe
Future upside from UHD acceleration offsets
risk from MPEG-2 switch-off: simulcast and/or OTT
30 UHD channels bandwidth requirement equivalent
to 220 SD MPEG-4 channels
1
2
~200 broadcast clients all at different stage:
Upgraded infrastructure and switch to MPEG-4
Over time clients enhance experience and
upgrade to HD -13 35
740 HD channelsQ1 '17
294 channels toMPEG-4
294 channels toHD
1,034 HD channelsat 40%
TPEs for
2,584
channels
Europe at 40% HD penetration
TPEs incremental need assuming flat channel count(1)
+22 European TPEs
TPEs for
2,584
channels
1 2
29%
HDTV channels
40%
52%
MPEG-4 channels
65%
25

Investor Day 2017 |
Prosiebensat.1
26

Investor Day 2017 |
Viasat Scandinavia MTG
27

Investor Day 2017 |
Expand Video Offering and Build Major Presence in the U.S.
Transform Accelerate Globalise
580 TV channels 1,400 Linear TV feeds
50 Channels via OTT
800 Formats
Value chain expansion to match end-to-end requirements
MX1 fully-managed service to using MX1 360 platform
Multi-year agreement for optimised delivery over satellite, fibre and the internet
Content and metadata
management
Playout, VoD and
Catch-up TV
Platform access and
Global CDN services
28

Investor Day 2017 |
Growing reach and revenue
Revenue evolution: 2013 = 100 (at constant FX)
Expanding in Emerging Markets
>90 million International households
+11% CAGR since 2012, of which 55 million DTH
4 new satellites of latest
generation with limited cost per transponder
100
116 120
125
2013 2014 2015 2016
68% 52%
MPEG-4 channels(2)
10%
HDTV channels(2)
14%
~7 years of remaining contract length
among our top 5 customers
5-10 years typical contract length
1) 2016 at same scope (excluding RR Media contribution)
2) Based on Q1 2017 channel count
(1)
29
>10% CAGR SES Channel count increase since
2013, to around 2,900 SD and HD channels in Q1 ’17

Investor Day 2017 |
Emerging Markets Expansion Drivers
SES’s unique track-record to grow and
develop new video neighbourhoods
Reach increasing in fast growing
markets
+4% CAGR(1) channel count from 2016 to
2025, to reach more than 27,000 channels
~8% CAGR(1) HD channel from 2016 to 2026
to reach more than 6,000 channels
1) Source: NSR forecast C and Ku band only
90
46
International channel count
Number
Expanding SES International platforms
Developing Pay TV and FTA platforms
16,233 19,096
21,156
2016 2020 2025
SD HDTV UHD
19,551
27,943 24,057
Middle East and North Africa operated with Yahlive
30

Investor Day 2017 |
Expanding and Stimulating Emerging Ecosystems
Pay TV Free TV Analog TV
Best picture quality
Convenience
Content neighbourhood
Content monetisation
Differentiating features
Reach
100
TV channels
4.3 million
TV Homes
Growing
Advertising
Base
More
TV Homes
More
Channels
Picture
quality
Anytime
VoD
Any device
Premium
Content
Today Q4 2017
Building full ecosystems by partnering with local players since end of 2014
Expanding reach and driving digitalisation and platform evolution
31

Investor Day 2017 |
In less than 10 years SES has developed a leading Pay TV position in Philippines
Involves the three major operators
Expanding Video Offer in Growing Neighbourhoods
SES-7, SES-9
Convenience
Platform neighbourhood
Set for future growth
Differentiating through
exclusive content
Facilitating reach 206 SD TV
channels
2 million
DTH Homes
59 HD TV
channels
32

Investor Day 2017 |
Engaging programmers and manufacturers to build a new backbone distribution platform
End-to-end ecosystem for 25+ MVPDs(1), including Verizon and Frontier
World’s largest linear UHD bouquet with 10 channels:
Innovating the UHD Experience in North America
SES-3 SES-1
With High Dynamic
Range technology
Playout and
Encryption Uplink
1) Multi Channel Video Program Distributors
Potential
reach to all 100 million
U.S. Pay-tv households
Since April 2017, three US cable operators have launched their
first commercial UHD packages
33

Investor Day 2017 |
Innovating to Deliver Best Experience to Any Device, Anytime
End 2016, tailored a solution for the supply of backend services and VoD platforms
Expanded existing satellite contracts, SES now provides a complete end-to-end solution to Turner
Turne r to focus on core business: content and end customer management:
Digitisation (Ingest)
Secure Archiving
Editing, Playout, Satellite
VoD and Catch-up
Reach, Content Delivery
Metadata Management
Europe 19.2° East
70 TV channels:
>120 Countries across Europe, Middle East and Africa in multi languages
34

Investor Day 2017 |
Innovating to Deliver the Best of Both Worlds
35
Enabling innovative business models
A customisable, replicable white-label solution
Easy deployment and integration
Pay-as-you-grow business model
SES-6
Network offloading via satellite and local caching, MX1 cloud services, uplink & space by SES
End-to-end solution for IP-based networks, combining Linear and Non-Linear Video
asilia Pilot successfully performed in late 2016
Cloud remote
content management
Live broadcast and local caching to
local IP networks
35
Investor Day 2017 |
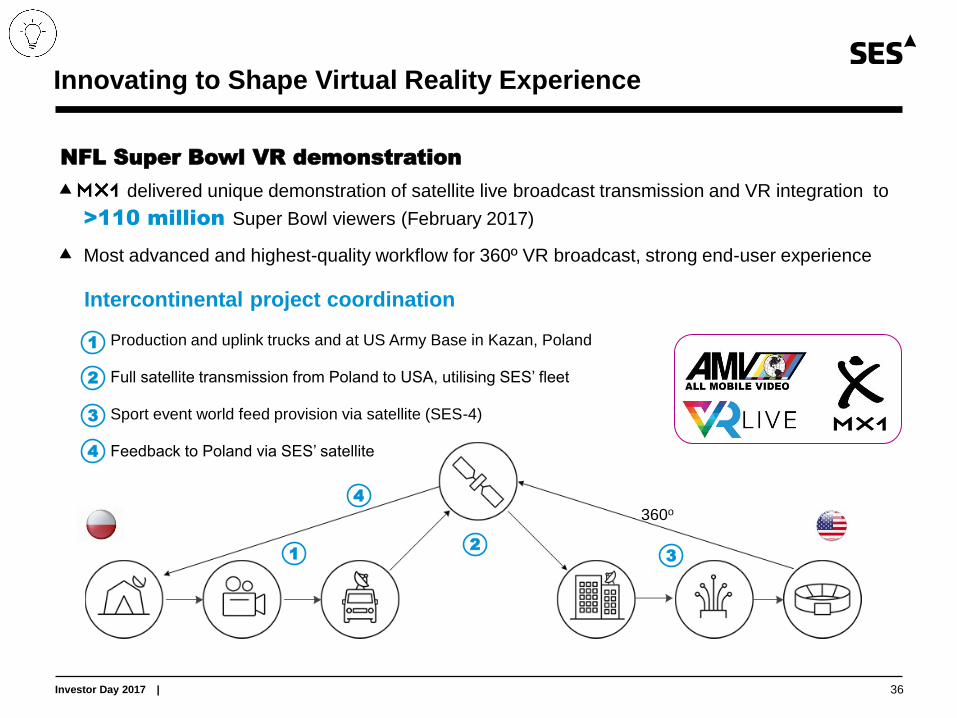
Innovating to Shape Virtual Reality Experience
360o
NFL Super Bowl VR demonstration
MX1 delivered unique demonstration of satellite live broadcast transmission and VR integration to
>110 million Super Bowl viewers (February 2017)
Most advanced and highest-quality workflow for 360º VR broadcast, strong end-user experience
1 2
3
Intercontinental project coordination
Production and uplink trucks and at US Army Base in Kazan, Poland
Full satellite transmission from Poland to USA, utilising SES’ fleet
Sport event world feed provision via satellite (SES-4)
Feedback to Poland via SES’ satellite
4
1
2
3
4
36

Investor Day 2017 |
Hyundai - Virtual Reality experience
37

GROWTH THROUGH ENHANCED CUSTOMER EXPERIENCE
Steve Collar, CEO of SES Networks

Investor Day 2017 |
Add video on Cooks
39
BlueSky 4G in the Cook Islands

Investor Day 2017 | 40
A SNAPSHOT
OF THE BUSINESS
INNOVATION AND
THE FUTURE
DELIVERING
GROWTH ACROSS
MARKET VERTICALS
1 2 3

Investor Day 2017 |
SES Networks at a Glance
41
Unique global GEO-MEO
distributed network/architecture
>300 enterprise customers,
including major tier one global clients
Our IFC/IFC partners serve ~90%
of total connected aircraft market
62 global government clients
served in 28 countries
99.99% measured service
availability (benchmark: 99.97%)
Up to 2 Gbps per MEO beam
with low latency (<150 ms)
>One million cruise
passengers served each year
13 U.S. Government agencies
served by dedicated Government team
Investor Day 2017 |
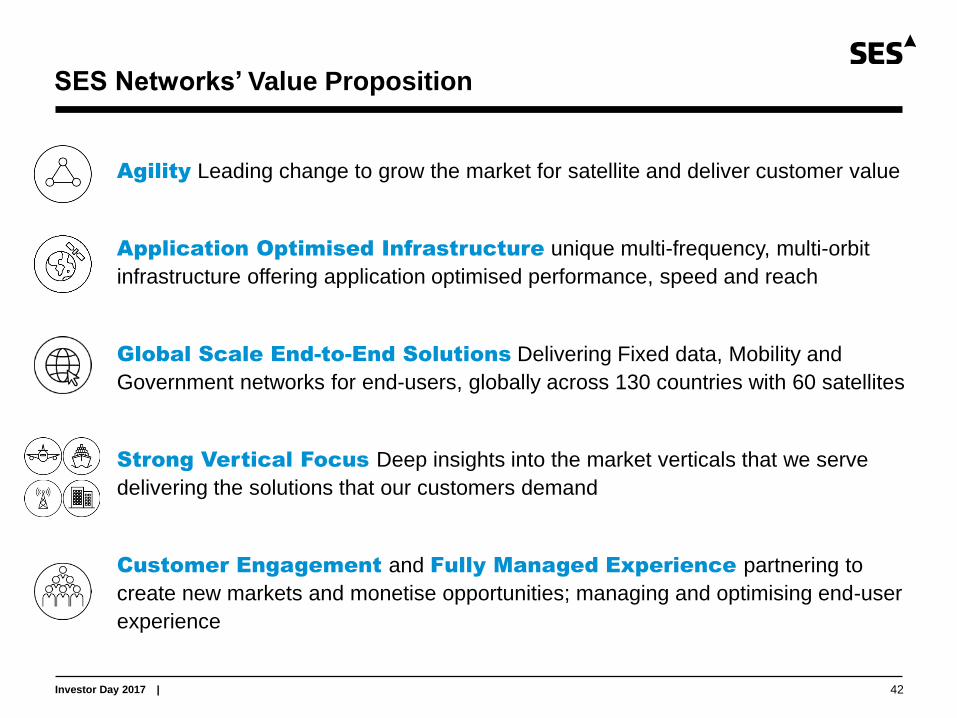
SES Networks’ Value Proposition
42
Agility Leading change to grow the market for satellite and deliver customer value
Application Optimised Infrastructure unique multi-frequency, multi-orbit
infrastructure offering application optimised performance, speed and reach
Global Scale End-to-End Solutions Delivering Fixed data, Mobility and
Government networks for end-users, globally across 130 countries with 60 satellites
Strong Vertical Focus Deep insights into the market verticals that we serve
delivering the solutions that our customers demand
Customer Engagement and Fully Managed Experience partnering to
create new markets and monetise opportunities; managing and optimising end-user
experience
Investor Day 2017 |
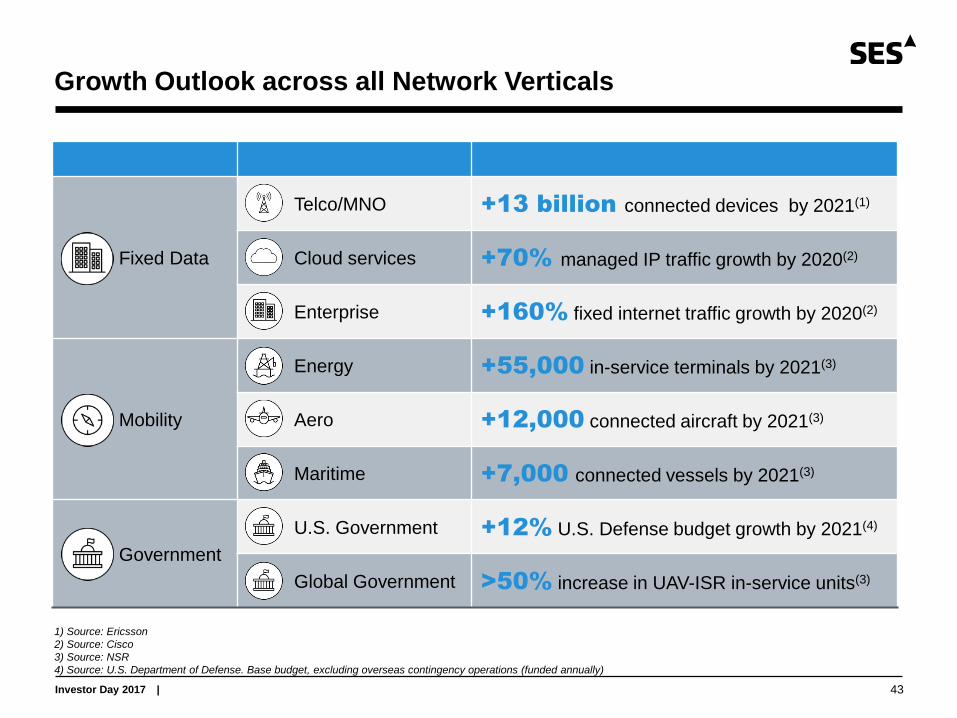
Growth Outlook across all Network Verticals
43
Fixed Data
Telco/MNO +13 billion connected devices by 2021(1)
Cloud services +70% managed IP traffic growth by 2020(2)
Enterprise +160% fixed internet traffic growth by 2020(2)
Mobility
Energy +55,000 in-service terminals by 2021(3)
Aero +12,000 connected aircraft by 2021(3)
Maritime +7,000 connected vessels by 2021(3)
Government
U.S. Government +12% U.S. Defense budget growth by 2021(4)
Global Government >50% increase in UAV-ISR in-service units(3)
1) Source: Ericsson
2) Source: Cisco
3) Source: NSR
4) Source: U.S. Department of Defense. Base budget, excluding overseas contingency operations (funded annually)
Investor Day 2017 |
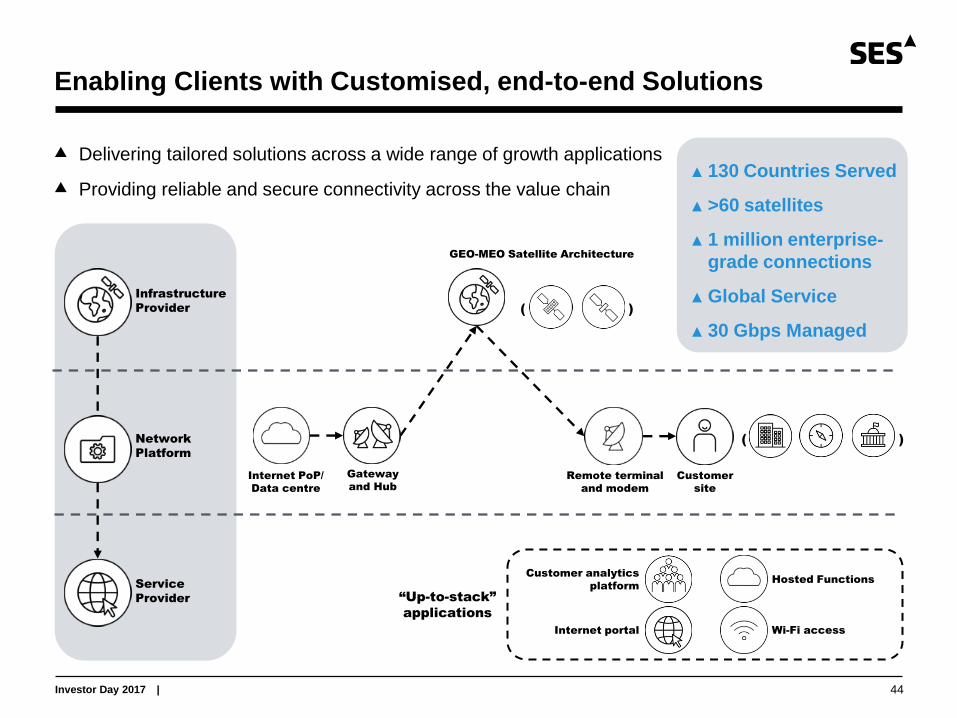
Enabling Clients with Customised, end-to-end Solutions
44
Delivering tailored solutions across a wide range of growth applications
Providing reliable and secure connectivity across the value chain
Infrastructure
Provider
Network
Platform
Service
Provider
( )
Internet PoP/
Data centre
Gateway
and Hub
Remote terminal
and modem
Customer
site
Hosted Functions
Wi-Fi access
Customer analytics
platform
Internet portal
“Up-to-stack”
applications
( )
GEO-MEO Satellite Architecture
▲ 130 Countries Served
▲ >60 satellites
▲ 1 million enterprise-
grade connections
▲ Global Service
▲ 30 Gbps Managed

Investor Day 2017 |
Pt. Moresby
2,065 Mbps
Lae
700 Mbps Mt. Hagan
360 Mbps
Kuinga
30 Mbps
Enabling 4G With Major Telcos – Explosion of Data Demand
45
Largest Telco / MNO in Pacific demanding network solutions, instead of just satellite capacity
Delivering high performance, cost-effective solutions in 4 major population centres in PNG
Enabling >2x increase in 3G subscribers nationwide and new business in mining sector
Supporting >40,000 LTE subscribers
2014 2017
Digicel MEO bandwidth
Gbps
>10x
Papua New Guinea
Population: >7 million

Investor Day 2017 |
Connecting Africa - One Story at a Time
46
Connected in 2014
5x increase in Bandwidth
1 Gbps Fully Protected
7 high capacity sites, 3 territories
Mobile broadband 3G-4G
Overcoming tyranny of distance
Political stability, surging demand
> 1.5 Gbps delivered in 1 year
Economic and Social
Development
8 Peace Keeping Sites connected
Changing the face of response
Juba Mogadishu
N’Djamena Entebbe

Investor Day 2017 |
Delivering Core Infrastructure supporting Nation Building
47
Turnkey, fully managed hybrid (satellite and terrestrial) network in Burkina Faso
Expanding ICT infrastructure, capabilities and performance across the country
Internet Point of
Presence (PoP)
SES Networks
teleport
(Portugal)
MEO capacity
Population: >18 million(1)
1) Source: World Bank
>100 base stations >880 connected sites >40 connected institutions >60 PTP links
Credit: Google Map

Investor Day 2017 | 48
: providing a complete solution that brings internet services to Sub-Saharan Africa
Expanding future capabilities with flexible and scalable SES GEO and O3b MEO HTS solutions
Infrastructure
provider
Network platform Service
provider
99.5% service availability ASTRA 1G, ASTRA 3B, ASTRA 4A
and Gilat’s X-Architecture platform
Optimised network platform
aggregating throughput requirements
through single SES teleport
Tailored data centre services
and service implementation with
range of integrated features
Expanding Turnkey Solutions for Global Cloud-based Services

Investor Day 2017 |
Connecting the Unconnected - A Force for Good
7 high capacity sites, 3 territories
Mobile broadband – 3G-4G
Overcoming tyranny of distance
49

Investor Day 2017 |
Response + Performance = Impact
50

Investor Day 2017 | 51
Project Loon

Investor Day 2017 | 52
Strategically Positioned With all IFC/IFE Service Providers
Commercial Aero Backlog
Around USD 1 billion
Satellites Accessed
>20
Airlines Served
>15
Service provider served
▲ SES Networks has been extremely successful to date in
driving the growth in aero-mobility through investment in
dedicated and specialised payloads, capitalising ahead of
the competition
▲ Around USD one billion in secured backlog with all four of
the leading IFC/IFE service providers
▲ Substantial opportunities in the aeronautical segment remain
with aircraft penetration rate increasing from ~25% today to
>60% by 2026

Investor Day 2017 |
Panasonic testimonial
ENABLING NEXT GENERATION
INFLIGHT CONNECTIVITY AND
ENTERTAINMENT
Covering 99.8% of all commercial flight hours
Delivering an entertainment experience to >500 million
passengers every year
Global connectivity network, including optimised HTS
payloads, ensuring ubiquitous coverage
‘Home-equivalent’ connectivity experience
Enabling 95% of Lufthansa passengers to watch live-
stream of World Cup Finals and Super Bowl
53

SES Proprietary and Confidential | 54
Panasonic

Investor Day 2017 |
Enhancing Passenger Experiences Through Partnerships
55
Developing smart IFC/IFE solution for using five key principles:
1
5
2
3
4
Collaborative
processes
▲ Working closely with Thales to design HTS satellite to support
delivery of FlytLIVE inflight connectivity and streaming services
Tailored
coverage
▲ Designing HTS payload specifically for aero mobility throughout the
Americas to fully meet Thales’ service requirements
Customised
service
▲ Providing specialised service packages
Diverse fleet
options
▲ Enabling roll-out of services in 2017 using existing network
Open
architecture
▲ Driving collaboration and innovation at every level
Total commitment represents significant share of expected investment in SES-17

Investor Day 2017 |
AN INNOVATORS DREAM – CRUISE
Unrivalled connectivity > 1 Gbps to a single cruise ship
Benefitting more than 1 million passengers a year
Fully integrated service offering
Benefitting leading cruise lines globally
FIT FOR PURPOSE – MERCHANT
Fully managed Maritime+ service, highest reliability
Benefitting critical communications workers at sea
Launch of volume-based service offering driving adoption
Network of Channel Partners guarantee global service level
A DIFFERIENTIATED INNOVATOR
Expanding leadership in the maritime growth markets of Caribbean & Asia
56

Investor Day 2017 | 57
Delivering Turnkey Solutions to U.S. Army through TROJAN
▲ SES GS’s TROJAN program is a managed service that meets mission critical U.S. Army
Intelligence and Security Command (INSCOM) requirements:
• Global, multi-band, end-to-end managed services
• Meeting Service Level Agreement
• Self-healing terrestrial network provides access to Army intelligence units
• Centralised network management in SES GS’s secure NOC
• Customised monitoring and control, as well as bandwidth management tools
SES Global MPLS Network
Ku-band
Teleport
Government
PoP
SES PoP
Teleport
SES PoP
Teleport
SES PoP
Government
PoP
Teleport
SES PoP
Teleport
SES PoP
Teleport
SES PoP
C-band

Investor Day 2017 | 58
Customer’s USG
Point of
Presence (PoP)
SES Gateway
(Nemea)
MEO capacity
2 sites
in Iraq
SES GS
Network Ops
Centre
▲ SES Government Solutions has delivered two turnkey, mission-critical high-performance traffic
nodes in Iraq delivering services to two different customers
▲ New capability enabling high speed backhaul and supporting latency sensitive applications
▲ End-to-end managed services delivered including leased remote terminals with ‘on-site’ service
support and 24 x 7 secure NOC with terrestrial backhaul to U.S. DOD PoP
▲ Understanding the mission and shaping requirements is fundamental to shared success
Differentiated Service Offering for U.S. Central Command

Investor Day 2017 |
Global Government – A Long Term Growth Driver
59
secured long-term contract for end-to-end service
Alliance Ground Surveillance (AGS) Five Global Hawk remotely
piloted aircraft
Equipped with ‘state of the
art’ radar technology
Contributing to a range of
civilian/defence missions
Acquired by 15 countries
(including Luxembourg)
Commercial
satellite
capacity
Capacity management
support for command &
control
Data communications
between UAVs and
ground segment

Investor Day 2017 |
Innovating Network Capabilities to Expand Growth Potential
60
Small towns and remote locations
Remote offices
Data centres
Cloud access
Smaller mobile production vessels
Smaller cruise ships
Large yachts
Inter-regional commercial ships
Commercial aircraft
VIP aircraft
Multiple units in theatre
5x
Cu
rren
t M
EO
Small cities / towns
Large multi-national organisations
Fixed rigs/larger production vessels
Large cruise ships
Larger fixed/mobile installations
Next
Gen
era
tio
n M
EO
Expanding MEO addressable market

Investor Day 2017 | 61
STATE OF THE ART
Ultra-HTS - performance to support all applications
Total flexibility in assignment of power, bandwidth, location
Prime real estate – the best orbit with perfected spectrum
A network that scales with the market
State-of-the art performance with simple, proven operation
STEP CHANGE IN NETWORK SERVICE
Massive, distributed network serving small dishes
Serving land, air and sea, in motion or stationary
‘From where you are to where you want to be’
Responsive to ‘elastic’ demand – delivering experience
FUTURE OF THE NETWORK
Ubiquitous, broadband customer experience in all verticals and markets

Investor Day 2017 |
Unlocking the Value in our Customers’ Networks
62
customer experience
accelerate time to revenue
expand addressable market
improve staff productivity
improve cap-ex investments
improve profitability
enhance network security
de-risk change
service delivery excellence
maximise subsidies
government compliance
eco-friendly
TOP LINE GROWTH BOTTOM LINE IMPROVEMENT
CORPORATE RESPONSIBILITY OPERATIONAL EXCELLENCE

Investor Day 2017 | 63
A STRONG
GROWTH OUTLOOK
ACROSS OUR
MARKETS
CONTINUAL
INNOVATION FOR
LONG-TERM
SUCCESS
DIFFERENTIATED
VALUE FOR OUR
CUSTOMERS AND
PARTNERS
1 2 3

INNOVATING SES’S TECHNOLOGY SOLUTIONS
Martin Halliwell, Chief Technology Officer

Investor Day 2017 |
Expanding flexibility and scalability of SES’s global network and capabilities
Delivering optimal end-to-end solutions by technology innovation across the value chain
Strong track record of enhancing SES’s economics
Innovating SES’s Technology Solutions
65

Investor Day 2017 |
Expanding Flexibility with Digital Processing
Full digital
processing
Significant flexibility enhancement
Improved mass efficiency
Several hundred low noise amplifiers and frequency converters
Hundreds of input and output filters and RF switches
Difficult and costly production process
Today – Traditional payloads architecture
Tomorrow – Fully Digitised Satellite Payload
Software defined payloads
Real time resource management
Dynamic bandwidth and coverage allocation
Optimisation of scarce spectrum resources
Cost reduction and payload production acceleration
Flexibility
Scalability
Technology evolution
Improved economics
66

Investor Day 2017 |
Spot Beams and Digital Processing Expand SES’s Capabilities
Infrastructure
provision
Customised market coverage
Distributed network
SES-15 (129°W)
Up to 10 GHz HTS
SES-12 (95°E)
Up to 14 GHz HTS SES-17 (67°W)
SES-14 (47.5/48°W)
Up to 12 GHz HTS
SES-12, SES-14, SES-15 and SES-17 HTS spot beam footprints augmenting MEO HTS capabilities
1
Spot beams
2
Digital processing
laying down high volume
of capacity globally
optimally allocating
capacity to key areas
On-orbit capability to pivot from one market opportunity to another
Flexibility
Scalability
Technology evolution
Improved economics
67

Investor Day 2017 |
Photos: SES-10 launch (credit Space-X)
Boeing
68

Investor Day 2017 |
Re-usable
rockets
Increased availability
Payload diversity
Reduced cost
Reduced Cost and Time to Market with Reusable Rockets
Photos: SES-10 launch (credit Space-X)
Flexibility
Scalability
Technology evolution
Improved economics
69

Investor Day 2017 |
SpaceX
70

Investor Day 2017 |
Innovation Across the Value Chain - “GEONext” (1/2)
GEO/MEONext
Programming of beams
Standardised payloads
Fleet flexibility
Beams programmed in orbit per application
• Beam forming of legacy, regional video or very
small data beams
• Real time capacity allocation
Standardised “movable” satellite payloads
• Industrial production line integration
• Highly integrated band-specific satellites
programmable to serve DTH, HTS or a
combination
• Satellites deployable at different orbit locations
Scalability at the level of the fleet
• Co-location of multiple small satellites for quick
capacity augmentation
Flexibility
Scalability
Technology evolution
Improved economics
71

Investor Day 2017 |
-8.00 -6.00 -4.00 -2.00 0.00 2.00 4.00 6.00
0.00
2.00
4.00
6.00
8.00
10.00
1 2
3 4 5 6
7 8 9 10 11 12
13 14 15 16 17 18 19 20
21 22 23 24 25 26 27 28 29 30
31 32 33 34 35 36 37 38 39 40 41 42
43 44 45 46 47 48 49 50 51 52 53 54 55
56 57 58 59 60 61 62 63 64 65 66 67 68
69 70 71 72 73 74 75 76 77 78 79 80 81
82 83 84 85 86 87 88 89 90 91 92 93
94 95 96 97 98 99 100 101 102 103
104 105 106 107 108 109 110 111
112 113 114 115 116 117
118 119 120 121
122 123
22
22
22
2222
24
2424
24
24
26
26
26
26
28
28
28
28
30
3030 30
30
30
30
3232.95
CVT
Innovation Across the Value Chain - “GEONext” (2/2)
General purpose satellite GEO/MEONext
Flexibility
Scalability
Technology evolution
Improved economics
72

Investor Day 2017 |
Innovation Across the Value Chain - “MEONext”
Sample operational coverage of a “MEONext” solution – Capability to change coverage in real
time part of design
General purpose satellite GEO/MEONext
Flexibility
Scalability
Technology evolution
Improved economics
73

Investor Day 2017 |
Innovation Across the Value Chain - Extending Satellite Life
SES and MDA entered into a partnership agreement for the first commercial refuelling of a GEO
satellite in 2020+
Source: MDA
Robotic Servicing Vehicle
SES Satellite
Robotic Servicing Vehicle
General purpose satellite GEO/MEONext
Flexibility
Scalability
Technology evolution
Improved economics
74

Investor Day 2017 |
Space and Ground Infrastructure Expand SES’s Capabilities
Global service
provision
Multi purpose infrastructure
Cost efficiency
66 Teleports and 28 points of presence, including …
Flexibility: Customer connects anywhere Presence: Licenses to operate almost all over the world
Flexibility
Scalability
Technology evolution
Improved economics
75

Investor Day 2017 |
Ground Ecosystem Driving Integrated Network Management
Ground
Ecosystem
Competitive customer equipment
Focus on flat panel antenna Flexibility for steerability
Smaller in size
Quick setup
Lower cost / Mbps
Serve multiple applications
Unlock new applications
Enable seamless allocation of resources
Flexibility
Scalability
Technology evolution
Improved economics
76

Investor Day 2017 |
Open Architecture Provides Interoperability
Open
Architecture
Multi modal delivery
Interoperability
Multi modal delivery and interoperability
Flexibility
Scalability
Technology evolution
Improved economics
5G ubiquitous access
Hybrid video capabilities
Integrated GEO/MEO network
77

Investor Day 2017 |
VIDEO
NETWORKS
Innovation Drives Managed Solutions for Video and Networks
Managed
Solutions
Video
Virtual Networks
Multi-layer multi-band satellites to enable managed solutions
Unified resource
management capabilities
Integrated ground segment
design
End-to-end network
management
Flexibility
Scalability
Technology evolution
Improved economics
78

Investor Day 2017 |
Strong Track Record of Enhancing SES’s CapEx Efficiency
Cost efficiency Technological evolution and
customised solutions
Continuous cost reduction for shaped beams, accelerated for spot beams
Shaped missions:
Satellite + Launch costs(1) per MHz per Year
HTS missions:
Satellite + Launch costs(1) per MHz per Year
Cost per MHz per year
-25%
0
+25%
2001 2003 2005 2007 2009 2011 2013 2015 2017 2014 2015 2016 2017
1) Cost refers to the average amounts contracted with the satellite manufacturer and launch services provider i.e. excludes insurance, ground, project management, capitalized
interests; Capacity refers to the predicted active MHz at EOL (End Of Life); Years are the date of contract placed with satellite manufacturer
-50%
0
Cost per MHz per year
Flexibility
Scalability
Technology evolution
Improved economics
79

Investor Day 2017 |
Electrical
propulsion
Continued CapEx Efficiency Supporting Competitiveness
Economies
of scale Improved satellite efficiency enables five less primary satellites
Procurement
and design
Project control and close partnership with manufacturers
Full digital
processing
20% Normalised CapEx reduction
Around EUR 100 million of further reduction on a like for like basis
Satellite life
extension
Flexibility
Scalability
Technology
evolution
Improved
economics
Re-usable
rockets
Improved mass efficiency
More launcher options
Reduced cost
Shorter time to space
Operational expertise
Improved monetisation
Improved mass efficiency
Flexibility enhancement
25% already
identified
Achieved
2014 - 2017
2018 - 2022
80

Investor Day 2017 |
Five GEO and eight MEO satellites under procurement with enhanced capabilities
SES-11 SES-12 SES-14 SES- 16/
GovSat(1)
O3b
Block-3(2) SES-17 GEO/MEO-
Next
Shaped HTS +
Shaped
HTS +
Shaped
Steerable spot
beams HTS HTS
General
payload
No Yes Yes No No Yes Yes
Chemical Electric Electric Chemical Chemical Electric Electric
Falcon 9 Ariane 5 Falcon 9 Falcon 9 Soyuz TBD TBD
Advancing Space Capabilities Through Innovation
1) Procured by LuxGovSat
2) Satellites 13-16 scheduled for launch in Q1 2018 and satellites 17-20 in Q4 2019
H1 2017 H2 2017 2018 /‘19 2020/+
Payload
type
Digital
processing
Satellite
Propulsion
Launch
Vehicle
81
APPLYING FINANCIAL FRAMEWORK TO
DRIVE PROFITBALE GROWTH
Padraig McCarthy, Chief Financial Officer
Investor Day 2017 |
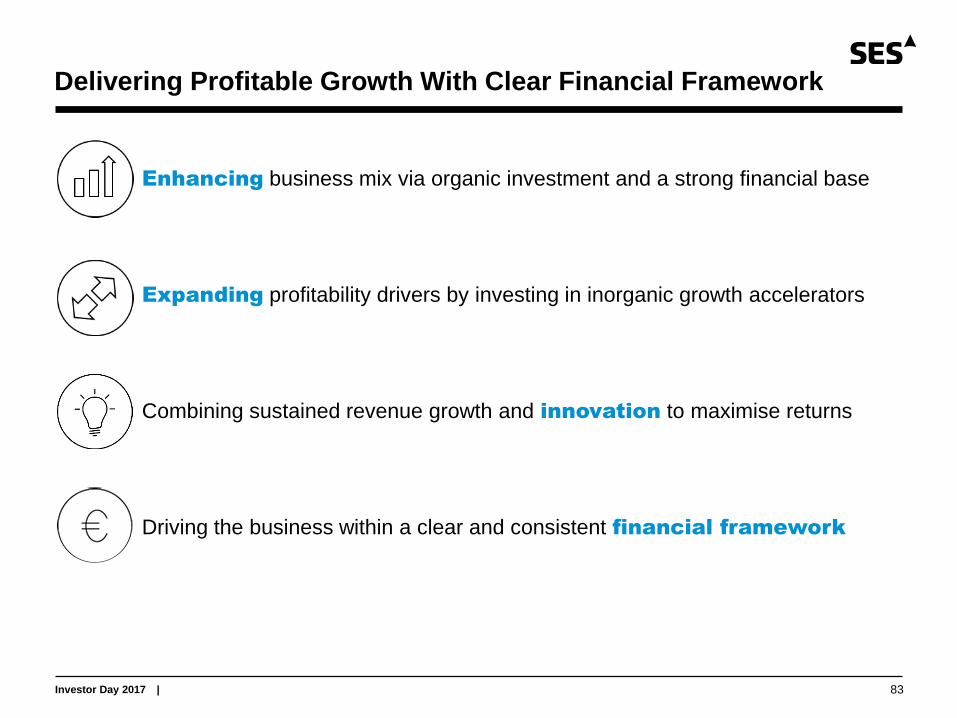
Delivering Profitable Growth With Clear Financial Framework
83
Enhancing business mix via organic investment and a strong financial base
Expanding profitability drivers by investing in inorganic growth accelerators
Combining sustained revenue growth and innovation to maximise returns
Driving the business within a clear and consistent financial framework

Investor Day 2017 |
Enhancing Profitability Through Globalisation
84
Delivering strong growth in
International markets and
Europe (digital)
North America impacted by
U.S. Government budget
sequester, now stabilising
Improving profitability while
expanding globally and across
the value chain
Group revenue by region (at same scope)
EUR million (at constant FX)
Globalisation Verticalisation Innovation
73.7% 71.8%
EBITDA margin
40.7%
Operating Profit margin
44.2%
+2% CAGR (Digital: +5%)
-2% CAGR
+6% CAGR
2007 2016
Europe North America International
28%
20%
53%
52%
19%
28% +2% CAGR (Digital: +4%)
Investor Day 2017 |
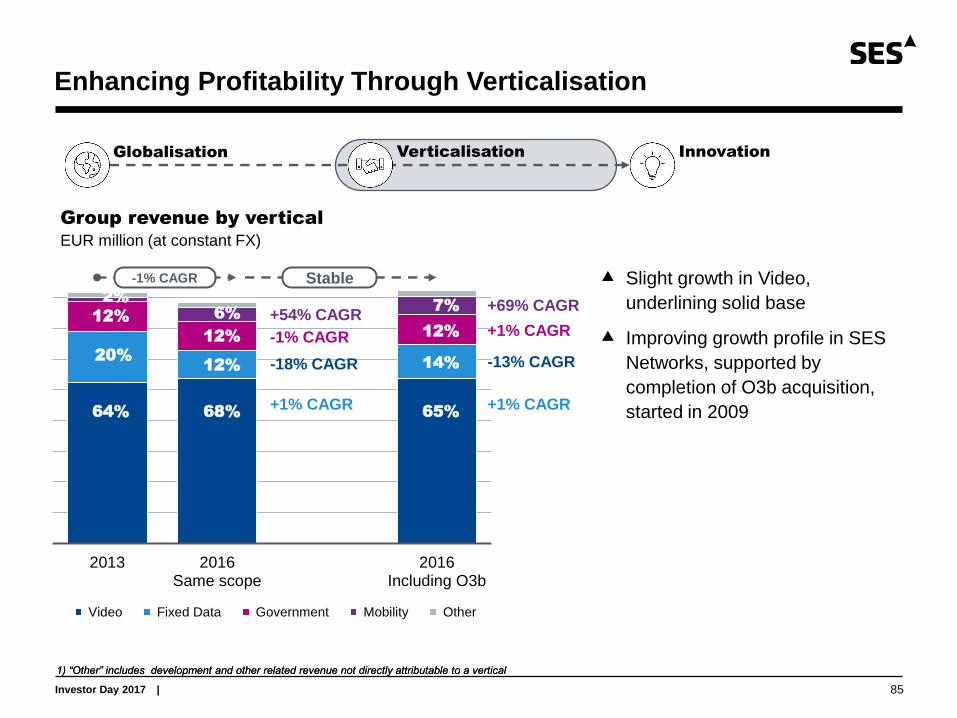
Enhancing Profitability Through Verticalisation
85
1) “Other” includes development and other related revenue not directly attributable to a vertical
Globalisation Verticalisation Innovation
Group revenue by vertical
EUR million (at constant FX)
2013 2016Same scope
2016Including O3b
Video Fixed Data Government Mobility Other
Slight growth in Video,
underlining solid base
Improving growth profile in SES
Networks, supported by
completion of O3b acquisition,
started in 2009
1) “Other” includes development and other related revenue not directly attributable to a vertical
20% 12%
64% 68%
12%
12%
6%
+1% CAGR
-18% CAGR
-1% CAGR
+54% CAGR
-1% CAGR
2%
+1% CAGR
-13% CAGR
+1% CAGR
+69% CAGR
Stable
14%
65%
12%
7%

Investor Day 2017 | 86
Enhancing Profitability Through Innovation
Globalisation Verticalisation Innovation
SES’s normalised CapEx (at same scope)(1)
EUR million
60 60
540 435
(70)
(35)
2014 Economies of scale Economies of design 2017
Non-satellite Satellite
1) Represents normalised satellite CapEx to replace current, active fleet plus satellites under construction plus non-satellite CapEx; same scope does not include HTS payloads
on SES-12/-14 /-15, SES-16/GovSat and SES-17
Achieving target of 20% reduction in normalised satellite CapEx one year ahead of schedule
14% reduction in number of
satellites from 37 to 32 7% reduction in cost per
satellite to EUR 204 million
(2014: EUR 220 million) 600
495

Investor Day 2017 |
Improving Returns Through Strategy Execution
87
Globalisation Verticalisation Innovation
2007 2016
Revenue EUR 1,662 million EUR 1,965 million
Operating profit margin 40.7% 44.2%
Effective tax rate 16.2% 15.0%
Net operating profit after tax EUR 574 million EUR 737 million
RoIC 8.2% 9.3%
+2%
CAGR
+350
bps
+3%
CAGR
+110
bps
-120
bps
1) Net operating profit after tax (NOPAT) divided by average of opening and closing net equity plus net debt
2) Excluding ND Satcom in 2007 and the impact of consolidation of RR Media and O3b in 2016; 2016 Like-for-Like RoIC at 6.5%
Return on Invested Capital (RoIC)(1)
(at same scope)(2)
at constant FX

Investor Day 2017 |
Applying Consistent Use of Cash Approach
88
Use of cash approach 2007-2016
1. Fund replacement and
committed growth pipeline
▲ EUR 6.9 billion re-invested, expanding
globally and profitably
2. Maintain progressive dividend
per share policy
▲ EUR 3.7 billion returned to shareholders
through annual and growing dividend
3. Invest in additional growth
accelerators
▲ EUR 1.3 billion invested(1), adding scale and
differentiated capabilities
4. Optimise leverage and cost of
capital
▲ EUR 2.1 billion of share buy-backs
▲ Net debt to EBITDA managed below 3.3x
▲ Reduced interest cost from 4.9% to 3.9%
1) Excluding USD 1.4 billion of O3b debt, refinanced in 2016

Investor Day 2017 | 89
Expanding Growth Drivers Across Value Chain: RR Media/MX1
Delivering value-added, turnkey solutions
• Creating world-leading media services
provider with Merger of SES PS + RR Media
• MX1 non-European revenue increased
from 3% in 2010 to around 30% in 2016
Enhancing Video services growth and
profitability through differentiation(2)
• “Pull- through” revenue of EUR 70 million
representing a CAGR of 15% since 2010
• EBITDA margin of 40-50% before internal
transponder costs(3)
• Video services’ return on invested capital
improved from 5% in 2010 to 19% in
2016, benefiting from low CapEx
requirement and was accretive to SES
group RoIC
Video services revenue
EUR million (2016 like for like(1))
1) Assuming RR Media had been consolidated from 1 January 2016
2) At same scope including SES PS and HD+; RR Media will be included with the first full year of consolidated operations and integration into MX1
3) MX1 Video services margin before paying full market rates for infrastructure capacity
Around
EUR 370 million of
annual revenue

Investor Day 2017 |
Expanding Growth Drivers With Unique Solutions: O3b
90
O3b revenue development
USD million
Unique combination of performance and economics driving 90% revenue growth (YoY)
Scaling up existing clients, of which ~70% have upgraded from initial bandwidth requirements
Validating clear business and financial rationale for accelerated acquisition of 100%
2015 2016
57
109
+90%
60%
35%
5% 51%
30%
18%
1%
O3b revenue and growth by vertical
USD million
2015 2016
+66%
+66%
>5x
Fixed data Mobility Government
109
57
Other
Growth

Investor Day 2017 |
Delivering Significant Synergies From Consolidation of O3b
91
Already achieved ~85% of 2019 synergies,
driven by financial synergies (refinancing of O3b
debt) and augmented by commercial, product
development and operational synergies
40
60 60 65
3
3 7
12
5
5 5
5
5
5
14
24
2017(at Q1 '16)
2017(at Q4 '16)
2019 2021
Financial Operational
Product development Commercial
Synergies from O3b consolidation
EUR million
~95% ~85% ~70%
Total synergies
achieved to date
73
86
106
53
1) EPS accretion from total synergies (based on P/E ratio of 15x)
2) Excluding gain of EUR 495.2 million on deemed disposal of O3b equity interest following SES’s acquisition of remaining O3b shares (completed 1 August 2016)
Synergies enhancing overall earnings accretion of O3b transaction by 2018
0.16
0.19
0.23
2017 2019 2021
EPS impact(1)
EUR
+37%
▲ Benefit equivalent to 18% of SES 2016
EPS(2)

Investor Day 2017 |
Well Placed to Grow Future Return on Invested Capital
92
Generating sustained revenue growth
Maximising profitability through operational cost and CapEx efficiencies
Optimising leverage and cost of capital
Improving return on invested capital over the medium-term
1
2
3

Investor Day 2017 | 93
Underpinning Growth Profile With Substantial Contract Backlog
Fully protected contract backlog
EUR billion
7.5 7.3 7.4 7.7
7.4
0.4 0.4
2013 2014 2015 2016 Q1 2017
Of which:
▲ Video: 73%
▲ Fixed Data: 7%
▲ Mobility: 15%
▲ Government: 5%
Same scope
Accelerators
High visibility from weighted average contract length
~8 years
Robust and stable contract backlog at same scope, to record level with accelerators
8.1 7.8
Years of revenue sustained
~4 years ~4 years
1) At same scope; at around seven years when including RR Media and O3b on an annualised base
~8 years(1)

Investor Day 2017 |
Like for like(1) 2016 revenue (EUR million) % of 2016 revenue Outlook for 2017
Video 1,449.1 67% Stable to slight growth
Fixed Data 275.1 13% Returning to growth
Mobility 150.4 7% Strong growth
Government 245.4 11% Stable to slight growth
Other 48.4 2% EUR 5 - 10 million
Total 2,168.4
Re-affirming 2017 Revenue Outlook
94
Expecting revenue development in the verticals to be progressive over the course of 2017
Lower ‘Other’ likely to impact full year growth by around 2%, commencing in Q2 2017 and
normalising from 2018 onwards
USD-denominated revenue represents around 50% of 2016 like for like group revenue
1) Assuming RR Media had been consolidated from 1 January 2016

Investor Day 2017 |
Delivering Sustained Growth With Differentiated Investments
95
Satellite(s)(1) Target
Verticals
Launch
Date
Operational
Service Date
Transponder
Equivalents(2)
Annualised Revenue
(‘steady-state’)(3)
GEO wide beam
SES-9 4-Mar-16 June ’16 53
SES-10 30-Mar-17 May ’17 27
SES-15 18-May-17 End ‘17 16
SES-12 Q4 2017 Launch +6 mths 8
SES-14 Q1 2018 Launch +6 mths 8
SES-16/GovSat-1 Q4 2017 Launch +2 mths 68
GEO HTS
SES-15 (10 GHz) 18-May-17 Launch +6 mths 69
SES-12 (14 GHz) Q4 2017 Launch +6 mths 97
SES-14 (12 GHz) Q1 2018 Launch +6 mths 83
MEO HTS
Satellites 1-12
(9 operational) 2014 / 2015 n/a
Satellites 13-16 Q1 2018 Launch +2 mths n/a
Satellites 17-20 Q4 2019 Launch +2 mths n/a
Revenue from investments launched by end 2019 EUR 650 - 750 million
1) SES-11 is not included as being a replacement satellite for AMC-15 and -16 (Launch date: Q3 2017)
2) 36 MHz equivalent. For GEO HTS, assumes that four HTS TPEs are equal to one wide beam data TPE (“rule of four”)
3) Annualised revenue at around 75% utilisation for GEO; and ‘steady-state’ utilisation for MEO (based on constellation of 17 operational satellites); EURUSD @ 1.10
Significant annualised revenue contribution, of which more than 30% already contracted
Plus additional growth from SES-17 (from 2020) and future GEO-MEO growth investments
EUR 100 - 125 million
EUR 150 - 175 million
EUR 400 - 450 million

Investor Day 2017 | 96
Consistently Generating Operating Cost Efficiencies
Group operating expenses
EUR million (at constant FX)
383 376 344 347
166 173 176 170
2013 2014 2015 2016 (Same scope)
Fixed costs Variable costs
Total OpEx reduced by 2% CAGR through efficiencies and economies of scale
Fixed costs continuously optimised with 3% CAGR reduction, with 2016 being 91% of 2013 base
-3% CAGR
+1% CAGR
-2% CAGR
549 549 520 517

Investor Day 2017 | 97
0%
20%
40%
2010 2011 2012 2013 2014 2015 2016
FCF before financing and acquisitions CapEx
640
320
190 150
40
60
60
60 60
60
110
180 300 340
510
2017 2018 2019 2020 2021
Committed satellite Committed non-satellite Estimated uncommitted
CapEx Cycle and Efficiencies a Key Driver of Free Cash Flow
Free cash flow and CapEx development
As a % of group revenue (at same scope)
Future GEO-MEO Capital Expenditure
EUR million (replacement and growth)
15%
46% 810
28%
1) Net operating cash flow divided by EBITDA
560 550 550 610
FCF supported by strong cash conversion rate(1) of 85-90% and improves as CapEx cycle reduces
Around 50% of 2017-2021 CapEx schedule uncommitted
33%

Investor Day 2017 | 98
Generating Further Important CapEx Efficiencies
Normalised CapEx(1)
EUR million
495
655
555 40
~(100) 120 (MEO HTS)
2017Same scope
Scope change 2017 includingscope change
Target savings 2022 Target
Reducing normalised CapEx/sales ratio from ~40% (2005-2012) to 20-25% (2018-2022)
Design life extension introduced with gain of 0.8 years on GEO fleet (from 15 to 15.8 years)
Future GEO-MEO synergies
GEO HTS payloads and
SES-16/GovSat-1
Of which, ~25%
already identified
(e.g. through all-electric
propulsion, re-usable
rockets, operational life
extension)
1) Excluding SES-17 (expected to be launched in 2020), which represents an additional scope change
2) Current total normalised CapEx comprising satellite and non-satellite CapEx at same scope
3) EUR 100 million target saving based on mid-point of satellite CapEx reduction by 15% to 20% from EUR 595 million to EUR 495 million
(2)
(3)
Investor Day 2017 | 99
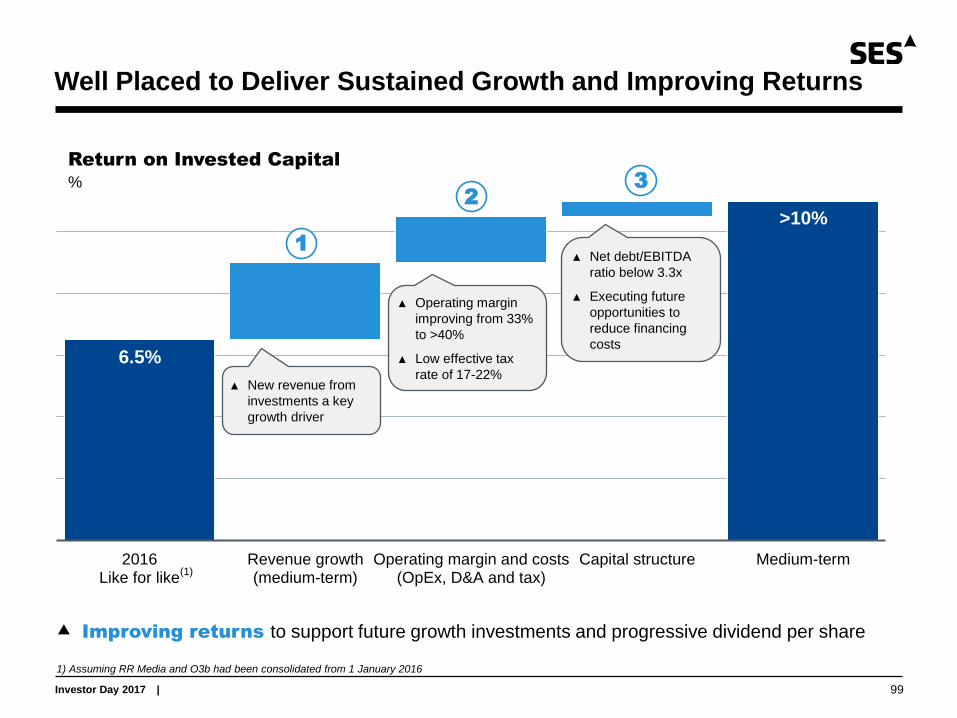
Well Placed to Deliver Sustained Growth and Improving Returns
Return on Invested Capital
%
6.5%
>10%
2016Like for like
Revenue growth(medium-term)
Operating margin and costs(OpEx, D&A and tax)
Capital structure Medium-term
Improving returns to support future growth investments and progressive dividend per share
▲ New revenue from
investments a key
growth driver
▲ Operating margin
improving from 33%
to >40%
▲ Low effective tax
rate of 17-22%
▲ Net debt/EBITDA
ratio below 3.3x
▲ Executing future
opportunities to
reduce financing
costs
1) Assuming RR Media and O3b had been consolidated from 1 January 2016
1
2
3
(1)

Investor Day 2017 |
Disclaimer
100
This presentation does not, in any jurisdiction, including without limitation in the U.S., constitute or form part of, and should not be construed as,
any offer for sale of, or solicitation of any offer to buy, or any investment advice in connection with, any securities of SES, nor should it or any
part of it form the basis of, or be relied on in connection with, any contract or commitment whatsoever.
No representation or warranty, express or implied, is or will be made by SES, its directors, officers or advisors, or any other person, as to the
accuracy, completeness or fairness of the information or opinions contained in this presentation, and any reliance you place on them will be at
your sole risk. Without prejudice to the foregoing, none of SES, or its directors, officers or advisors accept any liability whatsoever for any loss
however arising, directly or indirectly, from use of this presentation or its contents or otherwise arising in connection therewith.
This presentation includes “forward-looking statements”. All statements other than statements of historical fact included in this presentation,
including without limitation those regarding SES’s financial position, business strategy, plans and objectives of management for future
operations (including development plans and objectives relating to SES products and services), are forward-looking statements. Such forward-
looking statements involve known and unknown risks, uncertainties and other important factors that could cause the actual results, performance
or achievements of SES to be materially different from future results, performance or achievements expressed or implied by such forward-
looking statements. Such forward-looking statements are based on numerous assumptions regarding SES and its subsidiaries and affiliates,
present and future business strategies, and the environment in which SES will operate in the future, and such assumptions may or may not
prove to be correct. These forward-looking statements speak only as at the date of this presentation. Forward-looking statements contained in
this presentation regarding past trends or activities should not be taken as a representation that such trends or activities will continue in the
future. SES, and its directors, officers and advisors do not undertake any obligation to update or revise any forward-looking statements, whether
as a result of new information, future events or otherwise.