investor day 2012 - improvements in financial disclosures
DESCRIPTION
Christophe Boizard on the upcoming improvements in financial disclosuresTRANSCRIPT

Ageas
-
Upcoming
improvements in
financial disclosures
Christophe Boizard
CFO Ageas
INVESTOR DAY 2012

Introduction
Ageas track record in key areas of reporting
Evolving financial disclosures at Ageas
Margin analysis
Inflow / FuM proportional
Investment portfolio
Shareholders’ equity
Triangles on cost of claims – Non-Life
Conclusions

2011 2010 2009
Introduction Ageas has achieved a lot in the past 3 years
Clarify Ageas’s structure
with focus on valuation
of General Account legacy issues
net cash position
Investor Day 24&25 September 2012 - Andaz Liverpool Street London
Improved disclosure
on Insurance activities investment portfolio
solvency
operating
performance
Improved disclosures on
Insurance activities with
implementation of
segment reporting: Belgium
CEU
UK
Asia
Full quarterly reporting
Improved disclosures on shareholders’ equity
investment portfolio
Shortening quarterly
reporting deadlines
Dedicated call on EV report
2012
Coming from a strong banking culture, Ageas has put a lot of effort in adapting its
reporting to reach market standard in terms of pure insurance reporting
Detailed disclosures on
SE-sovereigns
2
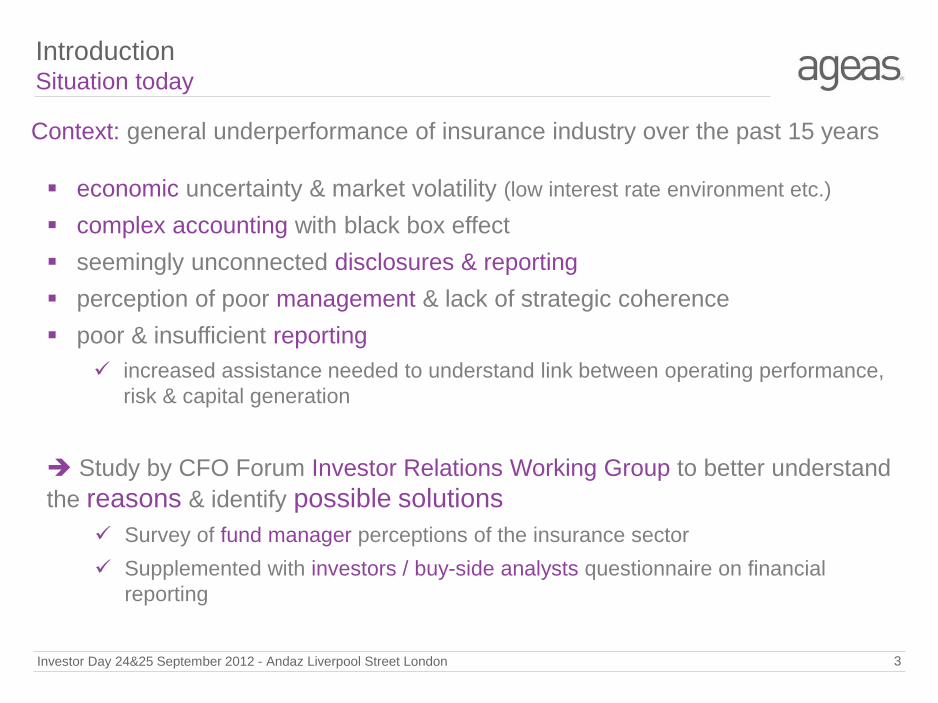
Introduction Situation today
Investor Day 24&25 September 2012 - Andaz Liverpool Street London 3
economic uncertainty & market volatility (low interest rate environment etc.)
complex accounting with black box effect
seemingly unconnected disclosures & reporting
perception of poor management & lack of strategic coherence
poor & insufficient reporting
increased assistance needed to understand link between operating performance,
risk & capital generation
Study by CFO Forum Investor Relations Working Group to better understand
the reasons & identify possible solutions
Survey of fund manager perceptions of the insurance sector
Supplemented with investors / buy-side analysts questionnaire on financial
reporting
Context: general underperformance of insurance industry over the past 15 years

Introduction Key findings CFO forum study 19 April 2012
Investor Day 24&25 September 2012 - Andaz Liverpool Street London 4
Macro issues are key concern but financial reporting next in line
Reporting problems mostly linked to life business
Life: a long search for consistent & relevant metrics
IFRS earnings - important because determining dividend
- limited visibility as to key drivers of profitability
- inconsistencies across the sector
EV / Value mgmt - complexity
- inconsistency in calculation & assumptions
- specific interest in VANB & relation to capital efficiency
Cash/Free capital - impact Solvency II
- minimal information on interaction assets/liabilities
- free surplus generation of life business (part of MCEV report)
Non-Life Less perceived major issue but significant room for improvement remains

Investor Day 24&25 September 2012 - Andaz Liverpool Street London 5
Introduction Results of study for CFO Forum 19 April 2012
0
1
2
3
4
5
Group IFRSsegment
disclosures
Cash / free capitaldisclosures
Embedded valuereporting
New businessmetrics
(such as IRRs andpayback periods)
Solvencydisclosures
Life IFRS 'sourcesof
earnings' or'marginanalysis'
Areas of reporting that should be
key priorities

Introduction
Ageas track record in key areas of reporting
Evolving financial disclosures at Ageas
Margin analysis
Inflow / FuM proportional
Investment portfolio
Shareholders’ equity
Triangles on cost of claims – Non-Life
Conclusions

0
1
2
3
4
5
Group IFRSsegment
disclosures
Cash / free capitaldisclosures
Embedded valuereporting
New businessmetrics
(such as IRRs andpayback periods)
Solvencydisclosures
Life IFRS 'sourcesof
earnings' or'marginanalysis'
Investor Day 24&25 September 2012 - Andaz Liverpool Street London 7
Ageas’s track record on identified key areas of reporting (1/6)
insurance segments
& General Account
inflow per product line
balance sheet
P&L
combined ratio
equity / solvency
details on legacy items

Investor Day 24&25 September 2012 - Andaz Liverpool Street London 8
Ageas’s track record on identified key areas of reporting (2/6)
0
1
2
3
4
5
Group IFRSsegment
disclosures
Cash / free capitaldisclosures
Embedded valuereporting
New businessmetrics
(such as IRRs andpayback periods)
Solvencydisclosures
Life IFRS 'sourcesof
earnings' or'marginanalysis'
cash position
discretionary capital
General Account
excess capital per
segment
Free capital disclosure
crippled by unstabilized
solvency regulation

0
1
2
3
4
5
Group IFRSsegment
disclosures
Cash / free capitaldisclosures
Embedded valuereporting
New businessmetrics
(such as IRRs andpayback periods)
Solvencydisclosures
Life IFRS 'sourcesof
earnings' or'marginanalysis'
Investor Day 24&25 September 2012 - Andaz Liverpool Street London 9
Ageas’s track record on identified key areas of reporting (3/6)
FY embedded
value report
dedicated call for
analysts &
investors with
Risk Officer
No stable definition
despite CFO forum efforts

0
1
2
3
4
5
Group IFRSsegment
disclosures
Cash / free capitaldisclosures
Embedded valuereporting
New businessmetrics
(such as IRRs andpayback periods)
Solvencydisclosures
Life IFRS 'sourcesof
earnings' or'marginanalysis'
Investor Day 24&25 September 2012 - Andaz Liverpool Street London 10
Ageas’s track record on identified key areas of reporting (4/6)
FY VANB disclosure
0
1
2
3
4
5
Group IFRSsegment
disclosures
Cash / free capitaldisclosures
Embedded valuereporting
New businessmetrics
(such as IRRs andpayback periods)
Solvencydisclosures
Life IFRS 'sourcesof
earnings' or'marginanalysis'
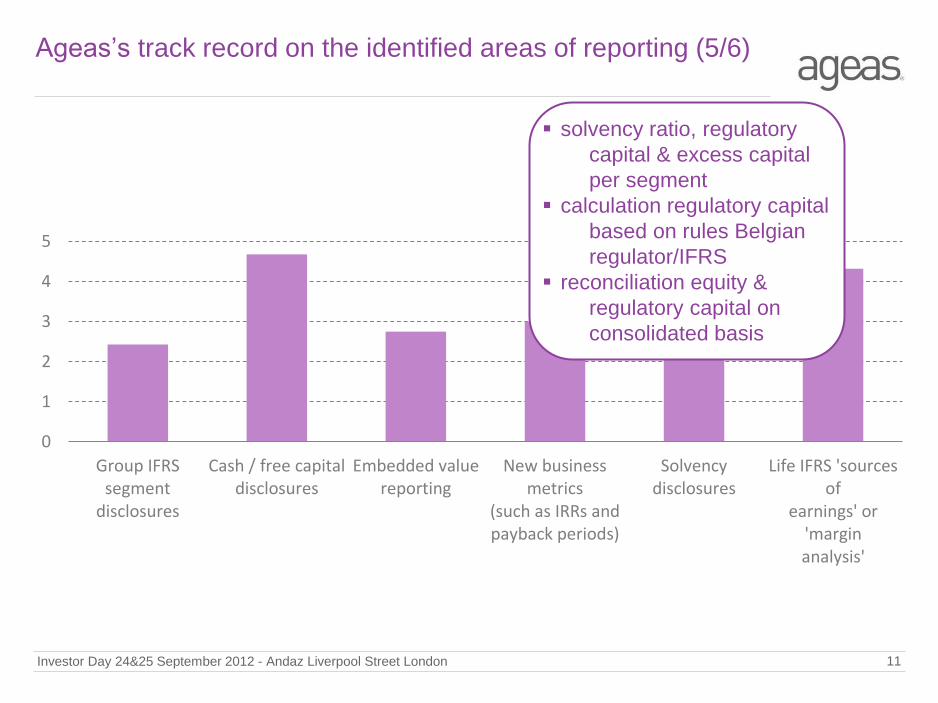
Investor Day 24&25 September 2012 - Andaz Liverpool Street London 11
Ageas’s track record on the identified areas of reporting (5/6)
solvency ratio, regulatory
capital & excess capital
per segment
calculation regulatory capital
based on rules Belgian
regulator/IFRS
reconciliation equity &
regulatory capital on
consolidated basis

Investor Day 24&25 September 2012 - Andaz Liverpool Street London 12
Ageas’s track record on identified key areas of reporting (6/6)
0
1
2
3
4
5
Group IFRSsegment
disclosures
Cash / free capitaldisclosures
Embedded valuereporting
New businessmetrics
(such as IRRs andpayback periods)
Solvencydisclosures
Life IFRS 'sourcesof
earnings' or'marginanalysis'
as from FY 2012
giving a sneak pre-view
NOW
Introduction
Ageas track record in key areas of reporting
Evolving financial disclosures at Ageas
Margin analysis
Inflow / FuM proportional
Investment portfolio
Shareholders’ equity
Triangles on cost of claims – Non-Life
Conclusions

Income Statement - Life
in EUR million 6M 12 6M 11 Change Q2 12 Q2 11 Change Q1 12
Gross inflow Life 3,427.8 3,790.7 (9.6%) 1,793.6 1,725.7 3.9% 1,634.2
Operating margin 276.3 77.5 * 106.5 ( 52.8 ) * 169.8
Non-allocated other income and expenses 50.9 ( 23.1 ) * 26.2 ( 61.2 ) * 24.7
Result before taxation 389.5 89.0 * 163.2 ( 97.1 ) * 226.3
Income tax expenses ( 122.7 ) ( 20.9 ) * ( 59.4 ) 18.9 * ( 63.3 )
Non-controlling interests 61.4 16.6 * 23.8 ( 23.9 ) * 37.6
Net result attributable to shareholders 205.4 51.5 * 80.0 ( 54.3 ) * 125.4
Income Statement - Life Guaranteed Guaranteed Unit - Linked Unit - Linked
in EUR million 6M 12 6M 11 6M 12 6M 11
Gross inflow Life 2,943.3 2,680.2 484.5 1,110.4
Risk result 132.4 119.5 7.0 5.1
Investment result 203.9 16.4 0.3 (0.0)
Expense & other result ( 91.6 ) ( 91.3 ) 24.3 27.8
Operating margin 244.7 44.6 31.6 32.9
Key Performance Indicators - Life Guaranteed Guaranteed Unit - Linked Unit - Linked
in EUR million 6M 12 6M 11 6M 12 6M 11
Risk margin 0.50% 0.46% 0.12% 0.05%
Investment margin 0.76% 0.06% 0.01% (0.00%)
Expense & other margin (0.34%) (0.35%) 0.42% 0.27%
Operating margin 0.92% 0.17% 0.55% 0.32%
Technical reserves (in EUR million) 54,387 52,775 11,462 20,242
Investor Day 24&25 September 2012 - Andaz Liverpool Street London 14
Margin analysis Life Insurance (1/3) More detailed reporting as of FY 2012, sneak preview
ADDITIONAL

Income Statement - Non-Life
in EUR million 6M 12 6M 11 Change Q2 12 Q2 11 Change Q1 12
Gross written premiums Non-Life 2,276.6 2,123.3 7.2% 1,090.0 1,021.6 6.7% 1,186.7
Net earned premiums 2,022.8 1,631.7 24.0% 1,033.8 847.9 21.9% 989.0
Operating margin 154.2 69.5 121.8% 118.4 44.7 165.0% 35.8
Result before taxation 174.5 81.7 113.7% 124.0 42.2 194.1% 50.5
Income tax expenses ( 52.5 ) ( 23.3 ) 125.6% ( 38.4 ) ( 13.2 ) 191.5% ( 14.2 )
Non-controlling interests ( 32.6 ) ( 10.4 ) 214.5% ( 22.4 ) ( 5.8 ) 289.8% ( 10.1 )
Net result attributable to shareholders 89.5 48.0 86.3% 63.2 23.2 171.9% 26.3
Income Statement - Non-Life Accident &
Health
Accident &
HealthMotor Motor Fire Fire Other lines Other lines
in EUR million 6M 12 6M 11 6M 12 6M 11 6M 12 6M 11 6M 12 6M 11
Gross written premiums Non-Life 422.6 423.6 1,107.5 972.8 544.1 538.7 202.4 188.2
Net earned premiums 382.0 373.6 987.6 689.2 490.5 416.9 162.7 152.0
Net underwriting result 24.5 16.3 34.9 9.2 ( 14.6 ) ( 22.7 ) ( 9.5 ) ( 3.9 )
Investment result 26.4 14.3 46.8 30.3 15.0 11.0 15.7 11.0
Other result 0.6 ( 2.6 ) 13.5 5.5 0.6 0.3 0.2 0.6
Operating margin 51.6 28.1 95.2 45.0 1.0 ( 11.4 ) 6.4 7.8
Key Performance Indicators - Non-Life Accident &
Health
Accident &
HealthMotor Motor Fire Fire Other lines Other lines
in EUR million 6M 12 6M 11 6M 12 6M 11 6M 12 6M 11 6M 12 6M 11
Net combined ratio 93.6% 95.6% 96.5% 98.7% 103.0% 105.4% 105.9% 102.5%
Net claims ratio 69.2% 71.4% 71.1% 71.2% 61.7% 62.8% 62.0% 60.3%Net claims ratio Current Year 78.6% 80.3% 73.2% 74.6% 69.9% 64.0% 62.7% 64.7%
Net claims ratio Prior Year (9.3%) (8.9%) (2.1%) (3.3%) (8.2%) (1.2%) (0.7%) (4.4%)
Net expense ratio 24.3% 24.2% 25.4% 27.4% 41.3% 42.7% 43.8% 42.2%
Net underwriting ratio 6.4% 4.4% 3.5% 1.3% (3.0%) (5.4%) (5.9%) (2.5%)
Investment ratio 6.9% 3.8% 4.7% 4.4% 3.1% 2.6% 9.7% 7.3%
Other margin 0.2% (0.7%) 1.4% 0.8% 0.1% 0.1% 0.1% 0.4%
Operating margin 13.5% 7.5% 9.6% 6.5% 0.2% (2.7%) 3.9% 5.1%
Reserves ratio 258.6% 251.0% 148.2% 170.8% 82.2% 93.0% 270.9% 272.6%
Non-Life reserves (in EUR m) 1,975.5 1,875.3 2,928.2 2,353.7 806.1 775.3 881.7 828.4
Investor Day 24&25 September 2012 - Andaz Liverpool Street London 15
Margin analysis Non-Life Insurance (2/3) More detailed reporting as of FY 2012, sneak preview
ADDITIONAL
ADDITIONAL

Investor Day 24&25 September 2012 - Andaz Liverpool Street London 16
Margin analysis Life & Non-Life Insurance (3/3) Major changes as of FY 2012 vs. current reporting
For consolidated companies only
Per product family
Additional disclosures
Life Non-Life
Per segment - Total Insurance
- Belgium
- UK
- CEU
- Asia
Abolishment of technical result & towards focus on operating margin only
- Accident & Health
- Motor
- Fire
- Other insurance
- Net earned premium
- Net Underwriting result
- Investment result
- Other result
- CY / PY Claims ratio
- Reserves ratio
- Guaranteed
- Unit-linked
- Risk result
- Investment result
- Expense & other result

Introduction
Ageas track record in key areas of reporting
Evolving financial disclosures at Ageas
Margin analysis
Inflow / FuM proportional
Investment portfolio
Shareholders’ equity
Triangles on cost of claims – Non-Life
Conclusions

Consolidated & Non-consolidated @ 100%
Investor Day 24&25 September 2012 - Andaz Liverpool Street London 18
Inflow reporting Strive for a better link between top line & bottom line performance
2,361 2,642
22 38 1,250 1,574
2,910 3,580
6,543
7,834
898 940
994 1,102
231 537
326
402
2,449
2,981
+ 10%
+ 12%
+ 43%
+ 23%
+ 20%
3,259 3,582
1,016 1,140 1,481
2,111
3,236
3,982
8,992
10,815
6M 11 6M 12 6M 11 6M 12 6M 11 6M 12 6M 11 6M 12 6M 11 6M 12
Life Non-Life
Life Non-Life
Life Non-Life
Life Non-Life
Life Non-Life
Belgium UK
CEU Asia
Total Ageas
In EUR mio

Investor Day 24&25 September 2012 - Andaz Liverpool Street London 19
Inflow reporting Proportional presentation improves link with bottom line view
Life Non-Life
Life Non-Life
Life Non-Life
Life Non-Life
Life Non-Life
Belgium UK
CEU Asia
Total Ageas
1,771 1,982
22 38 727 685 890 1,104
3,410 3,809
674 705
815 909 90 200
91 111
1,669
1,925
+ 10%
+ 13%+ 8%
+ 24%
+ 13%
2,444 2,687
837 947 817 885 981
1,215
5,079
5,734
6M 11 6M 12 6M 11 6M 12 6M 11 6M 12 6M 11 6M 12 6M 11 6M 12
In EUR mio
Consolidated & Non-consolidated @ ageas share
Belgium 75%
UK 100%
Tesco
Underwriting 50%
CEU Consolidated
Portugal 51%
France 100%
Luxembourg (FY 11) 50%
Germany 100%
Italy 25%
Non-consolidated
Turkey 36%
Luxembourg (FY 12) 33%
Asia
Consolidated
Hong Kong 100%
Non-consolidated
Malaysia 31%
Thailand 31%/15%
China 25%
India 26%
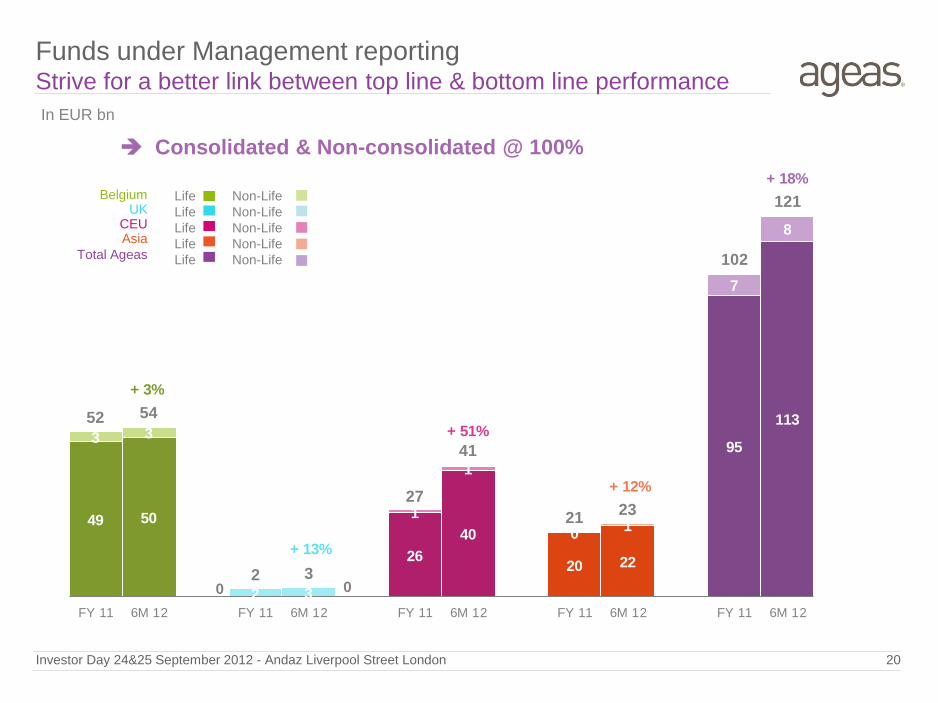
Investor Day 24&25 September 2012 - Andaz Liverpool Street London 20
Funds under Management reporting Strive for a better link between top line & bottom line performance
Life Non-Life
Life Non-Life
Life Non-Life
Life Non-Life
Life Non-Life
Belgium UK
CEU Asia
Total Ageas
49 50
0 0
26
40
20 22
95
113
3 3
2 3
1
1
0 1
7
8
+ 3%
+ 13%
+ 51%
+ 12%
+ 18%
52 54
2 3
27
41
21 23
102
121
FY 11 6M 12 FY 11 6M 12 FY 11 6M 12 FY 11 6M 12 FY 11 6M 12
Consolidated & Non-consolidated @ 100%
In EUR bn
Investor Day 24&25 September 2012 - Andaz Liverpool Street London 21
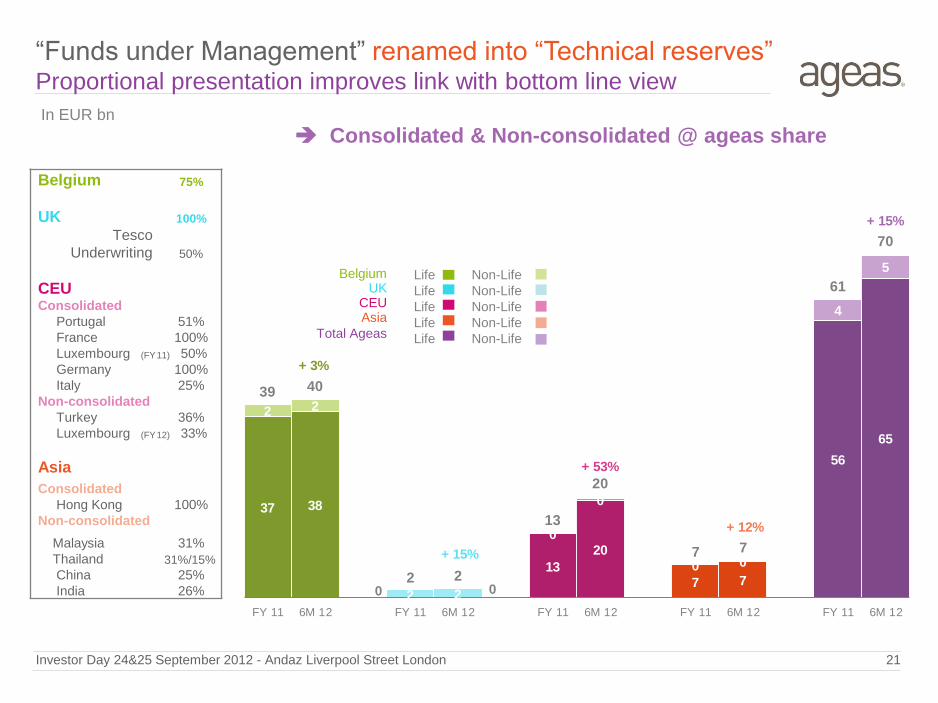
“Funds under Management” renamed into “Technical reserves” Proportional presentation improves link with bottom line view
Life Non-Life
Life Non-Life
Life Non-Life
Life Non-Life
Life Non-Life
Belgium UK
CEU Asia
Total Ageas
Consolidated & Non-consolidated @ ageas share In EUR bn
37 38
0 0
13
20
7 7
56
65
2 2
2 2
0
0
0 0
4
5
+ 3%
+ 15%
+ 53%
+ 12%
+ 15%
39 40
2 2
13
20
7 7
61
70
FY 11 6M 12 FY 11 6M 12 FY 11 6M 12 FY 11 6M 12 FY 11 6M 12
Belgium 75%
UK 100%
Tesco
Underwriting 50%
CEU Consolidated
Portugal 51%
France 100%
Luxembourg (FY 11) 50%
Germany 100%
Italy 25%
Non-consolidated
Turkey 36%
Luxembourg (FY 12) 33%
Asia
Consolidated
Hong Kong 100%
Non-consolidated
Malaysia 31%
Thailand 31%/15%
China 25%
India 26%

Introduction
Ageas track record in key areas of reporting
Evolving financial disclosures at Ageas
Margin analysis
Inflow / FuM proportional
Investment portfolio
Shareholders’ equity
Triangles on cost of claims – Non-Life
Conclusions

3.43.72.4
1.665.268.7
Cash and cashequivalents
Loans
Investor Day 24&25 September 2012 - Andaz Liverpool Street London 23
More complete disclosure on investment portfolio Reporting on new asset classes as of FY 2012
as you know it what it will be like as of
FY 2012 ...
EUR mio
31.4 33.6
21.422.8
1.82.14.3
4.559.463.4
FY 11 6M 12
Real Estate
Equity Securities
Structured creditinstruments
Corporate bonds
Sovereign bonds
FY 11 6M 12
ADDITIONAL + further breakdown of loans

Introduction
Ageas track record in key areas of reporting
Evolving financial disclosures at Ageas
Margin analysis
Inflow / FuM proportional
Investment portfolio
Shareholders’ equity
Triangles on cost of claims – Non-Life
Conclusions

Shareholders’ equity Insurance equity volatile by movements in unrealized gains & losses
Investor Day 24&25 September 2012 - Andaz Liverpool Street London 25
In EUR bn
ADDITIONAL: split between Insurance,
General Account & UG/L
4.8 4.4 4.5 4.7 5.0 5.2 5.2 5.5 5.5 5.4 5.3 5.5 5.6 5.9
0.40.5
1.2 0.81.1 1.0 1.4
0.3
(0.3) (0.1)
0.7 0.51.0
1.21.6
3.2
3.2 3.12.8
3.23.3
2.72.3 2.4
2.0 1.8
1.71.7
6.8
8.0
8.8 8.6 8.99.4
9.9
8.47.6 7.6
8.17.8
8.38.8
3M 09 6M 09 9M 09 FY 09 3M 10 6M 10 9M 10 FY 10 3M 11 6M 11 9M 11 FY 11 3M 12 6M 12
General Account Insurance
UG/L
UG/L

Introduction
Ageas track record in key areas of reporting
Evolving financial disclosures at Ageas
Margin analysis
Inflow / FuM proportional
Investment portfolio
Shareholders’ equity
Triangles on cost of claims – Non-Life
Conclusions

Loss reserve developments Additional reporting on segments, based on accident year as of FY 2012
Investor Day 24&25 September 2012 - Andaz Liverpool Street London 27
One consolidated Loss reserve development table already disclosed in Annual Report
(note 7.12), driven by IFRS requirements, based on “book year” convention.
Additional online yearly reporting based on “accident years” at segment level &
consolidated view
Accident Year as at 31 DecemberAll material f igures quoted are undiscounted 2002 2003 2004 2005 2006 2007 2008 2009 2010 2011
Cumulative payments at:
2002 82.3
2003 164.3 75.6
2004 238.6 153.8 79.2
2005 288.5 224.1 160.3 83.8
2006 328.8 277.0 232.0 167.9 95.5
2007 360.0 318.0 285.5 241.8 188.0 107.9
2008 387.9 353.1 330.5 299.2 271.8 216.7 121.2
2009 417.1 387.4 373.0 352.6 338.7 312.8 237.9 127.3
2010 436.7 411.2 402.7 390.7 387.9 377.0 332.6 258.9 158.5
2011 454.3 432.6 428.5 424.5 430.4 432.4 406.3 361.7 316.6 155.4
Cost of Claims (cumulative payments + outstanding reserves:2002 757.1
2003 673.8 721.4
2004 663.2 685.8 754.8
2005 662.1 680.2 723.0 792.6
2006 609.9 658.8 699.0 750.5 822.7
2007 641.1 654.9 688.2 736.1 797.9 880.5
2008 645.7 657.1 693.7 744.0 803.1 884.0 940.1
2009 624.7 635.3 668.6 716.8 774.9 853.7 896.5 963.3
2010 615.5 625.7 658.1 704.1 761.8 842.4 894.2 939.7 1,060.8
2011 611.5 621.8 656.4 700.4 756.5 832.3 880.0 933.4 1,033.1 1,068.4
Gross Outstanding Claims Reserves 157.1 189.2 228.0 276.0 326.1 400.0 473.8 571.7 716.5 913.0(including IBNR& Prov for costs)
Redundancy/deficiency from initial claims versus re-estimated reserves 145.6 99.7 98.4 92.1 66.2 48.2 60.0 29.9 27.6
accounted for this year 4.0 3.9 1.7 3.7 5.3 10.1 14.2 6.3 27.7
Claims w ith regard to w orkers' compensation and health care 1,145.3
Total claims in the statement of financial position (Note 28) 2,839.1
Segment X Run-off table (2011)
ADDITIONAL
Introduction
Ageas track record in key areas of reporting
Evolving financial disclosures at Ageas
Margin analysis
Inflow / FuM proportional
Investment portfolio
Shareholders’ equity
Triangles on cost of claims – Non-Life
Conclusions

Conclusions
Investor Day 24&25 September 2012 - Andaz Liverpool Street London 29
Continuous improvements since 2009,
reflecting Ageas’s new business profile
& corresponding to Insurance market
practices
Additional info will be released to further
improve financial disclosures in order to
help financial markets better
understand Ageas’s business model
Future and further enhancement will
be studied going forward in line with
industry evolution of practices &
regulation (Solvency II, IFRS phase 2,...)

Disclaimer
Investor Day 24&25 September 2012 - Andaz Liverpool Street London 30
Certain of the statements contained herein are statements of
future expectations and other forward-looking statements
that are based on management's current views and
assumptions and involve known and unknown risks and
uncertainties that could cause actual results, performance or
events to differ materially from those expressed or implied in
such statements. Future actual results, performance or
events may differ materially from those in such statements
due to, without limitation, (i) general economic conditions,
including in particular economic conditions in Ageas’s core
markets, (ii) performance of financial markets, (iii) the
frequency and severity of insured loss events, (iv) mortality
and morbidity levels and trends, (v) persistency levels, (vi)
interest rate levels, (vii) currency exchange rates, (viii)
increasing levels of competition, (ix) changes in laws and
regulations, including monetary convergence and the
Economic and Monetary Union, (x) changes in the policies of
central banks and/or foreign governments and (xi) general
competitive factors, in each case on a global, regional and/or
national basis. In addition, the financial information
contained in this presentation, including the pro forma
information contained herein, is unaudited and is provided
for illustrative purposes only. It does not purport to be
indicative of what the actual results of operations or financial
condition of Ageas and its subsidiaries would have been had
these events occurred or transactions been consummated
on or as of the dates indicated, nor does it purport to be
indicative of the results of operations or financial condition
that may be achieved in the future.