#investor day · 10 investor day h1 2016 strong new order dynamic new order dynamic digital...
TRANSCRIPT

31 August 2016
#INVESTOR DAY
Conquer 2018 Plan
Financial Restructuring

INVESTOR DAY2
Disclaimer
This document contains forward-looking statements. In particular the business plan as disclosed today is subject to certain risk factors which are detailed in this
presentation. Any forward-looking statement does not constitute forecasts as defined in European regulation (EC) 809/2004.
For the preparation of the description of such risk factors, the management has relied on its own assessment but also on the result of the diligence completed by
experts who conducted in April and May 2016 independent business reviews of Solocal Group and its subsidiaries which involved a review of the strategic plan of
the company.
Solocal Group believes its business plan is based on reasonable assumptions, although it contains forward-looking statements which are subject to numerous risks
and uncertainties. Important factors that could cause actual results to differ materially from the results anticipated in the forward-looking statements include the
effects of competition, usage levels, the success of the Group’s investments in France and abroad, and the effects of the economic situation.
A general description of the risks to which the Group is exposed appears in section 4 “Risk Factors” of the SoLocal Group’s “Document de référence”, which was filed
with the French financial markets authority (AMF) on 29 April 2016.
The forward-looking statements contained in this document apply only at the date of this document. SoLocal Group does not undertake to update any of these
statements to take account of events or circumstances arising after the date of said document or to take account of the occurrence of unexpected events.
Accounting data presented on an annual basis are in audited consolidated form, but accounting data indicated on a quarterly or half-yearly basis are in unaudited
consolidated form.
Business indicators covered in the presentation are for continued activities.
All financial data and indicators are published in details within the report of Consolidated financial information as of 30 June 2016 which is available on the
corporate website, www.SoLocalgroup.com (finance area).

INVESTOR DAY3
Agenda
1. Conquer 2018
Financial restructuring2.

Conquer 2018Jean-Pierre RemyChief Executive Officer
2. Conquer 2018 : Strategy and objectives
Digital 2015: Transformation into a digital leader
2016-2018 Business plan
1.
3.

Digital 2015:
Transformation
into a digital
leaderChristophe Pingard
Deputy Chief Executive Officer

INVESTOR DAY6
« Digital 2015 »: Invest and Transform
SoLocaI
Business
Impact
Digital Talents ITValues /
ManagementKPIs
Customer experience
Targeted and efficient traffic
Digital Company
Partnerships &
International
SoLocal Corporate Culture

INVESTOR DAY7
SoLocal transformation into a leading digital player in Europe
Position in 2015 Latest news
1 Recurring Group EBITDA to revenue margin, excluding non recurring items
€640 M Internet revenues, Internet revenue growth reached
4% and represented 73% of group’s revenues
Distinctive local online advertising specialist offering Local
Search (496 M€ of revenues) and Digital Marketing solutions
(144 M€ of revenues)
Strong audience dynamic, #6 audience in French Internet,
growing by +9% thanks to +24% in mobile in FY2015 and
privileged partnerships with Google, Microsoft, Yahoo!,
Facebook and now Apple
Leading position in each of its verticals allowing to provide
customized solutions to its different client segments: Home,
Services, Retail, Health & Public, BtoB
31% EBITDA margin1 thanks to continuous operational
efficiency improvements
€144 M revenues in Digital Marketing, supported by new lines
of business (~380k business websites, online scheduling)
Successful launches of new product lines: local
programmatic, store locator and click & collect services,
doctor online scheduling platform
New sources of growth through own platforms (mobile
growth, Ooreka), and the first mobile only deal with Apple that
adds to the existing partnerships with Google and Bing
Replacement of 1/3 of the salesforce and reorganization in 5
verticals. Now a team of ~2,000 specialised consultants, very
Internet savvy, supported by state of the art selling tools and
processes
Divestment of 4 non profitable non growing businesses and
strong discipline in resource and cost management

INVESTOR DAY8
SoLocal owns leading positions in local online advertising
Audience2: 470m
Client base: 146k
ARPA3: €696
Digital Marketing4: 16%
RMS6 = ~6x
€131 million
21%1
Audience2: 550m
Client base: 83k
ARPA3: €741
Digital Marketing4: 11%
RMS5 = ~5x
€71 million
12%1
Audience2: 200m
Client base: 77k
ARPA3: €1,231
Digital Marketing4: 24%
RMS5 = ~1x
€124 million
20%1
Audience2: 210m
Client base: 87k
ARPA3: €1,053
Digital Marketing4 : 18%
RMS5 = ~5x
€110 million
18%1
Audience2: 110m
Client base: 116k
ARPA3: €1,272
Digital Marketing4: 24%
RMS5 = ~7x
€183 million
29%1
N°1 N°3 N°1 N°1 N°1
All data concerns full year 2015 exercise 1 In % of total revenues 2 In terms of number of searches (2015) 3 Local Search ARPA 4 Penetration rate of the Local Search customer base 5 RMS: Relative Market Share, Internet
revenues of each SoLocal vertical related to those of the first competitor (Source: Independent consulting firm) 6 Estimate excludes travel and hotel booking competitors

INVESTOR DAY9
A competitive organisation to « Conquer 2018 »
Creation of 5 vertical business units + 1 large account business unit
Specialisation of teams in sales, marketing, operations
Verticalisation of offerings
New tools, sales approach and customer service
Expansion into new territories: Spain, UK, Austria
Global coverage in websites and content
Sites Internet et
contenus
Programmatique
Adwords
Local
Search
Digital
Marketing

INVESTOR DAY10
H1 2016 strong new order dynamic
New order dynamic
Digital Marketing
Successful and innovative product range…
– Very strong acceleration of local programmatic
– Launch of a new Adwords offering developed by Effilab
– Ramp up of high-end content based website offering
(Privilege site)
– Gaining traction with transactional services, especially
with PagesJaunes Doc
– Growing website business in Spain
… leading Digital Marketing new orders to overtake Print &
Voice
1 H1 2016 vs H1 2015 new order evolution
Group
Internet
Local Search
Digital Marketing
H1 2016
New order growth1
+2%
+10%
+2%
+44%
Local Search
Decrease in new client acquisition given the ongoing
constraints offset by ARPA growth thanks to increasing
audience monetisation and focus on high ARPA clients

Conquer 2018:
Strategy &
ObjectivesJean-Pierre RemyChief Executive Officer

INVESTOR DAY12
Meaningful and scalable mission
Reveal local know-how, everywhere, …
… and boost local revenues of businesses
INVESTOR DAY13
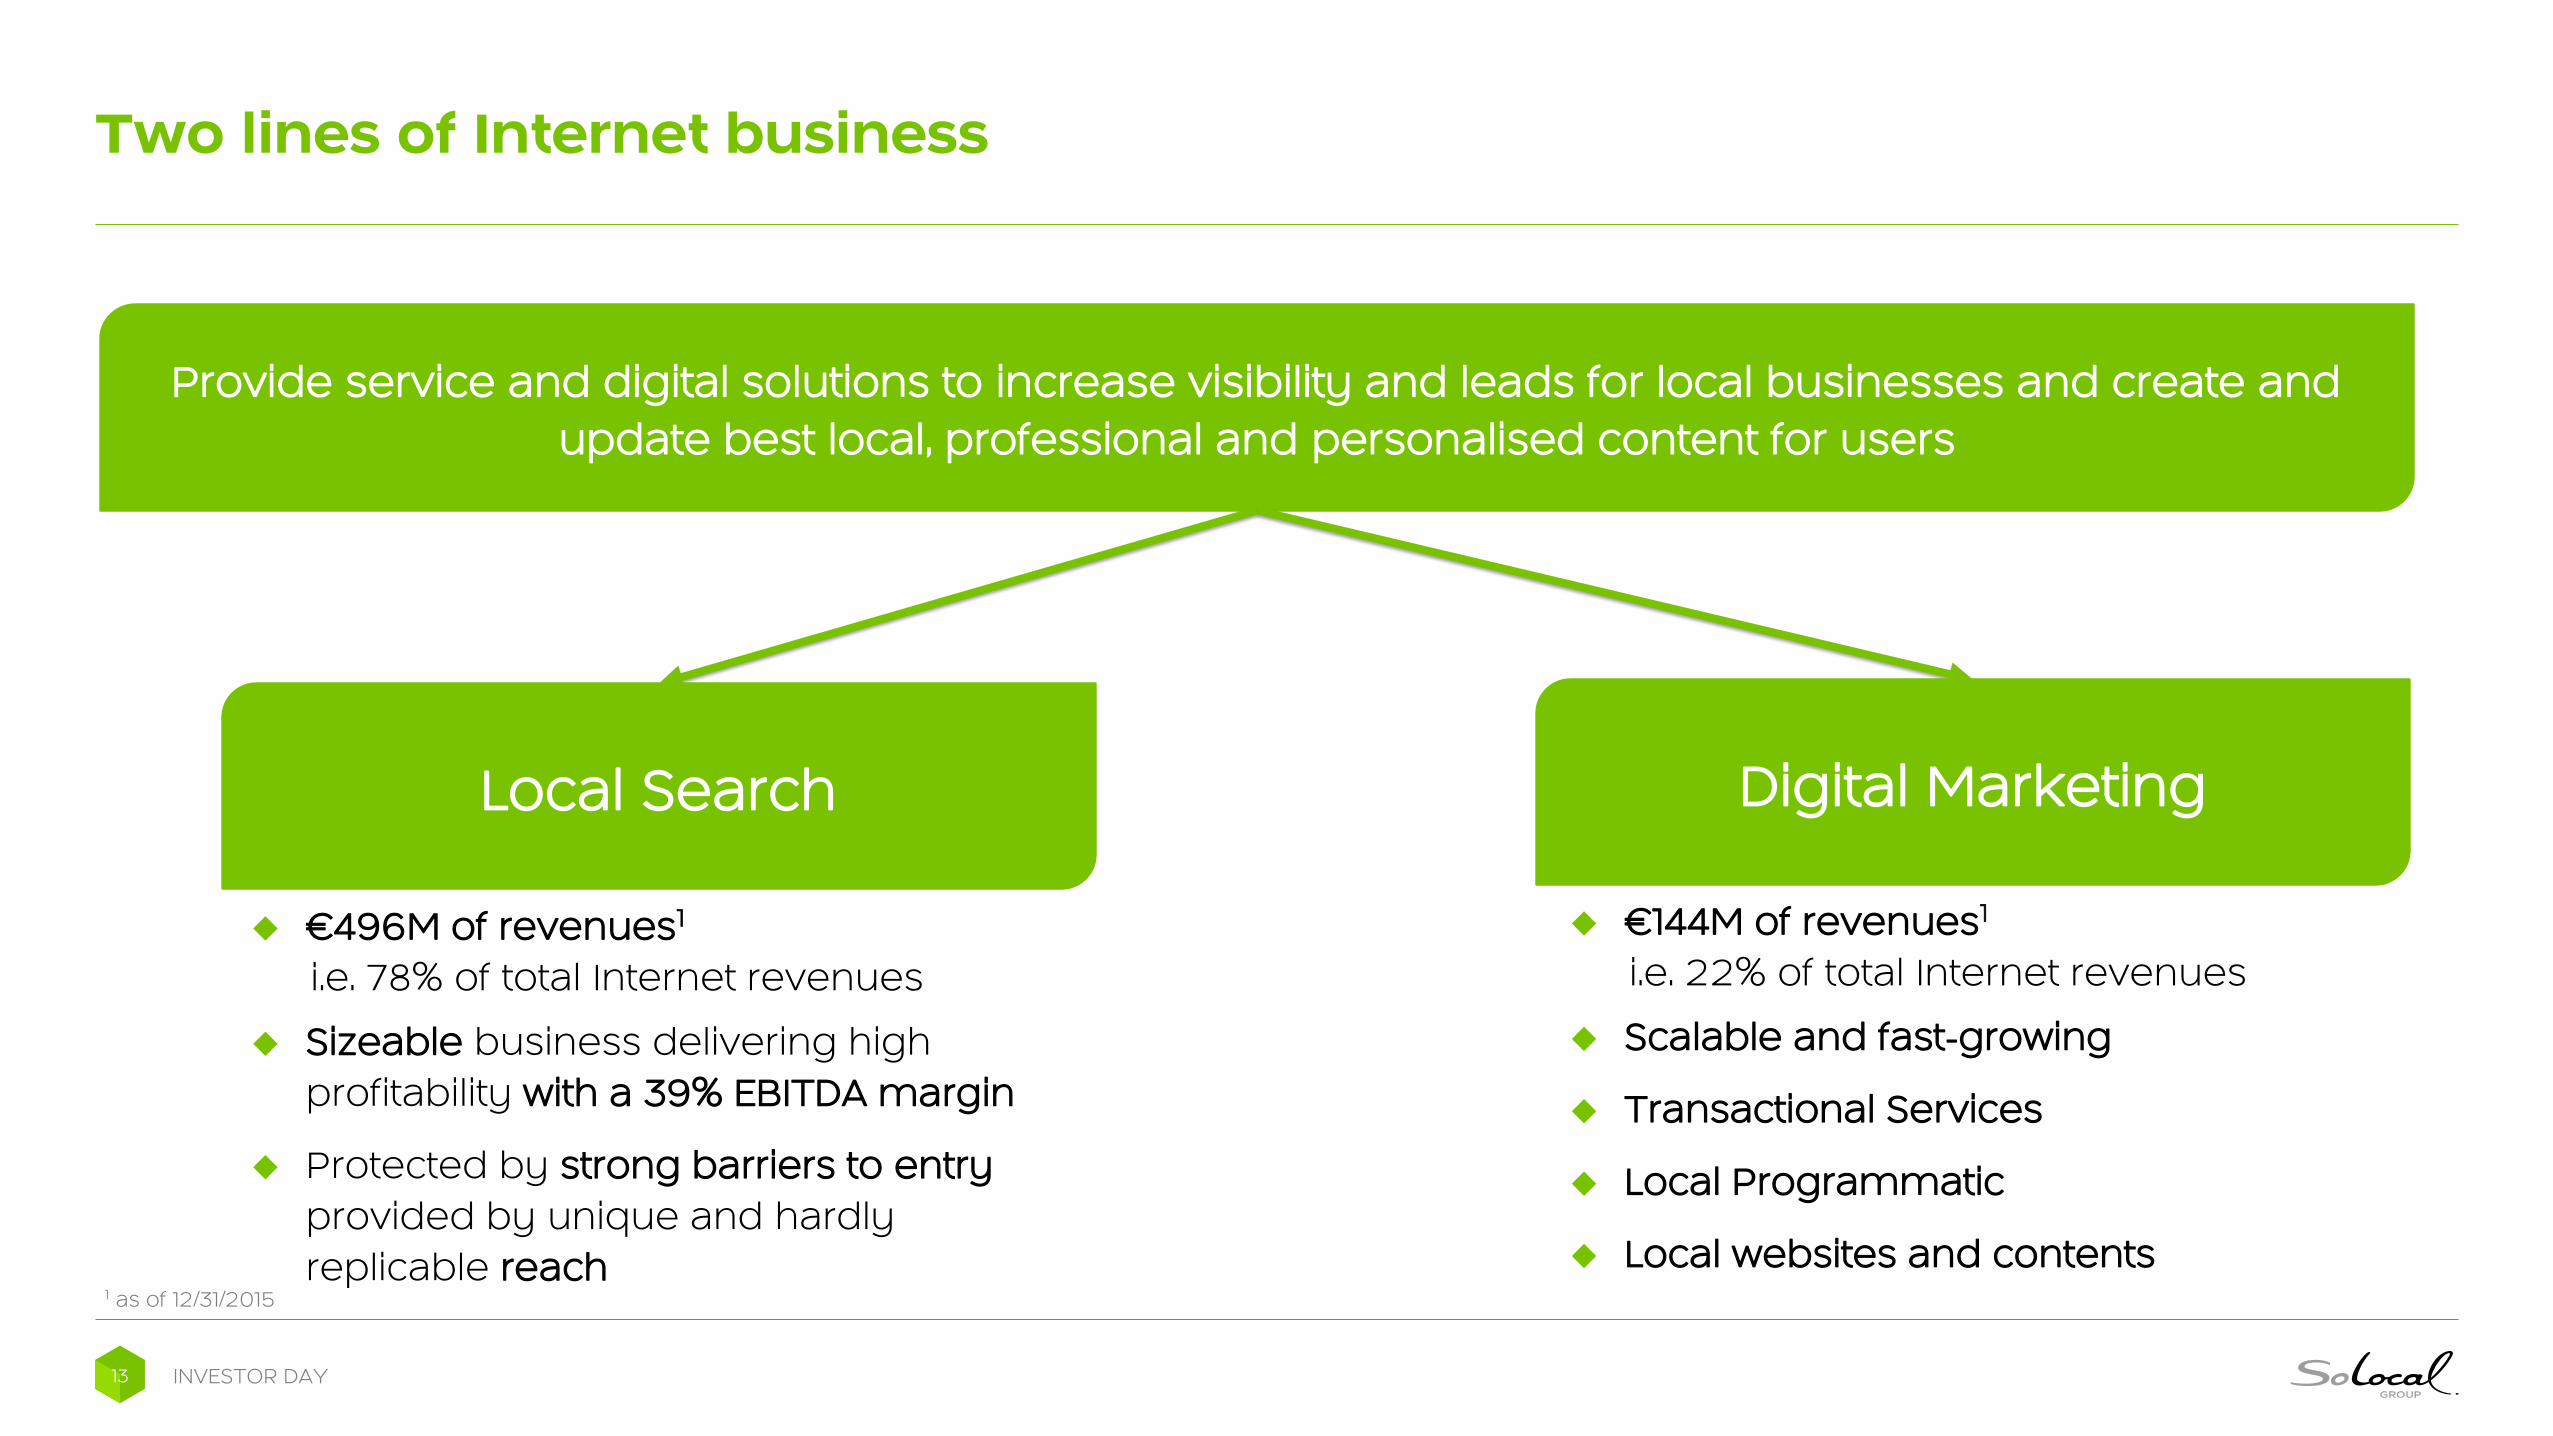
Two lines of Internet business
€496M of revenues1
i.e. 78% of total Internet revenues
Sizeable business delivering high
profitability with a 39% EBITDA margin
Protected by strong barriers to entry
provided by unique and hardly
replicable reach
€144M of revenues1
i.e. 22% of total Internet revenues
Scalable and fast-growing
Transactional Services
Local Programmatic
Local websites and contents
Provide service and digital solutions to increase visibility and leads for local businesses and create and
update best local, professional and personalised content for users
Local Search Digital Marketing
1 as of 12/31/2015

INVESTOR DAY14
Key assets & strategy
Local Search Digital Marketing
AdTech
~500,000 CLIENTS2 23% PENETRATION2
Client audience growth
Unique access to top 3 mobile
Own media platforms
59% reach1
~45M mobile apps2
Unique local data
Unique data on local purchasing intents
Local advertising retargeting
Local campaign efficiency (Google, Bing)
Partnerships with global players
Enriched Content
~380,0002 business websites and store/product
locators of which ~50% on an international basis
Leader of online scheduling
1 as of end of March 2016 2 as of end of June 2016

INVESTOR DAY15
Conquer 2018: growth and profitability objectives
1 Recurring EBITDA/Group revenue margin, excluding non-recurring items
Note: Forecasted trends and figures are based on a non-binding Business Plan which does not take into account the potential internationalisation of the Group and the acceleration of digital advertising market in France. The
retained scenario assumes a debt restructuring in Q3 2016
Local Search
Accelerate client acquisition while
maintaining ARPA growth
Digital Marketing
Target new revenue streams and
scalability opportunities
>15% targeted growth by 2018
Increased penetration of
client base from 22% in
2015 to 30%
Targeted growth by 2018
ARPA : +3% to +6%
# of clients : 0% to +5%
The Group aims to achieve by 2018
A sustainable high digit Internet growth
A profitable growth: EBITDA to revenue margin1 between 28% and 30%
Digital
MarketingLocal
Search

INVESTOR DAY16
76%
62% 61%
56%
38%
31% 31%
16%13%
6%
29%
24%21%
17%
8%
1%Colonne1 Colonne2 Colonne3 Colonne4 Colonne5 Colonne6 Colonne7 Colonne8 Colonne9 Colonne10 Colonne11 Colonne12 Colonne13 Colonne14 Colonne15 Colonne16
2015 EBITDA to revenue margin
High profitability due to the power of our audiences
Internet players with media
Internet players without media
Source: Annual reports (FY 2015), except HSBC (04,02,2016) for SeLoger and LaCentrale
Note: EBITDA to revenue margin is based on the recurring/adjusted EBITDA as disclosed by management in annual reports

2016-2018
Business PlanVirginie Cayatte
Chief Financial Officer

INVESTOR DAY18
Expected market growth and additional catch up opportunity
Addressable markets
(France; € billions, 2015 growth %)Share of digital in local advertising
~27,1
~2,5
~4,0
Traditional
Advertising
Digital Advertising
Digital Marketing
~34
~+5-10%
~+4%
~-2%
Source: Independent consulting firm
1%3%
15%
43%
20%
40%
15%
30%
6%
12%

INVESTOR DAY19
Conquer 2018 plan is aiming at accelerating digital growth by 2018
Operational
efficiency
Internet
growth
GAME CHANGERS
Stabilise client base through
investment in client acquisition and
optimised retention
Build-up branding
Sustain audience growth through
tactical traffic acquisition and
technological partnerships
Accelerate Digital Marketing
scalable platforms
Manage smooth decline of Print &
Voice business
Scale sales and support platforms
2018 EXPECTATIONS1
GROUP
REVENUE GROWTH
INTERNET
REVENUE GROWTH
RECURRING
EBITDA MARGIN
Nearly
10%
28% -
30%
> 0%
1 The expectations are based on a non-binding Business Plan which does not take into account the potential internationalisation of the Group and the acceleration of digital advertising market in France. The retained scenario
assumes a debt restructuring in Q3 2016. Year-on-Year revenue growth (2018 vs 2017) and 2018 recurring EBITDA margin

INVESTOR DAY20
Accelerate Internet growth with a stable client portfolio and an increased
penetration of Digital Marketing
Note: All figures are based on a non-binding Business Plan which does not take into account the potential internationalisation of the Group and the acceleration of digital advertising market in France. The retained scenario
assumes a debt restructuring in Q3 20161 Computed as 2018 penetration rate minus 2015 penetration rate
Local Search
# clients (in thousand)
Digital Marketing
Penetration rate(in %)
Local Search
ARPA(in €)
Key success factors
Sustained monetisation of increasing audience
Accelerated acquisition of high ARPA clients
Optimised client retention
Investment in client acquisition
Scaled and extended innovative offerings (local
programmatic, content based websites and
transactional services)
2015
940
528
22%
2018
1,052
506
30%
CAGR
2015-2018
+4%
-1%
+8pts1
Growth
2017-2018
+4%
+3%
+3pts
Internet
revenues(in millions of euros)
640 764 +6% +10%
Group revenues(in millions of euros) 873 852 -1% +3%
Stabilised client base
Sustainable ARPA growth
Accelerated penetration rate
Group revenue growth thanks to acceleration of Internet
growth and smooth Print & Voice decline

INVESTOR DAY21
Stabilise cost base and deliver sustainable EBITDA margin between 28% and 30%
Note: All figures are based on a non-binding Business Plan which does not take into account the potential internationalisation of the Group and the acceleration of digital advertising market in France. The retained scenario
assumes a debt restructuring in Q3 20161 Taking into account normalisation impact 2 Other costs include G&A, IT and sales administration costs
Cost of Print &
Voice revenues(in millions of euros)
Sales costs(in millions of euros)
Cost of Internet
revenues(in millions of euros)
Key success factors
Investment in 2016 scaled over the plan (2016-2018
CAGR: +7%)
Outsourced direct costs of revenues with scale
thresholds
Scaled sales force with optimised cost of client
acquisition and leveraged client retention
2015
(130)
(45)
(212)
2018
(180)
(27)
(205)
CAGR
2015-2018
+11%
-16%
-1%
Growth
2017-2018
+8%
-16%
+2%
Other costs2
(in millions of euros)
Scaled model through smooth transitioning of Print &
Voice resources towards Internet(207) (192) -3% -2%
Total costs(in millions of euros)
(602)1 (603) 0% +1%
Recurring EBITDA(in millions of euros)
Margin
270
31%
249
29%-3% +9%
Fuel Internet growth while stabilising cost base
Deliver stable and sustainable EBITDA margin between
28% and 30%

INVESTOR DAY22
Cash flow profile before debt service...
Note: All figures are based on a non-binding Business Plan which does not take into account the potential internationalisation of the Group and the acceleration of digital advertising market in France. The retained scenario
assumes a debt restructuring in Q3 2016
1 Free cash flow before debt service and after tax and non recurring items
Free cash flow before
debt service1
(in millions of euros)
CAPEX(in millions of euros)
Key success factors
Support product development keeping AdTech competitive
advantages
Pursue revamping of back office IT platforms with 3 main initiatives
(order to cash, order to publish, client and content referential)
Annual
Target
~ (70) to (75)
Impact
on FCF
Recurring EBITDA(in millions of euros)
Margin
~ 250
~ 29%
Accelerate Internet growth
Focus investments and scale platforms
Change in
Working Capital(in millions of euros)
Manage carefully payment conditions and business models
(subscription based, performance…)~ (10) to 5 ~
Manage to generate ~€90 M of free cash flow before debt service
per annum~90

INVESTOR DAY23
1 Search engine advertising 2 Search engine optimisation 3 Potential cumulated impacts over 4 years. Annual FCF is based on free cash flow before debt service
… but sizeable unexpected market and business risks could significantly
reduce FCF
Local Search
Market
RISK FACTORS
Consolidation or competitor pressure in the
most competitive verticals (Retail and
Services)
POTENTIAL ONE-OFF IMPACTS OF ANNUAL FCF3
(in # of years (y) )
Change in Local Search business model if
increasing penetration of performance-
based products and/or change in Google
SEA1/SEO2 algorithm
Cash Flow Major swing on client working capital
(0,7) y
Print Rise in the price of paper or the cost of other
production factors. Risk of potential close
down of print business
Digital
Marketing
Increasing pricing pressure on Digital
Marketing products if competition gets
fiercer and prices progressively converge
towards US prices
(0,7) y
(1,1) y
(0,5) y
(0,9) y

INVESTOR DAY24
3,8x3,4x
2,2x
0,4x 0,3x 0,1x
(0,1x)
(1,0x)
(5,4x)
3,6x
2,0x
1,3x
(2,6x)
(3,2x) (3,3x)
Digital business profile requiring drastically delevered financial structure
Internet players with media
Internet players without media
Source: Annual reports (FY 2015)1 Average excluding SoLocal Group
Average1 = 0,0x Average = (0,4x)
Net debt / Recurring EBITDA

INVESTOR DAY25
Unchanged current financial structure would lead to a run-off trajectory1
Note: All figures are based on a non-binding Business Plan which does not take into account the potential internationalisation of the Group and the acceleration of digital advertising market in France. The retained scenario
assumes no debt restructuring1 Illustrative scenario assuming no debt restructuring 2 irrespective of current contractual maturities
Free cash flow before
debt service(in millions of euros)
2019
Recurring EBITDA(in millions of euros)
Margin
114
17%
Leverage 10.1x
-41
Net debt2
(in millions of euros)1,179
Group revenues(in millions of euros)
Evolution
667
-8%
Continuous revenue decline with no digital
growth and accelerated Print decline
Continuous client base erosion in absence of
brand revival and investment in audience
growth and client acquisition
Drop of EBITDA margin accordingly
Inability to reimburse any debt
Leverage of 4,2x as of 06/30/2016 reaching
increasing and unsustainable level
Expected negative free cash flow before debt
service from 2019 onwards
Impacts2015
270
31%
3.8x
89
1,109
873
-5%
Financial
Restructuring
Robert de MetzChairman of the Board of
Directors
Jean-Pierre RemyChief Executive Officer

INVESTOR DAY27
Gross Debt reduced by two-thirds, from €1,164m to €400m
100% Take-Up of Rights Issue 0% Take-Up of Rights Issue
4.2x 1.5x
Current
Net Leverage
Pro Forma
Net Leverage
Debt
Pre-transaction
Cash raised to
repay debt (Right
issue of 400M
shares @ €1.00)
Debt-for-Equity
swap (Reserved
capital increase of
81M shares @ €4.73)
Reisntated
debt
In millions of euros
4.2x 1.5x
Current
Net Leverage
Pro Forma
Net Leverage
In millions of euros
Debt
Pre-transaction
Debt-for-Equity
swap (Right issue
backstop: 400M
shares @€1.00)
Debt-for-Equity
swap (Reserved
capital increase of
77M shares @ €2.14)
Reisntated
debt
MCBs @
€2.00
1
Note: Pre-warrants exercise
1 € 20M of cash out of € 400M raised are kept by the company

INVESTOR DAY28
Terms of the capital increase designed to incentivise take-up of the rights
issue by existing shareholders
69% to 83% of total new shares issued by way of rights issueSignificant strengthening of the equity
Rights Issue preserving shareholders preferential subscription
rights:
400m new shares
Issue price of €1.00
Reserved capital increase converting part of creditors’ claims into
equity:
77m to 81m new shares as a function of cash raised via Rights
Issue
Issue price of €2.14 to €4.73, depending upon cash raised via
Rights Issue
Exchange of part of creditors’ claims into MCBs
Up to 100m new shares, depending upon cash raised via Rights
Issue
Conversion price of €2.00 or 100% premium to Rights Issue
price
In addition, allocation of warrants to existing shareholders and
creditors
Shareholders – 39m new shares at a strike price of €1.50
Creditors – 45m to 155m new shares at a strike price of €2.00
100% take-up 0% take-up
Shares from
Rights Issue (m) 400 400
Issue Price (€) 1.00 1.00
Shares from Reserved
Capital Increase (m) 81 77
Issue Price (€) 4.73 2.14
Shares from Conversion of
MCBs (m) - 100
Conversion Price (€) - 2.00
Rights Issue Shares/
Total Shares Issued
Including MCBs 83% 69%
(Pre-Warrants)
Reserved Capital
Increase & MCBs Issue
Price Premium to 373% 106%
Rights Issue Price

INVESTOR DAY29
Warrants (Bons de souscription d’actions)
To Existing
Shareholders
To Creditors
Number issued Strike Price Maturity
39M 1.5 € 24 months
45 to 155M1 2.0 € 60 months
In case of full exercice of the warrants:
Additional capital increase in cash €367 M
% capital held by shareholders2 67.0%
33.0%% capital held by creditors2
1 depending on the subscription in cash to the Rights Issue,2 if the rate of cash subscription by the existing shareholders to the Rights Issue is 100%

INVESTOR DAY30
Existing Shareholders pro forma Ownership in various cases
100% Cash subscription
to the €400 M Rights Issue
0% Cash subscription
to the €400 M Rights Issue
Existing shareholders hold 100% of the Group
with a gross debt of €1,164 M
Before the
financial restructuring plan
Reinstated debt
% capital held by existing
shareholders
before warrant dilutive effect
% capital held by creditors
before warrant dilutive effect
% du capital held by existing
shareholders
after warrant dilutive effect
% du capital held by creditors
after warrant dilutive effect
€400 M €400 M
84.4% 6.3%
15.6 % 93.7 %
67.0 % 11.1%
33.0 % 88.9 %

INVESTOR DAY31
Creditors’ package in various cases
1After considering conversion into capital of MCBs 2 92.5% before conversion into capital of MCBs
100% Cash subscription
to the €400 M Rights Issue
0% Cash subscription
to the €400 M Rights Issue
Gross debt: €1,164 MBefore the
financial restructuring plan
Reinstated debt
Reimbursement in cash
Mandatory convertible bonds (MCB)
% capital held post-restructuring
after warrant dilutive effect1
€400 M €400 M
€380 M €0 M
€0 M €200 M
33.0 % 88.9 %
% capital held post-restructuring
before warrant dilutive effect115.6 % 93.7 %2

INVESTOR DAY32
Key Dates of the Transaction
Plan to be approved by at least 2/3rd of creditors voting in favor of an amendment of the 2014
Sauvegarde Financière Accélérée plan
Plan agreed in principle by creditors representing more than 50% of Solocal’s total debt
Creditors vote envisaged to take place prior to the EGM
Plan to be approved by shareholders in an EGM
Plan already supported by 4 out of the 5 largest shareholders, representing 15% of the share
capital
EGM scheduled on October 19th
Assuming transaction approval by shareholders, creditors and the Commercial Court of Nanterre:
Rights Issue to be launched around November 2Oth
Shareholders will individually decide whether to exercise their subscription rights during the 2-week subscription
period
Closing of the transaction to take place before year-end
1.
2.
3.

Appendices

INVESTOR DAY34
Additional information illustrating the financial restructuring plan envisaged (1/2)
Rights IssueDebt Conversion into
Equity
Reserved Capital
Increase
Reinstated Debt & MCBs
(€m)Shareholders Warrants Creditors Warrants
Participation
Rate
Amount of
Cash
Raised (€m)
Issue PriceAmount
(€m)Issue Price
Amount
(€m)Issue Price
Reinstated
DebtMCBs
# of
Warrants
(m)
Strike Price
# of
Warrants
(m)
Strike Price
- - € 1,00 400 € 1,00 164 € 2,14 400 200 39 € 1,50 45 € 2,00
25% 100 € 1,00 300 € 1,00 251 € 3,19 400 133 39 € 1,50 88 € 2,00
50% 200 € 1,00 200 € 1,00 317 € 3,97 400 67 39 € 1,50 121 € 2,00
75% 300 € 1,00 100 € 1,00 384 € 4,73 400 - 39 € 1,50 155 € 2,00
100% 400 € 1,00 - € 1,00 384 € 4,73 400 - 39 € 1,50 155 € 2,00

INVESTOR DAY35
Additional information illustrating the financial restructuring plan envisaged (2/2)
# of Shares (m) created through: # of Shares (m) created through:
Rights IssueDebt
Conversion
Reserved
Capital
Increase
MCB
Redemption
Shareholders
Warrants
Exercise
Exercise of
Creditors
Warrants
- 39 - 400 77 516 100 39 45 699
100 39 100 300 79 517 67 39 88 711
200 39 200 200 80 519 33 39 121 712
300 39 300 100 81 520 - 39 155 713
400 39 400 - 81 520 - 39 155 713
Amount of
Cash Raised
(€m)
Existing # of
Shares (m)
# of Shares (m)
before dilution
from MCB and
Warrants
# of Shares (m)
after dilution
from MCB and
Warrants

SoLocal GROUP
Immeuble Citylights – Tours du Pont de Sèvres
204 Rond-point du Pont de Sèvres
92100 Boulogne Billancourt
T. 01 46 23 30 93