investor and analyst day presentation - snl financial
TRANSCRIPT

Investor and
Analyst Day
June 27, 2013
Disclaimer
This presentation contains “forward-looking statements” within the meaning of the safe harbor from civil liability provided for such statements by the Private Securities Litigation Reform Act of 1995 (set forth in Section 27A of the Securities Act of 1933, as amended, or the Securities Act, and Section 21E of the Securities Exchange Act of 1934, as amended, or the Exchange Act). In particular, statements pertaining to our capital resources, portfolio size, quality and performance, acquisitions, dispositions, dividend policy and results of operations contain forward-looking statements. Forward-looking statements involve numerous risks and uncertainties and you should not rely on them as predictions of future events. Forward-looking statements depend on assumptions, data or methods which may be incorrect or imprecise and we may not be able to realize them. We do not guarantee that the transactions and events described will happen as described (or that they will happen at all). You can identify forward-looking statements by the use of forward-looking terminology such as “believes,” “expects,” “may,” “should,” “seeks,” “approximately, “intends,” “plans,” “pro forma,” “estimates,” “focus,” “contemplates,” “aims,” “continues,” “would” or “anticipates” or the negative of these words and phrases or similar words or phrases. You can also identify forward-looking statements by discussions of strategies, plans or intentions. The following factors, among others, could cause actual results and future events to differ materially from those set forth or contemplated in the forward-looking statements:
general economic, business and financial conditions, and changes in our industry and changes in the real estate markets in particular; adverse economic and other developments in the Dallas-Fort Worth-Arlington area, where we have a high concentration of properties; general volatility of the capital and credit markets and the demand for and market price of our Class A common stock; changes in our business strategy; defaults on, early terminations of or non-renewal of leases by tenants; bankruptcy or insolvency of a major tenant or a significant number of smaller tenants; increased interest rates or operating costs; declining real estate valuations and impairment charges; availability, terms and deployment of capital; our failure to obtain necessary outside financing; our expected leverage; decreased rental rates or increased vacancy rates; our failure to generate sufficient cash flows to service our outstanding indebtedness; difficulties in identifying properties to acquire and completing acquisitions; risks of real estate acquisitions, dispositions and redevelopment, including the cost of construction delays and cost overruns; our failure to successfully operate acquired properties; our projected operating results; our ability to manage our growth effectively; estimates relating to our ability to make distributions to our shareholders in the future; impact of changes in governmental regulations, tax law and rates and similar matters; our failure to qualify as a REIT; future terrorist attacks in the U.S.; environmental uncertainties and risks related to natural disasters; lack or insufficient amounts of insurance; availability of and our ability to attract and retain qualified personnel; retention of our senior management team; changes in real estate and zoning laws and increases in real property tax rates; our ability to comply with the laws, rules and regulations applicable to companies; and other risk factors, including those detailed in the sections of our most recent Form 10-K and Form 10-Q filed with the SEC titled “Risk Factors.”
You should not place undue reliance on any forward-looking statements, which are based only on information currently available to us (or to third parties making the forward-looking statements). We undertake no obligation to publicly release any revisions to such forward-looking statements to reflect events or circumstances after the date of this presentation, except as required by applicable law.
All information presented on a consolidated basis and as of March 31, 2013, unless otherwise noted. Included in the consolidated operating information presented are the five properties RPAI expects to acquire from the RioCan unconsolidated joint venture on October 1, 2013.
All demographic information is sourced from The Nielsen Company, unless otherwise noted.
2
Agenda
3
Welcome and Introduction – Mike Fitzmaurice, Vice President - Finance
RPAI Overview and Strategy
– Steve Grimes, Chief Executive Officer
Target Market Approach
– Shane Garrison, Chief Operating Officer and Chief Investment Officer
Balance Sheet Strategy
– Angela Aman, Chief Financial Officer and Treasurer

RPAI Overview and
Strategy
Steve Grimes
Accomplishments Since IPO
5
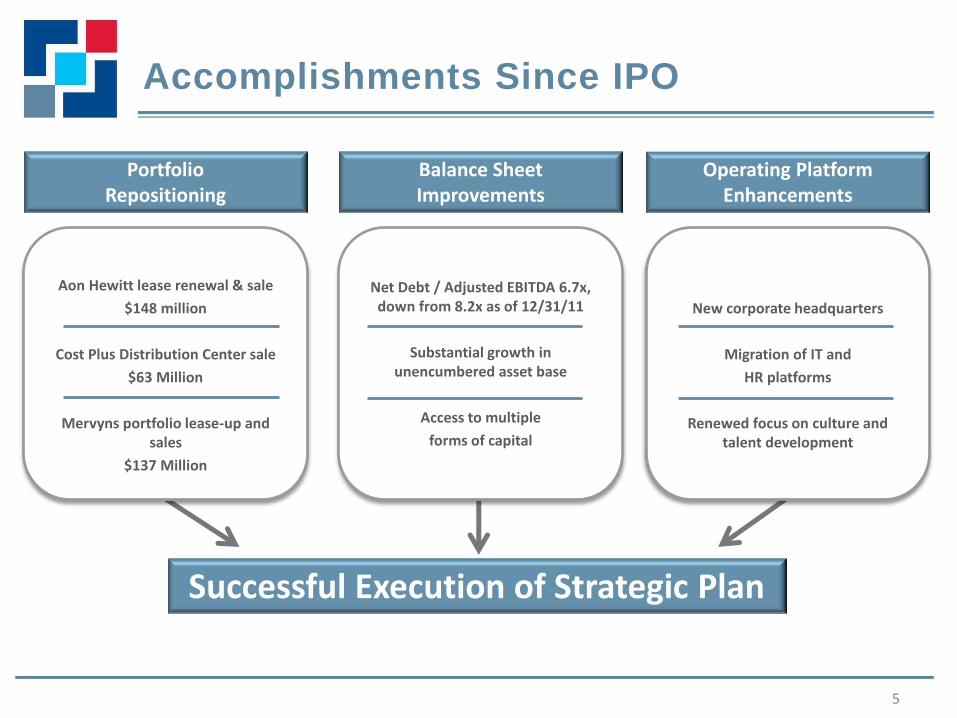
Portfolio Repositioning
Balance Sheet Improvements
Operating Platform Enhancements
Successful Execution of Strategic Plan
Aon Hewitt lease renewal & sale
$148 million
Cost Plus Distribution Center sale
$63 Million
Mervyns portfolio lease-up and sales
$137 Million
New corporate headquarters
Migration of IT and
HR platforms
Renewed focus on culture and talent development
Net Debt / Adjusted EBITDA 6.7x, down from 8.2x as of 12/31/11
Substantial growth in unencumbered asset base
Access to multiple
forms of capital

Execution Has Been Rewarded with Strong
Performance
6
Total Shareholder Return Since IPO%1
1 Based upon closing price on April 5, 2012 through June 25, 2013
13.0%
33.5%
43.1%
79.0%
72.8%
5.0% 5.0% 7.7%
16.4%
11.3%
0.0%
10.0%
20.0%
30.0%
40.0%
50.0%
60.0%
70.0%
80.0%
90.0%
Apr-12 Jun-12 Sep-12 Dec-12 Mar-13 Jun-13

Strategic Goals
7
Portfolio refinement – To continue to refocus our asset base on high quality, multi-
tenant retail assets in strategic markets for RPAI
NOI growth – To improve economic occupancy to 95% by 2015 – To create, through the portfolio refinement process, an asset
base capable of generating consistent same store NOI growth of 2.0-2.5% in a stabilized occupancy environment
Balance sheet progress – To continue to prudently manage our balance sheet in order to
reduce our cost of capital and achieve an investment grade credit rating
Operating portfolio enhancements – To build a best-in-class operating platform through an intense
focus on talent development and the innovative use of technology and systems

Multi-Tenant Retail Portfolio
8
58% of the portfolio is located in the top 30 MSAs and 69% of the portfolio is located in the top 50 MSAs
Anticipate selling nine consolidated multi-tenant retail properties in 2013 with gross proceeds of approximately $200 million – Six of the nine properties are located in MSAs
outside of the top 30
– Average 3-mile population of 60,716 is 23% below our portfolio average
National Platform
Annualized Base Rent (ABR)
More than 5% of ABR 2–5% of ABR
Less than 2% ABR
Well-Balanced Asset Mix (% of ABR)
Power Centers 44%
Neighborhood/
Community Centers
40%
Lifestyle Centers 16%
2013 Disposition Activity
Significant Presence in Top MSAs
Top 5 RPAI Markets
MSA % of ABR
Dallas 16.3%
Baltimore 5.1%
Atlanta 3.8%
Chicago 3.6%
Washington DC 3.4%

Multi-Tenant Retail Portfolio (continued)
9
Southlake Town Center
Strong Demographics Compelling Asset Quality
Seven assets with an average owned GLA per asset of 469,000 square feet – Five assets are anchored or shadow-
anchored by a more traditional power or grocery anchor
Average inline sales productivity of approximately $425 per square foot
Low occupancy cost of approximately 9%
Lifestyle Centers
16% of ABR
65 assets with an average owned gross leasable area (“GLA”) per asset of 242,000 square feet
Strong occupancy trends, with a leased rate of 93.8%
38 assets are anchored or shadow-anchored by Target1
Power
Centers
44% of ABR
102 assets with an average owned GLA per asset of 124,000 square feet
Average grocer sales of approximately $500 per square foot2
Well balanced mix of anchor and inline GLA, with only one-third of portfolio comprised of small shop space
Neighborhood & Community
Centers
40% of ABR
Average 5-mile demographics:
Household income: $102,835
Population: 167,253
Estimated population growth: 6.0% over the next five years
Average 5-mile demographics:
Household income: $76,029
Population: 159,769
Estimated population growth: 4.5% over the next five years
Average 3-mile demographics:
Household income: $73,827
Population: 94,973
Estimated population growth: 4.9% over the next five years
1 Represents all Target locations in consolidated retail portfolio, including the five properties RPAI expects to acquire from the RioCan unconsolidated joint venture on October 1, 2013
2 Represents all grocers in consolidated retail portfolio, including the five properties RPAI expects to acquire from the RioCan unconsolidated joint venture on October 1, 2013

High Quality Portfolio
10
Southlake Town Square Southlake, Texas
Northgate North Seattle, Washington
Shops at Legacy Plano, Texas
Paradise Valley Marketplace Phoenix, Arizona
Southlake Town Square Southlake, Texas

High Quality Portfolio
11
Shops at Legacy Plano, Texas
Commons at Temecula Temecula, California
Lake Mead Crossing Henderson, Nevada
Paradise Shoppes of Warner Robins Kathleen, Georgia
Lincoln Park Dallas, Texas
Fullerton Metrocenter Fullerton, California

High Quality Portfolio
12
Shops at Legacy Plano, Texas
Ashland and Roosevelt Chicago, Illinois
Paradise Shoppes of Warner Robbins Kathleen, Georgia
Eastwood Towne Center Lansing, Michigan
Eastwood Towne Center Lansing, Michigan
Bed Bath and Beyond Plaza Miami, Florida
Azalea Square Summerville, South Carolina
Jefferson Commons Newport News, Virginia
Our Repositioning Objective
13
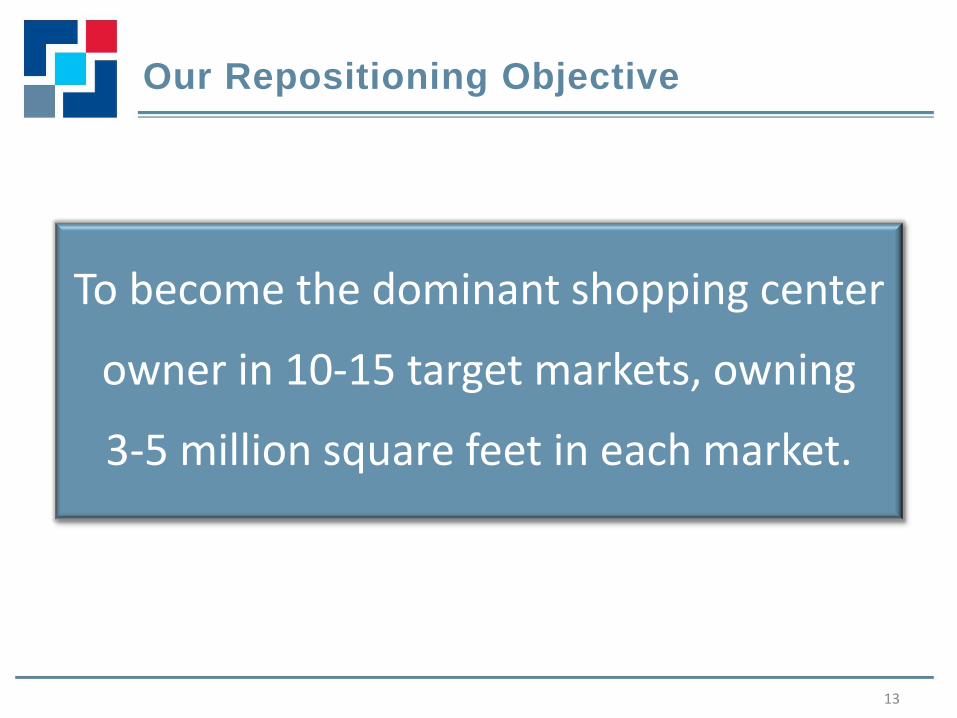
To become the dominant shopping center
owner in 10-15 target markets, owning
3-5 million square feet in each market.

Repositioning Rationale
14
At our scale we are large enough to be relevant to our retailer partners – We have an open dialogue with national retailers
regarding store opening and expansion plans – We have a seat at the table in times of distress
We believe that the path to maximizing same store NOI performance lies in optimizing our local and regional operating platforms – Provides for the best understanding of local market
trends and dynamics, enhancing our ability to drive revenue
– Allows us to more actively manage the leasing of small shop, higher ABR space

Near-term goals – Dispositions
• 2013 is expected to be our last year as a net seller
• We anticipate selling approximately nine consolidated multi-tenant retail assets this year, exiting four markets including Davenport, IA, Warner Robins, GA, Sarasota, FL, and Boston, MA
– Acquisitions • We are looking to source high quality acquisition opportunities, in
our target markets, with good long-term growth potential
• Unencumbered acquisition activity will also advance our goal of becoming investment grade rated
• While the RioCan transaction will allow us to reach the low end of our acquisition guidance range, we continue to pursue strategic acquisition opportunities, some of which may be realized this year
Execution Plan
15

Intermediate to long-term goals
– Dispositions
• Going forward, we will continue to dispose of assets outside of our target markets
• Over the next three years, we can realistically exit as many as 10 states and 40 MSAs, improving portfolio concentration, demographics, and long-term growth potential
– Acquisitions
• Substantially all proceeds from disposition activity beyond 2013 will be redeployed into acquisitions
Execution Plan (continued)
16

Optimizing the Platform
Today
17
26 Assets 6.2 million sq.ft. 16 markets 78% of ABR in
Top 50 MSAs
Regional offices
Top 5 RPAI MSAs: 32% of ABR Top 30 MSAs: 58% of ABR Top 50 MSAs: 69% of ABR
69% of RPAI ABR: Average 3-mile Household Income of $87k and
Population 92k
WEST
50 Assets 9.9 million sq.ft. 25 markets 56% of ABR in
Top 50 MSAs
NORTH
55 Assets 8.4 million sq.ft. 31 markets 60% of ABR in
Top 50 MSAs
EAST
43 Assets 7.2 million sq.ft. 10 markets 87% of ABR in
Top 50 MSAs
SOUTH
Note: Represents consolidated multi-tenant retail portfolio as of 3/31/2013, including the five properties RPAI expects to acquire from the RioCan unconsolidated joint venture on October 1, 2013

Optimizing the Platform
Year-end 2016
18
WEST
NORTH
EAST
SOUTH
Note: Represents consolidated multi-tenant retail portfolio, including the five properties RPAI expects to acquire from the RioCan unconsolidated joint venture on October 1, 2013. Assumes no additional acquisition activity
Exited State

Target Market Characteristics
19
Well-diversified local economy Strong demographic profile
– Significant long-term population growth or above-average existing density
– Low relative cost-of-living – Highly-educated employment base
Fiscal and regulatory environment conducive to business activity and growth
Strong barriers to entry, whether topographical, regulatory, or density driven
Ability to create critical mass and realize operational efficiencies

Target Market
Approach
Shane Garrison

Texas
Positive economic outlook – Substantial net migration of working-age households,
with expected population growth of over 9% in the next five years
– Rising, though still very affordable, housing market – Low cost-of-living with no state income tax
Constructive business environment – Dynamic, well-educated employment base – Unemployment rate below the national average – Positive small business climate as measured by the
Small Business Survival Index (state ranked #3 in 2012)
21
Four of our 10-15 target markets are in Texas, representing 22% of our ABR today

Target Market Approach
22
Seattle 1.0 million sq.ft.
Atlanta 1.4 million sq.ft.
Phoenix 0.8 million sq.ft.
Dallas, Houston, Austin and San
Antonio 6.0 million sq.ft.
Chicago 0.9 million sq.ft.
Baltimore/ Washington DC
2.4 million sq.ft.
New York City/ Long Island
0.4 million sq.ft.
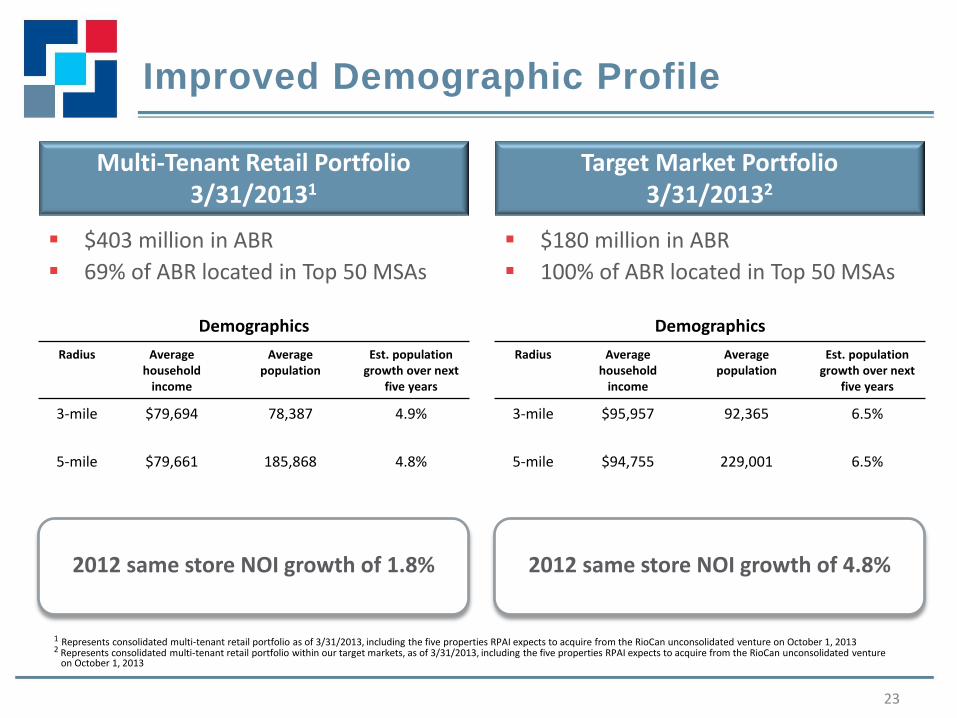
Improved Demographic Profile
23
Demographics
Radius Average household
income
Average population
Est. population growth over next
five years
3-mile $79,694 78,387 4.9%
5-mile $79,661 185,868 4.8%
Target Market Portfolio 3/31/20132
Multi-Tenant Retail Portfolio 3/31/20131
$403 million in ABR
69% of ABR located in Top 50 MSAs
$180 million in ABR
100% of ABR located in Top 50 MSAs
Demographics
Radius Average household
income
Average population
Est. population growth over next
five years
3-mile $95,957 92,365 6.5%
5-mile $94,755 229,001 6.5%
2012 same store NOI growth of 1.8%
2012 same store NOI growth of 4.8%
1 Represents consolidated multi-tenant retail portfolio as of 3/31/2013, including the five properties RPAI expects to acquire from the RioCan unconsolidated venture on October 1, 2013 2 Represents consolidated multi-tenant retail portfolio within our target markets, as of 3/31/2013, including the five properties RPAI expects to acquire from the RioCan unconsolidated venture on October 1, 2013

Long-Term Disposition Profile
24
Over the next decade, we plan to opportunistically sell assets outside of our target markets
We will be patient and prudent with respect to execution, considering both the strategic direction of the asset and the market, as well as the potential cost associated with the early extinguishment of debt
Based on the strong asset quality of the long-term disposition pool, we believe we will be able to minimize the dilution typically associated with portfolio recycling efforts – 45% of the ABR is located in top 50 MSAs with strong 3-mile demographics – 55% of the ABR is generated by highly occupied, well-performing assets
located in smaller markets
MSAs include Los Angeles, Philadelphia,
Miami and Boston
3-mile average population of 91,000 and 3-mile average household income of
$72,000
45% of the ABR is located in Top 50 MSAs
3/31/13 economic occupancy of 92.8% and leased rate of 94.8%
With an average of just over one asset per
MSA, we can quickly reduce our geographic footprint through dispositions of this
portion of the portfolio
55% of the ABR is located outside of Top 50 MSAs

Dallas Portfolio
25
Well-diversified local economy
- Sixth largest MSA based on GDP, with the top 5 industries contributing only 42% of GDP compared to 53% for the US on average
- Home of 19 Fortune 500 companies including Exxon Mobil, AT&T and Southwest Airlines
Strong demographic profile
- 8.8% projected population growth over the next five years versus 3.9% for the US on average
- Low relative cost-of-living at 92% of the US average with the median home price also below the US average
- No state income tax
Fiscal and regulatory environment conducive to business activity and growth
- Unemployment rate of 6.0% remains well below the US average
- Texas ranks very favorably on the Small Business Survival Index (#3), boding well for small shop tenants
Property Count
Gross Leasable
Area
% of Multi-tenant
Retail ABR
ABR PSF
19 4.0 million 16.3% $18.99
Southlake Town Center
Future Market Trends
1 Per REIS
Market Characteristics RPAI Exposure
3-mile demographics: – Average household income of $119,897 – Average population of 71,847 – Average population growth of 9.2% over the next five years
5-mile demographics: – Average household income of $117,674 – Average population of 176,449 – Average population growth of 9.3% over the next five years
Over the next five years, occupancy is expected to increase 160 basis points with new supply increasing 3.5% or 3.0
million square feet, significantly below the market’s population growth rate
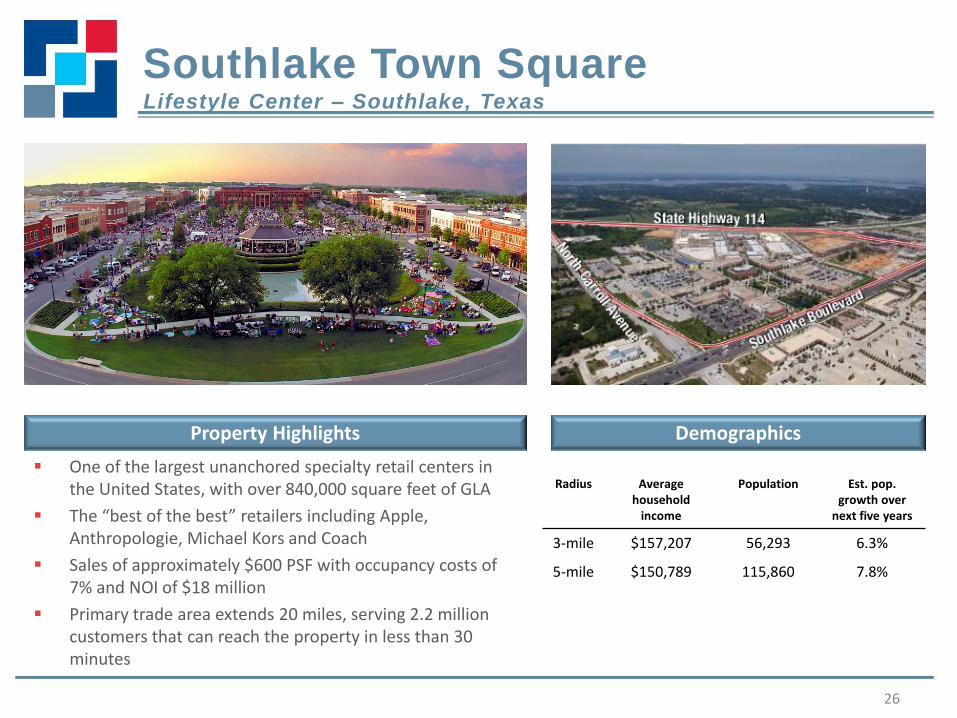
Southlake Town Square Lifestyle Center – Southlake, Texas
26
Paradise Shoppes of Warner Robins
One of the largest unanchored specialty retail centers in the United States, with over 840,000 square feet of GLA
The “best of the best” retailers including Apple, Anthropologie, Michael Kors and Coach
Sales of approximately $600 PSF with occupancy costs of 7% and NOI of $18 million
Primary trade area extends 20 miles, serving 2.2 million customers that can reach the property in less than 30 minutes
Property Highlights
Radius Average household
income
Population Est. pop. growth over
next five years
3-mile $157,207 56,293 6.3%
5-mile $150,789 115,860 7.8%
Demographics
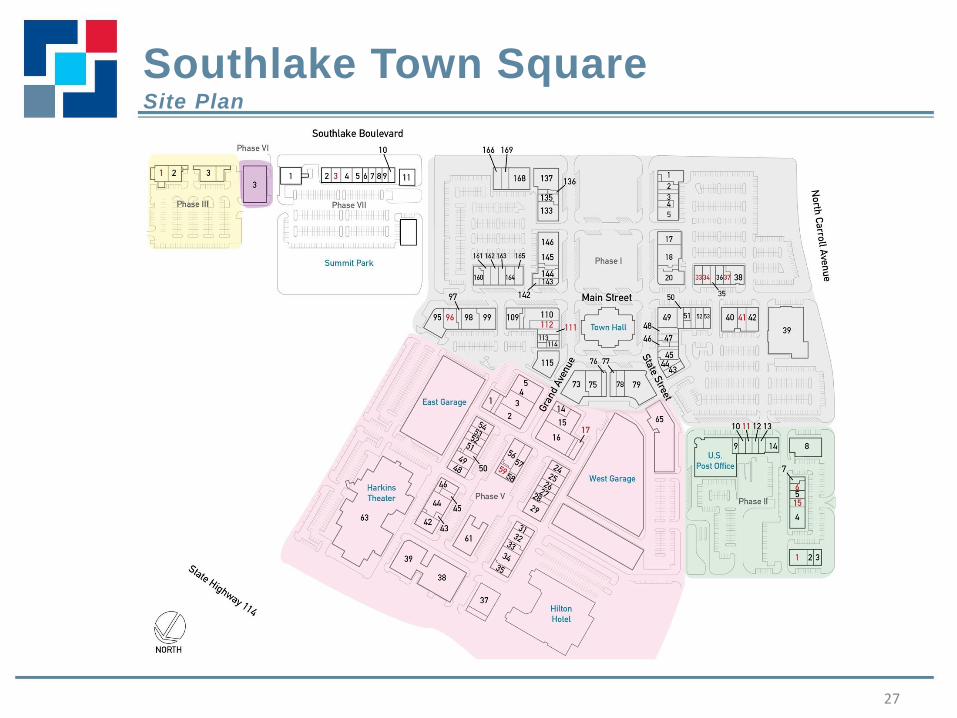
Southlake Town Square Site Plan
27

Well-diversified local economy
- Fifth largest MSA based on GDP, with the top 5 industries contributing only 45% of GDP compared to 53% for the US on average
- Diverse employment base in energy, aeronautical and technology sectors, with 24 Fortune 500 companies including Phillips, Sysco and Halliburton
- Home of the busiest port in the United States (Port of Houston), contributing over one million jobs throughout the state and generating more than $175 billion in statewide economic impact
- Home to the Texas Medical Center, which employs over 100,000 people
Strong demographic profile
- 9.2% projected population growth over the next five years versus 3.9% for the US on average
- Low relative cost-of-living at 92% of the US average with the median home price also below the US average
- No state income tax
Fiscal and regulatory environment conducive to business activity and growth
- Unemployment rate of 5.9% remains well below the US average
- Texas ranks very favorably on the Small Business Survival Index (#3), boding well for small shop tenants
Houston Portfolio
28
Paradise Shoppes of Warner Robins
Southlake Town Center
Colony Square
Property Count
Gross Leasable
Area
% of Multi-tenant
Retail ABR
ABR PSF
9 1.1 million 3.4% $13.16
Southlake Town Center
Future Market Trends
Market Characteristics RPAI Exposure
Over the next five years, occupancy is expected to increase 180 basis points with new supply increasing 4.3% or 3.6
million square feet, significantly below the market’s population growth rate
3-mile demographics: – Average household income of $98,111 – Average population of 97,056 – Average population growth of 8.0% over the next five years
5-mile demographics: – Average household income of $90,826 – Average population of 226,740 – Average population growth of 9.7% over the next five years
1 Per REIS

Sawyer Heights Power Center – Houston, Texas
29
Paradise Shoppes of Warner Robins
Southlake Town Center
Features a solid mix of national and local retailers, with a strong restaurant component
Located within five minutes of the Houston Central Business District and Midtown, with a daytime population exceeding 220,000
325 loft apartments on site, with 96% occupancy
Property Highlights Demographics
Radius Average household
income
Population Est. pop. growth over next five
years
3-mile $88,364 168,335 6.6%
5-mile $83,810 386,936 5.4%

Sawyer Heights Site Plan
30
Paradise Shoppes of Warner Robins
Southlake Town Center
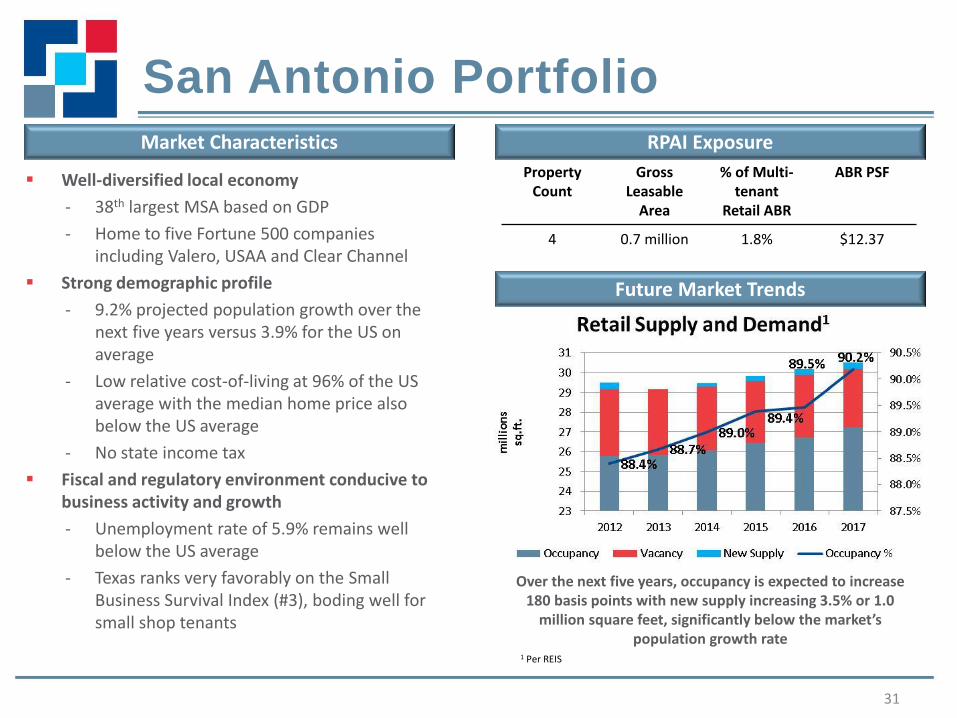
San Antonio Portfolio
31
Huebner Oaks
Well-diversified local economy
- 38th largest MSA based on GDP
- Home to five Fortune 500 companies including Valero, USAA and Clear Channel
Strong demographic profile
- 9.2% projected population growth over the next five years versus 3.9% for the US on average
- Low relative cost-of-living at 96% of the US average with the median home price also below the US average
- No state income tax
Fiscal and regulatory environment conducive to business activity and growth
- Unemployment rate of 5.9% remains well below the US average
- Texas ranks very favorably on the Small Business Survival Index (#3), boding well for small shop tenants
Property Count
Gross Leasable
Area
% of Multi-tenant
Retail ABR
ABR PSF
4 0.7 million 1.8% $12.37
Future Market Trends
Market Characteristics RPAI Exposure
Over the next five years, occupancy is expected to increase 180 basis points with new supply increasing 3.5% or 1.0
million square feet, significantly below the market’s population growth rate
3-mile demographics: – Average household income of $53,837 – Average population of 96,119 – Average population growth of 6.0% over the next five years
5-mile demographics: – Average household income of $57,546 – Average population of 287,064 – Average population growth of 5.9% over the next five years
1 Per REIS
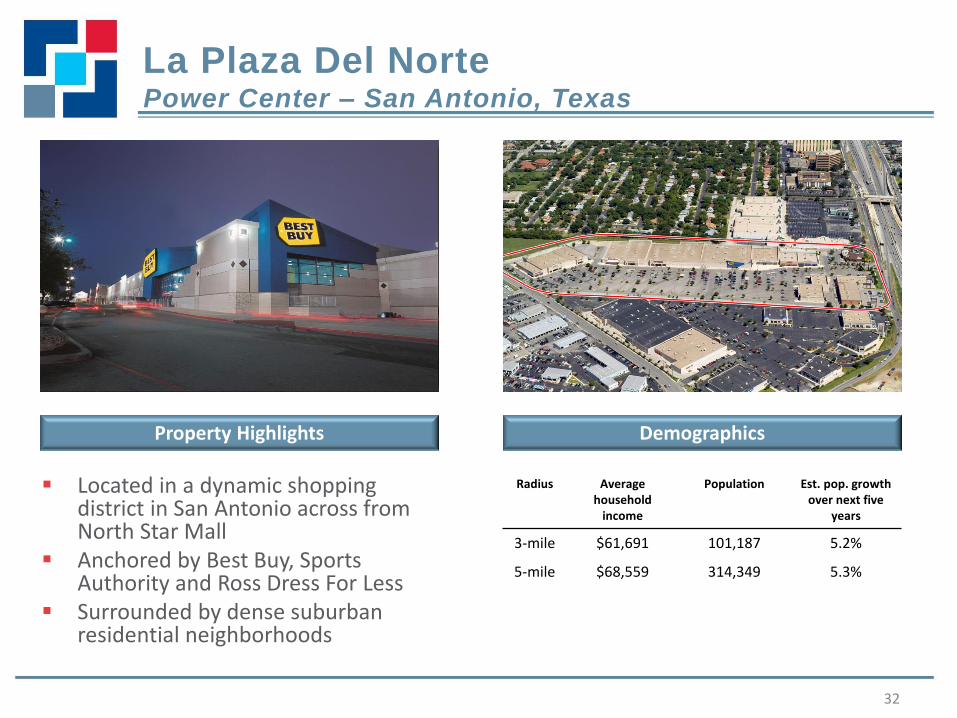
La Plaza Del Norte Power Center – San Antonio, Texas
32
Paradise Shoppes of Warner Robins
Southlake Town Center
Located in a dynamic shopping district in San Antonio across from North Star Mall
Anchored by Best Buy, Sports Authority and Ross Dress For Less
Surrounded by dense suburban residential neighborhoods
Property Highlights
Radius Average household
income
Population Est. pop. growth over next five
years
3-mile $61,691 101,187 5.2%
5-mile $68,559 314,349 5.3%
Demographics

La Plaza del Norte Site Plan
33
Paradise Shoppes of Warner Robins
Southlake Town Center
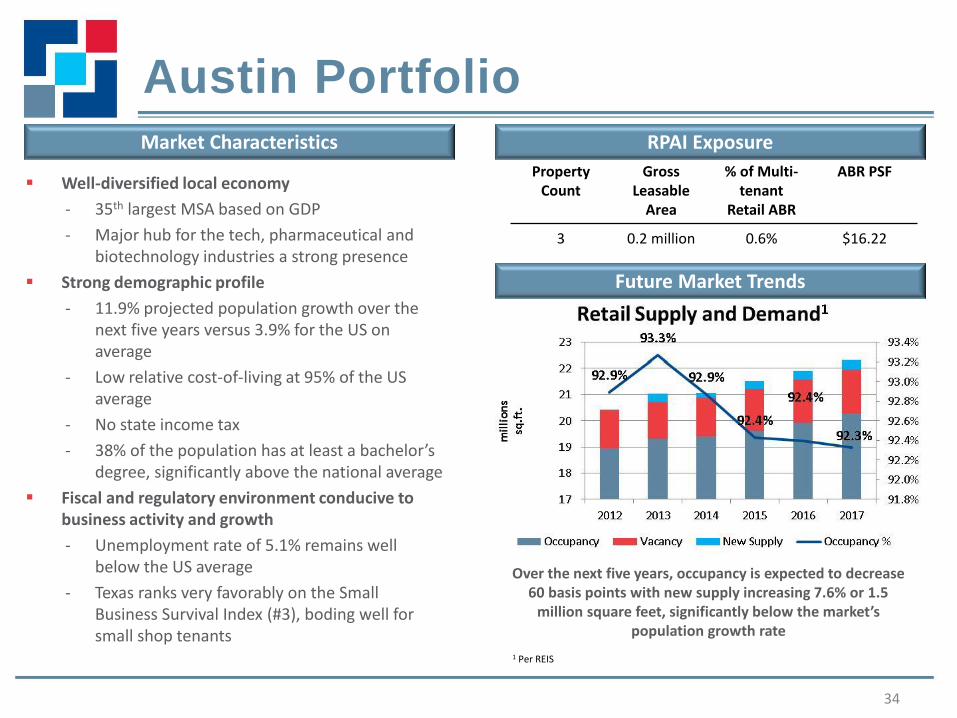
Austin Portfolio
34
Paradise Shoppes of Warner Robins
Well-diversified local economy
- 35th largest MSA based on GDP
- Major hub for the tech, pharmaceutical and biotechnology industries a strong presence
Strong demographic profile
- 11.9% projected population growth over the next five years versus 3.9% for the US on average
- Low relative cost-of-living at 95% of the US average
- No state income tax
- 38% of the population has at least a bachelor’s degree, significantly above the national average
Fiscal and regulatory environment conducive to business activity and growth
- Unemployment rate of 5.1% remains well below the US average
- Texas ranks very favorably on the Small Business Survival Index (#3), boding well for small shop tenants
Property Count
Gross Leasable
Area
% of Multi-tenant
Retail ABR
ABR PSF
3 0.2 million 0.6% $16.22
Future Market Trends
Market Characteristics RPAI Exposure
Over the next five years, occupancy is expected to decrease 60 basis points with new supply increasing 7.6% or 1.5
million square feet, significantly below the market’s population growth rate
3-mile demographics: – Average household income of $110,969 – Average population of 122,593 – Average population growth of 16.0% over the next five years
5-mile demographics: – Average household income of $113,074 – Average population of 277,123 – Average population growth of 17.7% over the next five years
1 Per REIS

Shops at Forest Commons Neighborhood Center – Round Rock, Texas
35
Paradise Shoppes of Warner Robins
Southlake Town Center
Neighborhood center anchored by strong regional grocer, HEB, with an excellent mix of inline retailers
Significant in-place trade area density will be further enhanced by substantial population growth
Property Highlights
Radius Average household
income
Population Est. pop. growth over next five
years
3-mile $86,372 77,603 16.9%
5-mile $77,036 182,892 15.6%
Demographics

Shops at Forest Commons Site Plan
36
Paradise Shoppes of Warner Robins
Southlake Town Center

Seattle Portfolio
37
12th largest MSA based on GDP No state income taxes Economy is driven by significant presence of
technology companies including: Microsoft, Amazon, and Boeing
Region is geographically constrained by water to the west and mountains to the east, significant geographic barriers to entry in the future will drive population density and property values
Northgate North
Paradise Shoppes of Warner Robins
Well-diversified local economy
- 12th largest MSA based on GDP
- Home of eight Fortune 500 companies including Costco, Microsoft and Amazon
Strong demographic profile
- 5.2% projected population growth over the next five years versus 3.9% for the US on average
- 37% of the population has at least a bachelor’s degree, significantly above the national average
Fiscal and regulatory environment conducive to business activity and growth
- Unemployment rate of 5.2% remains well below the US average
- Washington state ranks very favorably on the Small Business Survival Index (#6), boding well for small shop tenants
High barriers to entry
- Region is geographically constrained, creating considerable barriers to entry
- Significant entitlement and zoning barriers
Property Count
Gross Leasable
Area
% of Multi-tenant Retail
ABR
ABR PSF
3 1.0 million 2.6% $13.20
Future Market Trends
Market Characteristics RPAI Exposure
Over the next five years, occupancy is expected to increase 140 basis points with new supply increasing 5.3% or 1.4
million square feet
3-mile demographics: – Average household income of $76,313 – Average population of 63,349 – Average population growth of 4.2% over the next five years
5-mile demographics: – Average household income of $80,674 – Average population of 142,747 – Average population growth of 5.0% over the next five years
1 Per REIS
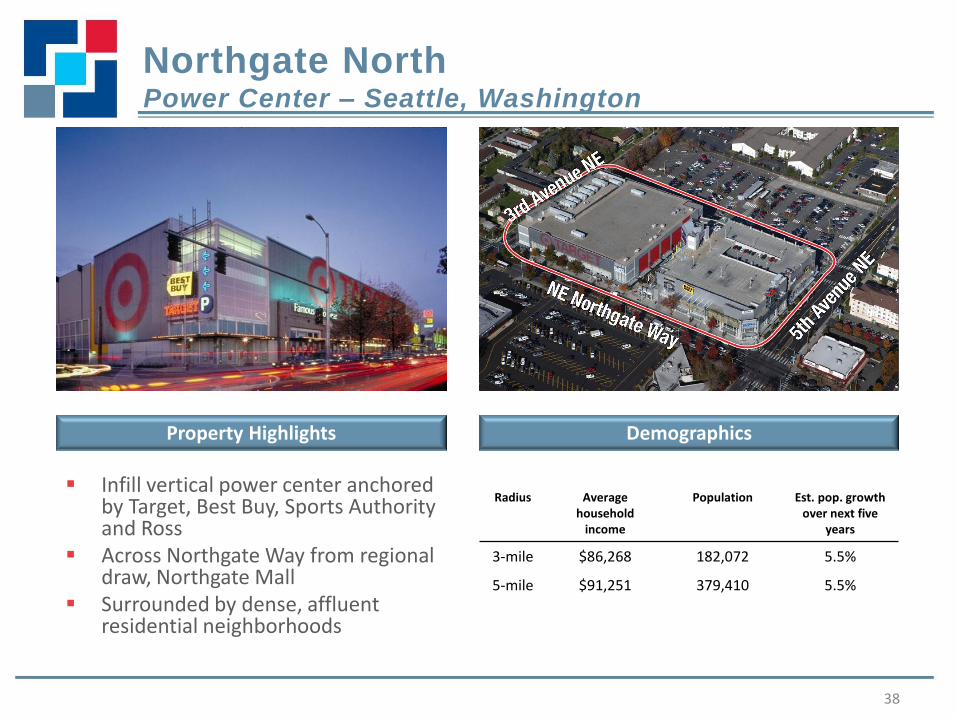
Northgate North Power Center – Seattle, Washington
38
Paradise Shoppes of Warner Robins
Southlake Town Center
Infill vertical power center anchored by Target, Best Buy, Sports Authority and Ross
Across Northgate Way from regional draw, Northgate Mall
Surrounded by dense, affluent residential neighborhoods
Property Highlights
Radius Average household
income
Population Est. pop. growth over next five
years
3-mile $86,268 182,072 5.5%
5-mile $91,251 379,410 5.5%
Demographics

Northgate North Site Plan
39
Paradise Shoppes of Warner Robins
Southlake Town Center

Phoenix Portfolio
40
PRS ABR Property Count 2012 SSNOI Growth
2.2% Wholly Owned: 4 3.4%
Paradise Shoppes of Warner Robins
Southlake Town Center
15th largest MSA based on GDP Phoenix is a top destination for
mission critical companies. The predictable climate low catastrophic risk has attracted many data, technology, and research companies. Additionally the area has developed one of the largest fiber optic networks in the country to support the needs to these companies
300 days of sunshine make Phoenix a major tourism and retirement destination
Paradise Shoppes of Warner Robins
Well-diversified local economy
- 18th largest MSA based on GDP
- Home of six Fortune 500 companies including Avnet, US Airways and PetSmart
Strong demographic profile
- 8.4% projected population growth over the next five years versus 3.9% for the US on average
- Median home price below the US average
- Home of Arizona State University with enrollment of approximately 70,000 students
Fiscal and regulatory environment conducive to business activity and growth
- Unemployment rate of 6.6% remains below the US average
- Arizona ranks very favorably on the Small Business Survival Index (#10), boding well for small shop tenants
Property Count
Gross Leasable
Area
% of Multi-tenant Retail
ABR
ABR PSF
4 0.8 million 2.5% $15.79
Future Market Trends
Market Characteristics RPAI Exposure
Over the next five years, occupancy is expected to increase 270 basis points with new supply increasing 3.6% or 2.5
million square feet, significantly below the market’s population growth rate
3-mile demographics: – Average household income of $61,822 – Average population of 78,561 – Average population growth of 6.2% over the next five years
5-mile demographics: – Average household income of $61,330 – Average population of 249,058 – Average population growth of 5.7% over the next five years
1 Per REIS
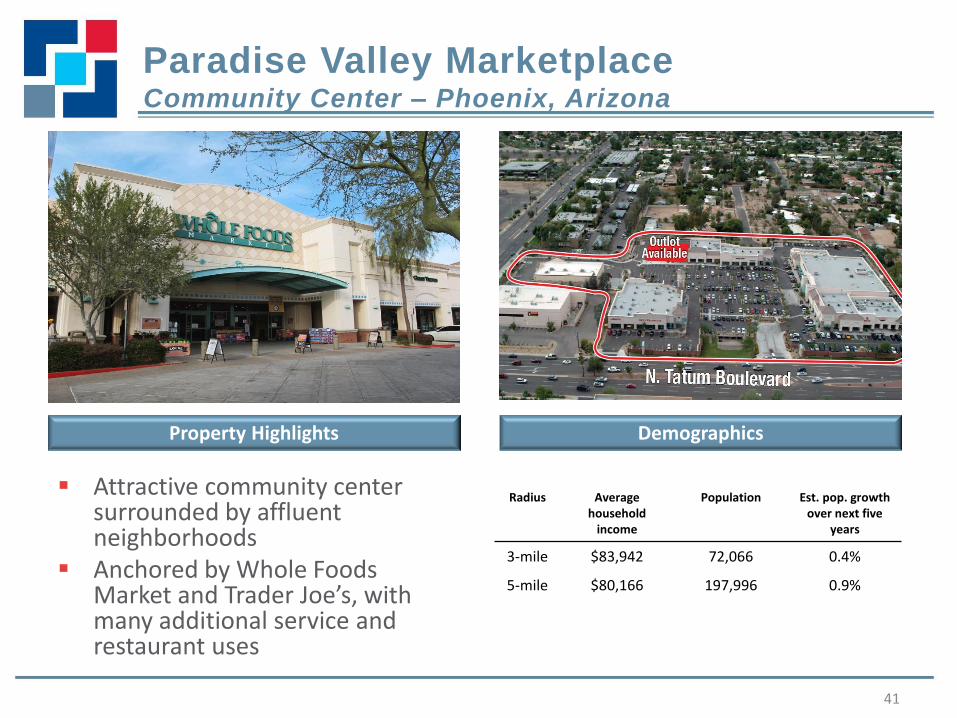
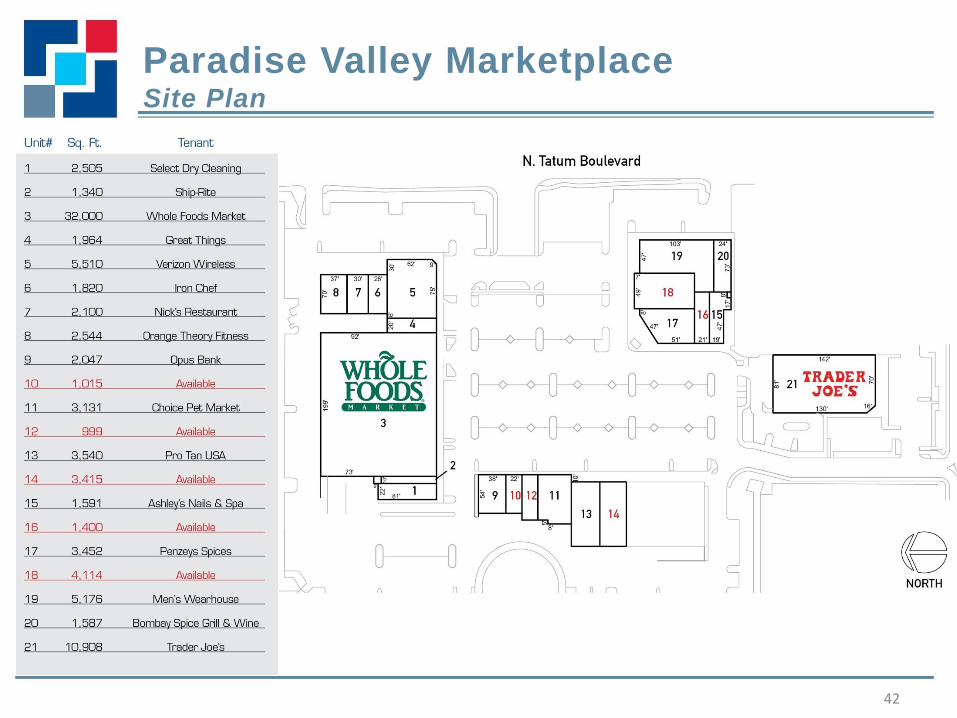
Attractive community center surrounded by affluent neighborhoods
Anchored by Whole Foods Market and Trader Joe’s, with many additional service and restaurant uses
Paradise Valley Marketplace Community Center – Phoenix, Arizona
41
Paradise Shoppes of Warner Robins
Southlake Town Center
Property Highlights
Radius Average household
income
Population Est. pop. growth over next five
years
3-mile $83,942 72,066 0.4%
5-mile $80,166 197,996 0.9%
Demographics
Paradise Valley Marketplace Site Plan
42
Paradise Shoppes of Warner Robins
Southlake Town Center

Atlanta Portfolio
43
10th largest MSA based on GDP Contains the country’s fourth largest
concentration of Fortune 500 companies Home of the world’s busiest airport -
Hartsfield-Jackson Atlanta International Report
Housing remains affordable and cost of living is low
Paradise Shoppes of Warner Robins
Paradise Shoppes of Warner Robins
Well-diversified local economy
- 10th largest MSA based on GDP
- Home of 15 Fortune 500 companies including Home Depot, UPS and Coca-Cola
Strong demographic profile
- 7.9% projected population growth over the next five years versus 3.9% for the US on average
- Low relative cost-of-living at 96% of the US average due in large part to the affordability of housing
- 34% of the population has at least a bachelor’s degree, significantly above the national average
Fiscal and regulatory environment conducive to business activity and growth
- Cost of doing business is 96% of the US average
- Georgia ranks favorably on the Small Business Survival Index (#21), boding well for small shop tenants
Property Count
Gross Leasable
Area
% of Multi-tenant
Retail ABR
ABR PSF
9 1.4 million 3.8% $11.47
Future Market Trends
Market Characteristics RPAI Exposure
Over the next five years, occupancy is expected to increase 250 basis points with new supply increasing 3.3% or 2.7
million square feet, significantly below the market’s population growth rate
3-mile demographics: – Average household income of $71,470 – Average population of 34,301 – Average population growth of 7.1% over the next five years
5-mile demographics: – Average household income of $70,062 – Average population of 83,030 – Average population growth of 6.6% over the next five years
1 Per REIS
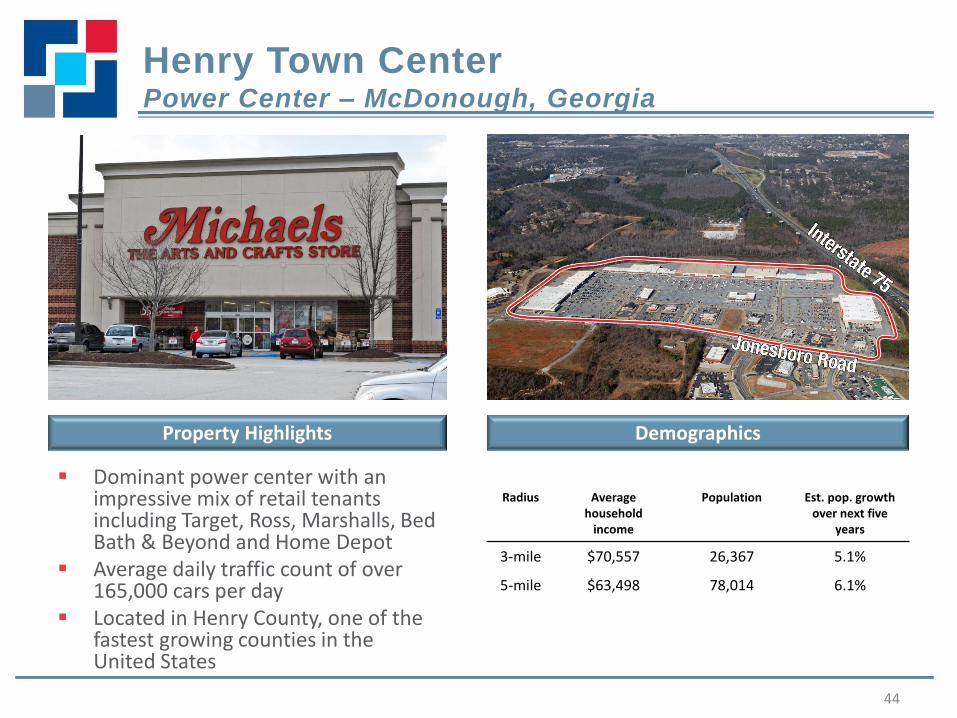
Dominant power center with an impressive mix of retail tenants including Target, Ross, Marshalls, Bed Bath & Beyond and Home Depot
Average daily traffic count of over 165,000 cars per day
Located in Henry County, one of the fastest growing counties in the United States
Henry Town Center Power Center – McDonough, Georgia
44
Paradise Shoppes of Warner Robins
Southlake Town Center
Property Highlights
Radius Average household
income
Population Est. pop. growth over next five
years
3-mile $70,557 26,367 5.1%
5-mile $63,498 78,014 6.1%
Demographics
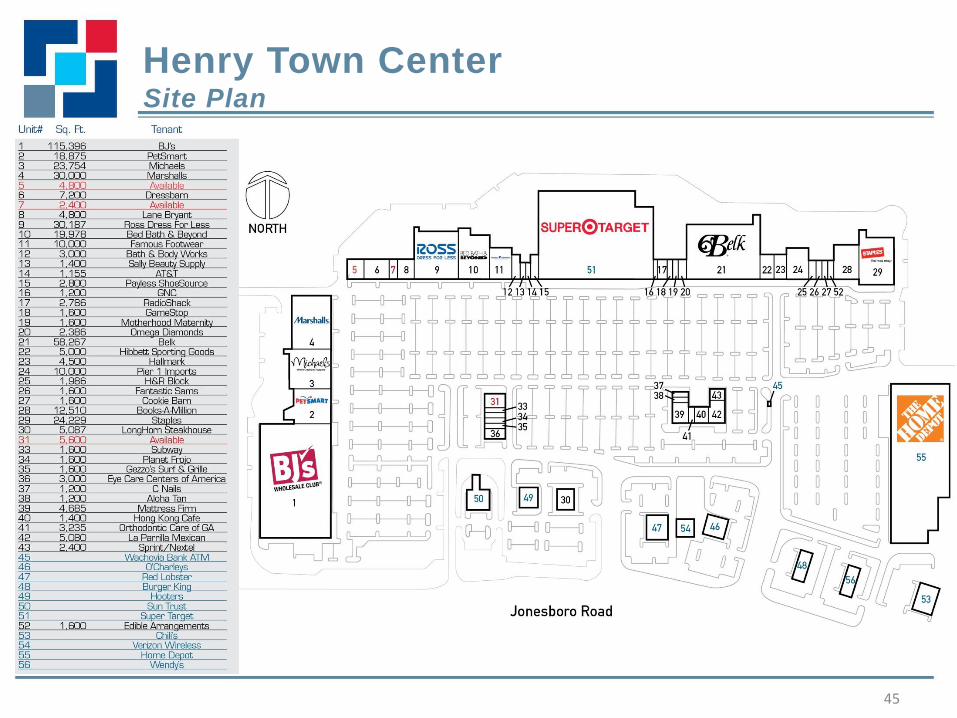
Henry Town Center Site Plan
45
Paradise Shoppes of Warner Robins
Southlake Town Center

Baltimore/Washington D.C. Portfolio
46
19th and 4th largest MSAs based on GDP
DC workforce is highly linked to the Federal Government which provides approximately 30% of area jobs
Baltimore has undergone a transformation from a mostly industrial economy to a more diversified base
Population is highly educated and the area is home to many top Universities including Georgetown, George Washington, and Johns Hopkins
Well-diversified local economy
- 19th (Baltimore) and 4th (D.C.) largest MSAs based on GDP, with the top 5 industries contributing only 42% of the GDP compared to 53% for the US on average
- Home of 18 Fortune 500 companies including Capital One, Marriott International and Lockheed Martin
Strong demographic profile
- 4.8% projected population growth over the next five years versus 3.9% for the US on average
- 43% of the population has at least a bachelor’s degree, significantly above the national average
- Home to many top universities including Georgetown, George Washington, and Johns Hopkins
Fiscal and regulatory environment conducive to business activity and growth
- Unemployment rate of 5.9% remains well below the US average
Property Count
Gross Leasable
Area
% of Multi-tenant
Retail ABR
ABR PSF
8 2.4 million 8.5% $15.77
Future Market Trends - Baltimore
Market Characteristics RPAI Exposure
Over the next five years, occupancy is expected to increase 210 basis points with new supply increasing 4.3% or 1.5
million square feet, below the market’s population growth rate
3-mile demographics: – Average household income of $94,051 – Average population of 93,195 – Average population growth of 3.0% over the next five years
5-mile demographics: – Average household income of $92,255 – Average population of 230,212 – Average population growth of 3.2% over the next five years
1 Per REIS

Gateway Village Community Center – Annapolis, Maryland
47
Paradise Shoppes of Warner Robins
Southlake Town Center
Infill community center with tier one tenants including Safeway, Best Buy, and PetSmart
Significant zoning and topographical barriers
Property Highlights
Radius Average household
income
Population Est. pop. growth over next five
years
3-mile $120,193 40,331 6.5%
5-mile $120,116 104,255 4.4%
Demographics

Gateway Village Site Plan
48
Paradise Shoppes of Warner Robins
Southlake Town Center
Chicago Portfolio
49
3rd largest MSA based on GDP Home to the second largest CBD
in the country Well diversified economy, with
concentrations of both professional services and industrial companies
Home to the largest futures and commodities exchanges in the county, the city serves as a financial hub to the Midwest
Roughly 25% of all domestic rail traffic originates, terminates, or passes through Chicago
Paradise Shoppes of Warner Robins
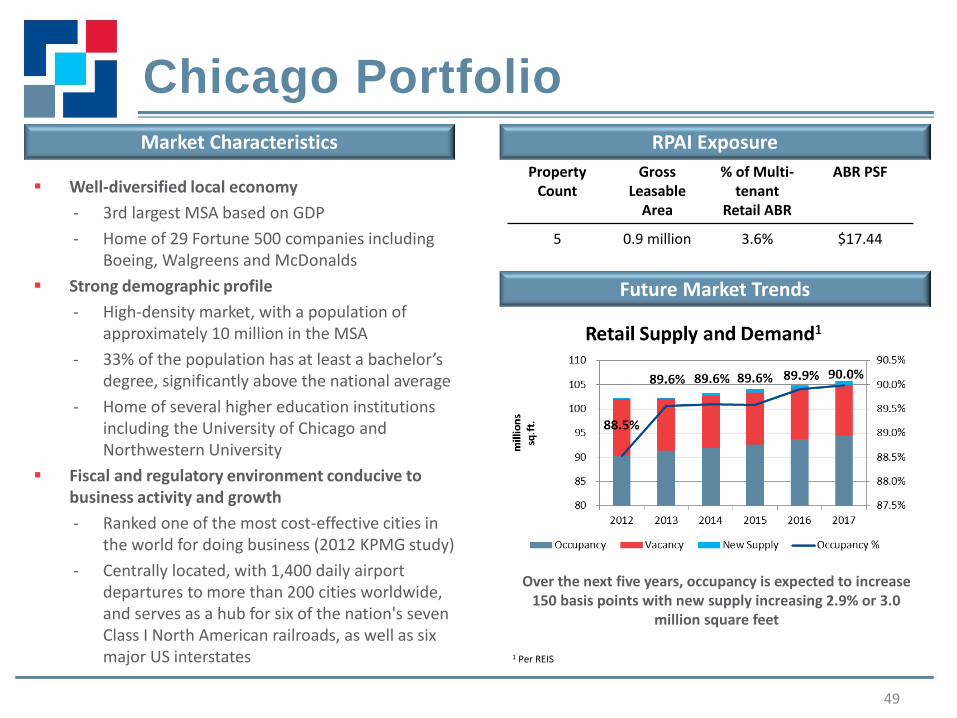
Well-diversified local economy
- 3rd largest MSA based on GDP
- Home of 29 Fortune 500 companies including Boeing, Walgreens and McDonalds
Strong demographic profile
- High-density market, with a population of approximately 10 million in the MSA
- 33% of the population has at least a bachelor’s degree, significantly above the national average
- Home of several higher education institutions including the University of Chicago and Northwestern University
Fiscal and regulatory environment conducive to business activity and growth
- Ranked one of the most cost-effective cities in the world for doing business (2012 KPMG study)
- Centrally located, with 1,400 daily airport departures to more than 200 cities worldwide, and serves as a hub for six of the nation's seven Class I North American railroads, as well as six major US interstates
Property Count
Gross Leasable
Area
% of Multi-tenant
Retail ABR
ABR PSF
5 0.9 million 3.6% $17.44
Future Market Trends
Market Characteristics RPAI Exposure
Over the next five years, occupancy is expected to increase 150 basis points with new supply increasing 2.9% or 3.0
million square feet
3-mile demographics: – Average household income of $79,814 – Average population of 225,220 – Average population growth of 1.3% over the next five years
5-mile demographics: – Average household income of $77,212 – Average population of 551,138 – Average population growth of 1.2% over the next five years
1 Per REIS

The Brickyard Community Center – Chicago, Illinois
50
Paradise Shoppes of Warner Robins
Southlake Town Center
Includes a strong mix of grocery and general merchandise tenants including Jewel/Osco, Target, Lowes, Marshalls and Pier 1 Imports, with additional restaurant and service uses
High-density, infill location with population approaching 1 million within a 5-mile radius
Property Highlights
Radius Average household
income
Population Est. pop. growth over next five
years
3-mile $64,456 367,974 0.3%
5-mile $62,043 925,883 0.2%
Demographics

The Brickyard Site Plan
51
Paradise Shoppes of Warner Robins
Southlake Town Center

New York/Long Island Portfolio
52
38th largest MSA based on GDP Home to five fortune 500
companies Home to one of the largest
military concentrations in the country, the defense industry employs over 89,000 and has $5 billion impact on the economy
The city of San Antonio has aggressively annexed neighboring municipalities and narrow land parcels bounding major thoroughfares to help promote orderly growth in the region
Huebner Oaks
Well-diversified local economy
- Largest MSA in the US based on GDP
- Home to 84 Fortune 500 companies including General Electric, Verizon, JP Morgan Chase, IBM and Citigroup
Strong demographic profile
- Most densely populated major metropolitan area in the US with a population of approximately 19 million in the MSA
- 36% of the population has at least a bachelor’s degree, significantly above the national average
- Home of several higher education institutions including NYU, Columbia University and Fordham University
High barriers to entry
- Favorable topography prevents significant additional development
Property Count
Gross Leasable
Area
% of Multi-tenant
Retail ABR
ABR PSF
3 0.4 million 1.5% $17.66
Market Characteristics RPAI Exposure
Over the next five years, occupancy is expected to increase 40 basis points with new supply increasing 4.1% or 1.9
million square feet
3-mile demographics: – Average household income of $96,743 – Average population of 93,829 – Average population growth of 2.2% over the next five years
5-mile demographics: – Average household income of $108,827 – Average population of 242,133 – Average population growth of 1.6% over the next five years
1 Per REIS
Future Market Trends – Northern NJ, Long Island

Gardiner Manor Mall1 Power Center – Bay Shore, New York
53
Paradise Shoppes of Warner Robins
Southlake Town Center
Property Highlights Demographics
Power center anchored by Target and King Kullen
Major tenants include Modell’s, Old Navy, Staples, Barnes & Noble, Michaels and HomeGoods
Surrounded by dense residential neighborhoods
Radius Average household
income
Population Est. pop. growth over next five
years
3-mile $98,688 113,518 0.1%
5-mile $97,501 285,798 0.9%
1 Asset owned by our MS Inland unconsolidated joint venture

54
Paradise Shoppes of Warner Robins
Southlake Town Center
Gardiner Manor Mall Site Plan

Acquisition Criteria
55
We are focused on unlevered risk-adjusted returns Opportunities will be evaluated within the context of
our strategic plan – Unique adjacencies to existing assets and overall
enhancement to our operating platform will be key considerations
– We will remain agnostic to multi-tenant retail property type (power, grocery-anchored, or lifestyle)
Over the last several months, we have evaluated over $1.2 billion of potential transactions, comprised of 24 individual assets – We have bid on over $350 million of potential transactions,
which we are actively pursuing

Balance Sheet
Strategy
Angela Aman

Solid Track Record of Balance Sheet Execution
57
ATM Program
Established a $200
million at-the-market
equity program
Credit Facility
Recast credit facility
from secured to
unsecured and
upsized to $650
million
Feb 2012
Preferred Equity
Closed inaugural 7%
preferred equity offering in
December 2012 and repaid
mezzanine loans with interest
rates of 12% and 14%
Initial Public
Offering
Raised $293 million
of gross proceeds
Mar 2013 May 2013 Apr 2012 Dec 2012
Dispositions
During 2012, we sold 36
non-core and non-strategic
properties for gross
proceeds of $492 million
Leverage
Reduced net debt to
adjusted EBITDA ratio
from 8.2x in 4Q 2011 to
6.7x in 1Q 2013
Credit Facility
Upsized credit facility
to $1 billion,
improved pricing, and
extended maturity by
two years

Significant Improvement in Credit Metrics
58
Leverage Ratio1 Net Debt / Adjusted EBITDA
Secured Debt / Gross Assets2 Fixed Charge Coverage1
8.2x 8.3x
7.6x7.3x
6.6x 6.7x
6.0x
6.5x
7.0x
7.5x
8.0x
8.5x
9.0x
Q4'11 Q1'12 Q2'12 Q3'12 Q4'12 Q1'13
1.55x1.60x
1.70x1.73x
1.87x 1.87x
1.50x
1.60x
1.70x
1.80x
1.90x
2.00x
Q4'11 Q1'12 Q2'12 Q3'12 Q4'12 Q1'13
1 Chart included solely to show historical compliance with covenant requirements of our unsecured credit facility and should not be viewed as a measure of our historical or future financial performance, financial position or cash flow 2 Gross Assets is defined as Total Investment Properties excluding the effect of accumulated depreciation
58.1% 57.4%
52.8% 51.5%
47.1%
45.5%
44.0%
47.0%
50.0%
53.0%
56.0%
59.0%
Q4'11 Q1'12 Q2'12 Q3'12 Q4'12 Q1'13
54.0%
44.1% 42.1%
38.6% 37.1%
34.3%
30.0%
35.0%
40.0%
45.0%
50.0%
55.0%
Q4'11 Q1'12 Q2'12 Q3'12 Q4'12 Q1'13

Investment Grade Migration
Publicly committed to the goal of becoming an investment grade rated company in April 2012
In addition to improving our overall cost of capital, investment grade migration will: – Improve operational efficiency by eliminating lender approval process
on unencumbered assets and streamlining compliance procedures – Assist with portfolio repositioning efforts – Provide for more efficient management of cash balances
Key hurdles (assuming no additional acquisition activity): – Continue to grow unencumbered NOI; expect to exceed 50%
unencumbered NOI by mid-2015 – Reduce secured debt levels; anticipate secured debt to gross assets
will be less than 30% by early 2014 – Increase fixed charge coverage ratio; expect to exceed 2.0x by early
2014
59
60
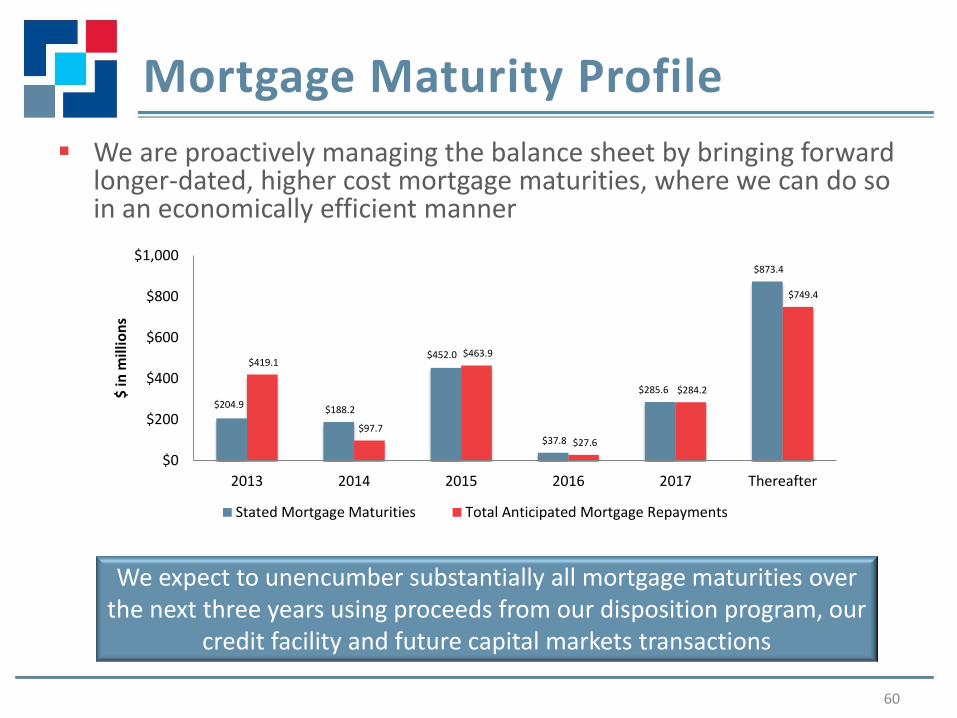
$204.9 $188.2
$452.0
$37.8
$285.6
$873.4
$419.1
$97.7
$463.9
$27.6
$284.2
$749.4
$0
$200
$400
$600
$800
$1,000
2013 2014 2015 2016 2017 Thereafter
$ in
mill
ion
s
Stated Mortgage Maturities Total Anticipated Mortgage Repayments
Mortgage Maturity Profile
We expect to unencumber substantially all mortgage maturities over the next three years using proceeds from our disposition program, our
credit facility and future capital markets transactions
We are proactively managing the balance sheet by bringing forward longer-dated, higher cost mortgage maturities, where we can do so in an economically efficient manner
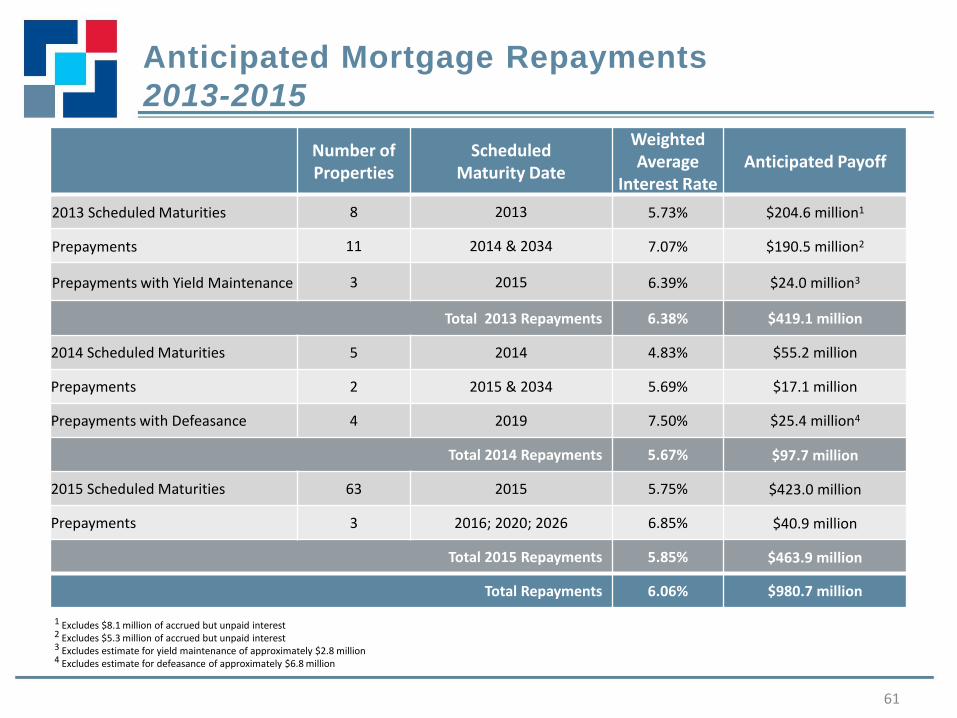
Anticipated Mortgage Repayments
2013-2015
61
Number of Properties
Scheduled Maturity Date
Weighted Average
Interest Rate Anticipated Payoff
2013 Scheduled Maturities 8 2013 5.73% $204.6 million1
Prepayments 11 2014 & 2034 7.07% $190.5 million2
Prepayments with Yield Maintenance 3 2015 6.39% $24.0 million3
Total 2013 Repayments 6.38% $419.1 million
2014 Scheduled Maturities 5 2014 4.83% $55.2 million
Prepayments 2 2015 & 2034 5.69% $17.1 million
Prepayments with Defeasance 4 2019 7.50% $25.4 million4
Total 2014 Repayments 5.67% $97.7 million
2015 Scheduled Maturities 63 2015 5.75% $423.0 million
Prepayments 3 2016; 2020; 2026 6.85% $40.9 million
Total 2015 Repayments 5.85% $463.9 million
Total Repayments 6.06% $980.7 million
1 Excludes $8.1 million of accrued but unpaid interest 2 Excludes $5.3 million of accrued but unpaid interest 3 Excludes estimate for yield maintenance of approximately $2.8 million 4 Excludes estimate for defeasance of approximately $6.8 million

Capital Structure Positioned for Growth
62
During the second quarter of 2013, we increased our financial capacity by $434 million through the $350 million expansion of our credit facility and the issuance of $84 million in common equity through our ATM program1
These transactions have significantly mitigated the execution risk associated with our planned investment grade migration and have positioned us well for growth
$535 $403
$200
$45
$116
$466
$88
$0
$200
$400
$600
$800
$1,000Ample Liquidity for Upcoming Maturities
Line of Credit Availability 2013 Estimated Remaining Net Disposition Proceeds
Remaining ATM Capacity Cash and Other
$939 million of liquidity1
Ample Liquidity for Upcoming 2013-2015 Maturities (in millions)
$185
$350
$535 $67
$67
$200
$200
$84 $84
$-
$200
$400
$600
$800
$1,000
3/31/13Liquidity
Q2 Capitaltransactions
Pro formaliquidity
$886 million
Upsized credit facility by $350
million
Line of credit availability
$452 million
(in
mill
ion
s)
Issued $84 million under the ATM
Cash
Estimated 2013 net disposition proceeds
1 Common equity issued during the second quarter was at an average share price of $15.30
ATM proceeds
Appendix
Non-GAAP Reconciliations
63

Non-GAAP Financial Measures and Other Definitions
Net Operating Income (NOI) We define Net Operating Income (NOI) as operating revenues (rental income, tenant recovery income, other property income, excluding straight-line rental income, amortization of lease inducements and amortization of acquired above and below market lease intangibles) less property operating expenses (real estate tax expense and property operating expense, excluding straight-line ground rent expense and straight-line bad debt expense). We believe that NOI is a useful measure of our operating performance. Other REITs may use different methodologies for calculating NOI, and accordingly, our NOI may not be comparable to other REITs. We believe that NOI provides an operating perspective not immediately apparent from GAAP operating income or net (loss) income attributable to common shareholders. We use NOI to evaluate our performance on a property-by-property basis because this measure allows management to evaluate the impact that factors such as lease structure, lease rates and tenant base, which vary by property, have on our operating results. However, this measure should only be used as an alternative measure of our financial performance. Same Store NOI and NOI from Other Investment Properties Same Store NOI represents NOI from our same store portfolio consisting of 239 operating properties acquired or placed in service prior to January 1, 2011, except for the three operating properties that were classified as held for sale as of December 31, 2012, which are accounted for as discontinued operations. NOI from Other Investment Properties represents NOI primarily from our development properties, two additional phases of existing properties acquired during the third quarter of 2011, two non-stabilized operating properties and one property that was partially sold to our RioCan joint venture during the third quarter of 2011, which did not qualify for discontinued operations accounting treatment. In addition, we have included University Square in “Other investment properties” due to the uncertainty of the timing of transfer of ownership of this property. Prior to the quarter ended June 30, 2012, we had included University Square in the same store portfolio. NOI consists of the sum of Same Store NOI and NOI from Other Investment Properties. NOI from Discontinued Operations represents NOI associated with properties accounted for as discontinued operations. We believe that Same Store NOI, NOI from Other Investment Properties and NOI from Discontinued Operations are useful measures of our operating performance. Other REITs may use different methodologies for calculating these metrics, and accordingly, our NOI metrics may not be comparable to other REITs. We believe that these metrics provide an operating perspective not immediately apparent from GAAP operating income or net (loss) income. We use these metrics to evaluate our performance on a property-by-property basis because these measures allow management to evaluate the impact that factors such as lease structure, lease rates and tenant base, which vary by property, have on our operating results. However, these measures should only be used as an alternative measure of our financial performance. Adjusted EBITDA Adjusted EBITDA represents net income (loss) attributable to common shareholders before interest, income taxes, depreciation and amortization, as further adjusted to eliminate the impact of certain items that we do not consider indicative of our ongoing performance. We believe that Adjusted EBITDA is useful because it allows investors and management to evaluate and compare our performance from period to period in a meaningful and consistent manner in addition to standard financial measurements under GAAP. Adjusted EBITDA is not a measurement of financial performance under GAAP and should not be considered as an alternative to net income attributable to common shareholders, as an indicator of operating performance or any measure of performance derived in accordance with GAAP. Our calculations of Adjusted EBITDA may be different from the calculation used by other companies and, accordingly, comparability may be limited. Net Debt to Adjusted EBITDA Net Debt to Adjusted EBITDA represents (i) our total debt less cash and cash equivalents divided by (ii) Adjusted EBITDA for the prior three months, annualized. We believe that this ratio is useful because it provides investors with information regarding total debt net of cash and cash equivalents, which could be used to repay debt, compared to our performance as measured using Adjusted EBITDA.
64

Reconciliation of Net (Loss) Income Attributable to Common Shareholders to Adjusted EBITDA1
65
Three Months
Ended
Twleve
Months Ended2
Twelve
Months Ended2
Three Months
Ended
Three Months
Ended
Three Months
Ended
December 31,
2011 March 31, 2012
June 30,
2012
September 30,
2012
December 31,
2012 March 31, 2013
Net (loss) income attributable to common shareholders (13,837)$ (48,872)$ (17,472)$ (15,952)$ 13,854$ (4,242)$
Net income attributable to noncontrolling interests 8 23 15 - - -
Preferred stock dividends - - - - 263 2,362
Interest expense 57,034 226,105 210,943 51,165 44,844 47,127
Depreciation and amortization 58,567 236,366 234,970 57,479 55,416 54,464
Gain on sales of investment properties, net (7,566) (25,890) (33,956) (10,406) (14,814) (9,173)
Gain on extinguishment of debt, net (1,276) (9,861) (6,146) - - -
Loss on lease terminations 577 9,716 7,621 970 458 352
Provision for impairment of investment properties 8,229 9,608 10,931 22,167 2,352 -
Recognized gain on marketable securities, net - (277) (7,265) (9,108) (9,467) -
Adjusted EBITDA 101,736$ 396,918$ 399,641$ 96,315$ 92,906$ 90,890$
Annualized 406,944$ 396,918$ 399,641$ 385,260$ 371,624$ 363,560$
1Balances are inclusive of amounts from discontinued operations2For purposes of these ratio calculations, figures for the twelve months ended were used
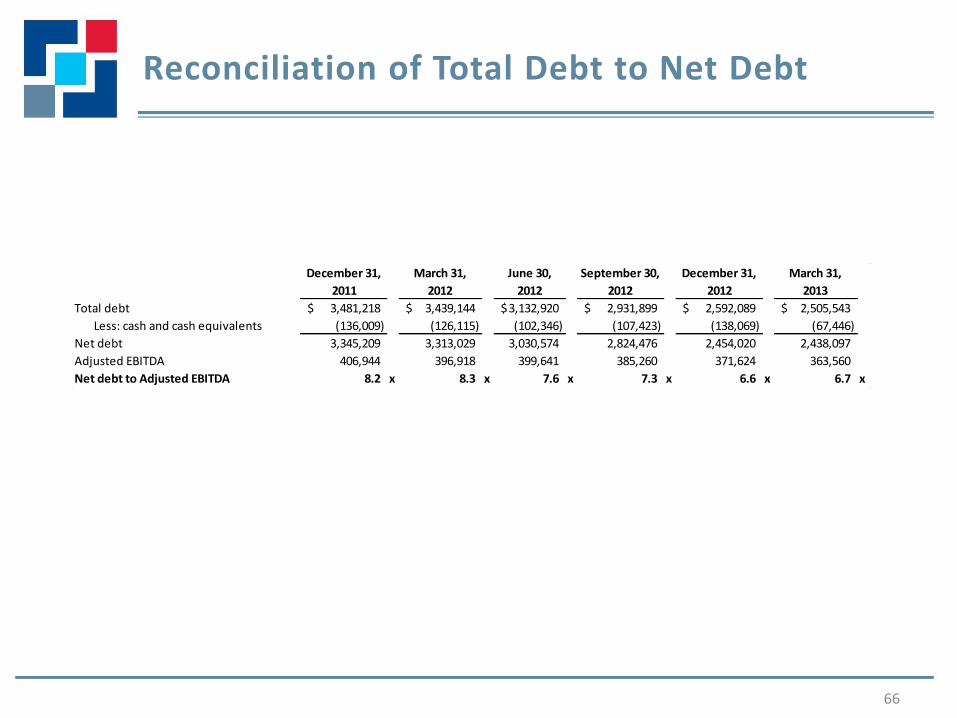
Reconciliation of Total Debt to Net Debt
66
December 31,
2011
March 31,
2012
June 30,
2012
September 30,
2012
December 31,
2012
March 31,
2013
Total debt 3,481,218$ 3,439,144$ 3,132,920$ 2,931,899$ 2,592,089$ 2,505,543$
Less: cash and cash equivalents (136,009) (126,115) (102,346) (107,423) (138,069) (67,446)
Net debt 3,345,209 3,313,029 3,030,574 2,824,476 2,454,020 2,438,097
Adjusted EBITDA 406,944 396,918 399,641 385,260 371,624 363,560
Net debt to Adjusted EBITDA 8.2 x 8.3 x 7.6 x 7.3 x 6.6 x 6.7 x

Reconciliation of Net Loss Attributable to Common Shareholders to NOI
67
Year Ended
December 31,
2012 2011
Revenues:
Same store investment properties (239 properties):
Rental income 439,021$ 434,680$
Tenant recovery income 104,711 103,317
Other property income 9,239 9,776
Other investment properties:
Rental income 9,455 13,296
Tenant recovery income 1,985 3,622
Other property income 459 319
Expenses:
Same store investment properties (239 properties):
Property operating expenses (89,198) (90,766)
Real estate taxes (71,622) (71,404)
Other investment properties:
Property operating expenses (2,830) (4,595)
Real estate taxes (4,571) (5,176)
Net operating income:
Same store investment properties 392,151 385,603
Other investment properties 4,498 7,466
Total net operating income 396,649 393,069
Other (expense) income:
Straight-line rental income, net 809 (109)
Amortization of acquired above and below market lease intangibles, net 1,415 1,611
Amortization of lease inducements (71) (29)
Straight-line ground rent expense (3,784) (3,801)
Depreciation and amortization (217,303) (218,833)
Provision for impairment of investment properties (1,323) (7,650)
Loss on lease terminations (6,872) (8,590)
General and administrative expenses (26,878) (20,605)
Dividend income 1,880 2,538
Interest income 72 663
Gain on extinguishment of debt 3,879 15,345
Equity in loss of unconsolidated joint ventures, net (6,307) (6,437)
Interest expense (179,237) (216,423)
Co-venture obligation expense (3,300) (7,167)
Recognized gain on marketable securities 25,840 277
Other income, net 296 2,032
Total other expense (410,884) (467,178)
Loss from continuing operations (14,235) (74,109)
Discontinued operations:
Loss, net (24,196) (28,884)
Gain on sales of investment properties, net 30,141 24,509
Income (loss) from discontinued operations 5,945 (4,375)
Gain on sales of investment properties, net 7,843 5,906
Net loss (447) (72,578)
Net income attributable to noncontrolling interests - (31)
Net loss attributable to the Company (447) (72,609)
Preferred stock dividends (263) -
Net loss attributable to common shareholders (710)$ (72,609)$

Reconciliation of Same Store NOI Growth
68
2012 Same
Store NOI
Growth
Multi-Tenant Same Store NOI - Target Markets 4.8%
Multi-Tenant Same Store NOI - Non-Target Markets -0.2%
Multi-Tenant Same Store NOI 1.8%
Other1 0.8%
Same Store NOI Growth 1.7%
1The 2012 NOI growth in the “Other” category above is primarily attributable to the year-
over-year NOI growth of our single-user retail and non-core industrial and office
properties.