investments in natural gas supply chain - aperc.ieej.or.jp · apec oil and gas security studies...
TRANSCRIPT

APEC Oil and Gas Security Studies
Michael Ochoada SinocruzChrisnawan Anditya
Luis Camacho BeasYoshikazu KobayashiTomoko Matsumoto
Energy Working Group
Photographs credited by APERC
Investments in Natural Gas Supply Chain
under the Low Price Environment
Investments in N
atural Gas Supply Chain under the Low
Price Environment
Energy Working G
roup 2018
EWG 05 2016S
Produced byAsia Pacific Energy Research Centre (APERC)Institute of Energy Economics, JapanInui Building, Kachidoki 11F, 1-13-1 KachidokiChuo-ku, Tokyo 104-0054 JapanTel: (813) 5144-8551Fax: (813) 5144-8555E-mail: [email protected] (administration)Website: http://aperc.ieej.or.jp/
ForAsia-Pacific Economic Cooperation Secretariat35 Heng Mui Keng Terrace Singapore 119616Tel: (65) 68919 600 Fax: (65) 68919 690Email: [email protected] Website: www.apec.org
© 2018 APEC Secretariat
APEC#218-RE-01.3. ISBN 978-981-11-7392-9
AP
EC
Oil and G
as Security S
tudies Series 12
APEC Oil and Gas Security Studies
Series 12June 2018

Investments in Natural Gas Supply Chain under the Low Price
Environment
APEC Oil and Gas Security Studies Series 12
Energy Working Group
June 2018

EWG 05 2016S
Produced byAsia Pacific Energy Research Centre (APERC)Institute of Energy Economics, JapanInui Building, Kachidoki 11F, 1-13-1 KachidokiChuo-ku, Tokyo 104-0054 JapanTel: (813) 5144-8551Fax: (813) 5144-8555E-mail: [email protected] (administration)Website: http://aperc.ieej.or.jp/
ForAsia-Pacific Economic Cooperation Secretariat35 Heng Mui Keng Terrace Singapore 119616Tel: (65) 68919 600 Fax: (65) 68919 690Email: [email protected] Website: www.apec.org
© 2018 APEC Secretariat
APEC#218-RE-01.3. ISBN 978-981-11-7392-9

i
Foreword
During the 11th APEC Energy Ministers’ Meeting (EMM11) held in Beijing, China on 2nd September 2014, the Ministers issued instructions to the Energy Working Group (EWG). This includes an instruction to Asia Pacific Energy Research Centre (APERC) to continue its cooperation on emergency response so as to improve the capacity building in oil and gas emergency response in APEC region. Following this instruction, APERC has started implementing the Oil and Gas Security Initiative (OGSI) in November 2014. One of the three overarching pillars of the OGSI is the publication of the Oil and Gas Security Studies (OGSS).
The OGSS serves as a useful publication to APEC economies by having access to developments and issues on oil and gas security, and information on individual economy’s policies related to oil and gas security including responses to emergency situation. The research studies included in OGSS will help encourage the APEC economies to review and revisit their respective policies, plans, programmes and measures on oil and gas security, and may probably help them adopt appropriate approaches to handling possible supply shortage or supply emergencies in the future.
I would like to thank the contributors to the OGSS for the time they have spent doing research works. May I however highlight that the independent research project contents herein reflect only the respective authors’ view and not necessarily APERC’s and might change in the future depending on unexpected external events or changes in the oil and gas and policy agendas of particular economies or countries.
I do hope that the OGSS will serve its purpose especially to the policy makers in APEC in addressing the oil and gas security issues in the region.
Takato OJIMI
President
Asia Pacific Energy Research Centre

ii
Acknowledgements
We are grateful for the full support and insightful advices of Mr Tatako Ojimi, President of APERC, Mr. James Michael Kendell, Vice President of APERC, and Dr. Kazutomo Irie, General Manager of APERC. We also wish to thank the administrative staff of APERC and IEEJ, as this study could not have been completed without their assistance. Project Leaders
James Michael Kendell (APERC) and Yoshikazu Kobayashi (IEEJ) Authors
APERC Lay Hui Teo ● Kirsten Nicole Smith IEEJ Hiroshi Hashimoto ● Koichi Ueno ● Yosuke Kunimatsu ● Hideo Sakoda ● Kazuya Otani
Other Contriutors APERC Yuko Tanaka ● Tomoyo Kawaura
1
Table of contents Executive Summary ............................................................................................................ 2 1. The Importance of Investment in Gas Security ............................................................. 7
1-1 Why Discuss Investment Issues Now? ..................................................................... 7 1-2 The Characteristics of Investment in the Natural Gas Sector .............................. 16
2. The Current State of Natural Gas and LNG Investment in Asia Pacific ................... 23
2-1 Current Natural Gas and LNG Production Capacity and Investment for Future Expansion ....................................................................................................................... 23 2-2 Necessary Investment for the Future of the Natural Gas and LNG Industry in 2030 ........................................................................................................................................ 28
3. Case Studies .................................................................................................................. 36
3-1 Australia (North West Shelf project) ...................................................................... 36 3-2 Canada ..................................................................................................................... 47 3-3 Indonesia .................................................................................................................. 58 3-4 Singapore ................................................................................................................. 69
4. Conclusions .................................................................................................................... 76
4-1 Identifying Risk ....................................................................................................... 76 4-2 Reducing Risk .......................................................................................................... 78 4-3 Distributing Risk ..................................................................................................... 82 4-4 Summary .................................................................................................................. 86

2
Executive Summary
There is growing uncertainty surrounding international natural gas and liquefied natural gas
(LNG) markets due to the expansion of demand in emerging economies, the slump in crude oil prices, the further introduction of renewable energies, and the growing demand for a flexible LNG supply. However, securing investment to develop natural gas infrastructure has become more important than ever in order to ensure gas security for the future of the Asia Pacific region. The natural gas business has low profit margins, and investment in infrastructure also requires long payback periods. As uncertainty over the future market environment is rising, how to secure sustainable investment has become one of the major policy issues for Asia Pacific economies going forward.
Massive investment is needed between 2016 and 2030 to develop natural gas infrastructure in
the Asia Pacific region, with total investment estimated to be $2,243 billion USD as elaborated in 2-2 of this study. Of this, expenditures in the natural gas field exploration and development (upstream) sector are the largest, accounting for 86% of the total investments. The next largest expenditure is for LNG liquefaction capabilities, which is 11% of the total investments., The pace of investment is expected to accelerate until 2030, with $715 billion USD invested between 2015 and 2020 and $1,527 billion USD between 2020 and 2030.
While various natural gas investments are being made in many economies in the Asia Pacific
region, each economy has their own opportunities and challenges. This report further looks into the case studies of gas investments in four Asia-Pacific economies – Australia; Canada; Indonesia and Singapore.
First, with regard to Australia, the North West Shelf LNG project is proven to be a most
successful LNG liquefaction project which has greatly contributed to both the domestic and international natural gas markets. The key success factor was an alliance among relevant parties from upstream players to trading houses, from the engineering company, shipping industry and shipbuilders, to the power and gas utilities. All of these players closely communicated with each other in every phase of the project to minimize the risks and uncertainties of the project. Such alliance formation and close communication enabled the project to start smoothly and maintain stable and reliable operation. The experience of the North West Shelf project suggests close alliance among players across the supply chain is important, especially in a large-scale project such as an LNG plant.
In Canada, 27 LNG projects were proposed in the 2010s, of which six are fully approved and
three are in the regulatory review process. Two projects (LNG Canada and Woodfibre LNG) are
3
the most advanced and are nearing a construction phase. Canadian natural gas reserves continue to grow through application of the American shale revolution technology to the development of unconventional natural gas in Canada, but since the United States is Canada’s only export destination and American natural gas production is growing, the Canadian natural gas market is awash in excess supply. Canada’s LNG projects were proposed to export surplus gas to the Asian natural gas market. However, because of numerous problems, such as delays in infrastructure development including pipelines, sluggish crude oil prices, sluggish supply and demand in the international LNG market, difficulty in gaining acceptance from local communities, and labor and engineering shortages, progress has been delayed in almost all cases. Without significant changes in the supply and demand environment in the international LNG market, it will be difficult to realize any Canadian LNG projects, however, it is important that the government continue with policy efforts, such as speeding up environmental reviews and training human resources, in order to attract the level of investment required in the future.
Indonesia is one of the major natural gas exporters in the Asia Pacific region, but because of
growing domestic energy demand and a decline in the production of domestic gas, demand for LNG is forecast to rapidly expand in the future. Across the diverse proposed infrastructure projects in Indonesia that include liquefaction facilities, regasification facilities and gas thermal power plants, investment in liquefaction facilities in particular is proceeding smoothly with support from not only private enterprises, but also assistance from export credit agencies of developed economies and international development banks. As it has become more common for companies to create integrated proposals for regasification and gas-fired power generation in recent years, the scope of investment has widened and closer collaboration among private enterprises and the public sector will be needed.
Singapore has experienced steady progress in the development of natural gas infrastructure. It
first constructed an LNG receiving terminal in 2013 to diversify domestic gas supplies. With the government supporting the expansion of the LNG terminal ahead of demand, the terminal is also capable of providing ancillary services with its spare capacity. Terminal infrastructure has since been enhanced with the addition of LNG bunkering and reloading facilities, aiding Singapore to achieve its vision of becoming a gas trading hub in Asia. A nitrogen blending facility is also under construction currently and when completed in the second half of 2018, it will provide LNG traders with more flexibility. With the necessary infrastructure for an Asia hub steadily put into place, structural reform of the international LNG market to seed sufficient flexible LNG supply volumes and spot transactions will be needed to form a real trading hub in the future.
For sustainable investment in natural gas projects in the future, three steps are important to follow: 1) identifying risks related to each investment, 2) taking measures to reduce project-

4
specific risk as much as possible and 3) optimally distributing risk that cannot be completely reduced to relevant parties. Firstly, there are various risks when it comes to infrastructure investment, regardless of the commodity, such as market risk, whether a sufficient return on investment can be obtained, political risk, from government changes to policy and regulation, financial risk, whether sufficient capital can be procured, environmental risk, effects of the construction on the environment, and engineering, procurement and construction risk from cost increases during construction. Although it is difficult to foresee all potential risks prior to making an investment decision, it is necessary to identify potential risks to the extent possible in preparation for smooth execution of a project.
Next, after identifying the risks, measures need to be taken to reduce risk. One of the first risk-
mitigation measures is to build a highly dynamic natural gas/LNG market. In the traditional international LNG market, the risk of investing in a project has been managed by the seller and buyer signing long-term contracts for 20 years or longer. But demand for flexible LNG trading has increased around the world, as a result of American LNG exports with no destination clauses, the rise of emerging LNG importers with high price elasticity of demand patterns and the growing demand for more flexible LNG contracts with the relaxation of international LNG supply and demand. Under these circumstances, it becomes increasingly necessary to build a system that can sell products by enabling trading in a highly dynamic spot market.
With respect to other risk mitigation measures, it is necessary for the governments of
consuming economies to implement policy measures that reduce the uncertainty concerning the scale of future demand. Such policies include setting an energy (power) mix target and the formulation of a master plan on gas use. Governments of consuming economies should prepare and implement policy packages (regulations, taxation, subsidies, etc.) to realize this after creating clear numerical targets and road maps.
Fostering human resources who are familiar with natural gas and LNG projects, market
frameworks and policy systems, in terms of speeding up decision-making on investments and facilitating the identification of risks associated with investment are, in the broad sense, also risk-mitigation measures. In particular, as emerging economies will need to augment their natural gas infrastructure in the future, it is important for economies such as the United States and Japan, who have knowledge of gas usage, to be proactive in developing human resources for government and business in such emerging economies.
The exchange of information between gas-producing and consuming economies for the future
development of a highly transparent natural gas market is one way of effectively mitigating investment risk. In this regard, there are already meetings led by private enterprises, such as the
5
World Gas Conference (WGC) and Gastech, as well as meetings that primarily focus on policy discussions, such as the LNG Producer-Consumer Conference held annually in Japan. The candid exchange of views on the future natural gas market at these meetings lowers uncertainty about the future market environment and contributes to the reduction of risk.
Risks that cannot be reduced through the risk mitigation measures as described above are
allocated among relevant parties. In promoting future investment in natural gas, it is also worthwhile to consider a new form of distribution in addition to past risk allocation. One is the risk burden of public financial institutions. For example, in a consuming economy that is developing infrastructure, there are schemes for obtaining financing, such as further expanding government financial assistance, arranging assistance from the Export Credit Agency of the home economy of the foreign enterprise making the investment, or obtaining a loan from multilateral development banks such as the World Bank or Asian Development Bank. By these public institutions partially incurring the risks that private companies cannot bear alone, promotion of investments can be expected.
Another way of allocating risk is by considering integrated projects. Integrated projects are
once again garnering interest as demand and supply uncertainty in the international natural gas/LNG market rises. Especially in recent years, there are cases in Indonesia and elsewhere where projects are carried out as a package of procurement of LNG, building LNG receiving terminals and gas-fired power plants. Upstream companies are more actively investing in the downstream sector than in the past, while downstream companies are doing the same in the upstream sector, and by taking on the burden of new risks, they have secured stable demand and supply, which is expected to promote investment in new projects.
It is also possible to manage growing uncertainties with collaboration between organizations
and companies, and in some cases by corporate merger. If the composition of the above-mentioned integrated project is an effort aimed at vertical integration, then this can be said to be a move toward horizontal integration. The merger of Shell and BG and the formation of JERA are examples of these actions, and such a series of cooperative groups can be viewed to be aimed at improving the efficiency of business by integrating assets among companies, and be a measure that enables them to take on the challenge of new investments by making the most of the strengths of their assets.
Needless to say, private companies are often the primary entity in natural gas projects. However,
as noted in this report, natural gas projects also require public support in various situations. A major factor in ensuring steady investment is to identify the shape of optimal risk management after assigning roles to private companies, financial institutions, and the private sector that

6
maximize their respective strengths and characteristics.

7
1. The Importance of Investment in Gas Security
1-1 Why Discuss Investment Issues Now?
1-1-1 Growing Demand
The primary interest of this study is securing the adequate scale of investment for gas security
in the Asia Pacific region. The greatest reason for discussing this problem is, of course, since the demand for natural gas in the Asia Pacific region will increase significantly, the infrastructure for a stable supply will become increasingly important in the future.
According to the long-term outlook published by Asia Pacific Energy Research Centre
(APERC) in 2016, the demand for natural gas in the Asia Pacific region will increase at a higher rate than other fossil fuels, and from 2014 to 2040, it is expected to grow 1.7 times (Figure 1-1). The demand scale is large given the presence of traditional gas-producing economies, such as the United States and Russia, but the scale of the increase in demand in the future is even larger in emerging economies such as China and India. To satisfy such high growth in demand, it is necessary to have a supply capability to meet that demand and investment in transportation and usage facilities. Natural gas, in particular, has physical properties that make transportation difficult, and the supply system is complete only after laying pipelines to the final customers. And with natural gas, investing in infrastructure to secure stable supplies is more important than it is with oil and coal.
Figure 1-1 Future increase in natural gas demand in the Asia Pacific region
Source: Asia Pacific Energy Research Centre, APEC Energy Demand and Supply Outlook 6th edition, 2016
0
500
1,000
1,500
2,000
2,500
3,000
2005 2010 2014 2020 2030 2035 2040
Bcm
Other
Malaysia
Korea
Thailand
Japan
Indonesia
Canada
Mexico
Russia
China
US

8
Demand for liquefied natural gas (LNG) in the Asia Pacific region will also grow steadily, supported by increased demand for natural gas. As shown in Figure 1-2, the demand for LNG in the Asia Pacific region, which has historically maintained a high share of the world’s LNG market, will continue to expand rapidly in the future. Unlike natural gas supplied through pipelines, LNG requires large upfront capital investment in liquefaction facilities, dedicated tankers and regasification facilities, so steady and sustained investment is particularly critical to meet the increasing demand.
Figure 1-2 Future increase in LNG gas demand in the Asia Pacific region
Source: Institute of Energy Economics, Japan
There are several reasons behind the increase in LNG demand in the Asia Pacific region. One
is obviously the solid economic growth that has led to an overall increase in the demand for energy. In many of emerging economies in the Asia Pacific region where demand for natural gas is especially growing, high economic growth is forecast in the future, and demand for natural gas is expected to grow in a broad range of fields, such as power generation, industry, home and commercial use.
Another reason is the effect of environmental policy in emerging economies in the Asia Pacific
region. In China, in particular, where the long-term use of coal has made air pollution a serious social issue, not only for domestic energy security policy but also in the context of health and social policy, there is a strong policy motive to limit the use of coal as much as possible. In fact, active coal restriction policies are being put in place in urban areas such as Beijing and Tianjin, such as closing coal mines and prohibiting the use of commercial and industrial coal-fired boilers.

9
These policies have led to a rapid increase in natural gas demand in China in recent years.
1-1-2 Sluggish Prices
The second reason that this study focuses on natural gas investment from the viewpoint of gas
security is that there are concerns that the prolonged low crude oil and natural gas prices will stagnate investment. Though international crude oil prices moved above $100/bbl in since 2011, prices crashed in summer of 2014 with the increase in the supply of shale oil, and the decline in demand caused by high oil prices, and are currently in the $50/bbl to $60/bbl range. Currently, much of the LNG traded in the Asia Pacific region is priced based on the price of crude oil, so the low price of crude oil means a slump in international LNG prices. Low crude oil and natural gas prices will restrain the willingness of upstream companies to invest by reinforcing pessimistic expectations about the outlook of prices in the future. In addition, if low crude oil prices cause major damage to the balance sheets of upstream companies, even a recovery oil prices cannot be expected to immediately rekindle investment. Consequently, as the current low-price environment continues, there are increasing concerns that future supply capacity will not be augmented at the pace needed to keep up with the increase in demand within the Asia Pacific region.
Figure 1-3 Trend in international natural gas prices
Source: Ministry of Finance of Japan, Trade Statistics; US Energy Information Administration web-site; International Energy Agency, Energy Prices & Taxes
The impact of these low prices has already adversely affected actual investment amounts.
10
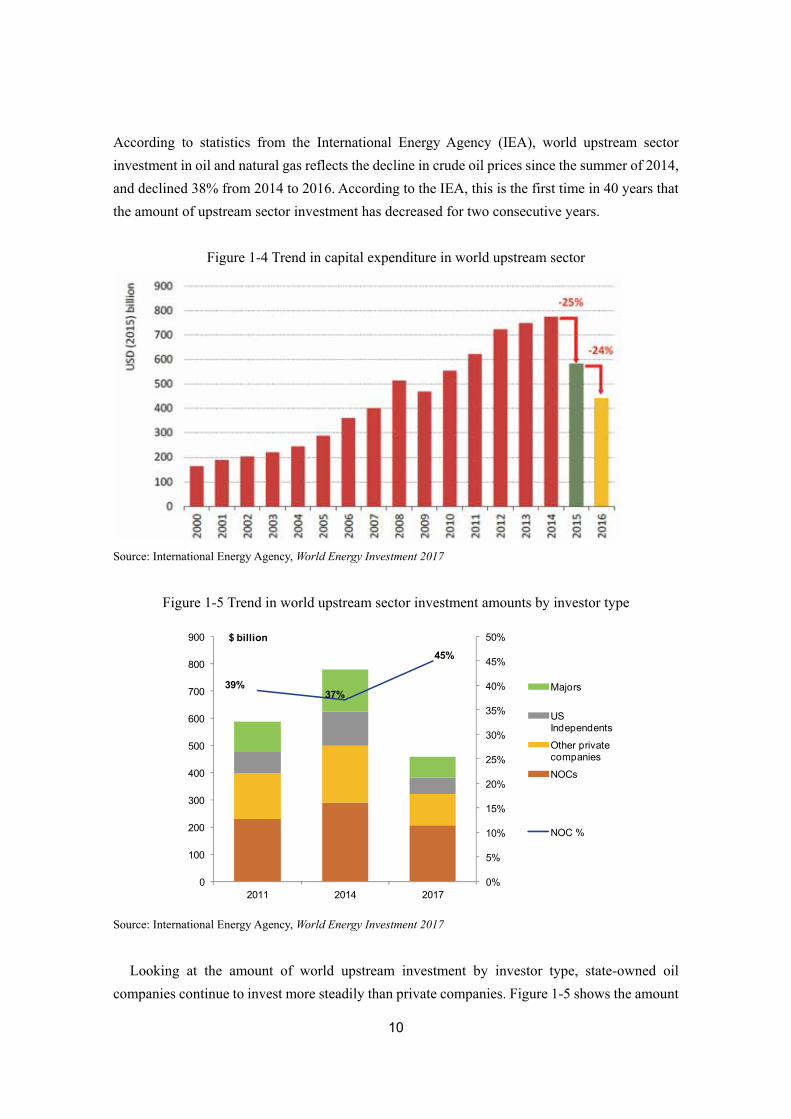
According to statistics from the International Energy Agency (IEA), world upstream sector investment in oil and natural gas reflects the decline in crude oil prices since the summer of 2014, and declined 38% from 2014 to 2016. According to the IEA, this is the first time in 40 years that the amount of upstream sector investment has decreased for two consecutive years.
Figure 1-4 Trend in capital expenditure in world upstream sector
Source: International Energy Agency, World Energy Investment 2017
Figure 1-5 Trend in world upstream sector investment amounts by investor type
Source: International Energy Agency, World Energy Investment 2017
Looking at the amount of world upstream investment by investor type, state-owned oil companies continue to invest more steadily than private companies. Figure 1-5 shows the amount
39%37%
45%
0%
5%
10%
15%
20%
25%
30%
35%
40%
45%
50%
0
100
200
300
400
500
600
700
800
900
2011 2014 2017
$ billion
Majors
US Independents
Other private companies
NOCs
NOC %

11
of global upstream investment (including oil) by investor type, and while the amount of upstream investment grew steadily from 2011 to 2014 when the price of crude oil was on an upward trend, the estimated amount of investment in 2017 has drastically declined after the price of oil collapsed. While the oil majors and other private companies are particularly sensitive to the level of crude oil prices, investment by state-owned oil companies is relatively steady regardless of the level of crude oil prices. Support from public institutions together with private enterprises is indispensable, particularly with respect to investment in the natural gas sector. These investment figures by entity confirm the importance of investment by the public sector.
Because of low prices, investment in LNG production capacity is also slowing down. Figure
1-6 shows the production capacity of LNG projects in which the final investment decision (FID) was made over the past 10 years. The FID is the final commitment by a company to invest in a project, and marks the beginning after receiving government approvals and complying with regulations necessary to realize the project plus securing the necessary funding for the project. There were only two FIDs made in 2016 (total production capacity of 5.9 million tons), and only one FID made in 2017 (production capacity of 3.4 million tons) in Mozambique as of December 2017. In the international LNG market where demand will continue to increase by 15 million to 20 million tons per year, there are fears such continued sluggishness in investment in new supply capacity will cause supply shortages and sharp price increases in the future. Steady investment in world LNG supply capacity must be continued in order to avoid such supply crunch.
Figure 1-6 Trend in final investment decisions and capacities in world LNG market
Source: Institute of Energy Economics, Japan based on corporate press releases
0
5
10
15
20
25
30
35
2009 2010 2011 2012 2013 2014 2015 2016 2017
mtpa

12
1-1-3 Increasing Geopolitical Risk
The presence of increasing geopolitical risks in various parts of the world cannot be ignored.
Supply side risks have been increasing in recent years, and there have been problems such as the deterioration of relations between Qatar and neighboring Persian Gulf states in the Middle East, and the deterioration of relations between Russia and Western economies over the invasion of Ukraine, in the face of technical problems and lower production at new LNG plants.
In order to secure a stable supply of energy, it is necessary to ensure enough redundancy to be
able to absorb the effects of problems with the supply. The American and European natural gas markets have large-scale storage capacities that use depleted gas fields and rock salt layers, and in the event of an unexpected supply disruption, reserves can be drawn from these storage facilities to meet demand. Infrastructure networks are also being developed that can flexibly distribute gas supplies to areas that need them using the regional pipeline network.
However, such stockpiles and infrastructure capacity are extremely limited in many Asia-
Pacific economies. Even Japan, which is the world’s biggest LNG importer and relies on LNG imports from overseas for much of its domestic gas supply, is considered to only have about two to three weeks’ worth of commercial inventory. Because of the huge cost involved to stock large amounts of LNG1, there is no LNG-importing economy in the world, let alone Japan, that has LNG reserves as a policy. Moreover, compared with the international crude oil market, there is no swing supplier in the international natural gas or LNG market equivalent to a Saudi Arabia who maintains surplus production capacity at all times and who can use this surplus capacity to cover disrupted supplies. This is because natural gas and LNG production facilities, compared with crude oil production facilities, have massive initial investments and large fixed costs from the construction of pipelines and liquefaction facilities. So once an LNG production facility begins producing, there is a strong incentive for each piece of equipment to operate at full capacity. Because of these circumstances, the international LNG market is characterized by a chronic lack of redundancy that can sustain stable supply even in an emergency, compared with the crude oil market.
Therefore, as geopolitical risk increases, facilitating redundancy in the natural gas and LNG
supply chains is becoming more important. Needless to say, since such redundancy first stems from ongoing stable and adequate investment, it is much more critical than in the past to make investments that ensure sufficient supply capacity in order to ensure gas security in the international natural gas market. 1 This is because of high capital expenditures and operating costs in LNG storage tanks and high boil-off gas rates from LNG storage.

13
1-1-4 The Growing Use of Renewable Energy
Progress in introducing renewable energies is adding to the uncertainty of the future of the
natural gas and LNG market in the Asia Pacific region. Although the share of renewable energies (including hydropower) in the Asia Pacific region was 10% as of 2013, according to the outlook by the Asia Pacific Energy Research Center, this share is mainly due to expanded use of solar and wind power and is expected to expand to 13% in 2040.
Figure 1-7 Renewable energy supply in the Asia Pacific region
Note: Figures after 2020 are estimates
Source: Asia Pacific Energy Research Centre, APEC Energy Demand and Supply Outlook 6th Edition, 2016
Up to now, natural gas has been seen as a “clean fuel” and an alternative to coal and oil that
contributes to the reduction of greenhouse gas emissions. In recent years, however, the cost of using renewable energies has fallen, and in some economies their cost competitiveness has increased to nearly the same level as the cost of gas thermal power generation. While natural gas is losing its cost advantage over renewable energies, it is increasingly being regarded as “one of fossil fuels” rather than a “clean fuel.” If the cost of renewable energies continues to fall, natural gas will likely be positioned alongside coal and oil as energies that should be curtailed.
Renewable energies such as solar and wind power have an intermittent quality and do not
always generate stable amounts of electricity. For this reason, the use of renewable energies always requires a backup power supply to handle fluctuations, and as sources for renewable energy supplies increase, instances of gas-fired power shifting to a peak power source from the current intermediate load power will likely increase. Additionally, if the performance of storage

14
batteries dramatically improves in the future, natural gas-fired power will have a smaller role as a backup power source, and it cannot be ruled out that natural gas-fired power plants may become stranded assets. While the APEC Energy Demand and Supply Outlook 6th Edition published in 2016 by the Asia Pacific Energy Research Center does not anticipate a dramatic expansion in the use of renewable energies, the introduction and development of these energies is one of the causes that suppresses investment in natural gas. 1-1-5 Changes in the Structure of the LNG Market
Finally, recent structural changes in the LNG market could significantly change long-standing
trading practices in the international LNG market, which could be a factor in restraining future investment. Such structural changes have begun to emerge in both supply and demand. On the supply side, unlike conventional LNG, the United States will increase its export of domestic LNG without destination restrictions. LNG without destination restrictions can be resold by buyers, and this may stimulate spot trading in the international LNG market. By encouraging the formation of a spot price benchmark, the stimulation of spot trading may prompt a review of the pricing methodology of conventional LNG, which will heighten the uncertainty of the selling price of LNG in the future.
On the demand side, demand for LNG will expand in emerging importing economies such as
China; India and in Southeast Asia in the future, but LNG faces a strong competition with other energies in these economies, and thus its price elasticity of demand is high. Traditional LNG importers like Japan; Korea and Chinese Taipei have almost no domestic gas production, so LNG has been the only source of natural gas. On the other hand, China and India, for example, both have abundant domestic coal resources and also produce natural gas, and since LNG is not their only source of natural gas, they have more energy supply options than traditional LNG importers such as Japan and Korea. For this reason, instead of LNG procurement for long-term stability, they tend to flexibly change procurement amounts depending on the price level.
Furthermore, many Asian economies are now promoting the liberalization of their domestic
electricity and gas markets. In Japan, the domestic electricity and gas markets were liberalized in April 2016 and April 2017 respectively, and China is also unbundling its domestic gas business and introduced a third party access system for LNG receiving terminals. If these markets are liberalized it will be difficult to commit to long-term contracts like the current conventional ones in LNG procurement.
In addition to the supply and demand factors described above, in June 2017, the Japan Fair
Trade Commission also announced that destination restrictions on the current international LNG

15
trading may be in conflict with the Anti-Monopoly Act, which may prompt the expansion of LNG supplies without any destination restrictions in the future.
Given these circumstances, there is now the possibility that the traditional commercial practices
for LNG trading, such as long-term contracts, crude oil price links and ban on resale, may drastically change. Any company investing in a project may regard this situation, which overturns the assumptions for future business environment outlooks, as a major risk factor.
16
1-2 The Characteristics of Investment in the Natural Gas Sector
In thinking about the issue of investment in the natural gas sector, one must recognize the
specific characteristics investment in the natural gas sector has in comparison with investment in other energy sectors. This section will explain four features of gas investments: the necessity of huge investments, rigid contract structures, the importance of public support, and diverse financing methods.
1-2-1 The Necessity of Huge Initial Investments
One characteristic of investments in the natural gas sector is the magnitude of the initial
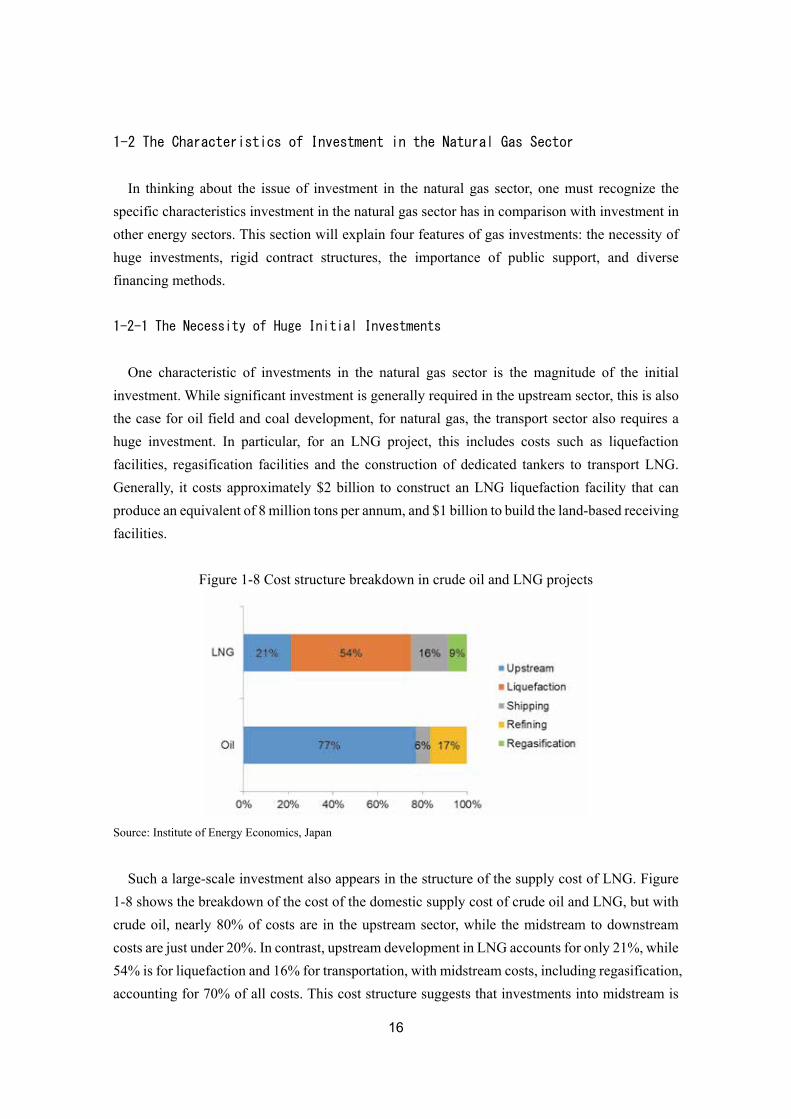
investment. While significant investment is generally required in the upstream sector, this is also the case for oil field and coal development, for natural gas, the transport sector also requires a huge investment. In particular, for an LNG project, this includes costs such as liquefaction facilities, regasification facilities and the construction of dedicated tankers to transport LNG. Generally, it costs approximately $2 billion to construct an LNG liquefaction facility that can produce an equivalent of 8 million tons per annum, and $1 billion to build the land-based receiving facilities.
Figure 1-8 Cost structure breakdown in crude oil and LNG projects
Source: Institute of Energy Economics, Japan
Such a large-scale investment also appears in the structure of the supply cost of LNG. Figure
1-8 shows the breakdown of the cost of the domestic supply cost of crude oil and LNG, but with crude oil, nearly 80% of costs are in the upstream sector, while the midstream to downstream costs are just under 20%. In contrast, upstream development in LNG accounts for only 21%, while 54% is for liquefaction and 16% for transportation, with midstream costs, including regasification, accounting for 70% of all costs. This cost structure suggests that investments into midstream is

17
even more important to create and maintain LNG supply chain. 1-2-2 Rigid Contract Details
Because of the necessity of the investments in the midstream sector, investment in LNG projects tends to be very large, and since it is necessary to recoup the costs, many LNG projects have rigid sales and purchase agreements to ensure the long-term stability of payments. Traditionally, contract periods are typically for 15 to 20 years, with some sales and purchase agreements as long as 40 years. In addition, the buyer usually must agree to a “take or pay” structure, where they pay the equivalent to a fixed quantity of LNG regardless of delivery. Contracts also include destination restriction clauses that forbid buyers from reselling LNG to other markets without the consent of the seller in order to prevent the resale of LNG from causing prices to collapse. As for the selling price of LNG, in the upstream sector, gas field development has a cost structure similar to that of oil field development. However, in the downstream sector, LNG has historically been linked to the price of crude oil as it was used as an alternative fuel to crude oil and heavy oil in oil-fired power plants.
How risk is shared among stakeholders is important in realizing infrastructure investment. In the past, the risks involved in developing natural gas and producing LNG were borne primarily by the seller, who was the developer of the project, while downstream risks, such as selling price and quantity, were primarily borne by the LNG buyer.
In recent years, however, softening of the supply and demand balance in the international LNG market is changing the way risks are allocated. In the European market, natural gas prices have shifted from the traditional linkage to the price of oil to the trading price in individual natural gas trading hubs. Likewise, in the Asian market, the idea that natural gas prices should be set at a price that reflects the supply and demand of natural gas rather than international crude oil prices is increasing. Currently, there are no price benchmarks that is regarded to represent natural gas supply and demand in Asia, nor are there trading hubs that can make such trades. However, Tokyo, Singapore and Shanghai are working to create such a hub, and it is possible that in the future LNG prices in Asia will change to reflect the natural gas market conditions instead of the price of crude oil.
Similarly, destination restrictions that prohibit the resale of LNG are being eliminated from natural gas and LNG sales and purchase agreements. Since 2004, DG Competition (the Directorate-General for Competition) has regarded this provision as illegal from the viewpoint of European Union competition law. Also, in Japan, the world’s largest LNG importer, the Japan Fair Trade Commission (JFTC) announced in a report on international LNG trading in September
18
2017 that destination restrictions conflict with (are likely to violate) the Anti-Monopoly Act. In response to these actions, some LNG buyers in Japan have renegotiated contracts, including existing contracts, to eliminate destination restrictions. The Japan Fair Trade Commission also noted in a report that requiring take or pay clauses of buyers in long-term contracts for projects that have finished recouping their investment may violate the Anti-Monopoly Act, continuing the trend of trade practices that were once regarded as common in LNG trading to continue to be reviewed.
As for LNG production facilities, it is also necessary for individual stakeholders to establish a
mechanism that will be able to bear the appropriate risks for the investment and obtain an appropriate return. Under circumstances where trading practices are undergoing dramatic changes, there is a concern that the amount of investment required may not be realized due to increasing uncertainty about future revenues. A careful response is required from the viewpoint of securing sustainable investment in terms of how to control and to allocate this risk.
1-2-3 The Importance of Government Support
Investment in the natural gas sector has attributes that makes it unattractive to investment by
private companies, so government financial support is required. This is because the magnitude of the initial investment tends to be extremely large and it is difficult for a single private company alone to bear its risks. A major European or American oil company or a state-owned oil company in a gas-producing economy could provide the necessary funding for an investment project, but a regular private company would find it very difficult to procure such huge amounts of capital through private markets.
In other words, it is crucial for the government to be involved in supporting the domestic natural
gas business. In the past, state-owned enterprises or private enterprises under strict government regulation in the economies of Europe, Japan and Korea played a role in natural gas projects. The proactive involvement of the government is indispensable in preparing the necessary supply infrastructure, including a pipeline network, for issues such as acquiring the needed land and environmental measures.
In general, profit margins in the natural gas downstream sector are not high, and some
economies choose to operate it at a loss. This is because domestic energy prices have a great influence on the economy and the approval rate of the government, so some governments that want to strengthen their domestic political base try to keep prices low even if they have to provide subsidies. Since private companies prioritize recouping their investment in the short-term and investing in highly profitable areas, they are unenthusiastic about investing in projects with low

19
profitability unless they receive a guaranteed return. Moreover, natural gas investment projects tend to have long payback periods. Although it is
possible to secure a stable fixed margin, the magnitude of the initial investment means that investment costs tend to require a long time to recoup the initial capital. In recent years, the profitability of quarterly earnings for many private enterprises has become an increasingly important yardstick in stock markets, and managers of private enterprises are constantly under pressure to produce short-term profits. This short-tern focus makes natural gas and LNG projects less attractive unless a company already has a substantial balance sheet to finance the project. Business models that recoup large-scale investments over a long period of time are not necessarily popular for private enterprises that prioritize market capitalization.
The need for government support for investment in natural gas infrastructure also stems from
the properties of natural gas as an energy resource. The greatest advantage of natural gas is that it has the lowest greenhouse gas intensity among the fossil fuels. However, this environmental benefit is an externality that is not always reflected in the normal market price, and the intervention of some kind of policy arrangement is necessary to accurately evaluate its properties. Similarly, another advantage of natural gas is that it is geographically dispersed compared with oil, and is generally located in geopolitically stable areas, which is desirable from the perspective of energy security. However, this energy security advantage also has an externality in that it is not equally valued on the market. The two main advantages of natural gas cannot be easily priced in a market mechanism, and in that sense, the government may choose to intervene in some way.
For these reasons, natural gas projects are less attractive investment choices for private
investment. As a result, to secure stable future investment in the natural gas sector, individual governments, and export credit agencies (ECA), as well as the World Bank, the Asian Development Bank and other multilateral development banks (MDB) all have large roles to play. 1-2-4 The Possibilities of Different Finance Options
Another characteristic of investment in the natural gas sector is that there are differing financing
structures that can be considered, depending on the sector of the supply chain. With LNG projects in particular, private commercial banks can offer loans and bond issuances, and export credit agencies from the home economy of a company investing in a project or a multilateral development bank (MDB) may also offer loans. Figure 1-9 shows the source of funding that has been used for investment in recent LNG projects. Although there are big differences in the cost of realizing the projects, there are also significant variation in funding arrangements depending on the project.

20
Figure 1-9 Capital procurement in recent LNG projects
Source: US Department of Energy, Understanding Natural Gas and LNG Options
Typically, a single financial institution does not fully finance an LNG project and it is common
for multiple financial institutions to create a syndicate to provide debt. The type of loan depends on the type of financial institution, for example, a commercial bank usually offers 10-year financing with an interest rate that uses the London Inter-Bank Operating Rate (LIBOR) plus a risk premium to cover project-specific risks. On the other hand, MDBs like the World Bank and the Asian Development Bank can offer longer-term loans, but are limited to the share of the total financed amount that these financial institutions can finance. Depending on the composition of companies participating in the project, financial assistance may be offered from the export credit agency (ECA) in the home economy of the investing company in some cases.
An ECA is an agency that supports overseas projects on the premise that there are benefits to
the home economy of the investing company, and provides insurance for low interest loans, trade risks and political risks. In the United States, there are organizations such as the US Export Import Bank (Ex-Im) and Overseas Private Investment Corporation (OPIC), while their counterparts in Japan are the Japan Bank for International Cooperation (JBIC) and Nippon Export and Investment Insurance (NEXI). Furthermore, in some economies, such as Japan and Korea, the governments have state-run petroleum and natural gas development support organizations with a system to support investment.
Generally, in upstream development that has high investment risk, companies often use their
own equity capital, while in the midstream and downstream sectors where there is relatively low

21
investment risk, capital procurement comes from a combination of equity capital and external borrowing. As for the debt to equity ratio in the midstream and downstream sectors, the ratio of the equity is generally 30% while the debt is 70%. However, the share of equity capital is higher in cases where new technologies are introduced (floating liquefaction, for example) in which the risk is considered to be higher than normal liquefaction.
Figure 1-10 Overview of project finance
Source: US Department of Energy, Understanding Natural Gas and LNG Options
Among financing options, project finance is often used for LNG liquefaction facilities in
particular, which is one of the midstream/downstream projects that requires a significant initial investment. Project finance is a form of investment in which a project’s investor establishes a special purpose vehicle (SPV) for a specific investment project, where the SPV can advance the project while borrowing externally. The difference between an SPV and investment by an ordinary joint venture company is that the debt of the SPV investing in the project is non-recourse and does not extend to the parent company. The advantage of this is that the project investors do not have to list the debts of the SPV on their balance sheets, allowing them to distance their companies should the SPV have significant liabilities. On the other hand, for the financial institution providing loans to the SPV, there is the advantage of it being easy to conduct a risk assessment for capital compared with that for a loan to the parent company as the. The SPV is directly engaged in all aspects of the business, such as concluding sales and purchase agreements with buyers, ordering construction work when it comes time to build, paying taxes to the government of the developing economy, and operating the project.

22
Project finance offers the advantages mentioned above, and while it is a financing method commonly used in LNG projects, there are, of course, drawbacks. If the project acquires substantial losses, the debt obligation does not extend to the parent company. Because of this, financial institutions areforced to exercise more care in their due diligence than with ordinary loans, which has the disadvantage of being time-consuming and costly.

23
2. The Current State of Natural Gas and LNG Investment in Asia Pacific
2-1 Current Natural Gas and LNG Production Capacity and Investment for Future
Expansion
2-1-1 Natural Gas Production
Natural gas production in the Asia Pacific region has increased 301Mtoe (million tons oil
equivalent) (364Bcm), or 21.4%, over the past 10 years, growing from 1,409Mtoe (1,706Bcm) in 2006 to 1,710Mtoe (2,070Bcm) in 2016. The major natural gas producers of the United States; Russia; Canada; China and Australia account for 86.5% (2016 production) of natural gas production in the Asia Pacific region.
Table 2-1 Natural gas supply of APEC economies
Source: International Energy Agency, World Energy Balances 2017; Asia Pacific Energy Research Centre, APEC Energy Balance Table
In the United States, the production of natural gas in 2016 increased 184Mtoe (223Bcm), approximately 1.5 times by, growing from 432Mtoe (523Bcm) in 2006 to 616 Mtoe (746 Bcm) in 2016, accounting for 57% of the increase in natural gas production in the Asia Pacific region. Currently, the main factor for the increase is the growth of shale gas production from the latter half of the 2000s, which accounts for just under 40% of the shale gas production in the United
Economy 2006 2007 2008 2009 2010 2011 2012 2013 2014 2015 2016APEC Total 1,409 1,429 1,476 1,425 1,523 1,582 1,595 1,638 1,672 1,696 1,710
Australia 36 38 40 42 44 48 46 52 53 56 74Brunei Darussalam 11 11 11 10 10 11 11 10 10 9 9Canada 155 150 145 135 132 132 130 130 138 139 146Chile 2 1 1 2 2 1 1 1 1 1 1China 49 58 67 71 80 88 93 101 109 113 115Hong Kong, China 0 0 0 0 0 0 0 0 0 0 0Indonesia 65 62 64 67 75 71 67 67 66 65 67Japan 3 4 4 3 3 3 3 3 2 2 3Korea 0 0 0 0 0 0 0 0 0 0 0Malaysia 55 54 57 52 51 53 51 58 59 58 59Mexico 43 43 42 44 43 42 41 40 37 34 31New Zealand 3 4 3 4 4 3 4 4 4 4 4Papua New Guinea 0 0 0 0 0 0 0 0 2 2 3Peru 2 3 3 4 8 12 12 12 13 13 14Philippines 3 3 3 3 3 3 3 3 3 3 3Russia 526 522 535 479 540 553 541 554 531 524 529Singapore 0 0 0 0 0 0 0 0 0 0 0Chinese Taipei 0 0 0 0 0 0 0 0 0 0 0Thailand 19 20 23 21 25 22 26 28 29 26 25United States 432 450 470 480 495 531 558 564 606 636 616Viet Nam 6 6 7 7 8 8 8 9 9 10 10
World Total 2,447 2,511 2,613 2,536 2,715 2,788 2,837 2,896 2,935 2,976 2,998APEC Share 57.6% 56.9% 56.5% 56.2% 56.1% 56.7% 56.2% 56.6% 57.0% 57.0% 57.0%
National Gas Supply (Mtoe)

24
States, including the Marcellus Basin. China produced 139Bcm of natural gas in 2016, a dramatic increase of about 2.3 times in the
decade from 2006 to 2016. Natural gas, like renewable energies such as solar and wind power, is regarded as a main alternative energy to coal as a measure to combat air pollution. In fact, the Thirteenth Five-Year Plan announced in January 2017 included the target of increasing natural gas usage to 10% of primary energy consumption in 2020. The Sichuan Basin, Tarim Basin and Changqing Basin are China’s major production sites of domestic natural gas, and account for nearly 60% (2016 production) of production. In October 2013, the National Energy Administration (NEA) announced its shale gas industry policy for the development of domestic shale gas, which supports development with measures such as subsidies and allowances for production companies.2
In Australia, the production of natural gas has roughly doubled, growing from 44Bcm in 2006
to 90Bcm in 2016. The increase in natural gas production in recent years is a result of the start-ups of new projects such as QCLNG in 2015 and APLNG, GLNG Train 2, and Gorgon Train 1 and 2 in 2016.
On the other hand, Mexico is experiencing declining production after the peak in 2004. The
financial status of state-owned oil and gas company Pemex had limited financial resources, and sufficient investment to maintain and increase production has not been made. Imports of natural gas from the United States have increased recently due to the increase in the production of natural gas from the US shale revolution, a rise in domestic demand, and cheaper US natural gas price while production in Mexico has decreased from 43Mtoe (52Bcm) in 2006 to 31Mtoe (38Bcm) in 2016. 2-1-2 LNG Production Capacity and Production Volumes
As of the end of October 2017, the production capacity of LNG in the Asia Pacific region is
about 165 million tons per year, and its major LNG producers are Australia; Russia; Malaysia; Indonesia and Brunei Darussalam. Australia accounts for about 60 million tons per year, or 40% of total capacity. Beginning in 2016, new large-scale LNG terminals in Australia, such as APLNG, GLNG Train 2, Gorgon Train 1, 2 and 3, and MLNG Train 9 in Malaysia, have started operation. In May of 2016, the Sabine Pass LNG terminal in the United States also began operation, marking the first shipments of shale gas-based LNG, expanding the total production capacity in the Asia Pacific region to approximately 32 million tons per year. 2 Website of The State Council, The People’s Republic of China, October 2013 (http://www.gov.cn/gongbao/content/2013/content_2547157.htm)

25
In the trends of the major economies, Australia, the largest LNG producer in the region,
exported 31.56 million tons of LNG in 2016, nearly triple its 2006 production of 10.78 million tons. Recently, however, with the increase in production of LNG for export, the supply and demand balance of natural gas has become unstable in Australia. In eastern Australia, the supply and demand of natural gas has become tight, causing prices to rise due to new LNG projects in operation procuring part of their natural gas for export from the domestic market. Lower investment in domestic development due to sluggish crude oil and natural gas prices and a moratorium in some states on exploration and development of onshore oil and natural gas fields have also contributed to this imbalance. This has resulted in the Australian government announcing that it would implement the Australian Domestic Gas Security Mechanism (ADGSM) from July 2017. Although the measures of the ADGSM are effective for five years from 2018, if the Minister for Resources, following an annual review of natural gas domestic supply and demand, determines that there is a high probability of a shortfall in supply even in a single part of the economy the following year, the Minister can impose export restrictions on all LNG facilities in Australia, as long as they are not a net contributor to the domestic natural gas market.
Table 2-2 LNG production capacity in the Asia Pacific region by economy
(as of the end of October 2017) Economy Production capacity
(million tons per year)
Project
Australia 60.40 North West Shelf, Gorgon, APLNG, etc.
Indonesia 31.80 Bontang, Tangguh, etc.
Malaysia 30.50 MLNG、Petronas LNG 9, etc.
United States 14.86 Sabine Pass LNG, etc.
Russia 9.60 Sakhalin 2
Brunei Darussalam 7.20 Brunei LNG
Papua New Guinea 6.90 PNG LNG
Peru 4.45 Peru LNG
Total 165.71
Source: GIIGNL, The LNG Industry; websites of each company

26
Table 2-3 Projects that started operation in 2016 in the Asia Pacific region Project Economy FID Start production Production
capacity
(million tons per
year)
AP LNG
(Train1, 2)
Australia 2011 January 2016 9.00
Gorgon LNG
(Train 1,2)
Australia 2009 March and October
2016
10.40
Sabine Pass LNG
(Train1, 2)
USA 2012 February 2016 9.00
GLNG
(Train 2)
Australia 2011 May 2016 3.90
Total 32.30
Source: International Energy Agency, World Energy Balances 2017; Cedigaz, Natural Gas in the World
Malaysia exported 20 million tons of LNG in 2016, boasting the second largest LNG export
volume in the Asia Pacific region after Australia. MLNG Train 9, invested in by Petronas of Malaysia, JXTG Energy of Japan and PTTGL Investment Limited of Thailand, started commercial production in 2017. Since 2009, Russia has been producing LNG at Sakhalin 2, which is funded by Gazprom, Shell, Mitsui & Co., Ltd. and Mitsubishi Corporation, and exported 10 million tons of LNG in 2016. Indonesia’s LNG export volume peaked at of 21.55 million tons in 2010 and has continued to decline, falling to 16.16 million tons in 2016. The decline in domestic production, the lack of development of new gas fields and the increase in domestic gas demand are the main reasons for the decrease in exports. In Indonesia, demand for domestic natural gas is expected to increase with rapid economic and population growth, and it is expected to become a net importer of LNG as early as the early 2020s.

27
Table 2-4 LNG exports of APEC economies
Source: International Energy Agency, World Energy Balances 2017; Cedigaz, Natural Gas in the World
2-1-3 Increasing Future Natural Gas and LNG Production Capacity
From 2017 onward, LNG production capacity in the Asia Pacific region is expected to
substantially grow, primarily in the United States and Australia. Following their final investment decisions, there are more than 100 million tons per year of production under construction in major projects, which includes 58 million tons per year in the United States and 26 million tons per year in Australia. Elsewhere, despite the slump in natural gas prices since 2014, the Tangguh project (an expansion of existing facilities) in Indonesia, is entering the construction phase, and Elba Island in the United States, both of which received final investment decisions in 2016. As of the end of December 2107, there are no projects that have entered the construction phase in the Asia Pacific region after their final investment decision.
On the other hand, deteriorating financial situations resulting from the stagnation of natural gas
prices have forced the investment plans of some projects to be postponed or canceled. In oil resource development, Malaysia’s state-owned oil company, Petronas, and other companies, announced the cancellation of the Pacific North West LNG project, which was being considered for development in British Columbia, Canada, in July 2017.
Looking only at projects under construction, supply is expected to exceed demand until the first
half of the 2020s, but if final investment decisions for projects in the planning stage are not made in the future, the supply and demand balance is expected to rapidly tighten.
Economy 2006 2007 2008 2009 2010 2011 2012 2013 2014 2015 2016APEC 58 58 57 62 73 78 73 77 76 78 87
Australia 11 13 12 14 16 18 17 21 21 23 32Malaysia 18 18 18 18 20 22 20 21 21 21 20Indonesia 22 20 20 19 21 20 17 17 15 15 16
Russia 0 0 0 4 8 8 9 9 9 9 10Brunei Darussalam 7 6 7 6 6 6 6 6 5 6 5
Peru 0 0 0 0 2 4 4 5 4 4 4United States 1 1 1 1 1 1 0 0 0 0 0
Papua New Guinea 0 0 0 0 0 0 0 0 0 1 0Other 0 0 0 0 0 0 0 0 0 0 0
World 130 140 140 154 189 204 205 208 209 216 224Share of APEC 44.6% 41.9% 40.6% 39.9% 38.5% 38.2% 35.4% 37.1% 36.2% 36.0% 38.7%
LNG Export (Mtpa)

28
Table 2-5 Major LNG projects under construction in the Asia Pacific region Project Name Economy FID Start of Production Production Capacity
(’000 ton/y)
Gorgon (Train 3) Australia 2009 2017 5,200
Petronas Floating Malaysia 2012 2017 1,200
Petronas Train 9 Malaysia 2013 2017 3,600
Sabine Pass LNG (Train 3-5) USA 2013・15 Scheduled for 2017-
2019
13,500
Wheatstone LNG Australia 2011 Scheduled for 2017 8,900
Cove Point LNG USA 2014 Scheduled for 2017 5,250
Yamal LNG Russia 2013 Scheduled for 2017 16,500
Prelude FLNG Australia 2011 Scheduled for 2018 3,600
Ichthys LNG Australia 2012 Scheduled for 2018 8,400
Cameron LNG USA 2014 Scheduled for 2018 13,500
Freeport LNG USA 2014 Scheduled for 2018 13,900
Corpus Christi LNG USA 2015 Scheduled for 2018 9,000
Tangguh (expansion) Indonesia 2016 Scheduled for 2020 3,800
Elba Island USA 2016 Scheduled for 2018-
2019
2,500
Source: Institute of Energy Economics, Japan based on corporate press releases
2-2 Necessary Investment for the Future of the Natural Gas and LNG Industry in
2030
2-2-1 Calculating the Estimated Amount of Investment
This section estimates the future amount of investment necessary in the natural gas and LNG industry in the Asia Pacific region. The estimate applies to all APEC economies. The investment estimate targets all new capital expenditures, excluding costs after the initial capital investment has been completed, such as operating costs and maintenance costs and are denoted in 2015 US dollars. The sectors for the estimated investment are the upstream sector, which conducts natural gas exploration and development; the international pipeline sector, which provides natural gas for international trade; the liquefaction sector, which produces LNG; and the regasification sector, which converts the liquid back to gas. The maintenance costs of the delivery pipeline network to the final domestic consumer is outside the boundaries of this estimate because of restrictions on the availability of information necessary to provide an accurate estimate.

29
For investment in the upstream sector (exploration and development), assumptions were made based on the expected increase in production from each region in the future. Specifically, rough estimates were calculated by multiplying the increase in production by region by a fixed unit cost for development expenses. Development expenses differ depending on whether the increase in production is a result of an expansion of existing gas fields or if the development is greenfield. In that sense, it is a top-down estimate methodology based on specific assumptions. Production assumptions are from IEEJ Outlook 2018, released in October 2017 by the Institute of Energy Economics, Japan. The unit price of investment considers the difference of costs in each region, and takes into account the downward trend of upstream development costs after 2014 when crude oil prices began to stagnate, as well as the forecast increase in costs from an increase in activity in development in the future.
Figure 2-1 Outlook for future natural gas production in the Asia Pacific region
Source: BP, Statistical Review of World Energy; Institute of Energy Economics, Japan
The investment estimates for the international pipelines, liquefaction and regasification sectors,
primarily use a bottom-up methodology which adds together the costs of individual projects in its estimates. If information about investments was obtained through company press releases of the investor company, any corresponding estimates found in the press releases were used. If no company information was available, information on any applicable amounts was collected from reputable public news sources. Depending on the project and its progress, it is conceivable that there may be clear differences in disclosed figures and actual amounts. In that case, we estimated the investment using some discretion.
0
500
1,000
1,500
2,000
2,500
3,000
2005 2010 2014 2020 2030 2035 2040
BcmOther
Malaysia
Peru
Indonesia
Australia
Mexico
Canada
China
Russia
US

30
2-2-2 Overall Required Investment The total investment in the natural gas sector in the Asia Pacific region up to 2030, based on
the above estimate method, is $2,243 billion USD. Figure 2-2 and Figure 2-3 show the breakdown by sector and by period, respectively. First, by sector, 86% of total investment will be in the upstream sector. Looking at investment by sector and by period, the ratio of the upstream sector in total investment is expected to rise further in the future. This is because investment activity is currently stagnant from a drop in crude oil prices since the latter half of 2014. Falling oil prices have lowered costs required for upstream development, but this will begin to reverse when upstream investment increases or when the production of higher supply cost natural gas is necessary to meet demand.
Figure 2-2 Investment in natural gas sectors in the Asia Pacific region
Source: Institute of Energy Economics, Japan
Figure 2-3 Investment in natural gas sectors in the Asia Pacific (by period)
Source: Institute of Energy Economics, Japan

31
2-2-3 Investment in the Upstream Sector Next, regarding the investment outlook by sector, starting with investment in the upstream
sector, the United States has the largest share, followed by Russia and China, as shown in Figure 2-4. Figure 2-5 shows this investment by region and by period and it is expected that a large amount of investment will take place relatively early in China. China’s domestic natural gas development is currently accelerating due to rapidly increasing demand of natural gas domestically, which has resulted in a significant investment over the next five years. Russia, however, is currently under economic sanction from Europe and the United States, raising the possibility that investment will slow down in the short term. However, there are still plenty of gas reserves that can be developed at relatively low cost, and it is expected that investment will pick up again in the medium to long term.
Figure 2-4 Natural gas upstream sector investment (by region)
Source: Institute of Energy Economics, Japan
Figure 2-5 Natural gas upstream sector investment (by time period and by region)
Source: Institute of Energy Economics, Japan
US37%
Russia19%
China14%
Other Americas
11%
Southeast Asia11%
Australia8%
Total$1,928 billion(2015-2030)
0 200,000 400,000 600,000 800,000
Australia
Southeast Asia
Other Americas
China
Russia
US
2015-2020
2020-2030

32
2-2-4 Liquefaction Capacity In the liquefaction sector, more than half of future investment in the Asia Pacific region will be
in Australia. There are three projects under construction and two projects that are in the planning stages in Australia at the time of this writing (December 2017). The investment is massive, as these are mostly large-scale liquefaction projects with an annual production capacity of over 5 million tons, as well as being new projects (greenfield) and offshore. The United States is the next largest investor after Australia, with more than 60 million tons of liquefaction projects are currently being built or planned in the United States. Since all US projects are onshore terminals and some are being built next to existing receiving terminals, the total investment for these projects is cheaper, even when considering the number of them (13 in total). The third largest amount of investment is in Russia, however development here, combined with a large production capacity, are subject to severe climate conditions that increase costs. By period, many LNG projects will start to operate by 2020, creating a surplus in supply, and suggesting that investment after 2020 will be slightly slower than the previous period.
Figure 2-6 Investment in liquefaction sector (by region)
Source: Institute of Energy Economics, Japan

33
Figure 2-7 Investment in liquefaction sector (by time period and by region)
Source: Institute of Energy Economics, Japan
Table 2-6 Planned liquefaction projects (unit: mtpa)
Source: Institute of Energy Economics, Japan
Economy Project 2016-2020 2020-2030US Sabine Pass (T4) 4.5US Sabine Pass (T5) 4.5US Freeport (T1-2) 8.8US Freeport (T3) 4.4US Cameron (T1-2) 8.0US Cameron (T3) 4.0US Cove Point 5.3US Corpus Christi 9.0US Elba Island 2.5Indonesia Sengkang 2.0Malaysia Petronas LNG (T-9) 3.6Malaysia FLNG Satu 1.2Australia Wheatstone 8.9Australia Ichthys 8.9Australia Prelude 3.6Russia Yamal 16.5Indonesia Tangguh (T3) 3.8Russia Sakhailin 3 5.0US Free Port (T-4) 5.1US Cameron (T4-5) 10.0US Sabine Pass (T6) 4.5Canada Woodfibre 2.1Canada LNG Canada 12.0Indonesia Abadi (Masela) 7.5Australia Browse 12.0Australia Sunrise LNG 10.0

34
2-2-5 Regasification capacity China has the largest share of regasification facility capacity, with a total of $23.5 billion, to be
invested in seven projects. In general, the construction of terminals in China is comparatively inexpensive, but because of the large scale, occupies a high overall share within the Asia Pacific region. Within ASEAN, many economies are currently studying the implementation of LNG and expansion of their installed regasification capacity, and it is expected that investment will accelerate from 2020 onwards.
Figure 2-8 Investment in regasification sector (by region)
Source: Institute of Energy Economics, Japan
Figure 2-9 Investment in regasification sector (by time period and by region)
Source: Institute of Energy Economics, Japan
35
2-2-6 International Pipelines
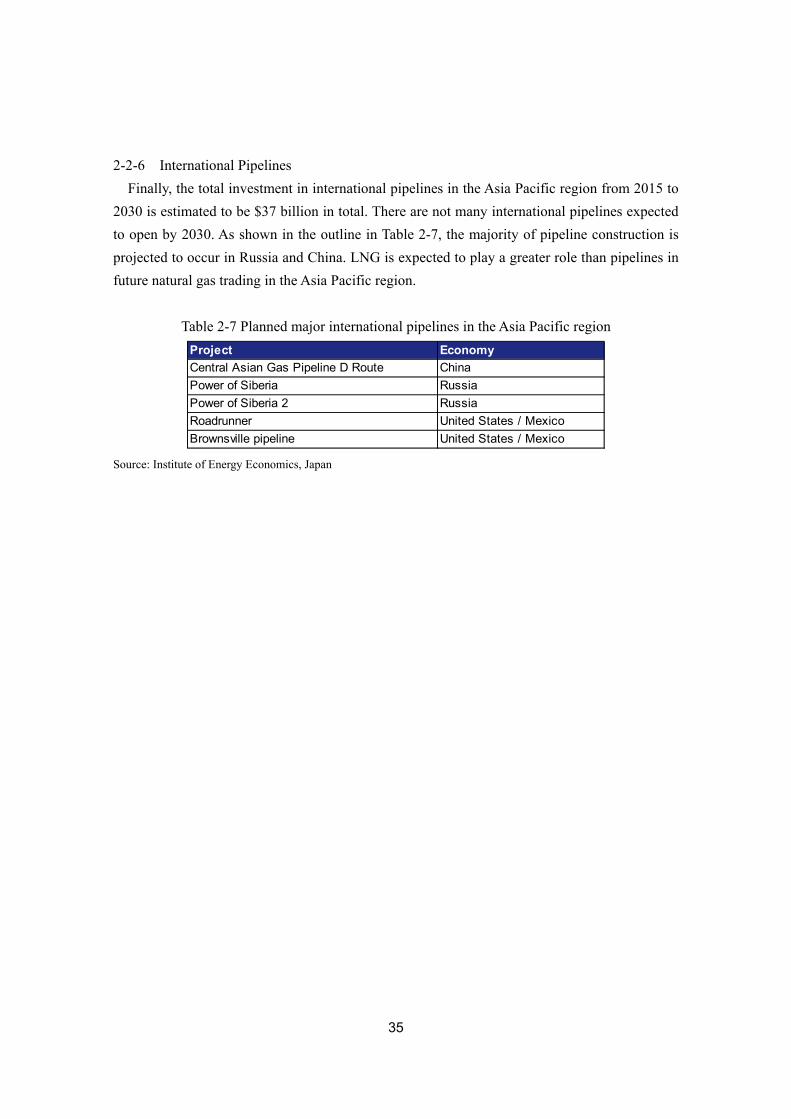
Finally, the total investment in international pipelines in the Asia Pacific region from 2015 to 2030 is estimated to be $37 billion in total. There are not many international pipelines expected to open by 2030. As shown in the outline in Table 2-7, the majority of pipeline construction is projected to occur in Russia and China. LNG is expected to play a greater role than pipelines in future natural gas trading in the Asia Pacific region.
Table 2-7 Planned major international pipelines in the Asia Pacific region
Source: Institute of Energy Economics, Japan
Project EconomyCentral Asian Gas Pipeline D Route ChinaPower of Siberia RussiaPower of Siberia 2 RussiaRoadrunner United States / MexicoBrownsville pipeline United States / Mexico

36
3. Case Studies
3-1 Australia (North West Shelf project)
3-1-1 Background
Australia’s first LNG project was the North West Shelf project in 1989. It was the seventh
LNG export project in the Asia Pacific region and the tenth in the world after Algeria's two, Alaska, Libya, Brunei Darussalam, Indonesia's two, Abu Dhabi, Malaysia. It was only the second in OECD economies. The success of Australia's first project has contributed to confidence in Australia as a reliable supplier of LNG and other energy sources in general among energy consumers and investors, ensuing subsequent LNG project development in the economy especially in the 2010s. As of the end of 2017, five projects were operating and two were under construction in Western Australia and Northern Territory, and three projects were operating in the eastern state of Queensland. This chapter discusses background and factors of success of this project, as well as issues facing ensuing LNG projects in the economy.
Australia is currently the second largest LNG exporting economy in the world with 57 million tonnes of exports in 2017. By the end of 2017, Australia has nominal liquefaction and export capacity of just shy of 70 million tonnes per year, after the start-up of the first train of the Wheatstone project in October. It is expected to surpass Qatar and have the largest export capacity in the world by the end of 2018, although actual exported volumes may differ depending on the global market conditions. Australia is one of the only three economies that produce and export LNG among the 35 OECD members. The other two are the United States and Norway. Rich in natural resources, Australia is a major exporter of commodities. Major commodities in terms of monetary values exported from the economy include iron ores, thermal coal, gold and LNG (natural gas).
Table 3-1 Australia's Top Five Exports in 2016 Value AUD billion Share (%)
Iron ores and concentrates 53.7 16.3
Coal 42.3 12.8
Education-related travel services 22.0 6.7
Gold 18.9 5.7
LNG 17.9 5.4 Source: Austrade web-site

37
Table 3-2 Australia's LNG exports by destination, FY 2016-17 (July - June) FOB Amount (AUD) Volume (tonnes)
Japan 11,311,861,984 24,787,908
China 5,703,737,541 14,971,968
Korea 2,555,235,369 5,562,136
Singapore 1,430,224,657 3,588,029
India 614,706,017 1,487,972
Thailand 139,182,493 275,430
United Arab Emirates (UAE) 49,059,528 139,388
Kuwait 20,212,412 101,390
Mexico 27,553,732 63,020
Total 22,314,968,592 52,152,054 (Note) Data for a small number of economies have been suppressed due to confidentiality but are included in the total. Source: Australian Bureau of Statistics web-site
According to Australian Energy Resources Assessment, Geoscience Australia, 2017, gas is the economy's third-largest energy resource after coal and uranium. Australia has significant conventional gas resources, mostly in the Carnarvon, Browse and Bonaparte basins off the coast of Western Australia; smaller resources exist in the southeast (Gippsland Basin) and central Australia. Conventional gas reserves were estimated to be 77,253 PJ (70 trillion cubic feet [tcf]) at the end of 2014.
Table 3-3 Total Australia gas resources
Resource
category
Conventional
gas
Coal seam gas Tight gas Shale gas Total gas
PJ Tcf PJ Tcf PJ Tcf PJ Tcf PJ Tcf
Reserves 77,253 70 45,949 43 39 0 0 0 123,241 114
Contingent
resources
108,982 99 33,634 32 1,709 2 12,180 11 156,578 143
All identified
resources
186,235 169 79,583 75 1,748 2 12,252 11 279,819 257
Prospective
resources
235,913 214 6,890 7 48,894 44 681,273 619 972,969 885
Source: Australian Energy Resources Assessment, Geoscience Australia 2017 Australia also has significant unconventional gas resources - coal seam gas (CSG), tight gas
and shale gas. CSG resources are associated with the major coal basins in Queensland and New South Wales, with further potential resources in South Australia. According to Australian Energy Resources Assessment, Geoscience Australia, 2017, current reserves of CSG stand at 45,520 PJ (43 tcf), nearly three times the 2008 estimate of 16,590 PJ (15.1 tcf). Many Australian sedimentary

38
basins also have potential for shale and tight gas. In 2014, tight gas resources were estimated at around 48,714 PJ (44 tcf), up from 22,052 PJ (20 tcf) in 2011. Shale gas resources are now in the early stages of exploration, and their size remains to be defined. Contingent resources of 12,180 PJ (11 tcf) have been declared, with 80% in the Cooper Basin. 3-1-2 Investments in North West Shelf project
(1) Project overview
In the 1970s and 1980s, the location of the identified conventional gas resources was mostly offshore the northwest of the economy and far away from the energy demand centers of the East and Southeast coastal areas of the economy. The North West Shelf project was the first LNG export project in the economy in 1989 and was the only LNG export project until it was followed by the Darwin project in 2006. It was the export of gas as LNG that enabled the development of those remote resources, coupled with the domestic pipeline gas supply system.
The project started supplying LNG to Japan in August 1989 from Trains 1 and 2. Train 3
started operation in 1992, opening a new stage in the bilateral relationship between the two economies. The project contributed to the economic prosperity of both Australia and Japan. The LNG project was expanded in 2004 and 2008, eventually reaching nominal export capacity of 16.7 million tonnes per year.
Trains 1, 2, and 3 were intended for the Japanese market, while China was included as a
long-term buyer after Train 4 was completed. Some of the volumes are sold to the project participants for secondary sales and additional volumes are sold under short-term arrangements and in the spot LNG market. As the original gas fields are expected to deplete in coming years, additional sources are being considered from surrounding areas, including third-party gas. This backfill concept is being developed for the sake of extending the lives of existing projects and developing new gas resources.
The North West Shelf project produces condensates and LPG in addition to natural gas. The upstream processing facilities have capability to re-inject excess gas into reservoirs to maintain pressure and accelerate the liquid production. Those by-products have helped the overall economics of the project especially in early stages of the project. The areas surrounding the initial supply sources contain many potential gas prospects, which could backfill the plant after the initial sources deplete.

39
Table 3-3 GDP expansion in parallel with the North West Shelf project 1989 2013 2016 1989/2016
Australia 299.941 billion 1.567 trillion 1.205 trillion 4 fold
Japan 3.052 trillion 5.156 trillion 4.939 trillion +2/3
*Current USD.
Source: The World Bank Database.
Unlike the other LNG exporting economies, development of gas resources in Australia has
been relatively loosely controlled by local and federal governments. There are no national or state government owned energy companies who would directly invest in LNG projects. There are not production sharing schemes that govern the gas development and production. Instead competition and/or cooperation was encouraged between companies to develop gas and LNG projects in a cost effective manner. No single government department or agency had been responsible for development permissions or export licenses, until national export licensing regulation was introduced under the Australian Domestic Gas Security Mechanism (ADGSM) in 2017.
Petroleum resources are regulated by local (State and Territory) governments and the central
(Federal or Commonwealth) government. While the local governments have jurisdiction over onshore assets and facilities, the central government has jurisdiction over facilities more than three nautical miles (5.556 km) offshore. In that sense, the central government has issued most of the necessary permits for development of gas resources offshore Western Australia, including gas resources supplying the North West Shelf project. In terms of environmental impact assessment processes, where the local and central governments may have different requirements, the two authorities have been generally cooperative and relatively swift in approving plans.
The project was the largest resource development project and among the largest construction projects in Australia at that time, with the reported amount of AUD 12 billion (JPY 1.1 trillion at that time). The initial project featured consortia of players in each segment of development:
Upstream and liquefaction stake holders (sellers of LNG): Woodside, BHP Billiton, Shell,
BP, Chevron, and MIMI (Mitsubishi and Mitsui) (for the first time total involvement from upstream to transportation by the Japanese investors)
Buyers: Japanese electric power and city gas companies EPC contractors: Japanese, American and Australian Shipbuilders: Japanese shipyards Ship operators: project partners and Japanese shipping companies
Woodside Petroleum started exploration in the North West Shelf in 1963, followed by by Shell
40
and BP. They found North Rankin and Goodwyn reserves 130 km offshore Dampier in 1971, leading to plans to liquefy them for export to Japan, as well as to supply pipeline gas to the Western Australia's domestic market. (2) Project consortium
Mitsubishi Corporation and Mitsui & Company of Japan were originally responsible for liaison between the five developing companies and the Japanese market. The two companies also decided to participate in the project as marketing partners equal to the original ones. Thus, this project worked as a precedent for the two Japanese companies to actively being involved in other LNG projects in later years. Before the two Japanese trading companies' participation, Woodside Petroleum as the operator of the project had more than 50% of the venture. It wanted to somehow dilute its financial burden without losing its operatorship to the other existing partners.
The Japanese participation contributed to the project significantly by finding customers
(Japanese city gas and electric power companies). Japanese companies wanted to expand their LNG procurement base as LNG is a clean energy source and to procure project equipment such as LNG carriers to be built in Japanese yards. The project needed to secure reliable customers under long-term offtake commitments in order to finance the big investment costs.
When the project's marketing efforts started in the late 1970s, the two Japanese trading
companies merely had a supporting role to the five original partners. The five partners initially planned to supply about three million tonnes per year equivalent of gas via pipeline to the West Australian domestic market. As a second phase of the NWS project, about six million tonnes of LNG supply was envisaged. At that time only Japanese companies were thought to be LNG buyers in the Asia Pacific region. In order to sell volumes to the Japanese market, the two Japanese traders' participation was considered extremely helpful. After taking on Japan Australia LNG (MIMI), a Mitsubishi and Mitsui joint-venture, as a partner, the project was an unincorporated joint venture of six equal partners, Woodside: the three majors and Australia's BHP, as well as MIMI. Each partner respectively signed identical sales contracts with eight Japanese buyers in July 1985, resulting in 48 sales contracts in total.
One of the unique features of the North West Shelf LNG marketing was that relatively similar
volumes were distributed among the eight Japanese buyers, instead of having one or a few dominant buyers as seen in other projects at that time. Success factors for marketing volumes from the project included the credit-worthy line-up of sellers, including renowned international energy companies and Japanese trading houses and envisaged stability of supply from an economy that was deemed to be politically very stable.

41
(3) Engineering and construction The North West Shelf LNG plant was designed and constructed by a contractor consortium
called KJK, including Kellogg of the United States, Australia's Keiser Engineering (which changed to Raymond during the construction period) and Japan's JGC Corporation. The original construction contract was signed between Woodside Offshore Petroleum and the KJK consortium in 1982. The third liquefaction train was completed in 1993. As the scale of the project was so huge by the engineering industry standard at that time, the responsibility within the contractor consortium was shared by the three companies. The entire project was divided into three phases:
1. The first phase comprised of processing facilities for domestic gas supply to be transported
by a 1,300 km pipeline all the way to Perth. This phase was led by Kellogg. 2. The second phase was dedicated to the first two of the three two-million–tonne-per-year
liquefaction trains. This was the largest of the three phases. This phase was led by JGC, who executed engineering and procurement works from its Yokohama headquarters.
3. The third and last phase was to build the last liquefaction train and was led by Keiser. As JGC and Kellogg already had previous experience in constructing large scale LNG
projects, construction at the North West Shelf project went relatively smoothly, within budget and on schedule, thanks to good labor relationship management and cooperative efforts by the companies and people involved.
(4) Transportation
The initial North West Shelf project of three liquefaction trains was to transport 7.5 million tonnes per year of LNG onboard eight dedicated tankers to ten receiving terminals owned by eight utility buyers in Japan. At that time it was a normal practice in the LNG industry for project promoters (sellers) to arrange shipping of LNG. The LNG sales and purchase contracts for the NWS project were concluded on delivered ex-ship (DES) basis, as were done for the preceding LNG projects in the region including the Alaska, Brunei Darussalam, Abu Dhabi and Malaysia LNG projects.
Specific shipping and transportation plans were discussed and developed by the project
shipping committee, represented equally by the six partners. Ship size and design, cruising speed, number of ships, and yards to build those ships were discussed at the committee, accommodating specific requirements by the partners, as well as those from the buyers, who insisted on the ships' compatibility with their receiving terminals. Naturally larger ships were preferred so long as they could be accommodated at the receiving terminals so that economics could improve, reducing the number of required ships and crew members.
The committee concluded that the project would initially have seven 125,000 m3 ships.

42
Several years later another ship was added to accommodate an increase in production volumes. This size was chosen to maintain compatibility with other LNG projects and terminals, as the global trend at that time was between 125,000 m3 and 130,000 m3. Strictly based on the volumes to be transported, six ships would have been enough. In order to have some manoeuvrability and flexibility, one ship was added.
The project companies also negotiated a non-strike agreement with Australia's shipping crew
unions in order to avoid disruptions of marine transportation of LNG, as some of the project ships were to be registered in Australia. At the project committee, the two Japanese companies also insisted that some of the ships should be owned and operated by Japanese shipping companies and be constructed at Japanese shipyards. Out of the eventual eight ships to be used by the initial NWS LNG project, six ships were owned jointly by the six project partners, while the remaining two were jointly owned by five Japanese shipping companies and operated by NYK Line and Mitsui O.S.K. Line (MOL) respectively. All of the eight ships were constructed at Japanese shipyards - four by Mitsubishi Heavy Industries (MHI), three by Mitsui Engineering and Shipbuilding (MES), and one by Kawasaki Heavy Industries (KHI). This combination of Japanese ex-ship buyer consortium, Japanese project financing, Japanese shipbuilding and Japanese shipping operation was followed in the next large-scale LNG project - Qatargas in 1996. (5) Remaining issues for ensuing LNG projects in Australia Gas supply shortage
In the 21st century, seven projects have already started LNG production in the economy - Darwin (2006), Pluto (2012), Queensland Curtis LNG (2014), GLNG (2015), Australia Pacific LNG (2016), Gorgon (2016) and Wheatstone (2017). Two additional projects (Ichthys and Prelude) are under construction and are expected to commence LNG production in 2018.They have encountered difficult issues during development:
Project cost overruns and development delays Production allocation between the domestic and export markets
As LNG projects have been developed in the eastern state of Queensland, which is relatively
close to the Australia's own energy consuming centers, rapid increases of exports have had impacts on supply and prices of gas in the domestic market. With regard to the projects developed within Western Australia, domestic supply arrangements were made in accordance with the state domestic gas policy.

43
Figure 3-1 Gas balance in the state of Queensland
Note: The chart compares gas balances of Queensland between pre-LNG-export (before 2013/2014) and post-LNG-export (2014/2015 - 2015/2016) periods. Queensland's gas production almost tripled from 2013/2014 to 2015/2016. At the same time due to commencement of LNG exports, combined volumes of the state's own gas consumption and LNG exports more than quadrupled in the same period. As a result, the state siphoned 164 PJ and 160 PJ from other states in 2014/2015 and 2015/2016 respectively, although it sent out 81 PJ in 2013/2014. Source: Australian Energy Statistics, December 2017 Buyers’ minor equity holding
The LNG projects in the 21st century, unlike the North West Shelf project, usually have one or two distinct project leading companies, rather than several equal partners, as developers tend to prefer simple and swift coordination between project participants avoiding lengthy discussions. Another interesting trend has been Asian buyers' minority equity participation, in addition to long-term offtake commitment. Equity offers entice buyers as buyers would like to have more control and flexibility these days, and facilitate project development.

44
Table 3-6 Buyers' commitment in Australia's LNG projects
Note: LT: commitment by long-term contract; (LT): commitment by long-term contract under a portfolio contract; EQ:
commitment by equity holding
Source: Institute of Energy Economics, Japan
Cost overruns
Many projects in Australia have experienced cost overruns and schedule slipping in the 2010s. They have been caused by higher labor costs, shortage of skilled labor, insufficient project management, and overheated project development activities (including multiple LNG liquefaction trains being developed at the same period, and other non-LNG resource development activities) leading to a reputation of Australia as the most expensive place to develop LNG projects.
Tohoku Tepco Chubu Kansai Chugoku Kyushu TokyoGas
OsakaGas
NWS LT LT LT LT LT LT LT LTDarwin EQ EQPluto EQ EQGorgon EQ LT EQ EQWheatstone LT EQ LT EQPrelude (LT)Ichthys LT EQ LT LT EQ EQQCLNG (LT) EQGLNGAPLNG LT
Toho Gas Kogas CNOOC PetroChina Sinopec CPC Petronet Petronas
NWS LT LT EQDarwinPlutoGorgon LT LTWheatstonePrelude EQ (LT)Ichthys EQ (LT) LTQCLNG EQGLNG EQ EQAPLNG EQ

45
Figure 3-2 Project cost overruns in the 2010s
Note: * = Only liquefaction plant, excluding upstream ** = Initial cost at the time of Train 1 FID *** = Combined figure for Trains 1-2, only published in AUD figure Unit cost is calculated based on numbers including other hydro carbon production as well as LNG by the author. The main assumptions are as follows: Pluto: Domestic gas production is assumed to be 15% of LNG production from the year 5 and thereafter, as well as condensate production of 5,000 thousand barrels per day. Gorgon: Domestic gas production of 2 million tonnes per year and condensate production of 20 thousand barrels per day. PNG LNG: LPG/and condensate combined production of 30 thousand barrels per day. Prelude: LPG production of 400,000 tonnes per year and condensate production of 1.3 million tonnes per year. Wheatstone: Domestic gas production of 1.34 million tonnes per year and condensate production of 25 thousand barrels per day. Ichthys: LPG production of 1.6 million tonnes per year and condensate production of 100 thousand barrels per day. Source: Institute of Energy Economics, Japan based on various media sources 3-1-3 Financing of North West Shelf project
Financing arrangements were also considered unique. Shell, BP, Chevron and BHP each had
enough funding capability to assume their respective shares of the capital investment. Woodside managed to draw loans from a dozen of banks including the Industrial Bank of Japan and the Chase Manhattan Bank. Mitsubishi and Mitsui secured a project financing deal syndicated by the Export-Import Bank of Japan and a group of Japanese commercial banks headed by the then Bank of Tokyo. The loan was secured on the back of the long-term sales agreements that Mitsubishi and Mitsui signed with LNG buyers, rather than the two companies' credit ratings. It took a little more than a year to close the syndicated financing loan in August 1986 since the sales and
46
purchase agreements were signed in July 1985. In parallel with the financing arrangements construction work started for the liquefaction plant and LNG carriers. 3-1-4 Summary
North West Shelf is undoubtedly one of the most successful LNG projects, which has greatly
contributed to both the domestic and international natural gas markets. The key success factor was an alliance among relevant parties from upstream players to trading houses, from the engineering company, shipping industry and, shipbuilders, to the power and gas utilities. All of these players closely communicated with each other in every phase of the project to minimize the uncertainties of the project. Such alliance formation and close communication enabled the project to start smoothly and maintain stable and reliable operation. The experience of the North West Shelf project suggests close alliance among players across the supply chain is important, especially in a large-scale project such as an LNG plant.
The North West Shelf model worked well in that specific environment and would not work
exactly like this in future development. But it has some positive lessons such as the effective combination of expertise of “major” sellers and buyers who has vast knowledge and experience in the LNG business and the importance of financing by public financial institutions. These could be applied differently adjusted to each project development case. One such lesson will be the importance of close coordination among buyers, sellers, and financiers sectors. Such coordination will reduce uncertainties for each player and facilitate investments to. Co-investing among sellers and buyers, or cross investments where sellers invest in minor shares of downstream assets and buyers invest minor equity of upstream development may be a potential means to enhance such coordination.
While the market cyclicality between looseness and tightness is inevitable, closer coordination
among market players will help to ease such cyclicality by realizing timely investments. Better understanding of the future LNG demand by close communication with buyers will avoid “over competition” among liquefaction projects and cost over-runs in almost all projects. The trend toward a more competitive LNG market is likely to be irreversible. Yet, the experience of the NWS project suggests the significance of a more balanced approach between competition and cooperation in LNG liquefaction project.
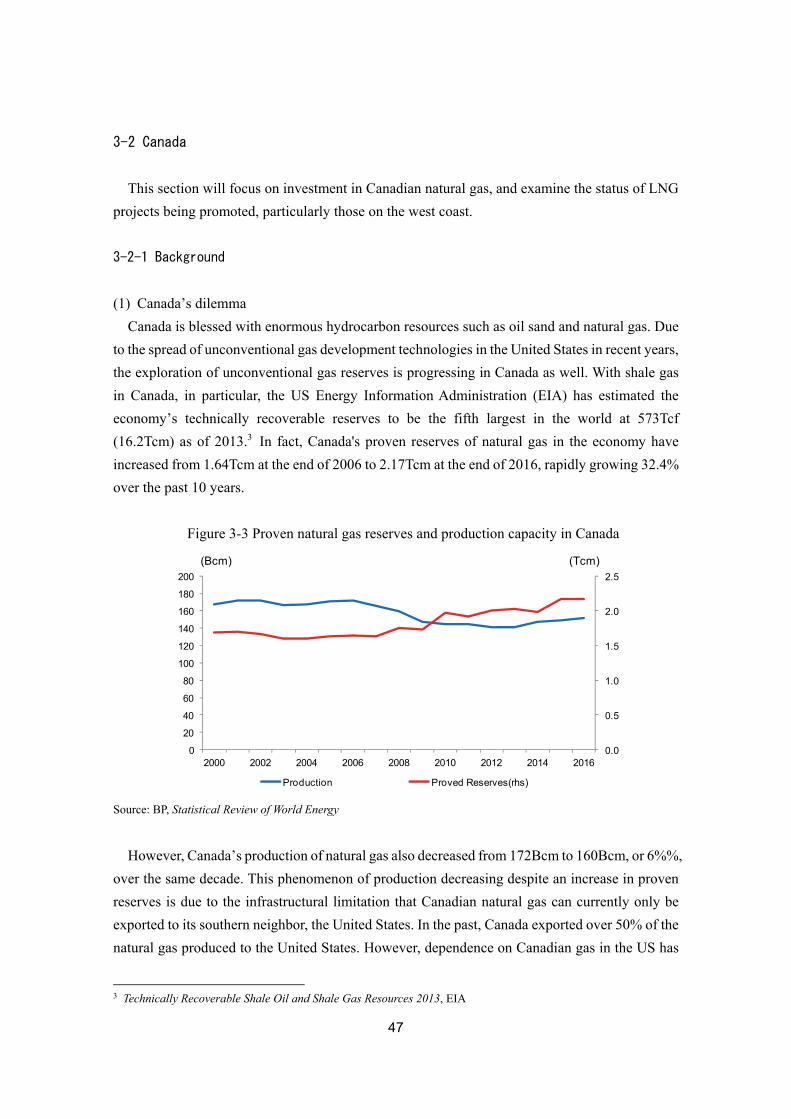
47
3-2 Canada
This section will focus on investment in Canadian natural gas, and examine the status of LNG
projects being promoted, particularly those on the west coast. 3-2-1 Background
(1) Canada’s dilemma
Canada is blessed with enormous hydrocarbon resources such as oil sand and natural gas. Due to the spread of unconventional gas development technologies in the United States in recent years, the exploration of unconventional gas reserves is progressing in Canada as well. With shale gas in Canada, in particular, the US Energy Information Administration (EIA) has estimated the economy’s technically recoverable reserves to be the fifth largest in the world at 573Tcf (16.2Tcm) as of 2013.3 In fact, Canada's proven reserves of natural gas in the economy have increased from 1.64Tcm at the end of 2006 to 2.17Tcm at the end of 2016, rapidly growing 32.4% over the past 10 years.
Figure 3-3 Proven natural gas reserves and production capacity in Canada
Source: BP, Statistical Review of World Energy
However, Canada’s production of natural gas also decreased from 172Bcm to 160Bcm, or 6%%,
over the same decade. This phenomenon of production decreasing despite an increase in proven reserves is due to the infrastructural limitation that Canadian natural gas can currently only be exported to its southern neighbor, the United States. In the past, Canada exported over 50% of the natural gas produced to the United States. However, dependence on Canadian gas in the US has
3 Technically Recoverable Shale Oil and Shale Gas Resources 2013, EIA
0.0
0.5
1.0
1.5
2.0
2.5
0
20
40
60
80
100
120
140
160
180
200
2000 2002 2004 2006 2008 2010 2012 2014 2016
Production Proved Reserves(rhs)
(Bcm) (Tcm)

48
gradually declined since the shale gas revolution has expanded the production of natural gas in the United States, though net exports increased from 79Bcm in 2006 to 84 Bcm in 2016.
Figure 3-4 Canada’s current gas pipeline network
Source: National Energy Board of Canada website
The sluggish exports of natural gas to the United States has created a surplus supply of
natural gas in Canada, which has also caused a slump in domestic gas prices. Alberta Energy Co (AECO), one of Canada’s domestic gas price indexes, continues to trade at a transportation differential to Henry Hub, the US price index, with the annual average price of Henry Hub was $2.52/mmbtu and AECO was $1.63/mmbtu in 2016. The Canadian natural gas sector is dealing with a serious dilemma between expanding reserves and a flat production sector from low prices.
Figure 3-5 Comparison of Canada and US gas indexes
Source: Alberta Energy Regulator website
0
1
2
3
4
5
6
7
8
9
10
2007 2008 2009 2010 2011 2012 2013 2014 2015 2016
AECO(Canada Index)
Henrry Hub(US INDEX)
(US$/MMBtu)

49
(2) LNG exports as a measure to resolve Canada’s dilemma The current challenge of the Canadian natural gas sector is that Canada can only export
natural gas to its neighbor, the United States. However, in the early 2010s, with the LNG market expanding and prices rising in the Asian market, Canada began considering liquefaction projects to export LNG to Asia , given its high supply potential and excess existing supply.
The province of British Columbia (BC) in western Canada, attracted attention as an area for
developing LNG export projects. Most of Canadian unconventional development gas resources are concentrated in the province of BC, and the provincial government announced in 2015 that it has massive shale gas reserves estimated to be 2,800Tcf.4 BC also has the advantage of having west-coast transportation access to Asia as an export destination for LNG. In particular, the location also has a significant advantage of other rival economies in that transportation to Japan, the world’s largest LNG importer, only takes eight days. Furthermore, operating costs of the LNG liquefaction plants decline as the energy efficiency achieved with liquefaction of LNG increases by 1.7% with each 1°C decrease in the ambient temperature, and the average temperature in northern BC is 7°C, which is lower than other rival producing economies. In addition, BC ports are ice-free and not susceptible to hurricanes, so stable year-round operation can also be expected. In addition, the LNG transport route from the west coast of Canada is politically stable, and no risk of supply disruptions is foreseen in the future as the route passes through no politically unstable regions. From these geographical and geopolitical advantages, Canada’s LNG projects are extremely significant not only from Canada’s perspective, but also from the viewpoint of improving gas security in the Asia Pacific region.
Table 3-7 LNG Export days to Japan
Source: Japan Oil, Gas and Metals National Corporation
Table 3-8 Energy efficiency required for LNG liquefaction (vs. BC projects ratio)
Source: Government of British Columbia. LNG in British Columbia: The Opportunity
Based on the above, the possibilities of LNG export projects in BC are being explored, given 4 Government of British Columbia. LNG in British Columbia: The Opportunity
FromTo
Japan 8 days 22 days 8 days 18 days
※via Panama Canal
Canada US※ Australia Middle East
British Columbia Australia Qatar Mozambique Louisiana
Average temperature 7℃ 27℃ 26℃ 23℃ 22℃
Energy Efficiency (vs BC) Reference -34.0% -32.3% -27.2% -25.5%

50
the province’s abundant resources, good access to Asian markets.
3-2-2 Reasons for Delaying LNG Export Projects
Many Canadian LNG project initiatives were launched with high expectations, but were faced
with multiple overlapping negative factors, the most significant of which was the global financial crisis of 2007-08 which caused the collapse of oil and gas prices and impacted project economics. With Australia and the United States initiating their projects sooner to access the LNG market in Asia in the 2010s, depressed market prices continued to be a barrier to the Canadian proposals. By 2017, two projects, Pacific Northwest LNG and Woodfibre LNG, had been given nominal FIDs (final investment decision), and although investment “with conditions” in Pacific Northwest LNG went ahead in 2015, it was eventually canceled in July 2017 because it was no longer economically viable in the current market environment. An FID was also made for Woodfibre LNG in November 2016, but construction that was scheduled to begin in 2017 was postponed to 2018 due to economic and process issues. There are several reasons why Canada’s LNG export projects have been delayed. (1) Delays in the Preparation of a Pipeline Network and Other Infrastructure
The inland areas of the Montney Play, Horn River Basin, Cordova Embayment and Liard Basin developments are where unconventional gas in BC is being developed, while the BC provincial government has planned sites for LNG export terminals at the ports of Kitimat and Prince Rupert on the west coast. However, to realize the LNG export projects, there are the challenges of having to invest in new long-distance pipeline construction through the Rocky Mountains to connect these sources to the terminals planned on the coast, and declining cost competitiveness.

51
Figure 3-6 Planned pipelines for BC LNG projects
Source: Japan Oil, Gas and Metals National Corporation (original map is extracted from Government of British
Columbia website
There is also the challenge of building the electric power transmission network infrastructure
by adding power plants and expanding the power transmission network to secure the power needed to operate the LNG facilities. There was also a commitment to use green energy from the grid such as hydroelectricity rather than using natural gas. Both LNG export projects in BC are greenfield projects, and their cost competitiveness is undeniably low compared with LNG in the United States, which is mainly based on brownfield projects that can utilize existing infrastructure. Similar to Canada, many greenfield projects were advanced in Australia, where construction costs have risen more than anticipated and budgets were exceeded, which have become a factor in curtailing investment decisions for LNG export projects in BC. (2) Complexities of Environmental Reviews
Two government approvals in the form of an export license approval and an environmental

52
approval are required to advance LNG projects in Canada. The former export license approval is relatively easy to obtain from the National Energy Board (NEB). The latter environmental assessment, however, is complicated and two approvals from the BC Environmental Office (BCEAA) and Canadian Environmental Assessment Act (CEAA) must also be obtained. However, many projects were granted a substitution, and in some cases the final environmental assessment review was carried out by the British Columbia government. Six LNG projects received final environmental approvals (i.e., Kitimat LNG, LNG Canada, Woodfibre LNG, Bear Head LNG, Goldboro LNG, Stolt LNGaz). Three LNG projects are under review and 11 project are being planned. (3) Decline of Crude Oil Prices
Lower crude oil prices in recent years have also been a factor in curtailing investment in Canada’s LNG projects. From 2012 onward, the price of crude oil, which had maintained a level of more than $100/bbl, began to sharply decline after June 2014, falling to below $50/bbl six months later in January 2015. The projects in BC were primarily targeted at the LNG market in Asia, but since LNG prices in Asia are determined by their link to crude oil prices, the price of LNG fell in conjunction with crude oil prices. Many projects had originally aimed for FIDs after 2015, but the premise of profitability fell apart with the decline of the price of LNG for Asia, necessitating a review of overall plans, which resulted in further delays.
Figure 3-6 Trend in LNG import price for Japan
Source: Ministry of Finance of Japan, Trade Statistics
(4) Acceptance from Local Communities
Forming a consensus with local communities is also a prerequisite for building an LNG project.
0
20
40
60
80
100
2011 2012 2013 2014 2015 2016 2017
'000 Yen/ton

53
In Canada, there are 1.2 million indigenous peoples, known as First Nations or Aboriginal people, in about 600 tribes or about 4% of the total Canadian population. Of this total, there are approximately 200 tribes and about 200,000 who live in BC. In the early days of the foundation of Canada, the Canadian government and Indigenous peoples concluded several treaties (Numbered Treaties 1-11), but in BC, there were no treaties with Indigenous peoples for more than half of the territory of the province. It is essential to consult with Indigenous peoples in these regions when laying natural gas pipelines or building liquefaction facilities, but the lack of progress in the consultations with Indigenous tribes has been a factor impeding the early realization of LNG projects.
It is a fact, however, that LNG export projects have a large economic effect on communities,
such as creating employment, and that understanding the benefits of a project and obtaining the approval of Indigenous peoples are major driving forces for realizing a project. Although it was a case for a project canceled in 2016, there is the case of the indigenous Haisla Nation, who participated in the Douglas Channel LNG project. Because of the need to consult with local communities, ensuring the benefits of a project are shared with the community has become very important from the perspective of realizing a project.
(5) Problems Securing Labor and Engineers Approximately 30% of all capital expenditures in an LNG export project are said to be personnel expenses. Labor shortages are a chronic problem in oil and natural gas development, such as with labor shortages in oil sands development projects in the province of Alberta (AB), drilling in the Atlantic Ocean and shale gas development in the Montney and elsewhere. Under high commodity price conditions, Canada’s labor market tightened with workers in the oil and gas industry in Canada earning nearly 60% more income than in the United States.
There are no projects in Canada that have entered the actual construction phase yet. However, because there is already a labor shortage in Canada, there are concerns that investors in Canadian LNG projects face rising costs once the construction phase begins, which will cause project delays. (This is happening at a new LNG project being promoted on the west coast of Australia.) To address the labor shortage, the BC provincial government and the Canadian federal government enhanced vocational training programs and relaxing visas for skilled foreign workers with the aim to increase the number of workers, but this has not alleviated the labor market conditions.
(6) Difficulties in Marketing
The lack of adequate marketing (securing customers) for LNG produced by these projects is also a major reason for project delays and cancellations. Firstly, due to the dramatic increase in

54
natural gas production accompanying the shale revolution in the United States and the rise in the global supply capacity of LNG, particularly in Australia, the mainstream market view is that the global LNG market will continue to be oversupplied until the mid-2020s. In this market environment, it is expected that international LNG price determination formulas will also shift from oil-price linked contracts to the spot LNG price and Henry Hub, which represents large uncertainties in the sales volume and selling price of the LNG produced from the investment side of projects although some risk can be reduced by financial hedging.
Also, LNG produced on the west coast of Canada is likely to be exported, based on geography,
mainly to Asian markets. These markets will be very competitive with LNG from Southeast Asia, Australia, the Middle East and from the United States in the future. Given the current market environment, it may be a difficult task for a newcomer like Canada to develop demand to launch a project in the international LNG market for Asia. However, LNG market demand forecasts indicate significant growth that could coincide with Canadian LNG projects coming on-line in the early 2020s. Though some projects have been postponed or canceled, work continues on others in order to encourage FIDs.
3-2-3 Summary
Development of Canadian unconventional gas lags behind its competitors in the LNG export
market, the United States and Australia, due to Canada’s later decision to enter the market. In addition, factors such as complicated environmental assessments, issues of public acceptance, labor shortages and delays in developing infrastructure, are elements of uncertainty that are latent in costs and prolonged construction periods, which have further delayed projects that need to be quickly pushed forward. In addition, under these circumstances, China, Korea, Japan and others who invested in Canada’s LNG export projects have gone ahead with LNG procurement from other markets. With changes in the market environment that favor flexibility in short to medium term contracts, spot purchases have increased, while signing long-term sales and purchase agreements with these purchasers (off-takers) has become difficult. Because of this, many Canadian LNG export projects have considered raising capital through project bonds and project loan markets, but due to delays in the projects, securing a long-term sales and purchase agreement with a creditworthy purchaser (off-taker) has become difficult and receiving loans to carry out a project very challenging.
Due to such deterioration of the environment, many LNG export projects have faced difficulties.
The fact that Pacific Northwest LNG was canceled, even though the decision to invest with conditions was given, was a big blow to Canada. Likewise, LNG Canada, which is considered to have the most advanced project, announced that it will make a decision on the project’s FID by

55
November 2018., The Canadian government has supported projects through measures such as the lowest corporate taxes among G7 countries, accelerated capital cost allowance on LNG facilities and long-term export licenses. Since 2014, the LNG market experienced a significant decline in investments and no major greenfield LNG FIDs were announced around the world; as a result, no FID was reached on Canadian LNG projects. On March 22, 2018, the British Columbia government announced four measures to support LNG projects in BC, including elimination of the LNG tax, aligning of industrial electricity rates for LNG facilities, removing the Provincial Sales Tax (PST) during construction of the LNG facilities and introducing of a Clean Growth Incentive Program.
These cases in Canada suggest that it is still not easy to launch an LNG project from scratch
given the market expansion in recent years and the entry of diverse producers and consumers into the LNG market. There are numerous barriers to entry for new comers, such as securing natural gas, acquiring a cost-effective location, keeping construction costs as low as possible and securing stable customers, which all must be overcome at the same time in order to launch projects.
On the other hand, Canadian LNG projects have many advantages as mentioned at the
beginning of this section. There may be renewed interest in them for those reasons in the future, depending on the supply and demand trends of the international LNG market. The Canadian government is also providing policy support in the form of simplifying and speeding up environmental assessments and improving the supply of skilled labor. Maintaining this political support system will be important going forward as it is expected that the government will continue to its active role to realize future projects.

56
Table 3-9 List of LNG export projects on the west coast of Canada
Source: Institute of Energy Economics, Japan based on information from the web-site of Government of British
Columbia and various media reports
Project Company Capacity(mtpa)
NEBapproval
EIAapproval Status*2
Steelhead LNG: Malahat LNG Steelhead LNG Inc. 6 Approved - △
Kwispaa LNG Steelhead LNG Inc. 24 Approved - △
Triton LNG AltaGas,Idemitsu CanadaCorporation 2.3 Approved - △
Canada Stewart Energy Project Stewart Energy 30 Approved - △
Woodfibre LNG Project Woodfibre LNG Ltd. 2.1 Approved Approved O
WCC LNG LtdImperial Oil ResourcesLimited、ExxonMobil CanadaLtd
30 Approved Submitted △
Watson Island LNG Watson Island LNG Corporation 1 - - △
Orca LNG Orca LNG Ltd. 24 Approved - △
NewTimes Energy Ltd. NewTimes Energy Ltd. 12 Approved - △
Nisga'a LNG Nisga'a Nation N.A. - - △
Kitsault Energy Project Kitsault Energy 20 Approved - △
LNG Canada
Shell Canada, PetroChinaCompany Limited, Korea GasCorporation (KOGAS),Mitsubishi Corporation
24 Approved Approved △
Kitimat LNGChevron Canada Limited andWoodside Energy International(Canada) Limited
10 Approved Approved △
Cedar LNG Cedar LNG ExportDevelopment Ltd. 6.4 Approved - △
WesPac LNG Marine Jetty WesPac Midstream-VancouverLLC 3 Approved Submitted △
Discovery LNG Rockyview Resources Inc. 20 Approved - △
Aurora LNG Nexen, IGBC N.A. Approved - X
Pacific Northwest LNG
Petronas, Sinopec,JAPEXMontney, Indian Montney LTD、Petroleum BRUNE IMontneyHoldings Limited
12 Approved - X
Douglas Channel LNG AltaGas, Idemitsu 1.8 Approved - XCanaport LNG Repsol 5 Approved - X
*1 O: Approved, △: Under review, -: Not applied yet
*2 O: FID, △: Planned, X: Canceled

57
Figure 3-7 LNG export projects on the west coast of Canada
Source: National Energy Board web-site
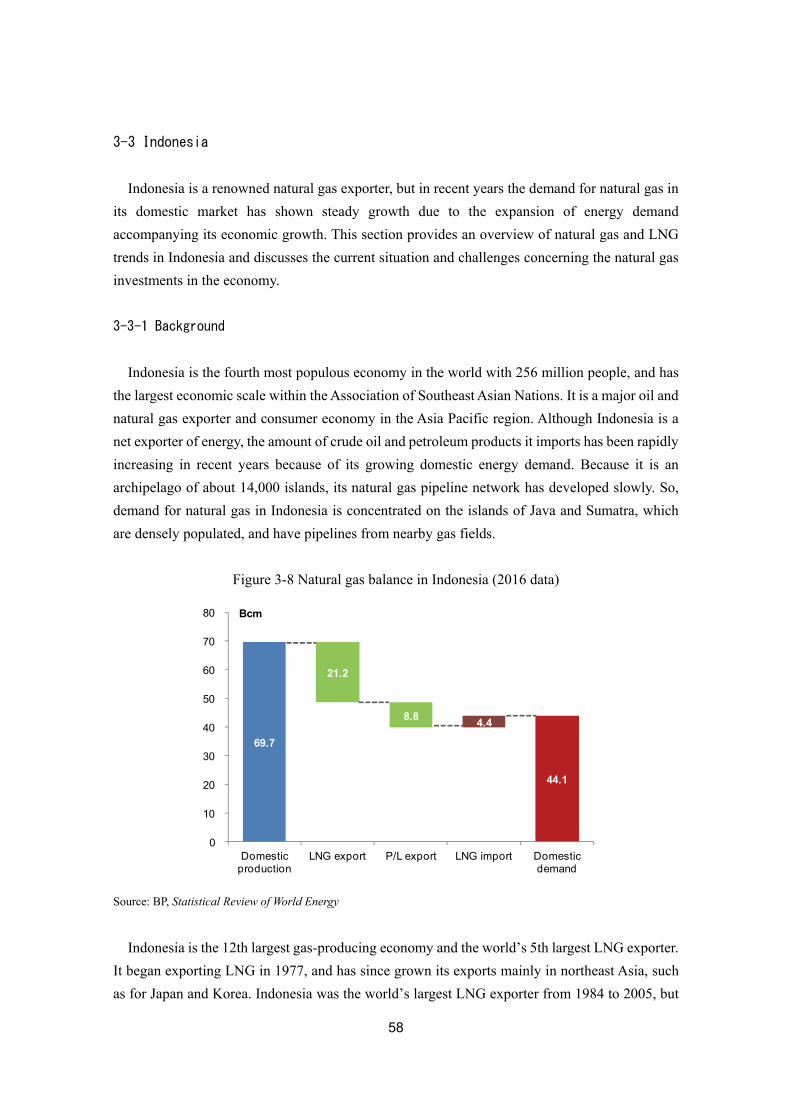
58
3-3 Indonesia
Indonesia is a renowned natural gas exporter, but in recent years the demand for natural gas in
its domestic market has shown steady growth due to the expansion of energy demand accompanying its economic growth. This section provides an overview of natural gas and LNG trends in Indonesia and discusses the current situation and challenges concerning the natural gas investments in the economy. 3-3-1 Background
Indonesia is the fourth most populous economy in the world with 256 million people, and has
the largest economic scale within the Association of Southeast Asian Nations. It is a major oil and natural gas exporter and consumer economy in the Asia Pacific region. Although Indonesia is a net exporter of energy, the amount of crude oil and petroleum products it imports has been rapidly increasing in recent years because of its growing domestic energy demand. Because it is an archipelago of about 14,000 islands, its natural gas pipeline network has developed slowly. So, demand for natural gas in Indonesia is concentrated on the islands of Java and Sumatra, which are densely populated, and have pipelines from nearby gas fields.
Figure 3-8 Natural gas balance in Indonesia (2016 data)
Source: BP, Statistical Review of World Energy
Indonesia is the 12th largest gas-producing economy and the world’s 5th largest LNG exporter.
It began exporting LNG in 1977, and has since grown its exports mainly in northeast Asia, such as for Japan and Korea. Indonesia was the world’s largest LNG exporter from 1984 to 2005, but
69.7
44.1
21.2
8.8 4.4
0
10
20
30
40
50
60
70
80
Domestic production
LNG export P/L export LNG import Domestic demand
Bcm

59
its LNG exports gradually declined as the production of existing gas fields declined and domestic demand increased, and in 2016, it exported 21.72Bcm of LNG (approximately 16 million tons). It began exporting natural gas by pipeline to Singapore in 2001 and to Malaysia in 2009. In 2016, it exported 8.7Bcm of natural gas, exporting 8.1Bcm to Singapore and 0.6Bcm to Malaysia. Its natural gas production in 2016 was 72.2Bcm, with its total export volume (LNG + natural gas) amounting to 30.42Bcm, which accounted for approximately 42% of total natural gas production.
Figure 3-9 Gross natural gas exports in Indonesia
Source: BP, Statistical Review of World Energy
Domestic demand for natural gas, mainly for power generation, has been increasing in recent
years in Indonesia. Domestic gas demand in 2016 was 37.7Bcm, and this demand will continue to increase. According to the Ministry of Energy and Mineral Resources, Indonesia’s demand for natural gas in 2030 is expected to increase 40% compared with 2016.5 First, the Indonesian economy is maintaining a relatively high GDP growth rate among the G20 (5.75% average annual rate from 2007 to 2016),6 underpinned by a steady increase in exports. Second, the domestic use of coal need to be controlled from the perspective of using coal resources effectively. Third, President Joko Widodo, who assumed office in October 2014, plans to promote the development of 35GW of power by 2019 as a pillar of his economic growth policy, which includes plans for the construction of a 13GW gas-fired power plant. The Ministry of Energy and Mineral Resources estimates that the demand for gas by the 13GW natural-gas-fired power plant to be 1,100 mmscfd (approximately 8 million tons of LNG per year).
To satisfy domestic demand, the Indonesian government will not, in principle, extend the long-
term contract set to expire at the Bontang LNG Project liquefaction facility, and as a matter of 5 Ministry of Energy and Mines, 8th IndoGas 2017 (February 2017) 6 IMF World Economic Outlook Database (October 2017)
0
5
10
15
20
25
30
35
40
45
2000 2002 2004 2006 2008 2010 2012 2014 2016
LNG export
Pipeline export

60
policy will reduce LNG exports and shift its natural gas supply to the domestic market. According to an LNG sales manager at Pertamina in October 2017, Indonesia will become a net importer of LNG by 2020 and its gas shortfall may expand to four billion cubic feet per day (equivalent to 30 million tons per year of LNG) by 2030.7
Figure 3-10 Natural gas demand structure in Indonesia
Source: International Energy Agency, Energy Balances of World 2017
3-3-2 Investments in Natural Gas Facilities
(1) The Need for Infrastructure Development
To respond to the rapidly increasing demand for domestic natural gas, the Ministry of Energy and Mineral Resources is rushing to improve Indonesia’s domestic natural gas infrastructure. According to the ministry, in the 15 years from 2016 to 2030, in addition to LNG liquefaction terminals and LNG receiving terminals, developing natural gas infrastructure with the construction of pipelines within the island and across islands, construction of a domestic transport network from domestic liquefaction terminals to demand sites and the addition of CNG facilities as gas supply bases will require $48.2 billion dollars in total investment.8 A breakdown of the total includes, $25.6 billion for LNG liquefaction terminals, followed by $6.1 billion for LNG receiving terminals and $12 billion for pipeline construction, with the rest for a transport network, fuel filling stations and other facilities.
7 Reuters (October 2017): https://uk.reuters.com/article/singapore-energy-pertamina/indonesia-to-become-lng-importer-in-2020-as-population-grows-pertamina-idUKL4N1N02Z6 8 Gas supply is in eastern Indonesia, and as the demand areas are concentrated in western Indonesia, such as on the islands of Sumatra and Java, the local supply and demand balance is unevenly distributed, so it is necessary to transport LNG on small LNG carriers from liquefaction terminals by sea to the demand areas.
0
5
10
15
20
25
30
35
40
45
2000 2002 2004 2006 2008 2010 2012 2014
mtoe
Other
Chemical
Industry
Power

61
Table 3-10 Planned natural gas infrastructure investment (2016-2030)
Source: Ministry of Energy and Mineral Resources, The Impact of Low Oil Price on Gas Projects
Figure 3-11 Planned natural gas infrastructure investment (2016-2030)
Source: Ministry of Energy and Mineral Resources, The Impact of Low Oil Price on Gas Projects
(2) Current and Future Investment Plans for Liquefaction Facilities
There are three liquefaction terminals currently in operation in Indonesia: Bontang (with an annual production capacity of 22.2 million tons), Donggi Senoro (2 million tons) and Tangguh (7.6 million tons). Tangguh Train 3 (3.8 million tons) is being expanded and will have a total capacity of 11.4 million tons when all three trains are completed in 2020. Of the increased LNG production capacity, 75% will be sold to state-owned electric power company PLN, and the remaining 25% will be procured by Kansai Electric Power of Japan.
Securing customers through long-term contracts has made it possible to raise capital for the
project, and BP, the operator of the project, succeeded in receiving a total of approximately $5 billion in financing from domestic and foreign financial institutions ($3.745 billion USD from a consortium of Japanese, Chinese and Korean financial institutions; $1.2 billion from the Japan Bank for International Cooperation; and $400 million from the Asian Development Bank). Project
Item InvestorsInvestment($ billion)
LNG Liquefaction BP. INPEX, Mitsubishi, Shel, EWC, etc. 25.6LNG Receiving Pertamina, PLN, Marubeni, ENMP, etc. 6.1
Pipeline PGN 12Logistics Local 2.2
Fuelling station, CNG Local 1.93LPG Local 0.4
LNG Liquefaction
53%
LNG Receiving13%
Pipeline25%
Logistics4%
Fuelling station, CNG
4%
LPG1%
Total $48.2 billion

62
finance is used for the project, with about $8-$12 billion in investment, and the remaining funding is planned to be contributed by project participants BP, CNOOC, Mitsubishi Corporation and others.
There are two other liquefaction projects being planned. One is the Sengkang LNG project, led
by Energy World Corporation of Australia, and construction of the liquefaction terminal is currently under way. As soon as an agreement is reached with state-owned electric company PLN, the buyer of the LNG, the first train (500 thousand tons) will be in operation, with plans to expand to a fourth train (total of 2 million tons) eventually. The liquefaction facility uses a compact LNG liquefaction train that is easy to manufacture and move, and that also requires less investment, which is easier to finance. Project financing is to be used to fund this project, but its details are unknown.
Table 3-11 LNG liquefaction terminals in Indonesia
Source: Institute of Energy Economics, Japan
The Abadi LNG project is a natural gas liquefaction project promoted by INPEX and Shell in
the Masela Block of the Arafura Sea. It was originally planned as an FLNG (floating liquefaction plant) project with an annual production capacity of 2.5 million tons, but the scale of the project has been expanded after subsequent exploration confirmed that 7.5 million tons of annual
Capacity(mtpa)
Startoperation Partner Investment
($ million)540 1977
BadakⅡ (Train C, D) 540 1983
BadakⅢ (Train E) 280 1989
BadakⅣ (Train F) 280 1993
BadakⅤ (Train G) 280 1998
BadakⅥ (Train H) 300 1999
200 2015
DSLNG (Sulawesi LNGDevelopment(MItsubishi75%,KOGAS 25%)59.9%,PertaminaHulu Energi 29%,Medco LNGIndonesia11.1%)
2,900
760 2009 5,000
(Train 3) 3802020(under
construction)12,000
50→200
2017(under
construction)
Energy Equity Epic Sengkang(Energy World Corporation) 350
N.A. Planned INPEX 65%, Shell 35% N.A.
Project (Train)
Bontang, BadakⅠ (Train A, B)
PT Badak NGL(Pertamina 55%, VICO 20%,Total 10%, JILCO 15%)
N.A.
Donggi Senoro LNG
Tangguh LNG (Train 1, 2) BP 40.22%, MI Berau B.V. 16.3%,CNOOC 13.9%, Nippon OilExploration Berau 12.23%, KGBerau Petroleum 8.56%, KGWiriagar 1.44%, LNG Japan7.35%
Sengkang ,South Sulawesi (Train 1-4)
Abadi

63
production was possible. As a result, in March 2016, the government of Indonesia decided that it would not to be an FLNG but an onshore plant with a greater contribution to the domestic economy. Currently, INPEX is carrying out preliminary work on pre-FEED (conceptual design) based on an onshore scheme, 9 but progress has yet to be seen on securing customers and procuring capital. (3) Current State of Receiving Terminals and Future Investment Plans
Indonesia is also one of the world’s largest exporters of LNG, but because of the rapid increase in domestic demand for natural gas, it started importing LNG from 2012. It has four receiving terminals in operation, three of which are floating terminals and one which is onshore. In Indonesia where domestic gas demand is rapidly increasing, it is aiming to start receiving LNG in a short period of time, and even though it is a gas-producing economy, it still does not have a sufficient domestic pipeline network, and is prioritizing the use of an FSRU (floating storage and registration unit)10 that can be quickly built.
Its first receiving terminal is FSRU Jawa Barat in West Java. It is operated by Nusantara Regas
Satu (Pertamina 60%, Indonesian private company Perusahaan Gas Negara (PGN) 40%) and began operation in 2012. The FSRU is chartered from Golar LNG and has an annual regasification capacity of 5.0Bcm (annual LNG equivalent of 3.7 million tons), and procures LNG from the domestic Bontang LNG terminal.
Indonesia’s second LNG receiving terminal is FSRU Lampung. It is operated by state-owned
gas company PGN and began operation in 2014. The FSRU is chartered from Hoegh LNG and has an annual regasification capacity of 360mmscf/d (annual LNG equivalent of 2.7 million tons), and procures LNG from the Tangguh liquefaction terminal. Indonesia’s third receiving terminal (onshore) is Arun LNG. The terminal was initially built as an LNG liquefaction terminal in 1974, but after liquefaction operations ended in 2014 when the LNG sales contract expired due to a decline in source gas, it was converted to an LNG receiving terminal in 2015 with an annual capacity of 3 million tons. Unlike the previous two terminals, it is an onshore receiving terminal, and its LNG is procured from the Tangguh liquefaction terminal.
In May 2016, Indonesia’s fourth terminal began operation on the island of Bali. It is the first
small-scale terminal (floating storage unit + floating regasification unit) in Indonesia. Since Bali
9 INPEX news release (November 2017): 10 An FSRU is an effective means of supply in Indonesia given that limited demands are scattered over many islands and gas supply pipelines are limited. The FSRU can be retrofitted from an existing LNG carrier, and can be introduced at a lower cost and in a shorter time than ordinary onshore receiving terminals. In addition to lowering the impact on the environment, it has the flexibility of being easily moved and removed to and from where it is needed as necessary.

64
is a tourist destination, land prices are high and it is difficult to obtain land for the terminal, it was decided to make it a floating receiving terminal. Of the FSRUs currently in use around the world, it was built as receiving facility combining FSU and FRU given that the demand size of Bali is too small for a standard FSRU. LNG supplied to the terminal is procured by shuttle transport using small LNG carriers from the Bontang LNG terminal.
There are plans to build four receiving terminals, and all the construction sites are concentrated on Java where demand is the greatest. First, construction of the onshore Bojonegara receiving terminal is scheduled in Banten on the westernmost part of Java. This project is being advanced by Pertamina and Bumi Sarana Migas (BSM), and is scheduled to start operation in 2019. BSM, a subsidiary of Kalla Group owned by Vice President Muhammad Jusuf Kalla, will also build the terminal. The terminal can accept about 4 million tons per year, and will procure its LNG through Pertamina for 20 years, which is planned to supply power plants and factories, but currently Pertamina and its business partner, BSM, have differences of opinion over the economic viability of the project.
Next, the FSRU Cilacap project in central Java is proceeding in Cilacap. It is being planned by
Pertamina Gas (Pertagas), a subsidiary of Pertamina, with an annual capacity of 1.2 million tons, and aims to start operation in 2019. In June 2016, it bid for FSRU procurement, but at the time of this writing (December 2017), the results are not clear. Construction of a pipeline from the terminal has already started, and its customers include not only power plants and fertilizer companies, but also the Cilacap oil refinery, the largest in Indonesia owned by Pertamina on central Java.
The third and fourth projects are so-called package projects that combine gas-fired power plants
with receiving facilities. Pertamina, Marubeni Corporation, and Sojitz Corporation are planning the Jawa-1 project, which is a package project of gas-fired power generation and an FSRU at Cilamaya in West Java. The total cost of the project is about $1.8 billion. In addition to the FSRU, there are plans to construct and operate a 1,760 MW gas-fired power plant and sell the power with long-term contracts to PLN, Indonesia’s state-owned power company. The consortium of three companies has already agreed to a 25-year sales and purchase agreement with PLN in January 2017.11 And, in October 2017, the consortium agreed to have Korean Samsung Heavy Industries build an FSRU at a cost of approximately $221 million.
Finally, the Bantaeng LNG receiving terminal project is also a package project like Jawa-1. In
this project, Energi Nusantara Merah Putih (ENMP), a domestic private energy company, plans
11 Marubeni press release, January 31, 2017 (https://www.marubeni.com/news/2017/release/20170131_2.pdf)

65
to construct and operate an LNG receiving terminal and a 600 MW gas-fired power plant at South Sulawesi, and sell the electricity to PLN. If realized, the LNG receiving terminal will become Indonesia’s first privately-operated terminal. There are also plans for the terminal to be a domestic supply hub with small carriers transporting LNG to islands in eastern and central Indonesia. Whether the receiving terminal will be an FSRU or FSU is still being studied.
Table 3-12 LNG receiving terminals in Indonesia (including those being planned)
Source: Institute of Energy Economics, Japan
3-3-3 Financing for Natural Gas Investments
With respect to capital procurement to continue investment in natural gas in the future, project
finance, which is primarily used by foreign enterprises and financial institutions, is used to raise funds for liquefaction facilities. One example is the Donggi Senoro LNG liquefaction terminal (DSLNG) which began operation in August 2015. DSLNG is the first LNG project to be composed, developed and operated entirely by Asia companies from Japan, Indonesia and Korea without participation from major European and American companies. Funding the liquefaction terminal are Mitsubishi Corporation, the largest shareholder (44.9%) and main operator, Pertamina (29%), KOGAS (15%) and MEDCO Energi International (11.1%). DSLNG uses natural gas produced from three gas fields, about 20 to 50 km away from the liquefaction terminal on the central coast of Sulawesi, and has a liquefaction capacity of 2 million tons per year. Of that capacity, 1 million tons per year will be supplied to JERA, 300,000 tons will be supplied to Kyushu Electric Power Company and 700,000 tons will be supplied to KOGAS over 13 years
Plant PartnerReceivingcapacity(mtpa)
Startoperation
Investmentamount
($ million)FSRU Jawa BaratWest Java
Nusantara Regas(Pertamina 60%, PGN 40%)
300 2012 500
FSRU LampungSouth Sumatra PGN 270 2014 N.A.
Arun (Converted from liquefaction plant) Pertamina 300 2015 80
Benoa (FSU+FRU)Bali Pertamina 40 2016 N.A.
Bojonegara (onshore)Banten, West Java Pertamina, Bumi Sarana Migas 380 2019 750
FSRU CilacapCentral Java Pertamina Gas (Pertagas) 120 2019 N.A.
FSRU Jawa 1Cilamaya, West Java
Pertamina(40%)、Martubeni(40%)、Sojitz(20%)
240 2021 221
Bantaeng (FSRU or FSU)South Sulawesi
Energi Nusantara Merah Putih(ENMP) N.A. 2021 N.A.

66
from 2015.
DSLNG’s total investment is about $2.8 billion, with Mitsubishi Corporation investing about $1.25 billion, while JBIC, Japanese private financial institutions and the Export-Import Bank of Korea collectively financed $1.527 billion.12 Nippon Export and Investment Insurance (NEXI) grants loan insurance, providing investment and loan insurance for natural resources and energy for Mitsubishi Corporation’s investment of approximately $1.25 billion and comprehensive loan insurance for the approximately $382 million invested by the three Japanese banks, offering 100% emergency insurance and 97.5% commercial insurance. Together with the companies carrying out the project, the support by the Export Credit Agency (ECA) from the home economy of the companies making the investment have greatly contributed to the project being carried out and realized.
Figure 3-12 Donggi Senoro LNG project scheme
Source: Institute of Energy Economics, Japan based on Mitsubishi Corporation web-site
Packaging investments in the gas downstream sector with gas-fired power plants and receiving
12 The breakdown is as follows: JBIC, $763 million; total of Sumitomo Mitsui Banking Corporation (agent bank), Bank of Tokyo-Mitsubishi UFJ and Mizuho Bank, $382 million dollars; Korea Export-Import Bank, approximately $382 million.
80mmscfd 85mmscfd 250mmscfd
Donggi SenoroMidstream Liquefaction
Upstream Gas Development
Matindok Gas FieldDonggi Gas Field
Senoro Gas Field
Domestic SupplyPanca Amara Utama(Ammonia Company)55mmscfd
PT PLN (Persero)(Electricity Company)25mmscfd
JGC(EPC Contractor)
Mitsubishi Corporation 44.9%Pertamina 29%Kogas 15%Medco Energi 11.1%
Pertaimna 50%Medco Energi 30%Mitsubishi Corporation 10.2%Kogas 9.8%
Perta 100%
LNG Buyers (Long-term contract)
JERA 1mtpaKyushu Electric Power Company 0.3mtpaKogas 0.7mtpa
Project FinanceJBICthree Japanese Banks,etcUS$1,527mil

67
facilities has become more common in recent years, but project finance is used mainly for private investment in those cases. In Indonesia, there are many examples of soliciting investment in the form of IPP or PPP for the development of relatively economical power close to the area of demand.
On the other hand, PLN invests independently in many other remote power development
projects. Capital procurement in those cases is done through PLN debt, but since regulation keeps domestic electricity prices low, PLN cannot sufficiently recover the costs required for the electricity supply and is in a state of chronic debt. Because of this, PLN cannot secure sufficient funds to invest in power generation facilities, especially in rural areas, so it is critical that the Indonesian government provide subsidies.
3-3-4 Summary
As liquefaction projects in Indonesia, which account for half of energy investment required in
the future, have used project finance led mainly by foreign capital to raise funds, the supply and demand environment of the international LNG market and the securing of stable customers have been the most important factors affecting the realization of project investment. As such, there is a greater possibility of projects being realized if private investment funds can be secured along with public funds from export credit agencies of the importing economies and multilateral development banks such as the Asian Development Bank, as seen with the expansion of the DSLNG project and the Tangguh project. In particular, with financing from multilateral development banks, it is worth the effort to make effective use of project investment because it can be expected to attract loans from other private financial institutions.
Like FSRU Cilacap, with investment in the downstream sector, the number of projects that will
introduce FSRUs and construct associated infrastructure such as natural gas pipelines will increase. Generally, the investment cost of an FSRU is about 60% that of an onshore receiving terminal, and can be installed in a short period of time. In projects like this, since Pertamina and foreign enterprises will basically use project finance, the project itself needs to be economically viable and a firm electric power supply purchase agreement by PLN are needed for the investment to happen.
As for small-scale LNG projects for islands, PLN is seeking to introduce a small-scale 3,000m3
FSRU since ordinary FSRUs are too large for the demand of an island. On the other hand, small-scale FSRUs are not necessarily economical because of their small size, and it is unclear as to how feasible they are. Whether an FSRU or onshore terminal is used, it is important to reduce costs, and efforts to further enhance the competitiveness of the LNG supply will be necessary in

68
the future. The greatest challenge in the development of natural gas-fired power generation in Indonesia
is the development of small-scale gas-fired infrastructure in remote areas, which foreign enterprises and private companies have little interest in. PLN is in chronic debt, and those debts are also rising. In fact, in September 2017, Minister of Finance Sri Mulyani expressed concerns of the rising potential risk of PLN defaulting in a letter to Ignasius Jonan, Minister of Energy and Mineral Resources, and Rini Soemarno, Minister of State-Owned Enterprises. He wrote that the debt and interest burden of PLN is expected to increase in the future, that its financial structure had deteriorated, that PLN had been requesting creditors for debt forgiveness in the past three years, that PLN’s electricity sales were below their targeted levels and that the further regulated electricity rates would not be raised. In June 2016, American S&P Global Rating lowered its rating outlook from “positive” to “stable” on the assumption that PLN’s cash flow and debt service ability would remain low, while in October 2017, the World Bank stated that it was necessary to closely monitor the company’s debt and performance. Therefore, for investment in gas-fired power generation in remote areas, it is vital to improve the financial condition of PLN, and it is also necessary to review the domestic electricity price regulation system.
In addition, the Indonesian government has provided support by establishing several government agencies to promote investment in the electric power sector. In 2009, the Indonesian government established state-owned Sarana Multi Infrastruktur (SMI, an infrastructure finance company) to provide capital increases and long-term borrowing for investment in infrastructure and PPP plan implementation. As of April 2017, the company provided financing for more than 1.5GW of gas and coal-fired power plants that helped spread electrification to 1.7 million households (6.7 million people). Also, in 2009, the Indonesia Infrastructure Guarantee Fund (IIGF) was established to promote the introduction of private capital. Indonesia’s Ministry of Finance provides government guarantees and 9 trillion rupiah (about $700 million) in capital to the Fund, as well as acts a one-stop shop for proposals, assessments and approvals of government guarantees for PPP project developers.
The progress of China’s One Belt One Road Initiative may positively contribute to investment in natural gas infrastructure in Southeast Asia, including Indonesia, in the future. In March 2017, the Asian Infrastructure Investment Bank (AIIB), at the core of supporting the financial aspects of the initiative, announced $285 million in funding for three energy projects, including an improvement project for Indonesia’s dams.13 Going forward, prospects are good for financing the development of natural gas infrastructure in Indonesia.
13 AIIB press release, 28 March 2017 (https://www.aiib.org/en/news-events/news/2017/20170328_001.html)

69
3-4 Singapore
This section discusses the current state and challenges of investment in natural gas
infrastructure by Singapore. It will outline the steps taken by the economy to establish an Asian LNG hub, the infrastructure to be put in place hub, and the potential challenges Singapore could face. 3-4-1 Background
Singapore is a relatively new gas-consuming economy that began using natural gas from the
1990s. Until then, oil accounted for almost 100% of Singapore’s primary energy consumption. Since it began importing piped gas from neighboring Malaysia in 1991, the share of natural gas in its fuel mix has been increasing, and in 2015, it accounted for 36% of primary energy consumption.
Singapore has no natural resources and is mainly dependent on fossil fuel imports to meet its
energy requirements. Due to geographical restrictions, only solar and waste-to-energy are viable sources of renewable energy for the economy. Singapore has low potential for renewable energies such as hydro, geothermal and wind power, and while it considered nuclear power, its feasibility is uncertain given how difficult it would be to locate it within such small national boundaries. In terms of fossil fuels, the use of coal is very limited in the economy due to environmental considerations. Natural gas is hence one of the key energy options alongside petroleum for Singapore.
Table 3-13 Trend in primary energy consumption
Source: International Energy Agency, World Energy Balance 2017
In terms of power generation, natural gas accounted for 95% of the economy’s electricity
supply in 2015, rising significantly from 18% in 2000 (see Table 3-15 below). Given the
U; mtoe Oil Gas Coal Nuclear Hydro Other Total2011 18.4 7.3 0.0 0.0 0.0 0.6 26.32012 17.1 7.9 0.0 0.0 0.0 0.6 25.72013 15.6 8.9 0.3 0.0 0.0 0.7 25.42014 15.8 9.2 0.4 0.0 0.0 0.7 26.12015 15.3 9.2 0.4 0.0 0.0 0.7 25.6Share 60% 36% 2% 0% 0% 3% 100%
Growth % -3.2% 0.4% 2.5% - - -1.3% -1.8%

70
growing significance of natural gas in Singapore’s power mix, the Singapore government announced a plan in 2006 to import LNG to meet the rising demand for electricity generation and diversify its sources of natural gas. Construction of the first LNG receiving terminal in Singapore was completed in 2013.
Table 3-14 Trend in composition of electricity supply of Singapore
Source: Asia Pacific Energy Research Centre, APEC Energy Database
The change in gas imports by Singapore from 2006 to 2016 is shown below. Singapore’s natural gas imports have expanded from 6.6BCM in 2006 to 12.9BCM in 2016 because of expansion and improvements in infrastructure, such as the completion of the LNG receiving terminal in 2013.
Table 3-15 Trend in gas imports in Singapore
Source: BP, Statistical Review of World Energy
3-4-2 LNG Infrastructure Development and LNG Hub Concept in Singapore
(1) The Hub Concept and Construction of Infrastructure
For Singapore, the Asian LNG hub is a place where new natural gas businesses, such as active LNG trading, LNG storage, reloading and bunkering will be created.14
Other than introducing policies to spur the development of an active spot LNG trading market, Singapore has also invested in LNG infrastructure to promote itself as an LNG hub. These include the construction of a multi-user LNG receiving terminal which allows third party 14 Speech script of Mr. Iswaran, Second Minister for Home Affairs & Second Minister for Trade and Industry, January 2013. (https://www.gov.sg/resources/sgpc/media_releases/MTI/speech/S-20130116-1)
U: TWh 1973 1980 1990 2000 2005 2010 2015Coal 0.00 0.00 0.00 0.00 0.00 0.00 0.60Oil 3.72 6.99 15.54 25.32 8.83 9.16 0.35Natural gas 0.00 0.00 0.00 5.86 28.43 35.02 47.91Nuclear 0.00 0.00 0.00 0.00 0.00 0.00 0.00Hydro 0.00 0.00 0.00 0.00 0.00 0.00 0.00Renewable 0.00 0.00 0.17 0.49 0.96 1.18 1.55Total 3.72 6.99 15.71 31.67 38.21 45.36 50.42Share of natural gas 0% 0% 0% 18% 74% 77% 95%
U: Bcm 2006 2007 2008 2009 2010 2011 2012 2013 2014 2015 2016Indonesia 4.8 5.4 6.7 8.4 7.0 6.7 7.9 7.6 6.6 7.9 8.2Malaysia 1.8 1.8 1.6 1.2 1.5 2.3 1.7 1.6 1.7 1.3 1.7LNG 0.0 0.0 0.0 0.0 0.0 0.0 0.0 0.0 2.6 3.0 3.0
Total 6.6 7.2 8.3 9.6 8.4 9.1 9.6 9.2 10.9 12.1 12.9

71
open access; expansion of the terminal to include LNG bunkering and reloading facilities; and the ongoing construction of a nitrogen blending facility at the terminal which will enable Singapore to accept a wider range of LNG cargoes with varying specifications. Singapore is well-positioned to develop an Asian LNG hub. As the leading oil hub in Asia, Singapore is home to many international oil companies, commodity traders and financial institutions. Singapore is also in a geographically favorable position, located on LNG sailing routes from the Middle East and Africa to Northeast Asia, close to Southeast Asian economies where LNG demand is expected to grow in the future, which makes Singapore one of the leading candidates for a trading hub in the Asian LNG market in the future.
Singapore began pipeline imports of natural gas in 1992 through Malaysia’s Peninsula Gas
Utilization (PGU) pipeline, then from Indonesia in 2001 through the West Natuna submarine pipeline and then from the Sumatra submarine pipeline in 2003. However, in the first half of the 2000s, Singapore faced several instances of gas supply disruptions from Indonesia, and Indonesia and Malaysia were both reported to be facing increased domestic demand for natural gas. With natural gas playing an increasing role in power generation, the Singapore government decided in 2006 to import LNG to further diversify its gas supplies and enhance gas security.
Figure 3-13 Major pipelines in southwest Asia
Source: ASEAN Council of Petroleum, Report to 28th Senior Officials Meeting on Energy, 2010
The LNG receiving terminal project was initially awarded to a consortium of private

72
companies. However due to the economic downturn in 2009, it was commercially challenging to finance the project and hence in June 2009, the government of Singapore took over the LNG project with energy regulator Energy Market Authority (EMA) establishing the Singapore LNG Corporation (SLNG) as a wholly owned subsidiary. Since then, SLNG has been operating Singapore’s LNG terminal under the strong support of the Singaporean government. The initial tranche of LNG supply to this terminal was concluded in 2008 with BG Asia Pacific (now Shell). Subsequently in October 2016, Pavilion Gas Pte Ltd and Shell Eastern Trading (Pte) Ltd were appointed to supply the second tranche of LNG for Singapore’s LNG. The second tranche of LNG imports commenced on 23 Oct 2017. Both the appointed importers will have the exclusive right to sell up to 1 Mtpa of term LNG in Singapore, or for three years, whichever is earlier.
In 2014, Singapore spent a total $400 million SGD to expand the storage capacity of the LNG receiving terminal and the jetty, increasing its receiving capacity from 3.5 million tons per year to 6 million tons per year. The LNG terminal receiving capacity in Singapore was originally meant for domestic demand, but as the terminal has been expanding ahead of demand spare terminal capacity could be used for ancillary purposes such as LNG storage and reloading. SLNG is further expanding its LNG receiving terminal and plans to add an additional 5 million tons of receiving capacity in 2018. Depending on the future opportunities, the design of the terminal allows for possible expansion to a total annual receiving capacity to 15 million tons.
The storage and reloading service using the expanded capacity started in February 2015, and
in June 2015, European trader Trafigura and SLNG concluded a contract for Trafigura to use the surplus capacity of 180,000m3 at the receiving terminal. According to the GIIGNL Annual Report of LNG importing group GIIGNL, Singapore reloaded and shipped a total of 195 thousand tons for Japan and Korea in 2015 and 343 thousand tons for Japan; Korea; China; Egypt and Argentina in 2016. In August 2017, SLNG signed a contract with Pavilion Gas of Singapore to use the LNG terminal for 24 months for storage and reloading, trying to further expand business by utilizing the terminal.
In addition, in September 2017, Pavilion Gas, the specialized gas business of Temasek
Holdings, the sovereign wealth fund (SWF) of Singapore, signed an option swap agreement with Germany’s Uniper Global Commodities SE which allows both parties to access LNG receiving terminals in Singapore and Europe. Uniper was given access to Singapore’s storage and reloading facilities and Pavilion Gas gained access to the regasification capacity of the Netherlands’ Gate LNG receiving terminal and the UK’s Grain LNG receiving terminal.
In conjunction with promoting this storage and reloading, Singapore is also promoting LNG
bunkering to further its status as a global bunkering port and to unlock new business

73
opportunities. In July 2016, Keppel Offshore & Marine, a Singapore private company engaged in the design and construction of marine rigs and vessels, and Shell, established FueLNG, a joint LNG bunkering venture in Singapore. Both companies have 50% stakes in FueLNG, and are planning to supply LNG fuel mainly in the Port of Singapore. In September 2017, FueLNG started offering the first commercial truck-to-FLNG ship bunkering in Singapore. Another company awarded with the bunkering license is Pavilion Gas, Temasek Holding, a subsidiary of Singaporean state-owned fund. The company plans to start LNG bunker fuel supply from 2019.15
The Singaporean government is actively supporting the LNG bunkering business, and in
April 2017, the Maritime and Port Authority (MPA) of Singapore invested about $2 million SGD (approximately $1.5 million USD) to build its first LNG truck (lorry) loading facility at SLNG’s LNG terminal. From this loading facility, it is possible to conduct small-scale LNG loading to LNG trucks and deliver it to customers by land transportation, and to bunker it in LNG fuel lines. In addition to this, the MPA introduced a system in 2017 that grants subsidies of up to $2 million SGD to companies that build LNG fuel carriers to promote LNG bunkering in Singapore, and offers tax incentives, such as exemption from port taxes on LNG carriers registered in the port between October 2017 and December 2019. MPA also announced that it will provide another $12 million SGD (approximately $8.6 million USD) to build a new LNG bunkering vessel and support for LNG-fueled vessel building.
With these efforts by the Singapore government, the number of LNG trading companies
moving to Singapore has increased. In 2015, ExxonMobil established an LNG sales company, with Tokyo Gas and INPEX Corporation establishing finance subsidiaries in 2014 and 2016 respectively. In addition, in March 2017, Kansai Electric Power Company established a subsidiary aimed at strengthening the procurement and sale of LNG, and companies have continued to establish corporate trading bases with expectations for Singapore’s LNG hub functions.
(2) Establishing a Trading Market and Creating a Price Benchmark
Another initiative to create an LNG hub is the creation of an LNG trading market. In June 2015, the Singapore Stock Exchange (SGX) established a new index for the LNG spot price through its subsidiary, Energy Market Company (EMC), which operates the electricity market in Singapore, and trading in LNG futures began in January 2016. The LNG price announced by
15 Pavilion Energy Press Release on 19 December 2017 (https://www.mpa.gov.sg/web/portal/home/media-centre/news-releases/detail/8c1ff792-8298-4e24-a1d3-bc1878c4f886) Accessed on 3 February 2018.

74
SGX is called SLing (SGX LNG Index Group), and calculates the price index based on the prices provided by 20 major LNG spot traders. In September 2016, SGX introduced the North Asia SLing index based on the LNG price imported by Japan; Korea; Chinese Taipei and China. In April 2017, SGX also introduced DKI SLing, an index based on the LNG price imported by Dubai, Kuwait and India. By introducing several price benchmarks, Singapore aims to increase their use by LNG traders.
(3) Capital Procurement for the Construction of Infrastructure
Initial investment funds for the construction of LNG receiving terminal and related infrastructures were funded by the government of Singapore. Although Singapore has developed substantial infrastructure in a short period of time, it is felt that it was achieved through the strong support of the Singaporean government.
In addition to the strong backing of the government, funds are also procured from private
banks. In December 2014, SLNG made loan agreements with five financial institutions totaling $11.1 billion SGD (850 million USD). The loans are an extension of the loan contract for the first phase of the LNG receiving terminal completed in 2013, and the funds raised will be used to repay the loan from the government of Singapore. The five participating banks are Citibank, DBS Bank of Singapore, Mizuho Bank, China Oversea-Chinese Banking Corporation (OCBC) and Bank of Tokyo-Mitsubishi UFJ. 3-4-3 Summary
Among the case studies of economies covered in this survey, Singapore is an economy where
the improvement of its natural gas infrastructure has proceeded smoothly. This is consistent with its vision of becoming an LNG hub in Asia, and it has made great contributions in support of that vision from start to finish from the foundation of the operating company of the terminal to financial assistance and development of demand. Expansion of the SLNG terminal with a total capacity of 11 million tons will be completed in 2018, and the development of infrastructure can be deemed to have been completed.
Now that the necessary infrastructure for an Asia hub is virtually in place, there will be
growing interest in the future as to whether Singapore can really become an Asian LNG hub. There are several challenges on this topic. One is that domestic demand for LNG in Singapore is mainly for power generation, and that domestic demand is small and is not expected to greatly increase in the future. Therefore, from the perspective of absolute LNG trading volume, it is difficult to secure enough liquidity to become a hub. Also, it is critical that flexible LNG supply in abundance capable of being resold be provided to realize the Asian LNG hub. Although LNG

75
short-term spot transactions have recently been on the rise, LNG contracts for Asia still mostly have destination restrictions, and there is not necessarily a sufficient flexible LNG supply. Furthermore, for Singapore to become an LNG hub, it is critical that major players in Asian LNG markets (international oil companies, state-owned oil companies producing gas, electricity and gas companies from consuming economies and trading companies) use standardized pricing benchmarks instead of their own in trading. In this respect, it is also essential to actively exchange opinions with these major players and financiers who finance new projects. On the other hand, there are markets near Singapore, such as Indonesia and Malaysia, where LNG demand will expand in the future. If these economies can serve as a supply base for small-scale LNG and Singapore can become an aggregator of regional LNG demand, which will help it become an Asian LNG hub.
Figure 3-14 Trend in short-term and spot trading in the international LNG market
Source: GIIGNL, The LNG Industry 2017

76
4. Conclusions
Lastly, this section considers measures to secure investment that ensures future gas security.
Investment in natural gas and LNG infrastructure requires three steps: identification, reduction and allocation of risks associated with the uncertainty of future projects. In other words, it identifies what kind of risk exists in the investment of the project, reduces those risks as much as possible and allocates the risks that still exist between the parties in the project. This conclusion will examine concrete measures for the three steps to ensure sustainable investment in natural gas in the future for the Asia Pacific region. 4-1 Identifying Risk
There are a multitude of risks in natural gas and LNG projects, but those risks are very diverse.
In general, the largest risk is the market risk of whether stable customers can be secured at a price level that makes recouping the investment possible for the products or services invested in the project, and various risks emerge as the project progresses. For example, when putting a project together, it is necessary to consider the development risk of securing the land to build the infrastructure being invested in, the financial risk over securing the necessary funds for investment and the community risk such as the opposition from the community over infrastructure development. Even after investment has started, there is the political risk that related regulations and policies may change after the decision to invest in the project has been made, and the EPC risk that construction companies cannot carry out construction as planned. Also, after the investment in infrastructure is completed, there is the risk of accidents occurring, the risk of damage to the health of employees and community residents, accompanied by the accidents and the risk to reputation caused by those accidents. It is not possible to identify all risks related to a project when putting a project together. But it is necessary to identify as many assumed risks as possible to facilitate the actual smooth investment.

77
Table 4-1 Risks in natural gas projects
Source: US Department of Energy, Understanding Natural Gas and LNG Options
Types of Risks Risk Description Risk MitigationMarket Risk LNG market balance and competition Economic analysis
Political & Regulatory Risk Polity change, government stability, energyregulatory framework
Engage government as partner to financial anddevelopment negotiations
Development Risk Land rights ownership, FEED study competition,site and land access
Follow known and rigid development processes,leases, contracts, and documentation stages
Financial Risk
Sovereign guarantees, World Bank guarantees,credit worthiness of LNG off-taker, LNG off takerfinancial commitment to upstream, LNG facilityand other auxiliary investment (power plant)
Manage financial actions through known,transparent and internnational monetaryvehicles.Engage investors willing to support long-termsustainable programs
Environmental RiskNatural disaster potential, endangered species,air and water quality emissions to populatedareas
Follow international environmental standardsfrom World Bank, ISO, and main treaties tomitigate future environmental or regulatoryissues.
Engineering, Procurement,and Construction Risk
EPC guarantees and warranties, EPCability to leverage local content withadequate service delivery, training,and schedule assurance.
Engage proven EPCs with track recordto include full "sign-off" of EPC termsand Local Content and SocialResponsibility mandates
Community Impact Risk
Competition for road access, air, light,dust, and noise impacts, social andcultural impacts, waste disposal, priceincrease for food, health andsanitation on community
Engage local government, commercialand industry early in development toinclude full communications planning.Invest early in community-focusedprograms
Personnel Risk Worker safety, control of criminal activity,trafficking control
Invest early in community security andsafety training programs
Health Impact
Limit community and worker exposureto disease, minimizing strain onhealthcare facility availability. Roadsafety
Invest sufficiently early in communityhealth and education/informationprograms
Compliance Penalties
Creating a culture of compliance,timely payment of penalties,enforcement of international treatiesfor compliance (e.g., Child Labor),reporting and monitoring
Develop project management officefor full communications, changecontrol, and compliance programrequirements
Corporate Reputation
Outreach and reputation tocommunity through low to high techcommunications, local contenttraining, community training, primaryand secondary school level training,healthcare provisions, revenueinvestment back to impactedcommunity
Investment in country, community, andcommunications programs for localand global communications of jointgovernment, corporate, and projectsuccesses
Country Reputational Risk
Political reputation federal, state andlocal, community positive impacts,transparency and visible localinvestment into society food, water,energy, and human security
Support governmental public policy,marketing, communications andhighlight international investment topromote country level success

78
4-2 Reducing Risk
In managing investment risk, it is important to reduce the assumed risks in the future by
reducing uncertainty about the future as much as possible through advance countermeasures. There are measures that can be taken to reduce the risk of investing in natural gas, such as building a highly liquid market, drafting a natural gas usage policy by the government of the consuming economy, developing human resources and promoting dialogue between consumers and producers.
4-2-1 Building a Highly Liquid Market
First, from the perspective of reducing risk, is building a highly liquid market system. Needless
to say, the major concern for companies investing in natural gas projects (especially LNG projects) is whether the products of those projects they invested in can be stably sold both in terms of quantity and price. As has already been noted in this study, these risks have historically been managed through long-term contracts of more than 20 years, under Take or Pay provisions in the contracts, or with destination provisions that restrict resale and so forth. However, changing market structures like the emergence of American LNG with no destination restrictions in the future, heightened uncertainty of future demand due to increased market liberalization in the consumer market and the expansion of the use of renewable energies, and an increasing number of emerging LNG importing economies with a demand structure sensitive to price levels, will make it difficult to develop stable demand through the typical rigid long-term contracts.
As the market changes, the trading practice of LNG needs to shift from one that emphasizes
long-term contracts, to one that uses more spot trading to ensure a system that allows natural gas and LNG produced by a company in a project to find stable buyers in the market. By building a highly liquid market in the Asia Pacific region, sellers can reduce the market risk of being unable to find buyers for their products and buyers can also reduce risk of being able to purchase the quantities of gas that can satisfy their demand.
Creating a highly liquid market is viewed as a chicken or egg question as to whether increasing
the spot trade volume should be first step or whether standardizing the price index or contracts should be first. In either case, however, it is important that there is a sufficient flexible LNG supply in the market. In this regard, increasing supply of LNG from the United States without destination restrictions in the future and the June 2017 decision by the Japan Fair Trade Commission, which noted that current LNG sales contract restrictions on destinations may conflict with the Anti-Monopoly Act are positive developments. Under these circumstances, many buyers are also more interested in contracts without destination restrictions, at least with new
79
contracts, ensuring that the flexible supply of LNG will gradually increase. For example, if the competition authorities in consumer economies other than Japan make similar decisions, the flexible supply of LNG without destination restrictions will grow, which will contribute to improving the liquidity of the LNG market in Asia Pacific in the future. 4-2-2 Policy Support by Governments of Consuming Economies
The next measure to reduce risk is the necessity of support through government policy. With
respect to securing demand, one of the major uncertainties in natural gas investment is whether governments in the target economy of investment have already established clear policies on future gas use. If the governments can provide and implement such policies, they can reduce uncertainty about future demand to a certain extent. As seen in the case of Singapore, proactive support by the government plays an important role in the development of infrastructure, but on the other hand, as seen in case study of Indonesia, if the government or state-owned entity does not have sufficient financial resources, its development of infrastructure (particularly downstream) will not proceed smoothly.
One standard gas usage policy is the creation of an energy (power) mix and preparation of a
gas master plan. An energy (power) mix is a numerical value that specifies the target use of natural gas in the primary energy supply and power supply configuration. A concrete example is the Chinese government’s announcement of the goal to increase natural gas u usage to 10% of the primary energy supply by 2020, and the Indian government’s goal of natural gas making up 15% of its primary energy supply. The Japanese government has set the goal of natural gas-fired power making up 27% of the electricity generated in 2030. A government’s commitment to the future use of natural gas is a very positive signal in reducing the risk of investment.
Setting mere numerical targets is not enough, and the government of a consuming economy
must present a policy package to achieve that goal. For example, establishing policy incentives, such as tax exemptions on natural gas investment, has the effect of lowering investment barriers by reducing the absolute amount of investment. Other policies also improve the investment environment and promote investment by advancing measures, such as clarifying environmental regulations, which speed up approvals for the construction of facilities and make decisions transparent. Setting numerical targets combined with policy support to realize those targets helps to reduce future market and political uncertainty.
A gas master plan requires comprehensively defining the demand outlook for natural gas in the future as well as the policy measures required to expand demand such as an infrastructure development plan. The following are specific items to be included in the plan.

80
Table 4-2 Standard items in a gas use master plan
Source: Institute of Energy Economics, Japan
In developing and producing domestic natural gas, it is important not only to grasp reserves but
also to decide who is going to develop gas resources. For example, will development be restricted to domestic companies or should a foreign enterprise with advanced technology be considered, how much of the resource will be left for future generations and at what pace should the resources be developed.
As for the use of natural gas, infrastructure in many cases requires a massive investment, so
economies of scale is often necessary. From that perspective, the potential demand from power plants generally presents the largest opportunity, followed by industrial use. On the other hand, demand for the other sectors such as residential or commercial is usually small, especially in emerging economies. Supply to those sectors will be feasible after a large anchor demand such as power generation and industry is created.
In addition, it is important to create demand outlooks by region as precisely as possible when
considering actual infrastructure development. Demand in each region is created taking into consideration factors such as population and economic scale, major industries and geographical
1. Background and purpose of the plan
2. Analysis of international natural gas and LNG markets and price outlook
3. Domestic natural gas resources and plans for their development
4. Domestic natural gas use sectors
- Power generation, industrial, commercial, home, transport, chemical, GTL,
other
5. Outlook for domestic natural gas demand
- Final energy demand and gas demand in electric power sector
- Demand outlook by region
6. Examination of model and economic viability of industrial natural gas use (as
required)
- Fertilizer, methanol, GTL, etc.
7. Human resources development plan
8. Environmental and social considerations
9. Roadmap for natural gas use
- Securing of natural gas supply sources and construction of the required
infrastructure
81
relationships with existing natural gas infrastructure. Furthermore, it is necessary to advance the creation of a final road map while assuming a concrete completion year for the insufficient portion of the current infrastructure. To realize this roadmap, it is necessary for the governments of consuming economies to both implement policy packages and determine a target energy mix.
4-2-3 Developing Human Resources
The regions where investment in the natural gas sector will be needed are primarily in
developing economies where the demand for natural gas is increasing, so it is important to develop human resources that are familiar with natural gas projects and natural gas policy in these economies. Even in advanced economies, the inability to ensure sufficient labor, as seen in the case study of Canada, can be a factor limiting actual investment. In economies that are engaged in natural gas projects with a specific focus on LNG, more sophisticated knowledge is needed because the construction and operation of LNG plant requires a more specialized expertise, financing of LNG projects requires a more complicated financial arrangement, and safety management of LNG production and trading operation needs more detailed and systematic arrangement than pipeline gas trade. These economies therefore must ensure they have enough talented people with sufficient skills. Moreover, when it comes to making decisions on these huge investments, both the business and the government approving the investment need to have knowledge of natural gas and LNG projects. The presence of talented human resources with sufficient knowledge makes it possible for smooth and accurate investment decision making.
The following specific fields should be considered when developing this type of human
resources. 1) Analysis of the future overall supply and demand of the international natural gas and LNG
markets 2) Knowledge of actual natural gas and LNG procurement contracts (types of contracts,
composition of contract portfolio according to demand patterns, how to proceed with procurement negotiations, etc.)
3) Laws and regulations of the gas business (approvals, price regulations, investment regulations, etc. for businesses)
4) Safety and environmental regulations (required safety and environmental regulations for cargo handling, regasification, transportation and use of LNG)
5) Technology usage (such as the advantages of using natural gas use in various sectors such as industrial, public, and transportation)
6) Government support measures for the use of gas (tax system merits, subsidies and other policy incentives, etc.)

82
Companies trying to introduce natural gas in developing economies have already implemented their own training programs to develop such human resources. The governments of the United States and Japan, for example, who are leading users of natural gas, actively back up such corporate efforts, and take the lead when necessary to promote investment in the natural gas sector. 4-2-4 Promoting Producer and Consumer Dialog
In promoting investment in the natural gas sector in the future, continued dialogue between
gas-producing and consuming economies will also play a major role in reducing the risk of investment. The current environment and structure of the international natural gas and LNG markets are undergoing a major change, which has resulted in significant uncertainty about the direction of the market in the future. This increase in uncertainty will naturally be a factor that hinders investment, so gas-producing and consuming economies can minimize uncertainty by maintaining close relationships and frequently exchanging views on the future market environment.
Some specific dialogue themes include the formation of a framework for improving the
transparency of the natural gas and LNG markets in the future, better investment environment, , and securing of financing and human resource development in emerging markets. Forums where gas-producing and consuming economies can come together to discuss issues are the business-oriented World Gas Conference and Gastech, and the policy-oriented LNG Producer-Consumer Dialogue held every year in Japan. Although these producer-consumer forums offer dialogue from differing positions, they are very valuable opportunities for players to actively exchange market opinions. With increasing self-examination about the future of the natural gas market, such forums should be continued and further expanded going forward.
4-3 Distributing Risk
It is impossible to eliminate all future risks in infrastructure investment and some risk inevitably
remains even after mitigating measures are undertaken in advance. Deciding how to allocate risk is s very important work for realizing a project, because if each stakeholder involved in a project takes on the risk that best matches their risk tolerance and profile.
Even when risk is optimally reduced and allocated under certain conditions, the allocation structure may have to be reviewed periodically to accomodate changes in the market environment. There have been changes in the business environment of the international LNG market in recent

83
years, such as the emergence of American LNG and growing demand from emerging LNG importing economies with elastic demand patterns. It is necessary to continue to constantly review the optimal structure of risk management against these types of changes in the stakeholder environment in the natural gas and LNG markets. 4-3-1 The Bearing of Risk by Public Financial Institutions
To promote the use of natural gas, the gas usage policy of the government of the consuming
economy plays a major role, but even this policy still leaves risk that cannot be sufficiently reduced. What is important is the use of support from public financial institutions. As already mentioned, investment in the natural gas sector (especially in the midstream and downstream sectors) has qualities that make it difficult to raise enough private capital. For this reason, public financial institutions, such as government financial institutions, government upstream investment support agencies, or multilateral development banks like the World Bank, the Asian Development Bank and the Inter-American Development Bank, can take on some risk to increase the feasibility of a project. As seen in the case of Indonesia, when investing in liquefaction facilities, ECAs in the home economy of the investing enterprise and multilateral development banks also play a major role in realizing the investment.
In the United States, infrastructure investment abroad by American companies is handled by
organizations such as the US Export Import Bank (Ex-Im), Overseas Private Investment Corporation (OPIC), US Trade Development Agency (USTDA) and others, who conduct feasibility studies on natural gas projects in the target economies, offer low-interest investment financing and provide trade insurance for the export of equipment and materials. In Japan, organizations such as Japan Bank for International Cooperation (JBIC) and Nippon Export and Investment Insurance (NEXI) are actively engaged in providing similar project funding and trade insurance. Although it is not a financial institution, Japan Oil, Gas, Metals National Corporation (JOGMEC), encourages the promotion of investment in upstream projects by actively providing financial assistance to high-risk exploration activities and projects in the early development stage. Although the contributions these institutions can make are limited and it is necessary to secure primary funding from private financial institutions, it can be a vital contribution to the investment.
Support from multilateral development banks, including the World Bank, is also important. In
recent years, to help achieve the Millennium Development Goals, these financial institutions have been emphasizing the health benefits caused by improvements to energy access and solutions for energy poverty problems, advancing women in the workplace and improving the enrollment rate of children in school. The International Finance Corporation (IFC) of the World Bank Group has already provided support to 30 oil and natural gas projects in 23 economies, and as recently as

84
June 2017, decided to finance an LNG receiving project in Bangladesh, together with development support agencies from the UK, Germany, the Netherlands and Japan. While the World Bank Group announced that it will no longer finance upstream oil and gas projects in December 2017, it will continue to provide financial services to downstream gas sector such as pipeline or gas fired power generation. The Asian Development Bank also supports natural gas projects in Indonesia, China, Bangladesh, Pakistan, India and elsewhere, and China’s One Belt One Road Initiative, as well as the infrastructure investment banks under it, will likely have major roles to play.
These multilateral development banks have accumulated comprehensive knowledge about
infrastructure in general, and can not only support simple loans but also offer consulting for entire projects. Moreover, their contributions encourage the participation of other private financial institutions due to the great trust these multilateral development banks possess.
There are many economies where the use of natural gas is expanding that have a high “country
risk,” where public financial support will be important for managing these risks in the future. Table 4-4 shows the country risk of major Asia Pacific economies, showing many of the emerging economies where demand is expected to grow to have a high country risk. In natural gas investment in the downstream sector, the subject of actual projects are often sub-sovereign entities such as national oil companies and local governments. Also, actual revenue from the sale of gas poses a large credit risk for regional power companies and end users of city gas. Support from public financial institutions for projects with these risk profiles is indispensable since it is difficult to raise sufficient funds from private capital alone.
Table 4-4 Country risk of major Asia Pacific economies
Source: Organization for Economic Cooperation and Development, Country Risk Classification
Economy Risk China 2Hong Kong 2Indonesia 3Malaysia 2Mexico 3PNG 6Peru 3Philippines 3Russia 6Singapore 0Chinese Taipei 1Thailand 3Viet Nam 5

85
4-3-2 Consideration of Integrated Projects
Next, investment in the form of integrating across the value chain can be thought of as a new
method of allocating risks that is different from in the past. In creating the natural gas and LNG value chain, upstream development of exploration and development of a gas field, midstream development of LNG liquefaction facilities, and downstream development of regasification facilities and the construction of gas-fired power generation have been carried out while closely integrating and cooperating with each other. On the other hand, in international LNG markets where uncertainty will increase, even traditional upstream companies invest in the electric power business and gas business in order to take on market risk in the consuming market and secure stable demand. By contrast, downstream companies, such as power companies and city gas companies, are actively investing in the upstream sector, and instead of assuming the technical risk and price fluctuation risk in the upstream sector, they are investing in a manner that ensures a more stable supply source in the future by securing their equity portion of production and obtaining more detailed information about the future production of the project. In either case, by investing in a form that integrates different value chains while making investments and assuming risks different from in the past, it is possible to secure stable sales and supply sources, which makes the formation of integrated projects effective in ensuring stable investment.
In fact, these actions have been seen in the past. The Indonesia case study introduced a package
project combining an LNG receiving terminal in the midstream sector and a gas-fired power plant in the downstream sector that is moving forward. ExxonMobil and Qatargas, which had been developing liquefaction facilities in Qatar, had previously reduced downstream sector risk by acquiring the right to use regasification facilities in the UK and the US. There is also the case of Tokyo Electric Power Company and Tokyo Gas, buyers of LNG for Japan, who have partially invested in a liquefaction project in Australia. However, as uncertainty over the future of the international LNG market is rising, upstream companies cannot sit and wait for demand in the downstream sector to appear, and it has become more necessary than ever to actively participate in creating demand. In addition, downstream companies are also actively investing in the upstream sector, making it easier to secure a more reliable supply source in the future. Both upstream companies and downstream companies are required to undertake different types of risk than they have in the past.
4-3-3 M&As and Forming Alliances
It is also possible to manage growing uncertainty through collaboration between organizations
and companies, and in some cases through mergers or acquisitions. If the composition of the above-mentioned integrated project is an effort aimed at vertical integration, then is a move
86
toward horizontal integration. This has already been seen, for example, in February 2016, with the acquisition of BG, which
has strengths in the LNG trading business, by Shell, the largest producer of LNG, and in the December 2016 announcement of the merger between Qatargas and Ras Gas, both producers of Qatar’s LNG. Even among downstream companies, Tokyo Electric Power Company and Chubu Electric Power of Japan launched JERA in April 2015, which integrated fuel procurement and their overseas businesses. This series of corporate mergers is a move to integrate assets among companies, thereby improving business efficiency and taking full advantage of the strengths of their respective assets in allowing them to take on the challenge of new business.
In addition, there are also cases of collaboration between companies. In 2016, JERA entered an
LNG sales and purchase agreement with European utility companies EDF and Centrica, and Tokyo Gas signed a memorandum of understanding with Centrica on their LNG arrangements. Promoting collaboration among LNG buyers in different markets allows companies to reduce the sales risk in LNG projects. Furthermore, in March 2017, JERA, Kogas and CNOOC signed a memorandum of understanding concerning LNG procurement and arrangements, in an effort to reduce the procurement risk and sales risk of LNG by offering flexible LNG arrangements between the companies. 4-4 Summary
Finally, the table below describes the measures and actors in future natural gas investments.
Needless to say, private companies are often the primary parties in natural gas projects. However, as noted in this report, natural gas projects also require government support in various situations. A major factor in ensuring stable investment is to identify the pattern of optimal risk management after assigning roles to government and the private sector that maximizes their respective strengths and characteristics.

87
Table 4-4 Risk management items and corresponding actors Item Actor
Building a highly liquid market Governments of consuming economies, governments of gas-
producing economies, international oil companies, state-
owned oil companies of gas-producing economies,
companies of consuming economies, traders
Gas use policy by governments of
consuming economies
Governments of consuming economies
Developing human resources Governments of consuming economies, governments of gas-
producing economies, international oil companies,
companies of consuming economies
Promoting producer and consumer
dialog
Governments of consuming economies, governments of gas-
producing economies, international oil companies, state-
owned oil companies of gas-producing economies,
companies of consuming economies, traders
Bearing of risk by public financial
institutions
Governments of consuming economies, governments of gas-
producing economies, ECAs of consuming economies,
multilateral development banks
Consideration of integrated projects International oil companies, state-owned oil companies of
gas-producing economies, companies of consuming
economies, traders
M&As and forming alliance International oil companies, state-owned oil companies gas-
producing economies, companies of consuming economies,
traders
Source: Institute of Energy Economics, Japan

APEC Oil and Gas Security Studies
Michael Ochoada SinocruzChrisnawan Anditya
Luis Camacho BeasYoshikazu KobayashiTomoko Matsumoto
Energy Working Group
Photographs credited by APERC
Investments in Natural Gas Supply Chain
under the Low Price Environment
Investments in N
atural Gas Supply Chain under the Low
Price Environment
Energy Working G
roup 2018
EWG 05 2016S
Produced byAsia Pacific Energy Research Centre (APERC)Institute of Energy Economics, JapanInui Building, Kachidoki 11F, 1-13-1 KachidokiChuo-ku, Tokyo 104-0054 JapanTel: (813) 5144-8551Fax: (813) 5144-8555E-mail: [email protected] (administration)Website: http://aperc.ieej.or.jp/
ForAsia-Pacific Economic Cooperation Secretariat35 Heng Mui Keng Terrace Singapore 119616Tel: (65) 68919 600 Fax: (65) 68919 690Email: [email protected] Website: www.apec.org
© 2018 APEC Secretariat
APEC#218-RE-01.3. ISBN 978-981-11-7392-9
AP
EC
Oil and G
as Security S
tudies Series 12
APEC Oil and Gas Security Studies
Series 12June 2018