investment recommendation report closing date: august 2, 2011 ic memo... · investment...
TRANSCRIPT

1
THE STERLING GROUP, L.P.
Powertrain
Investment Recommendation Report
Closing date: August 2, 2011

2
TABLE OF CONTENTS
I. Transaction Summary ................................................................................... 3
II. Company ......................................................................................................... 4
III. Industry Overview .......................................................................................18
IV. Historical Financials ....................................................................................21
V. Standalone Cost Analysis ............................................................................23
VI. Management .................................................................................................24
VII. Attractiveness and Opportunities of Investment ......................................26
VIII. Issues and Risks of Investment ...................................................................29
IX. Post-Closing Initiatives ................................................................................35
X. Transaction ...................................................................................................37
XI. Projections and Returns ..............................................................................38
XII. Recommendation .........................................................................................47
XIII. Appendix .......................................................................................................48

3
I. Transaction Summary
On August 2, 2011, Sterling completed the acquisition of Powertrain (“Powertrain” or the
“Company”), a leading supplier of engine and transmission oil pumps and powdered metal
components to major automotive original equipment manufacturers. The entities constituting
Powertrain are principally owned by Gates Corporation (“Gates”), a wholly owned subsidiary of
Tomkins Ltd (“Tomkins”), and a leading manufacturer of industrial and automotive products,
systems and components. Gates is exiting the business as Powertrain falls outside of Gates’
focus on aftermarket belts, hoses and hydraulics. RBC and UBS jointly represented Tomkins
and Gates on the sale.
Powertrain designs, manufactures and sells oil pumps and powdered metal components used in
engines and transmissions ultimately used in approximately 400 nameplate vehicle platforms.
Headquartered in Ancaster, Ontario, the Company serves its North American customers from
five manufacturing facilities in Ontario, Canada. Additionally, the Company has a technical
center in Aachen, Germany and recently started manufacturing operations in Izmir, Turkey to
serve the European pump market. Through a 30% interest in a JV with Halla Corporation, a
Korean conglomerate, the Company serves the Asian powered metal components market.
Powertrain is in the process of expanding its technical center in Changzhou, China to include
manufacturing to support recently awarded pump business in China. During the trailing twelve
month period ending 5/31/2011, Powertrain generated sales and adjusted EBITDA of $285.8
million and $50.3 million, respectively. Based on management volume forecast (in aggregate, an
approximate 10% discount to CSM volume forecasts), the Company has more than $2.0 billion
in “booked” sales between 2011 and 2015, representing 98% of projected sales over the period.
We conducted considerable due diligence on the Company, including detailed platform level
reviews (customer, competitors, volumes, margins), numerous calls with management, a number
of in-person sessions with management in Toronto, primary diligence calls and meetings with
industry experts arranged through Kingfish and Jon Foster at Current Capital and calls with all
major customers and suppliers. Mr. Foster is a director for Lear Corporation, a global
automotive components manufacturer and Mr. Foster will join Sterling on the board of
Powertrain. Given our exposure to management, we have had a fair chance to evaluate
management and have concluded that the Powertrain management team is professional, quite
sophisticated, detail oriented and results driven. The management team currently has no equity
in Powertrain; we believe that, with appropriate incentives, they would be even more value
creation oriented.
The Powertrain opportunity is attractive for a number of reasons, including: (i) North American
market leader; (ii) substantial revenue visibility; (iii) significant barriers to entry; (iv) strong
management team; (v) significant international growth opportunities; (iv) limited auction with
complexities; and (v) clear opportunity for Sterling value creation. The main risks to this
investment include: (i) Customer concentration; (ii) volume volatility in automotive market; (iii)
high capital expenditure requirements; (iv) raw material variability; (v) Exposure to $CAD/USD
exchange rate; and (vi) technology exposure.

4
We originally submitted an indication of interest on March 4, 2011 of $300 - $320 million,
implying a transaction multiple of 6.5x to 6.9x LTM EBITDA (as of 12/31/10) of $46.3 million,
assuming the CIM forecast included appropriate standalone costs. Through 5/31/11, LTM
Adjusted EBITDA had increased to $50.3. We acquired Powertrain for $290.7 million ($285
million cash + $5.7 million of assumed pension liabilities) or 5.8x 5/31/11 LTM Adjusted
EBITDA / 7.2x 5/31/11 LTM Adjusted EBITDA less an assumed $10.0 million annual
maintenance and replacement CapEx. Pro forma for the NPV of tax benefits associated with the
tax basis step-up of approximately $23 million, the purchase price is equivalent to $267.7
million, or 5.3x LTM Adjusted EBITDA. Total equity for the transaction was $117 million, with
Fund III investing approximately $107 million at close and the balance coming from co-
investors.
II. Company
Overview
Gates Corporation’s Powertrain division (“Powertrain” or the “Company”), headquartered in
Ancaster, Ontario, is a leading supplier of engine and transmission oil pumps and powdered
metal (“PM”) components for automotive powertrains to original equipment (“OEM”)
manufacturers. With eight manufacturing facilities in North America, Europe, China and Korea,
the company serves its core markets and customers with regional and/or local manufacturing,
design, development, and customer service capabilities. Powertrain’s OEM customers rely on the
Company’s ability to design and produce highly durable components for their most important
and widely marketed platforms. The Company’s products are specified into specific powertrain
(engine and transmission) platforms that have an average life of 10 – 15 years with some lasting
as long as 20 years. Currently the Company provides products to 20 such platforms. In turn,
each platform is used across multiple vehicle platforms, resulting in exposure to 400+ nameplate
vehicles.
Powertrain is a market leader in both of its two distinct product segments: oil pumps and PM
components.
Oil Pumps – Representing 51% of Powertrain’s 2010 revenue, these are fixed and variable
displacement oil pumps used in engines and transmissions. The Company is one of the top three
non-captive (70% of the market) automotive oil pump producers in the world. The Company
pioneered the development of variable vane oil pump technology and is the largest variable
displacement pump producer in the world with 21 million installed units. This variable vane oil
pump technology is proven to improve an automobile’s fuel efficiency by 1–2% over fixed
displacement technology and is expected by management to be a driver of future sales growth.
PM Parts – Representing 49% of Powertrain’s 2010 revenue, these are complex fabricated
components, gears, sprockets, assemblies and pump components. The Company is the second
largest automotive PM producer in North America.

5
Overview of Platform Lifecycle
The lifecycle for engine and transmission platforms can range between ten and twenty years,
depending on the specific platform. This lifecycle is substantially longer than for interior
components and systems, which have lifecycles of less than five years. The engine and
transmission platform lifecycle begins with a design phase, followed by the selection of one or
more suppliers (for pumps), initial capital expenditure outlays by the supplier, ramp up, peak
revenues, declining revenues and the end of the platform. The following table outlines the
lifecycle stages for a typical powertrain platform:
Platform Lifecycle Analysis
Year Stage
Year 1 Initial Discussions
Year 2 Prototype Design and Supplier Selection
Year 3 Specification Process and Initial CapEx
Year 4 Initial Ramp; Revenue = X
Year 5 Ramp; Revenue = 2X
Year 6 Ramp; Revenue = 3X
Year 7 Peak Revenue; Revenue = 4X
Year 8 Peak Revenue; Revenue = 4X
Year 9 Peak Revenue; Revenue = 4X
Year 10 Peak Revenue; Revenue = 4X
Year 11 Peak Revenue; Revenue = 4X
Year 12 Decline; Revenue = 3X
Year 13 Decline; Revenue = 2X
Year 14 Decline; Revenue = X
Year 15 End of Program
Powertrain will typically begin discussions for the next generation of a given platform three to
five years before the end of the current generation. Powertrain is well-positioned to win the next
generation of business with existing customers due to the track record and relationships that are
built during the long lifecycle of the existing platforms.
Products
Powertrain’s product portfolio consists of oil pumps and powdered metal products that are sold
into a variety of platforms and then vehicles for OEM’s. The following table summarizes the
Company’s key platforms:
6
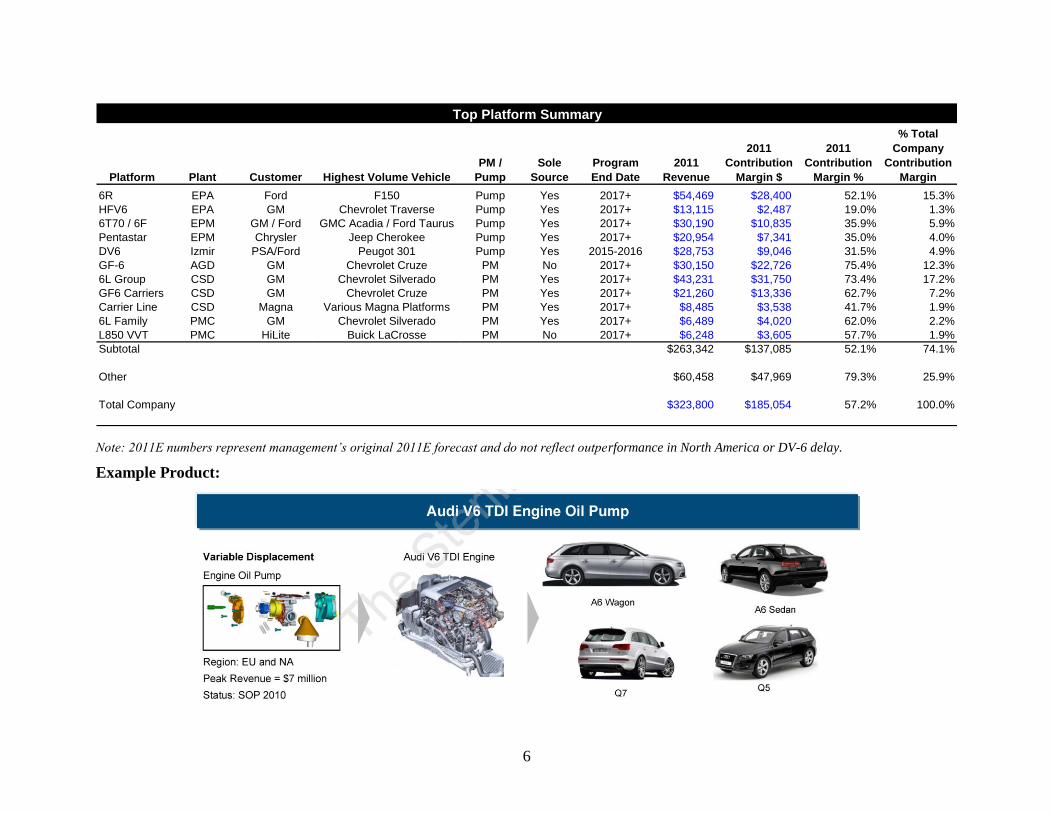
Top Platform Summary
Platform Plant Customer Highest Volume Vehicle
PM /
Pump
Sole
Source
Program
End Date
2011
Revenue
2011
Contribution
Margin $
2011
Contribution
Margin %
% Total
Company
Contribution
Margin
6R EPA Ford F150 Pump Yes 2017+ $54,469 $28,400 52.1% 15.3%
HFV6 EPA GM Chevrolet Traverse Pump Yes 2017+ $13,115 $2,487 19.0% 1.3%
6T70 / 6F EPM GM / Ford GMC Acadia / Ford Taurus Pump Yes 2017+ $30,190 $10,835 35.9% 5.9%
Pentastar EPM Chrysler Jeep Cherokee Pump Yes 2017+ $20,954 $7,341 35.0% 4.0%
DV6 Izmir PSA/Ford Peugot 301 Pump Yes 2015-2016 $28,753 $9,046 31.5% 4.9%
GF-6 AGD GM Chevrolet Cruze PM No 2017+ $30,150 $22,726 75.4% 12.3%
6L Group CSD GM Chevrolet Silverado PM Yes 2017+ $43,231 $31,750 73.4% 17.2%
GF6 Carriers CSD GM Chevrolet Cruze PM Yes 2017+ $21,260 $13,336 62.7% 7.2%
Carrier Line CSD Magna Various Magna Platforms PM Yes 2017+ $8,485 $3,538 41.7% 1.9%
6L Family PMC GM Chevrolet Silverado PM Yes 2017+ $6,489 $4,020 62.0% 2.2%
L850 VVT PMC HiLite Buick LaCrosse PM No 2017+ $6,248 $3,605 57.7% 1.9%
Subtotal $263,342 $137,085 52.1% 74.1%
Other $60,458 $47,969 79.3% 25.9%
Total Company $323,800 $185,054 57.2% 100.0%
Note: 2011E numbers represent management’s original 2011E forecast and do not reflect outperformance in North America or DV-6 delay.
Example Product:

7
Oil Pumps (51% of 2010 net sales)
Overview
The Company’s oil pump products are an important component in the operation of automotive
engines and transmissions, ensuring that there is adequate lubrication within these systems
throughout all ranges of the drive cycle. The Company designs and manufactures transmission
and engine oil pumps based on the engineering requirements of the original equipment
manufacturers. The Company has shipped more than 21 million variable displacement oil pumps
globally and currently produces 17,000 fixed and variable oil pumps per day in North America,
making it one of the largest non-captive oil pump producers in the region and one of the top three
players in the world.
Product Differentiation
Powertrain developed the industry’s first variable vane displacement oil pump. While fixed
displacement pumps provide capacity in direct proportion to engine speed and tend to
overproduce at higher engine speeds, variable displacement pumps adjust output flow according
to actual needs. This technology costs approximately $20 more per pump than a traditional fixed
displacement pump, but improves fuel efficiency by 1-2%. OEM’s have historically paid $60+
for similar improvements in fuel efficiency, implying that the value-proposition for variable vane
displacement pumps is very attractive. Currently, variable vane displacement pumps represent
just 12% of the North American pump market, but are expected to reach 45% of the North
American pump market by 2015, according to CSM and management estimates. The relatively
low variable vane penetration today reflects the long platform lifecycles of existing fixed
displacement technology. The following chart shows the expected increase in variable vane
penetration in North America:
Projected Variable Vane Penetration
North America
12.0%
45.0%
88.0%
55.0%
0.0%
20.0%
40.0%
60.0%
80.0%
100.0%
2011 2015
Variable Vane Fixed Displacement
Source: CSM and management estimates.

8
Top Three Oil Pump Platforms
Powertrain’s three largest oil pump platforms are the 6R, the 6T70-6F and the DV-6:
6R Platform: The 6R platform represents a large, highly complex oil pump sold to Ford.
Management projects units for the 6R to reach 800K units by 2015 versus 570K units in
2011 (reflecting a discount to CSM projections). The Ford F150 truck, the world’s most
popular light truck, is expected to represent 500K of these units. Due to the complex
nature of the pump, the 6R receives a premium price of $95 per pump versus prices of
$30 and below for other pumps. This program is expected to continue beyond 2017.
Powertrain is the sole supplier.
6T70-6F Platform: The 6T70-6F platform represents an oil pump that is sold both to
GM and Ford. The 6T70 is sold to GM, with key vehicles including the Buick LaCrosse,
the Cadillac SRX and the GMC Acadia. The 6F is sold to Ford, with key vehicles
including the Ford Edge, the Ford Explorer and the Ford Taurus. The average selling
price for the 6T70-6F is $30. This platform has reached its peak volume and is projected
to remain at approximately 1,000,000 units per year during the projection period. This
program is expected to continue beyond 2017. It is unusual to be on a platform that
serves two major OEM’s, but this is indicative of Powertrain’s important presence in the
market. Powertrain is the sole supplier.
DV-6 Platform: The DV-6 represents an oil pump platform sold to both PSA and Ford
from the Izmir facility based in Turkey. Units for 2011 originally projected by
management to be 1.25 million. This program is expected to end in 2015/2016, when
volumes will decline from 1.2 million units in 2014 to 500K units in 2015 and then zero
units in 2016. Powertrain is the sole supplier.

9
Powdered Metals (49% of 2010 net sales)
Overview
Powertrain has been a leader in the North American powdered metal manufacturing industry for
more than fifty years. The Company has strong engineering and manufacturing capabilities and
is recognized by its customers as a high-quality, high service-level supplier of powdered metal
components.
Powertrain specializes in products that are used primarily in transfer cases, automatic and manual
transmissions, and engines. These include:
Gears and sprockets
Synchronizer Assemblies
Planetary Carriers
Clutch Components
Pump Components
Engine Components
Product Differentiation
Powertrain services all of the major North American automotive original equipment
manufacturers and has been supplying powdered metal components for more than 50 years.
Industry experts refer to this form of metallurgy as a “black art” and it is our understanding that
competitors have had trouble replicating Powertrain’s capabilities. Advantages of Powertrain’s
powdered metals include:
Superior tensile strength
10% reduction in weight vs. cast/wrought iron parts
20-30% reduction in material wastage
Top Three Powdered Metal Platforms
The three largest powdered metal platforms are the 6L Group / 6L Family, the GF-6 and the GF-
6 Carriers:

10
6L Group / 6L Family: The OEM’s are increasingly outsourcing components and
systems that are not directly related to vehicle design. Powertrain currently manufactures
powdered metals for approximately 1/3 of all GM’s North American vehicle production
through the 6L Group / 6L Family. The only difference between the 6L Group and 6L
Family is that the 6L Group powdered metals are produced at the CSD plant and the 6L
Family powdered metals are produced at the PMC plant. These two platforms are
generally going into the same GM vehicles, which include the Chevrolet Silverado, the
GMC Sierra and the Chevrolet Tahoe. These platforms are expected to continue beyond
2017+. Management expects 2011 units to total 4.1 million units for the 6L Group and
Family combined, ramping to 4.7 million units by 2015.
GF-6: The GF-6 represents an automotive sprocket sold to GM. Powertrain shut down
the automotive gear division in 2009 because the per unit price of $13 for the GF-6 was
not economical at the AGD plant. However, GM then asked Powertrain to reopen the
AGD plant in 2010 to produce the GF-6. A higher price of $22 per unit was contracted
such that the GF-6 would be profitable even while covering 100% of AGD’s overhead.
AGD currently runs at about 25% utilization (to be filled with future volumes). While
Powertrain is currently handling nearly 100% of GM’s GF-6 sprocket needs, there is
currently another supplier ramping up that will share this volume starting in 2013 / 2014.
There are other opportunities being addressed to add utilization to AGD. This program is
expected to continue beyond 2017+. Management expects 2011 units to total 1.3 million
units and remain at this level throughout this projection periods.
GF-6 Carriers: Powertrain has been producing the GF-6 Carriers in the CSD plant since
before 2008. While the GF-6 sprocket is dual-sourced, the GF-6 carriers are sole-sourced
by GM through Powertrain. The GF-6 Carriers are sold into the same vehicles as the GF-
6 sprockets – each respective vehicle uses one sprocket and two carriers. The largest
volume vehicles for the GF-6 (both sprockets and carriers) are the Chevrolet Cruze, the
Chevrolet Malibu and the Chevrolet Equinox. This program is expected to continue
beyond 2017+. Management expects 2011 units to total 1.6 million units, ramping to 2.8
million units by 2015.
Pricing
For the majority of Powertrain’s platforms, the selling price per unit is locked in with the
customer for three to five years. The contracts generally start with a higher initial price that then
decreases by 3% per year, typically for the first three years, to account for the ramping volumes.
Given the interdependency between Powertrain and its customers, it is our understanding that
there is limited pricing pressure once the initial contract has been negotiated and the program has
begun. However, the pricing negotiations resume when Powertrain attempts to win the next
generation of the platform.
Facility Overview
The majority of Powertrain’s facilities and operations are based in Ontario, Canada. While
Canada has higher labor costs than Asia, the Company’s manufacturing footprint does not
provide a significant competitive disadvantage due to the highly automated nature of its
manufacturing operations and customer’s preference to source from regional suppliers. During

11
the site visit, it was clear that the facilities are relatively new and very well-organized and
maintained. Management is comfortable that the existing facilities will be able to accommodate
future growth in North America. Capacity utilization across the oil pump facilities is
approximately 80% and capacity utilization across the powdered metal facilities is approximately
70%. The following chart provides an overview of Powertrain’s facilities:
Facilities Overview
Owned / No. of 2011E Plant % of
Location Division Product Sq. Ft. Leased Employees EBITDA Total(1)
Stratford, Ontario Carrier Systems ("CSD") PM 210,000 Owned 504 $25,168 40.9%
Ancaster, Ontario PM Components ("PMC") PM 140,440 Owned 307 $6,193 10.1%
Mississauga, Ontario Automotive Gears ("AGD") PM 120,000 Owned 244 $1,511 2.5%
Mississauga, Ontario Engineered Products ("EPM") Pumps 100,000 Owned 182 $11,786 19.1%
Ancaster, Ontario Engineered Products ("EPA") Pumps 86,358 Owned 203 $14,056 22.8%
Izmir, Turkey Engineered Products Pumps 130,974 Owned 162 $3,178 5.2%
Ochang, Korea Halla Stackpole JV PM 174,650 Owned 255 $1,869 3.0%
Changzhou, China Engineered Products ("EPC") Pumps TBD TBD TBD ($2,172) (3.5%)
(1) % of Total Plant EBITDA, before corporate overhead.
Europe and Asia Strategy
Currently, the large majority of the Company’s revenue and EBITDA is generated in North
America. In 2010, the Company generated just $8 million of sales in Europe and no sales in
Asia. However, Europe and Asia will represent important sources of future growth for the
Company. The Asia automotive market is growing substantially faster than both the North
America and Europe markets. In terms of exit planning, we believe that developing a presence
in Asia would increase strategic interest in the Company as well as positively impact the exit
multiple. The following table illustrates the Company’s current geographic mix and the projected
geographic mix in 2015 based on management’s projections:
Geographic Mix 2010A-2015E
97.0%
77.0%
3.0%
15.0%
0.0% 8.0%
0.0%
20.0%
40.0%
60.0%
80.0%
100.0%
2010A 2015E
North America Europe Asia

12
Europe Business
Over the last three years, the Company has invested more than $20 million in capital
expenditures in a new plant in Izmir, Turkey. Sterling will benefit from these large upfront
capital expenditures as the new business begins to ramp up during the ownership period. For
example, the Izmir plant includes the DV6 platform, which represented 359 units in 2010, but is
expected to reach 1,250,150 units in 2011. Of the six platforms on which the Company has
positions in Europe, three started production in 2010. Five additional platforms have been
awarded and are scheduled to begin production in 2011-2012.
Asia Business
Asia is forecasted to embrace the variable vane pump technology over the next five years and
Powertrain should be well-positioned from a technological perspective to share in this growth.
The following chart shows the projected variable vane oil pump volumes for the Asia market
from 2010 to 2015:
Projected Variable Displacement Volume in Asia
(millions of units)
1
2
4
5
7
9
0
1
2
3
4
5
6
7
8
9
10
2010A 2011E 2012E 2013E 2014E 2015E
While Powertrain currently does not generate any volume in Asia, the company has booked five
substantial platforms that, in total, are expected to reach approximately 1.5 million units by 2015.
The customers for these platforms are Chery, PSA and SGM. However, Asia is expected to
generate negative EBITDA in 2011 and 2012 and will require significant upfront capital
investment in order to reach these volumes.

13
Customers
Powertrain’s top three customers account for 78% of 2011E revenue and the top eight customers
account for 97% of 2011E revenue. However, within each “customer” are numerous platforms
and vehicles.
Powertrain Customer Concentration
Length of Key % of
Relationship Platforms 2011 Revenue
GM 35 6L, 6T70, SGE, GF6, HFV6 41%
Ford 27 6R, 6F, HF35 25%
Chrysler 22 Pentastar, 68RFE, 45RFE, 62TE 12%
Magna 10 X2T 6%
PSA Peugot Citroen 3 DV EUR5, EB 6%
Audi 5 V6, V8 (several variants) 4%
Hilite 8 L850 VVT 2%
Whirlpool 14 Components for blenders 1%
Others n/a Chery I3, I4 TDGi 3%
For the oil pump division, Ford accounts for 48% of total oil pump revenue, GM accounts for
17% of total oil pump revenue and Chrysler accounts for 15% of total oil pump revenue.
Top 5 Oil Pump Customers
% of Key
Customer Pump Revenue Platforms
Ford 47.9% 6R, 6F
GM 16.9% 6T70, HFV6
Chrysler 15.1% Pentastar
PSA Peugeot Citroen 11.0% DV6
Audi 8.1% V6i, V8
Total 99.0%
For the powdered metal division, GM accounts for 66% of PM sales, Magna accounts for 12% of
PM sales and Chrysler accounts for 8.6% of PM sales. Ford Motor Company is aligned with
other powdered metal suppliers and therefore does not use Powertrain for powdered metals.
Ford aims to maintain a diversified supplier base for its components in order to avoid supply
disruptions as well as to avoid providing one supplier with excess pricing leverage.

14
Top 5 Powdered Metal Customers
% of Key
Customer Pump Revenue Platforms
GM 65.9% 6L, GF6
Magna 12.2% X2T and Trilobe
Chrysler 8.6% Clutch plates
HiLite 3.9% L850
Whirlpool 2.6% n/a
Total 93.2%
Customer Contracts
Powertrain’s customer contracts generally last between 3-5 years and provide for contracted
pricing during the term. Given that the platform lifecycles average in excess of ten years,
Powertrain will undergo multiple contract renewal discussions with customers during the course
of the platform’s lifecycle. The Ford contracts are different than for GM and the other customers
– the contract is only one-year in length with automatic rollovers, but pricing is locked in for 3-5
years through a separate LTA agreement. Finally, it’s important to note that the contracts allow
for customers to switch platform providers if there is an issue with quality or execution.
However, historically, a switch during a platform lifecycle has never happened and would be
highly unlikely unless there was a serious quality or safety issue with the product due to
substantial time and costs of testing and qualifying a new supplier. The following table
summarizes the contract terms for our eleven major platforms:
Top Customer Contract Summary
Pass Expiration
Platform Customer Through Date Comments
6R Ford Yes LTA - 2015 Annual contract w/ rollover. Program extends beyond 2017+
HFV6 GM No 2015 Program extends beyond 2017+
6T70 / 6F GM / Ford Yes 2014 Program extends beyond 2017+
Pentastar Chrysler Yes 2014 Program extends beyond 2017+
DV6 PSA/Ford Yes 2015 Program ends 2015-2016
GF-6 GM Yes 2013 Partial renewals expected. Program extends beyond 2017+
6L GM No 2014 Program extends beyond 2017+
GF-6 Carriers GM Yes 2016 Program extends beyond 2017+
Carrier Line Magna Yes 2014 Program extends beyond 2017+
L850 VVT HiLite Yes 2010 Contract renewal underway. Program extends beyond 2017+

15
Vehicles Served
Powertrain’s products are used in a diverse range of vehicles and no one vehicle accounts for
more than 7% of sales. The Ford 150, which uses the 6R platform, represents Powertrain’s top
vehicle. The following table outlines Powertrain’s top 20 vehicle exposure:
Vehicle Concentration (% of Total 2011-2015 Production)
# Top Names Category %
1 Ford F-150 LT - Pickup 6.5%
2 Chevrolet-Malibu Car - Mid-Size 6.3%
3 Chevrolet-Equinox LT - SUV Mid/Full Size 4.8%
4 Chevrolet-Silverado LT - Pickup 3.9%
5 Buick-LaCrosse Car - Mid-Size 3.5%
6 Chevrolet-Cruze Car - Compact 3.3%
7 Buick-Regal Car - Mid-Size 2.6%
8 GMC-Terrain LT - Compact/Crossover 2.2%
9 Chevrolet-Impala Car - Full-Size 1.8%
10 Ford-Focus Car - Compact 1.8%
11 Ford-Explorer LT - SUV Mid/Full Size 1.7%
12 Dodge-Caravan LT - Other 1.7%
13 Cadillac-SRX LT - SUV Mid/Full Size 1.7%
14 Chevrolet-Camaro Car - Full-Size 1.6%
15 Chevrolet-Traverse LT - SUV Mid/Full Size 1.6%
16 Ford-Edge LT - SUV Mid/Full Size 1.5%
17 GMC-Sierra LT - Pickup 1.5%
18 Chrysler-Town & Country LT - Other 1.4%
19 Jeep-Grand Cherokee LT - SUV Mid/Full Size 1.4%
20 Ford-Taurus Car - Full-Size 1.4%
Total 52.2%
While Powertrain is diversified by vehicle, the Company’s vehicle mix does tend toward larger
vehicles. As shown in the chart below, SUV’s and Pickup Trucks comprise approximately 41%
of Powertrain’s total volume sales in 2011. It should be noted that the Company’s pumps are
also used on smaller engine platforms, for example the Chery 3 cylinder engine for the Chinese
market. We have considered the potential impacts of higher gasoline prices on vehicle mix in
our downside model scenarios.
Breakdown by Size of Vehicle
% of Total 2011P
Car - Compact 13.3%
Car - Mid-Size 18.1%
Car - Full-Size 7.4%
Car - Luxury 2.7%
LT - Compact/Crossover 7.0%
LT - SUV Mid/Full Size 26.2%
LT - Pickup 14.5%
LT - Other 10.8%
Total 100.0%

16
Suppliers
Powertrain’s supplier base is diversified with no one supplier accounting for more than 10% of
purchases in 2010. Powertrain’s largest raw material purchases include steel and aluminum
castings for oil pumps and iron for powdered metals. Due to the commodity nature of these raw
materials, Powertrain has alternate suppliers for all of its major purchases and did not experience
supply constraints in 2010, even when sales increased significantly beyond the initial budget.
The Company is in the process of locking down additional suppliers to support future growth in
China.
Powertrain - Summary of Top 30 Vendors
For the year ended 2010 % of
Vendor Name Curr Year 2010 2010
QUEBEC METAL POWDERS LIMITED US 12,548,715$ 9.9%
ACCURCAST INC CA 10,598,624$ 8.4%
IMCG GLOBAL INC US 4,925,915$ 3.9%
AMT DIE CASTINGS CA 4,434,026$ 3.5%
NORTH AMERICAN HOGANAS INC US 3,942,801$ 3.1%
PREMIER TOOL AND DIE CAST CORP US 3,871,002$ 3.1%
ACUPOWDER INTERNATIONAL, LLC US 3,178,003$ 2.5%
KOYO BEARINGS CANADA INC. CA 3,038,464$ 2.4%
HYDRO ONE CA 2,834,034$ 2.2%
LITTLE LAKES MACHINE CA 2,734,071$ 2.2%
Brome Financial Corp. Inc. CA 2,669,700$ 2.1%
ADECCO CA 2,588,681$ 2.0%
SPARTAN LIGHT METAL PRODUCTS US 2,471,758$ 2.0%
WEBER SUPPLY COMPANY INC. CA 2,345,591$ 1.9%
UPS SCS INC - MONTREAL CA 2,166,034$ 1.7%
PMG INDIANA CORPORATION US 2,097,009$ 1.7%
Revstone Industries Burlington CA 2,008,376$ 1.6%
THE STAFFING EDGE INC. CA 1,905,177$ 1.5%
RBC DEXIA INVESTOR SERVICES CA 1,865,382$ 1.5%
TRU-DIE LIMITED CA 1,826,491$ 1.4%
SHELL ENERGY NORTH AMERICA CA 1,814,285$ 1.4%
HUSCO AUTOMOTIVE PRODUCTS LLC US 1,810,727$ 1.4%
INA USA CORP US 1,778,143$ 1.4%
STEVENS RESOURCE GROUP INC CA 1,761,340$ 1.4%
GREAT-WEST LIFE ASSURANCE CO. CA 1,727,741$ 1.4%
WORKPLACE SAFETY & INS. BOARD CA 1,644,118$ 1.3%
NIAGARA TOOLS CA 1,512,166$ 1.2%
SYSTEMATIX INC. CA 1,380,681$ 1.1%
FERRO TECHNIQUE LIMITED. US 1,357,184$ 1.1%
AIR PRODUCTS CANADA LIMITED CA 1,342,645$ 1.1%
Total for Top 30 90,178,883$ 71.2%
Total 2010 Purchases 126,600,000$ 100.0%

17
Competitors
Powertrain competes on a number of dimensions: quality, price, execution and global reach.
Powertrain’s most significant competitor is Magna International. Magna is a global, diversified
automotive components supplier based in Ontario, Canada. Magna manufactures both a fixed
displacement and a variable vane oil pump that are of comparable quality and price points to
Powertrain’s products. However, according to management, Powertrain outperforms Magna
when it comes to execution. According to Robert Mooy, the head of Powertrain’s oil pump
division, “It’s one thing to manufacture one pump successfully during the prototype phase, but
it’s an entirely different challenge to manufacture one million pumps each year for the customer
with 100% on-time delivery.” We expect to confirm our belief that Powertrain is viewed as a top
tier supplier through customer calls during confirmatory diligence. Other key competitors
include SHW, Pierburg and Mahle. SHW and Pierburg have a limited presence in North
America, but have been successful in Europe and Asia. Mahle has been very aggressive on
price, but has had trouble competing with Powertrain and Magna on the quality and execution
dimensions. The following table outlines current market share by region for fixed and variable
displacement pumps for the top competitors in the space:
2011 Market Share AnalysisTransmission Engine
NA Eu Asia NA Eu Asia
Non-captive Fixed Pumps:
Powertrain 37.0% 0.0% 0.0% 16.0% 0.0% 0.0%
Magna International 25.0% 5.0% 5.0% 21.0% 15.0% 5.0%
SHW 0.0% 20.0% 0.0% 2.0% 30.0% 5.0%
Pierburg 0.0% 20.0% 0.0% 2.0% 30.0% 5.0%
Mahle 0.0% 10.0% 0.0% 0.0% 0.0% 0.0%
Non-captive Variable Pumps:
Powertrain 100.0% 0.0% 0.0% 40.0% 15.0% 0.0%
Magna International 0.0% 0.0% 0.0% 44.0% 10.0% 0.0%
SHW 0.0% 0.0% 0.0% 6.0% 35.0% 85.0%
Pierburg 0.0% 0.0% 0.0% 0.0% 15.0% 0.0%
Mahle 0.0% 0.0% 0.0% 0.0% 3.0% 0.0%
Source: CSM data and management estimates.
According to management estimates, Powertrain will gain market share in Europe and Asia by
2015 through variable vane pump business that has already been booked. Powertrain’s current
presence in Europe and Asia is small, as those programs are in the early stages of the platform
lifecycle.

18
III. Industry Overview
Production Volumes
The global automotive market experienced one of the most severe contractions in its history
during the last economic recession. Annualized light vehicle production declined from 15.8
million units in Q2 of 2007 to 6.8 million units in Q1 of 2009. While light vehicle production
remains lower than historic averages, it has improved significantly relative to 2009. This
positive momentum is expected to continue in 2011 due to the increasing age of cars on the road
and the return of consumer confidence and credit availability.
North American Light Vehicle Production
From a historical perspective, the automotive industry has been relatively stable over the last
thirty years. Over the last ten years, production has averaged 14.6 million vehicles per year.
Over the last thirty years, production has averaged 13.9 million vehicles per year. In addition, as
a percentage of the U.S. population, vehicle production levels in 2010 were the second lowest
they have been in thirty years – 3.9% versus a ten-year average of 4.9% and a 30-year average of
5.2%. Additional historical vehicle production data can be found in the Appendix.
Currently, 70% of the market for automotive pumps and powdered metal components is non-
captive and this percentage is projected to grow to 80% by 2015 as automotive manufacturers
continue to outsource to reduce cost, enhance flexibility and benefit from product innovation
driven by specialized expertise.
Underlying Drivers
Underlying drivers of automotive demand include consumer sentiment and vehicle aging.
Consumer confidence has historically been a very good predictor of auto sales, and these
two variables have tracked each other closely:

19
Note: Light blue = auto sales; Dark blue = consumer confidence.
The average age of a car on the road is over 10 years, the highest it has ever been
(according to RL Polk, the average age of a car hit 11 years in 2010), with an average
mileage of 120,000-150,000 thus approaching the point where repairs typically exceed
the cost of buying a new vehicle. Annual vehicle aging is shown in the chart below:

20
CSM Projections
CSM, which was acquired by IHS Automotive in May of 2010, is the most widely used and
trusted independent source of automotive forecasting data. CSM employs over 130 automotive
experts to produce extremely detailed auto production forecasts (down to the vehicle level), and
its customers include 85% of the largest OEMs.
CSM provides independent unit projections for each of Powertrain’s platforms. As evidenced in
the table below, management’s projections are generally in-line with CSM:
Key Pump Platforms - CSM vs. Management
CAGR
2011 2012 2013 2014 2015 '11-'15
6R Platform:
CSM 649,137 694,354 770,687 900,826 934,072 9.5%
Management 572,600 634,500 799,000 799,940 799,940 8.7%
% of CSM 88.2% 91.4% 103.7% 88.8% 85.6%
Pentastar Platform:
CSM 759,382 773,470 779,390 787,625 711,882 (1.6%)
Management 545,250 634,500 681,500 744,245 720,510 7.2%
% of CSM 71.8% 82.0% 87.4% 94.5% 101.2%
HFV6 Platform:
CSM 815,018 1,000,906 913,843 885,298 892,585 2.3%
Management 816,800 1,010,500 971,960 953,395 926,840 3.2%
% of CSM 100.2% 101.0% 106.4% 107.7% 103.8%
6T70-6F Platform:
CSM 1,060,451 1,228,191 1,072,629 1,027,088 990,609 (1.7%)
Management 1,006,400 1,057,500 1,057,500 971,490 971,490 (0.9%)
% of CSM 94.9% 86.1% 98.6% 94.6% 98.1%
DV6 Platform:
CSM 1,657,279 1,734,045 1,850,743 1,943,465 1,779,327 1.8%
Management 1,250,150 1,681,300 1,731,400 1,221,450 500,000 (20.5%)
% of CSM 75.4% 97.0% 93.6% 62.8% 28.1%
Total Major Pumps:
CSM 4,941,267 5,430,966 5,387,292 5,544,302 5,308,475 1.8%
Management 4,191,200 5,018,300 5,241,360 4,690,520 3,918,780 (1.7%)
% of CSM 84.8% 92.4% 97.3% 84.6% 73.8%
Conclusion: Now is an opportunistic time to invest in the automotive sector, when production
volumes are near cyclical lows and the industry is in the early stages of emerging from the last
economic recession. In addition, the availability of detailed, product-level projections from
independent research analysts provides a valuable resource to sanitize management’s
projections.

21
IV. Historical Financials
Summary of Historical Financial Performance
Year Ending December 31,
($ in millions) 2008 2009 2010 LTM 5/31/11
Revenue
Oil Pump $91.6 $82.9 $127.0 $152.5
Powdered Metal 99.0 89.1 135.8 164.0
Corporate and Other Adjustments (1)
(15.4) (9.6) (14.6) (30.7)
Total Revenue $175.2 $162.4 $248.2 $285.8
Oil Pump Revenue % Growth (9.5%) 53.2% NM
Powdered Metal Revenue % Growth (10.0%) 52.4% NM
Total Revenue % Growth (7.3%) 52.8% NM
Total Gross Profit $31.5 $35.1 $56.4 $58.9
% Margin 18.0% 21.6% 22.7% 20.6%
Adj. EBITDA (2)
$19.8 $18.4 $46.1 $50.3
% Margin 11.3% 11.3% 18.6% 17.6%
Capital Expenditures $17.4 $10.2 $25.3 $28.1
% Revenue 9.9% 6.3% 10.2% 9.8%
Key Balance Sheet Items:
Inventory $11.2 $8.0 $15.8 NA
Accounts Receivable 26.3 34.5 43.9 NA
Net PP&E 134.1 152.0 163.4 NA
$0$100$200$300$400$500$600$700
2008
(1) Primarily relates to intercompany sales from PM to pump division.
(2) Includes pro forma standalone costs and KMPG QofE adjustments.
Despite the severe economic downturn, Powertrain’s revenue grew from $175.2 million in 2008
to 248.2 million in 2010, representing a CAGR of 19%.
In 2009, revenue declined by just 7% versus revenue declines by Ford of 19% and GM of 29.8%.
The outperformance was driven by market share gains resulting from new program wins signed
up prior to the recession. These programs were ramping during the early stages of their
lifecycles and helped offset some of the impact of the overall downward economic pressure of
unit volumes.
Revenues in each of Powertrain’s Powdered Metal and Pumps Divisions rebounded in 2010,
with growth of ~50%. This rebound was driven by:
i) Industry Rebound. North American new vehicle production increased from 8.5
million units in 2009 to 11.9 million units in 2010. Ford sales were up 10.9% in 2010
and GM sales were up 29.6% in 2010. The improved vehicle demand provided a
significant industry tailwind for Powertrain.
ii) Existing Business Ramp. Key platforms including the 6R, the HFV6, the 6T70-6F
and the 6L ramped considerably from 2009 to 2010, as they moved closer towards
their peak volume levels.

22
iii) New Business Wins. The Company won considerable new business that began to
show volumes in 2010 including the Pentastar for Chrysler and a variety of other
smaller platforms.
In addition to revenue gains, Powertrain improved gross margins and EBITDA margins in both
2009 and 2010. This improvement was driven by three primary factors:
i) Improved Business Mix. High margin programs, including the 6R and the 6L,
ramped considerably from 2008 to 2010.
ii) Fixed Cost Leverage. The Company’s plant level SG&A and P&PD costs are
almost entirely fixed. Therefore, the Company benefits from improved margins when
volumes increase.
iii) Cost Initiatives. The most significant cost improvements have been generated by
automation. The Company has made substantial capital expenditures to add machines
and reduce headcount.
The cumulative impact of these improvements in revenue and margins is reflected in the
historical growth in EBITDA from $19.8 million in 2008 to $46.1 million in 2010,
representing a CAGR of 52.6%.

23
V. Standalone Cost Analysis
Powertrain currently operates largely on a standalone basis and there are relatively few shared
services with the larger Tompkins organization. For example, when preparing the 2010 audit
for this division, the auditors were required to make very limited carve-out assumptions because
so much of the business was already being operated independently of Tompkins. Management
estimates that the incremental expense to operate the business on a standalone basis would be
$1.5 million. Sterling and KPMG estimate that the incremental expenses to run the business on
a standalone basis would be $2.4 million, reflecting additional amounts in insurance as well as
audit and legal expenses. KPMG has conducted a quality of earnings analysis of the Adjusted
EBITDA as well as an analysis of the standalone cost assumptions, confirming the numbers in
the table below:
Standalone Cost Analysis($ in thousands)
Current Standalone Standalone
Costs Mgmt Estimate Sterling Estimate
North America:
Salaries $6,054 $6,134 $6,134
Benefits 989 1,145 1,145
Insurance 1 106 750
Information Technology 215 371 371
Audit / Legal Fees 320 340 550
Travel / Meals / Entertainment 393 428 428
Outside Services 333 328 328
Miscellaneous 1,101 1,212 1,212
Total North America $9,406 $10,064 $10,918
Europe $2,848 $3,712 $3,712
Total Overhead Costs $12,254 $13,776 $14,630
Standalone Adjustment $1,522 $2,376
LTM 5/31/2011 Adj. EBITDA, pre-Standalone $52,691
Less: Sterling Standalone Costs ($2,376)
LTM 5/31/2011 Adj. EBITDA, post-Standalone $50,315

24
VI. Management
The Sterling investment team has been impressed with the management team at Powertrain. The
experience, depth and sophistication of the management team are stronger than we would
typically expect for a small division of a large, multinational corporation. Powertrain’s
management team has an average of 21 years of experience in the oil pump and powdered metal
components industries. In addition, the management team is excited about the potential benefits
from operating on a standalone basis. On a scale of 1-10 (relative to other Sterling portfolio
companies), we would rank the Powertrain team an 8 or 9.
Peter Ballantyne, President – Peter has served as President of Powertrain since 2010. He
joined Tomkins as VP Business Improvement in 2009. Prior to joining Powertrain, Peter
worked for Magna International as Group General Manager since 2007 and VP
Operations, Managing Director since 2003. Peter has over 25 years of experience in the
automotive industry. He graduated from Queen’s University with a B.Sc. in Engineering
and holds a business diploma from Wilfrid Laurier University.
Rahim Suleman, Director Finance – Rahim has served as the Director Finance since
joining Powertrain in July 2010. Prior to joining Powertrain, Rahim was the Global
Finance Manager for GE Digital Energy. He has served as Corporate Controller and VP
Finance for various organizations and has experience in the manufacturing, information
technology and real estate industries. He has over seven years of experience in the
automotive industry. Rahim is a Chartered Accountant (CA) and holds a Master of
Accountancy and a Bachelor of Arts (Accountancy) from the University of Waterloo.
Andrew Dempsey, Director Engineering – Andrew has served as Director Engineering
since November 2008. He joined Powertrain in November 1998 and has held several
roles of increasing responsibility in the engineering organization. Prior to joining
Powertrain, Andrew served in technical roles of increasing responsibility with several PM
manufacturers. Andrew holds an M.A.Sc. in Metallurgy and Materials Science and a
B.A.Sc. in Metallurgical Engineering and is a member of the Professional Engineers of
Ontario.
Robert Mooy, Vice President Engineered Products Division – Rob has served as VP
Engineered Products Division since April 2008. He joined Powertrain in 2002 as Director
of Product Development and was promoted to VP of Product/Business Development in
2005. Prior to joining Powertrain, Rob held several management and engineering roles of
increasing responsibility in the Tier one automotive supplier segment. He holds a
Bachelors Degree in Mechanical Engineering and is a member of the Professional
Engineers of Ontario.

25
Mohamad El-Mahmoud, Business Unit Director, Asia – Mohamad entered Gates GmbH
Aachen as a Mechanical Designer in 2000. In 2002 he was promoted to Systems
Engineering Manager, a position he kept until July 2004 when he was dispatched to Asia
on an assignment as Engineering Manager with target to build up and expand the
technical organization in China, Korea and India. He later served as Asia Business
Development Director until August 2008 when he became responsible for Engineered
Products Asia activities with a focus on variable vane oil pumps. Prior for working with
Gates, Mohamad was a mechanical designer with PH-Mechanik, an automation company
based in Aachen, Germany. He has eleven years of automotive experience and holds BS
in Mechanical Engineering and Aeronautics from Aachen University of Applied Science.

26
VII. Attractiveness and Opportunities of Investment
Market leader in North America
Powertrain has manufactured powdered metal components for 55 years and has manufactured oil
pumps for 20 years. Powertrain is one of the top three powertrain component suppliers on a
global basis. In North America, Powertrain is the market share leader in fixed
displacement pumps with an approximate market share of 26% of the non-captive market
and variable displacement pumps with an approximate market share of 64% of the non-
captive market. Powertrain developed the industry’s first variable displacement pump and
therefore is well-positioned to maintain leadership as variable vane penetration increases.
Powertrain is also the second largest powdered metal supplier in North America. Powertrain’s
market leadership stems from a long history and track record with GM (35 years), Ford (27
years) and Chrysler (22 years).
Substantial Revenue Visibility
The Company typically starts working with an OEM 2-3 years in advance of initial production
volumes and Powertrain and its customers plan capacity requirements in multiple phases across a
seven to ten year volume planning window – each phase being an incremental uplift in
production volumes. For example, Powertrain started working with Chrysler in 2004 on
Pentastar, a new variable displacement engine oil pump. The Company was awarded the
business in 2006 and started shipping units in 2009 at very low volumes. As various vehicle
platforms have migrated to the new engine platform (as planned), volumes have ramped to more
than 500,000 units in 2011 and expected to grow to more than 700,000 units by 2015. The
underlying vehicle migration timing is planned by Chrysler and underlying vehicle demand is
diversified across multiple nameplates. For example, Pentastar will be used on 28 nameplate
vehicles.
Using these long-term volume projections, the company’s forecasted sales between 2011 and
2015 are based on: 1) the known ramping of existing platforms as additional vehicles are moved
onto new powertrain platforms, plus; 2) the startup of new booked platforms, plus; 3) projected
“blue sky” business, less; 4) the decline older platforms. The combination of 1) and 2) is
generally referred to as “contracted” as the unit prices for these volumes are contracted with the
customer. Thus, the long lead time planning, underlying nameplate diversification and
contracted pricing provides a high level of visibility to future sales related to “contracted”
business. Based on management volume forecast (in aggregate, an approximate 10% discount to
CSM volume forecasts), the Company has more than $2.0 billion in “booked” sales between
2011 and 2015, representing 98% of projected sales over the period.
High Switching Costs and Barriers to Entry
Once a powertrain program is underway, it is very difficult for an original equipment
manufacturer to switch powertrain component suppliers due to:

27
High Upfront CapEx. Both Powertrain and the customer make substantial upfront
capital expenditures to support a given platform and vehicle design. Changing the key
components of an engine or transmission would have ripple effects throughout the design
that would be costly for the original equipment manufacturer
Specification Process. Powertrain’s products undergo substantial upfront testing and
validation before being specified into an engine or transmission. In order to switch
products during the cycle, the customer would need to conduct an eight month long
validation process of the alternative product, which is expensive and would be disruptive
to the customer’s production cycle
Black Box. Powertrain owns the technology for the majority of its automotive oil pump
platforms. The “black box” nature of the product from the customer’s perspective makes
it difficult for the customer to switch suppliers mid-cycle to fulfill the same requirements
In addition, the powertrain industry is well-protected against new entrants due to:
Proven durability and delivery. The powertrain is the centerpiece of the vehicle
platforms. As OEM’s migrate to more global powertrain platforms (for example, the GF-
6) and add an increasing number of vehicles to each platform, the powertrain’s system
components and the supply chain supporting the powertrain have become more critical.
OEM’s want proven technologies from proven suppliers.
Products involve proprietary technologies that have evolved over many years
Entry would require large upfront capital expenditures with 2-3 year lag before any cash
flows are realized
The high switching costs and barriers to entry for this business should support margin
sustainability and sticky cash flows throughout the projection period.
Management Team
The deal team has been impressed with the management team of Powertrain, including Peter
Ballantyne, the President who joined the team in 2010 from Magna International, Robert Mooy,
the head of the oil pumps business, and Rahim Suleman, the CFO who joined the team in 2010
from General Electric. The quality of the team also extends beyond these three top executives –
the other key regional heads and divisional managers know their business well. As a whole, the
management team has an average of 21 years in the oil pump and powdered metal industry.
The management team overall is excited about the opportunity to grow the business as a
standalone entity. Management describes the organization as more nimble and responsive before
being acquired by Tompkins in 2003. Management believes the carve-out will help create an
energized culture within Powertrain. The management team is not expected to receive a large
pay-out in conjunction with this transaction and therefore will be highly aligned with Sterling
through their options package. A focused, hungry management team will be a critical
component of our investment success, as Powertrain executes on existing booked business while
also expanding its foothold in Europe and Asia.

28
Europe and Asia Growth Opportunity
As discussed earlier in the memo, Powertrain currently has a small presence in Europe and Asia,
but these regions represent attractive future growth opportunities. Management sees significant
opportunities to grow in these markets both by winning new customers and by following existing
customers. Europe and Asia are projected to grow from 3% of sales in 2010 to 23% of sales in
2015. In support of this projected revenue growth, Powertrain has already been awarded 11
platforms in Europe and five in China. Prior to closing the acquisition, Powertrain was also
awarded an oil pump contract with Hyundai, representing the first oil pump sourced to a "non-
Korean" supplier by Hyundai. This new platform will result in upside beyond the base case
projections and could result in future opportunities with Hyundai in North America. From an
exit planning perspective, by developing a presence in Asia, the Company may attract increased
strategic interest and the improved growth profile could merit a higher valuation multiple. China
is now the largest automotive market in the world ahead of Europe and the U.S.
Limited Auction Effectiveness with Complexities
A limited number of parties were actively involved in the auction process run by RBC and UBS.
The number of parties in the process was limited for a variety of factors, including:
The CIM did a particularly weak job presenting three significant investment attributes – the
largely contracted nature of a substantial amount of the Company’s sales, the significant tax
attributes associated with the transaction and the discretionary nature of growth capital
expenditures. Our team’s IOI was submitted on behalf of Sterling and Current Capital and
Sterling would likely not have submitted an IOI, was it not for Mr. Foster’s knowledge of the
auto industry.
The dual-bank process (UBS/RBC) created confusion and was generally ill-coordinated
during the early stages of the process.
The carve-out nature creates complications related to evaluating stand alone costs (and the
risks related thereto) and negotiating and managing transition services which will be needed.
Many private equity firms and financing sources are not interested in automotive-related
opportunities given the performance during the downturn.
The recent recession stressed most tier-1 automotive suppliers severely. Based on
discussions with industry participants, most suppliers are cautious about acquisitions and
continue to be internally focused on initiative and/or ramping capacity to support the rebound
in demand. Further, equity analysts suggest most larger suppliers are focused on deploying
capital in faster growing emerging markets. Industry experts expect more corporate
acquisition activity in a few years.
Clear opportunity for Sterling Value Creation
Although management has made significant headway winning new platforms and ramping
volumes over the last several years, we believe there are several areas where Sterling can help
management further develop its growth strategy as well as add more focus to specific operational
initiatives. The main areas of Sterling impact are expected to be (detailed further in post-closing
initiatives):

29
Transition to a stand alone enterprise
Enhanced alignment between management incentives and shareholder value creation
Improved rigor around capital expenditures
Execution of ramp of early stage North American programs
Execution of European and Asian growth plans
Expansion into New Product Markets
VIII. Issues and Risks of Investment
High Customer Concentration
As is often the case in the North American automotive components industry, Powertrain has a
high level of exposure to the big three U.S. automotive manufacturers – Ford, General Motors
and Chrysler. Together, these three companies are expected to represent 78% of Powertrain’s
2011E sales. A loss of one of the Big Three as customers would significantly damage the cash
flows of the Company. In addition, the customer concentration may result in pricing pressure
during the front-end of new program negotiations when there is another viable supplier such as
Magna included in the bidding process.
Risk Mitigants:
Nature and timing of platforms – As discussed earlier, Powertrain is integrated across a
number of key platforms for these customers and it would be very difficult and costly for the
OEM’s to switch suppliers. Both parties have a fair amount of leverage over each other
Long relationships – 35 year relationship with GM, 27 year relationship with Ford and 22
year relationship with Chrysler
Contracts in place – prices locked in for 3-5 years
For each major automotive manufacturer, sell to a number of platforms and many vehicles
We’ve received positive feedback on the deal from former GM and Ford powertrain
executives. Customer calls will be completed during the exclusivity period
Volatile Nature of the Automobile Industry
The automotive industry has historically been volatile and highly cyclical in nature. For
example, during the last recession, Ford Motor Company’s sales dropped 17.3% in 2008 and
18.6% in 2009. Annualized light vehicle production declined from 15.8 million units in Q2 of
2007 to 6.8 million units in Q1 of 2009. General Motors and Chrysler both required capital
infusions from the government as part of a federally assisted bankruptcy process. A “double-dip”
recession or future automotive downturn could have a negative impact on the financial
performance of Powertrain. Given the high fixed cost nature of the business, a decline in
Powertrain’s sales would likely be coupled with declines in gross margin and EBITDA margin
percentages as well.
Risk Mitigants:

30
With annualized production of new vehicles near trough levels, our timing in the cycle may
provide downside protection. 2011E North America new vehicle production is 13 million
cars versus historical levels during more normal economic conditions of between 15-16
million units
The ramp up in booked business over the next two years could largely offset a decline in
industry volumes. For example, because of the ramp in 2009, the Company increased
EBITDA despite very weak end-market conditions.
High Capital Expenditure Requirements
Between 2008 and 2010, the Company invested on average $17.6 million in capital expenditures
a year, or 58% of cumulative EBITDA over the three year period. While management has
indicated that the business needs approximately $3.0 to $4.5 million in maintenance capital
expenditures per year (approximately 7% of 2011 EBITDA), the historical trends suggests the
business is very capital intensive and management’s definition of maintenance capital
expenditure may not adequately reflect the capital needs going forward. Further, the recent
ramping of new platforms (new phases), limited historical stand alone financial information and
ongoing expenditures related to continuous improvement (“CI”) projects add uncertainty to our
estimates of maintenance versus growth capital expenditures.
After several discussions with management on capital expenditures and evaluating historical
investments at the platform level, we have concluded that the majority of the recent capital
investments have been on growth projects, as listed below.
Capital Expenditures Contribution Margin Capex /
2008 2009 2010 2011 2012 2008 2012 Delta Margin
6R $ 0.9 $ 2.0 $ 2.6 $ 3.5 $ 1.1 $ 6.3 $ 31.1 $ 24.8 0.4x
Pentastar 0.3 2.7 0.5 0.6 0.5 - 8.1 8.1 0.6x
DV6 - 0.2 8.3 0.9 - - 11.0 11.0 0.9x
6L Group 4.7 0.5 0.9 0.5 1.0 20.4 33.5 13.0 0.6x
GF6 Carriers 4.1 0.5 2.6 2.6 2.8 1.3 19.2 17.9 0.7x
Asia + Europe Facility (excluding DV6) 1.4 2.0 5.0 5.9 6.2 2.1 6.3 4.3 4.8x
Sub total Major Platforms / Plants Growth $ 11.3 $ 7.9 $ 19.9 $ 14.1 $ 11.5 $ 30.1 $ 109.2 $ 79.1 0.8x
Other Platform Specific Growth 2.1 0.4 2.0 6.1 6.7 67.8 102.3 34.6 0.5x
Total Growth $ 13.4 $ 8.3 $ 21.9 $ 20.2 $ 18.2 $ 97.9 $ 211.5 $ 113.6 0.7x
(Growth as a % of Total) 76.6% 80.6% 86.6% 85.7% 80.9%
Plus: Maintenance 4.1 2.0 3.4 3.4 4.3
Total Capex $ 17.5 $ 10.3 $ 25.3 $ 23.6 $ 22.5
Based on the above data, the growth capital spent to support the top 5 platforms has obviously
generated excellent returns for Powertrain. On the other hand, the growth capital spent to
support Asia and Europe has not generated significant cash flows and therefore the expected
return on this capital is less certain.
On a consolidated basis, between 2008 and 2012, powertrain will have invested more than $82
million in growth capital and close to $100 million in total capital. Over this time frame
EBITDA is expected to increase by more than $50 million on a run rate basis ($26 has already
occurred), implying a very attractive return on the growth capital expenditures in total. While
attractive historically, the substantial capital requirements put the Company at risk of significant
capital outlays prior to platform ramp ups. Nevertheless, the business will continue to need to

31
take on expenditures to support platform renewals and launches, as this is simply the nature of
the automotive supplier’s business.
Further, while more than 80% of the capital expenditures between 2008 and 2012 have been or
will be for platform/facility specific growth projects, given the finite life of a platform and the
requirement to invest in dedicated capital for each platform, we have further differentiated
growth capital expenditures into “generic capital” and “dedicated capital”. In general, generic
capital investments are made in flexible equipment (CNC mills, lathes, grinders, cleaners,
robots…) that can be reconfigured to future uses with minimal investment, with assets often
outliving a specific program. Dedicated capital investments on the other hand, (custom assembly
cells, specialty test fixtures) require significant investment to redeploy and are often designed for
the life of the program. Based on our review of multiple large and small platforms,
approximately 35-40% of the growth capital invested for a platform is dedicated capital,
requiring “replenishment”. The table below shows the replenishment capital required for a
number of the Company’s platforms.
Sample
Sample Platforms 6R 6T70 HFV6 Penta DV6 Mean
Peak Sales $ 70.0 $ 31.0 $ 16.0 $ 26.0 $ 37.0 $ 180.0
Total Capital 32.3 9.1 6.0 7.1 9.5 $ 64.0
Capex / Peak Sales 0.46x 0.29x 0.38x 0.27x 0.26x 0.36x
Dedicated Capital $ 5.5 $ 4.0 $ 2.5 $ 3.0 $ 4.0 $ 19.0
Dedicated (% of total Capex) 17.0% 44.0% 41.7% 42.3% 42.1% 37.4%
Life 15.0 12.0 16.0 11.0 5.0 11.8
Replinishment Capital (% of Sales)1
0.7% 1.5% 1.4% 1.5% 3.1% 1.6%
1 Average annual sales is used to calculate this metric as at any point in time muliple platforms are in
various stages of ramping up or down. The average gives a better % of sales metric to aplpy to
an aggregate sales figure.
The combination of regular-way maintenance capital and replenishment capital results in a
higher ongoing steady state capital requirement for the business. Thus, while we do think
management has budgeted adequate future capital expenditures for the forecast period in
aggregate, we would expect capital requirements to be quite a bit higher than pure maintenance
capital should the business enter a slower growth phase. When applied to 2011 forecasted sales,
we believe a more appropriate recurring capital requirement is $8.6 million, which represents
approximately 17% of 2011 EBITDA. However, for valuation purposes, we are assuming
annual maintenance and replacement capital expenditures to support the current earnings
would be approximately $10 million.
Rising Raw Material Costs
With $140 million in annual material purchases, Powertrain must actively manage its raw
material exposure. The largest material buys for the oil pump division are aluminum and steel
castings. The largest material buy for the powdered metal division is powdered iron. The deal
team believes that Powertrain’s net EBITDA exposure to rising raw material costs is generally

32
limited due to contracted material pass-throughs included in its oil pump and powdered metal
customer contracts as well as LTA arrangements with its suppliers. While aluminum, steel and
iron prices increased substantially in 2010, Powertrain’s material costs as a percentage of sales
have remained flat at approximately 34% since 2008. As detailed below, we have calculated that
a ten percentage increase in overall raw material costs would result in an ~$887K drop in
EBITDA.
Material Cost Analysis
($ in millions)
2011
Oil Pumps:
Total Material Buy $104,506
% Commodity-based 45.0%
Total Aluminum / Steel Buy $47,028
% Tied to Commodity Price 60.0%
Total Tied to Commodity Price $28,217
% Not Covered by Material Pass-throughs 10.0%
Total Oil Pump Purchases Exposed $2,822
Powdered Metals:
Total Material Buy $35,929
% Commodity-based 85.0%
Total Iron Buy $30,540
% Tied to Commodity Price 33.0%
Total Tied to Commodity Price $10,078
% Not Covered by Material Pass-throughs 60.0%
Total PM Purchases Exposed $6,047
Total Material Purchases Exposed $8,869
EBITDA Impact from 10% Rise in Raw Material Costs ($887)
Lack of Currency Parity Between Purchases and Revenue
The Company purchases approximately $40 million in net USD inputs while the revenues are
collected in Canadian dollars. The CFO believes and our analysis supports, that every $0.01
change in exchange rate has a $400,000 impact to EBITDA. However, the Canadian economy is
generally a commodity-based economy – in 2009, agricultural, forestry, energy and mining
exports accounted for 58% of Canada’s total exports. Therefore, there is a high correlation
between movements in the Canadian dollar and movements in raw material costs. These two
movements have historically had offsetting impacts for Powertrain, with a cumulative total
EBITDA impact of currency and raw material costs from 2002-2010 of just $1.8 million and an
average impact of just $0.2 million. The following table shows the historical net impact of
movements in the CAD / USD exchange rate and Powertrain’s primary raw material costs:

33
Material Cost and Currency Impact Analysis
2001 2002 2003 2004 2005 2006 2007 2008 2009 2010
Aluminum $1,446.7 $1,351.1 $1,432.8 $1,718.5 $1,900.5 $2,573.1 $2,639.9 $2,577.9 $1,669.2 $2,173.0
% Growth (6.6%) 6.1% 19.9% 10.6% 35.4% 2.6% (2.3%) (35.3%) 30.2%
EBITDA $ Impact $0.1 ($0.1) ($0.3) ($0.1) ($0.5) ($0.0) $0.0 $0.5 ($0.4)
Steel $299.1 $328.3 $444.6 $607.1 $733.3 $693.8 $650.0 $965.6 $783.3 $815.6
% Growth 9.8% 35.4% 36.6% 20.8% (5.4%) (6.3%) 48.6% (18.9%) 4.1%
EBITDA $ Impact ($0.1) ($0.5) ($0.5) ($0.3) $0.1 $0.1 ($0.7) $0.3 ($0.1)
Iron / Scrap Steel $88.7 $80.5 $133.0 $222.6 $216.6 $234.6 $280.1 $439.0 $248.5 $345.9
% Growth (9.2%) 65.2% 67.4% (2.7%) 8.3% 19.4% 56.7% (43.4%) 39.2%
EBITDA $ Impact $0.6 ($3.9) ($4.1) $0.2 ($0.5) ($1.2) ($3.4) $2.6 ($2.4)
CAD / USD $0.65 $0.64 $0.72 $0.77 $0.83 $0.88 $0.94 $0.94 $0.88 $0.97
% Growth (1.4%) 12.4% 7.5% 7.3% 6.8% 6.1% 0.8% (6.7%) 10.4%
EBITDA $ Impact ($0.4) $3.2 $2.2 $2.2 $2.2 $2.1 $0.3 ($2.5) $3.6
NET EBITDA $ Impact $0.2 ($1.4) ($2.7) $2.0 $1.3 $1.0 ($3.8) $0.9 $0.8
Cumulative 2002-2010 ($1.8)
Average 2002-2010 ($0.2)

34
USD Equity Investment Is Exposed to Changes in the CAD/USD Exchange Rate
For the debt portion of the capital structure, we executed a hedge to protect us from movements
in the exchange rate. For the $140 million first lien term loan, we locked in a fixed rate of
9.69%, with interest payments to be made in Canadian dollars. Similarly, for the $45 million
mezzanine debt, we locked in a fixed, Canadian rate of 13.60% cash and 2% PIK. In addition,
our covenants are to be calculated in Canadian dollars. However our equity investment will be
exposed to changes in CAD/USD exchange rates. An additional hedge for the equity would have
been prohibitively expensive, as Sterling similarly concluded when it acquired Canadian-based
North American Construction Group.
Changes in Technology or Consumer Preferences
Powertrain’s products are potentially at risk from technological obsolescence or changes in
consumer vehicle preferences. This risk could manifest itself in the form of a consumer shift
towards more fuel-efficient vehicles or through a competitor’s development of a superior
automotive oil pump or powdered metal technology:
Shift Towards More Fuel-Efficient Vehicles: 41% of Powertrain’s 2011E sales are
from SUV’s and trucks. A consumer shift away from large vehicles towards small
vehicles in response to high energy prices could negatively impact Powertrain. In
addition, a viable and affordable electric car could eliminate the need for oil pumps
Product Technology Shifts: Powertrain’s business model revolves around offering the
best oil pump and powdered metal technology at a premium price relative to most
competitors. There exists the possibility that a competitor will develop a superior oil
pump or powdered metal technology, resulting in market share losses for Powertrain
Risk Mitigants:
Technological changes in the automotive industry have historically had long lead times, due
to the long lifecycles of existing products and the substantial upfront investment made in the
existing technologies
We modeled sensitivities around vehicle size categories in order to ensure that the returns
would be acceptable even in the case that consumer vehicle preferences changed materially
Relative to other efficiency improvement options for OEM’s, variable displacement pumps
are a very cost effective way to increase fuel economy by 1-2%. Variable vane pump
penetration is still in infancy. The migration from fixed pumps to variable vane should
significantly benefit Powertrain
35
IX. Post-Closing Initiatives
Transition to a Standalone Enterprise and Onboard to Sterling Processes
Post-closing, the first initiative will be to smoothly transition the Powertrain business out of
Gates. This will involve a list of small items (audit, tax, legal, insurance…) for the Canadian
operations and some more material items for the European operations, for example a new ERP
system (albeit anticipated to be a very small project).
We will also quickly onboard the business to a monthly financial operating and management
review schedule. The Company closes its books (using the same process it uses at year end)
each month within 20 days of month end and generates a series of variance analysis and other
operating reports. Given the strength of the existing financial reporting packages and the
capacity of the CFO, we expect to quickly move to incorporate additional operational targets and
metrics into our operating reviews, which the Company does not currently highlight, for
example: key equipment utilization, platform level material/direct variances, return on
investment YTD for select platforms, and platform contribution margin analysis.
Establish Sterling Employee Incentive Programs and Implement the Board of Directors
Currently, a select group of senior managers participate in a weakly defined bonus plan. There is
no ownership of Powertrain equity by any of the employees and only Peter Ballantyne has
options in the larger Tomkins parent. For 2010, the total bonus pool was $0.8 million across 16
people. Despite the significant improvement in EBITDA (from $25 million to $46 million
between 2009 and 2010), bonuses have been held below 2% of Adjusted EBITDA . To properly
align the interest of the entire organization with those of Sterling, we will encourage broader
equity participation, both through direct equity ownership and stock options, and a clearly
defined incentive bonus program.
Establish More Rigorous Capital Investment Review and Tracking
The Company currently uses Gates’ capital review process and tools. While these are useful for
generic capital investment decisions they have been tweaked to fit Powertrain’s needs on an as
needed basis. They do not differentiate generic versus dedicated capital requirements and do not
evaluate sensitivities around ramp timing or volumes. We believe Sterling can help management
refine the investment process (model, review, approval) and ultimately make more optimal
capital investment decisions.

36
Further Develop and Execute Europe, Asia and New Product Market Expansion Plans
European Expansion
The start up and ramp of the Izmir, Turley operation will be well underway by the time of close,
primarily supporting two primary customers – PSA and Audi. Beyond these accounts,
management categorizes additional growth as “blue sky” or yet to be specifically determined.
And while the European market on the surface looks attractive (shift to variable vane technology,
highly emissions focused), based on our discussions with management and industry experts,
Europe is clearly a mature and highly competitive market. We believe further growth in Europe
will be challenging and as such expect to invest significant resources into managing the
development of that region. To date, the management team and Gates have developed a detailed
European growth plan and made substantial progress towards that plan. However, the Company
needs to further evaluate the longer term market opportunity and we expect Sterling to be
substantially involved and helpful towards that objective.
Asian Expansion
The successful execution of the Asian business development facility is a major component of the
upside in the Powertrain investment. The management team has been working on the China
development plan for several years and has prior experience operating in China (through the
prior Halla JV) and has developed a detailed business plan for a new China facility. We have
completed a preliminary review of the plan and based on conversations with management, the
plan is well thought out from an operational perspective but requires further evaluation of the
market opportunity. Sterling (and Sterling third party partners) would play a central role in the
assessment, development and ongoing support of the final plan. Like the other initiatives, the
management team is open to active involvement by Sterling.
Expansion Into New Product Markets
Management is actively pursuing attractive growth opportunities for the PM business in non-
automotive end-use markets. For example, the Company has booked the opportunity to provide
the core components used by Bloom Energy’s fuel cells to convert natural gas into electrical
energy. Bloom Energy has developed a technology that utilizes coated powdered metal plates as
part of a process that efficiently and cost-effectively provides electricity for commercial
applications. This customer has a substantial backlog of orders for its fuel cell systems, and has
indicated to the Company that it will require over seven million plates per year, beginning in
2011. Management believes that by 2014, this opportunity could represent up to $50 million in
new business. As another example, the Company currently sells $6 million in revenue to
Whirlpool for washing machine gears. Sterling will support the execution of these existing
opportunities, along with other product extensions and new product applications for the
powdered metal business.

37
X. Transaction
We acquired Powertrain for $290.7 million ($285 million cash + $5.7 million of assumed
pension liabilities) or 5.8x 5/31/11 LTM Adjusted EBITDA / 7.2x 5/31/11 LTM EBITDA less an
assumed $10.0 million annual maintenance and replacement CapEx. Pro forma for the NPV of
tax benefits associated with the tax basis step-up of approximately $23 million, the purchase
price is equivalent to $267.7 million, or 5.3x LTM EBITDA. The deal team conducted
confirmatory business diligence, as well as accounting and tax (KPMG), legal (Bracewell &
Giulliani), environmental (E. Vironment), benefits and insurance (Lockton) diligence.
The senior debt financing of $165 million ($140 million first lien term loan and $25 million
revolver) was arranged by RBC Capital Markets, BNP Paribas and UBS. Terms on the senior
revolving facility are as follows: LIBOR + 550 bps and 1.5% LIBOR floor. Terms on the senior
first lien term loan are as follows: fixed 9.69% cash interest in Canadian dollars and 98.0 OID.
The $45 million of mezzanine financing was provided by Hancock Capital Management, Fifth
Street and Global Leveraged Capital. Terms on the mezzanine debt are as follows: 13.60% fixed
cash interest in Canadian dollars, 2% PIK and 98.0 OID.
The below table reflects the anticipated sources and uses for the transaction:
SOURCES $MM USES $MM
Revolver ($25 MM) $4.2 Purchase Price $285.0
Term Loan B 140.0 Working Capital Adjustment 1.4
Senior Subordinated Loan Facility 45.0 China Amount to be Paid Post-Close (0.3)
Contributed Equity 117.0 Transaction Costs 19.3
Cash to Balance Sheet 0.8
Total $306.2 Total $306.2
38
XI. Projections and Returns
Projection Method
The methodology used in projecting Powertrain’s business in all cases is as follows:
Volumes projected at the platform level for the eleven major platforms, based on the industry
standard CSM platform projections
For each major platform, material and direct labor costs projected on a per unit basis
Maintenance and growth capex projected at the platform level for all major platforms
All other minor platforms projected individually as a percentage of management’s
projections
Material and direct labor costs for “minor” platforms held constant as a percentage of minor
platform revenues
For each manufacturing facility, both major and minor platform projections built up to show
facility contribution margin
Each facility then burdened with its unique cost structure, as well as plant level maintenance
and growth capex
Each manufacturing facility then stacked up to build the consolidated projection model

39
Lender / TSG Base Case
($ in millions) 2010 2011 2012 2013 2014 2015 2016
Revenue 248.2$ 329.4$ 358.9$ 401.1$ 419.8$ 442.3$ 459.7$
% Growth 32.7% 9.0% 11.7% 4.7% 5.4% 3.9%
Gross Profit 56.3$ 66.4$ 82.4$ 91.6$ 95.1$ 97.4$ 101.4$
% Margin 22.7% 20.2% 23.0% 22.8% 22.6% 22.0% 22.1%
SG&A (13.7)$ (17.4)$ (19.6)$ (21.4)$ (22.2)$ (23.2)$ (24.2)$
% of Revenue 5.5% 5.3% 5.5% 5.3% 5.3% 5.2% 5.3%
Adjustments 3.6$ 6.8$ (0.4)$ 0.3$ 0.8$ 1.6$ 1.7$
Adj. EBITDA (Pre Fee) 46.1$ 55.8$ 62.4$ 70.5$ 73.8$ 75.8$ 79.0$
% Margin 18.6% 16.9% 17.4% 17.6% 17.6% 17.1% 17.2%
Total CapEx (25.3)$ (23.6)$ (25.0)$ (19.4)$ (13.3)$ (16.4)$ (17.0)$
% of Revenue 10.2% 7.2% 7.0% 4.8% 3.2% 3.7% 3.7%
Lender / TSG Case
TSG Returns by Year
2012 2013 2014 2015 2016
5.0x -1.4% 16.2% 19.2% 19.4% 19.6%
5.5x 13.7% 24.2% 24.0% 22.7% 21.9%
6.0x 27.8% 31.4% 28.4% 25.6% 24.0%
Leverage Statistics
Total Debt (1) 188.9$ 181.0$ 161.0$ 127.5$ 91.0$ 50.2$
LTM Interest / LTM Adj. EBITDA (Pre Fee) 2.72x 3.11x 3.77x 4.59x 6.00x 8.94x
Net Debt / LTM Adj. EBITDA (Pre Fee) 3.48x 2.90x 2.28x 1.73x 1.20x .61x
CFADR
Adj. EBITDA (Post Fee) 25.0$ 60.8$ 68.7$ 71.9$ 73.9$ 77.0$
Less: Net KPMG Adjustment (1.5) - - - - -
Less: Total CapEx (11.5) (25.0) (19.4) (13.3) (16.4) (17.0)
Less: Non Cash Equity Income (1.0) (2.6) (2.7) (3.2) (4.0) (4.1)
Less: Cash Interest Expense (10.1) (20.0) (18.7) (16.1) (12.6) (8.8)
Less: Cash Taxes (0.3) (0.6) (0.7) (0.8) (1.1) (1.4)
Less: Changes in NWC (0.7) (1.6) (4.1) (2.6) (0.9) (1.4)
Less: Revolver Draw for Cash Balance 0.8 (0.0) (0.0) 0.0 - -
Total Cash Flow 0.7$ 11.1$ 23.2$ 35.9$ 39.0$ 44.2$
Less: Scheduled Debt Amortization (0.4) (1.4) (1.4) (1.4) (1.4) (1.4)
Less: Pension Payments (1.1) (2.2) (2.2) (1.5) (1.5) -
Total CFADR (0.8)$ 7.5$ 19.6$ 33.0$ 36.1$ 42.8$
1. Does not include post-employment benefit obligation.
40
Major Assumptions
o Volume – All platform projections based on industry standard CSM projections. Used lower of CSM and
management projections for all major platforms. 4% increase to all management volumes in 2011 to reflect
outperformance in Q1 2011
o Revenue – Assumed management projected selling price per unit (primarily based on contracted prices) for
all major platforms, including an annual decrease, or give back
o Material Cost – In any instance where i) an LTA has not been entered into with customer or ii) specific
cost initiative programs were not identified and accounted for in the capital budget, grew at 3.0%
o Direct Labor – Generally grew at inflationary rate of 3.0% unless specific automation improvements were
budgeted
o Other COGS & SG&A – Assumed variable costs largely did not realize benefits of operating leverage.
Grew fixed costs at inflationary rate of 3.0%
o Capex – Projected on both a platform and facility level basis; capex associated with non-credited blue sky
revenue removed
o Blue Sky – Partial credit; ~30% credit in 2014 and ~50% credit in 2015
o Asia – Partial credit. Assumed delayed ramp beginning in 2013 and 80% credit in 2014 and 2015

41
Management / Upside Case
($ in millions) 2010 2011 2012 2013 2014 2015 2016
Revenue 248.2$ 329.4$ 368.1$ 408.7$ 442.7$ 479.2$ 498.0$
% Growth 32.7% 11.7% 11.0% 8.3% 8.2% 3.9%
Gross Profit 56.3$ 66.4$ 86.1$ 97.1$ 105.4$ 113.3$ 117.7$
% Margin 22.7% 20.2% 23.4% 23.8% 23.8% 23.6% 23.6%
SG&A (13.7)$ (17.4)$ (19.6)$ (21.2)$ (21.8)$ (22.7)$ (23.6)$
% of Revenue 5.5% 5.3% 5.3% 5.2% 4.9% 4.7% 4.7%
Adjustments 3.6$ 6.8$ (0.4)$ 0.3$ 0.8$ 1.6$ 1.7$
Adj. EBITDA (Pre Fee) 46.1$ 55.8$ 66.1$ 76.2$ 84.4$ 92.1$ 95.9$
% Margin 18.6% 16.9% 17.9% 18.6% 19.1% 19.2% 19.2%
Total CapEx (25.3)$ (23.6)$ (25.0)$ (24.4)$ (20.8)$ (24.4)$ (17.0)$
% of Revenue 10.2% 7.2% 6.8% 6.0% 4.7% 5.1% 3.4%
Management / Upside Case
TSG Returns by Year
2012 2013 2014 2015 2016
5.0x 8.8% 23.5% 26.7% 27.0% 25.9%
5.5x 24.0% 31.4% 31.4% 30.2% 28.1%
6.0x 38.3% 38.6% 35.8% 33.1% 30.1%
Leverage Statistics
Total Debt (1) 188.9$ 178.9$ 157.6$ 122.3$ 78.5$ 50.2$
LTM Interest / LTM Adj. EBITDA (Pre Fee) 2.72x 3.30x 4.14x 5.38x 7.79x 12.72x
Net Debt / LTM Adj. EBITDA (Pre Fee) 3.48x 2.71x 2.07x 1.45x .85x .47x
CFADR
Adj. EBITDA (Post Fee) 25.0$ 64.4$ 74.3$ 82.3$ 89.8$ 93.5$
Less: Net KPMG Adjustment (1.5) - - - - -
Less: Total CapEx (11.5) (25.0) (24.4) (20.8) (24.4) (17.0)
Less: Non Cash Equity Income (1.0) (2.6) (2.7) (3.2) (4.0) (4.1)
Less: Cash Interest Expense (10.1) (20.0) (18.4) (15.7) (11.8) (7.5)
Less: Cash Taxes (0.3) (0.6) (0.7) (0.8) (1.1) (1.4)
Less: Changes in NWC (0.7) (3.1) (3.6) (4.1) (2.3) (1.5)
Less: Revolver Draw for Cash Balance 0.8 (0.0) (0.0) 0.0 (0.0) 0.0
Total Cash Flow 0.7$ 13.1$ 24.5$ 37.7$ 46.3$ 61.8$
Less: Scheduled Debt Amortization (0.4) (1.4) (1.4) (1.4) (1.4) (0.7)
Less: Pension Payments (1.1) (2.2) (2.2) (1.5) (1.5) -
Total CFADR (0.8)$ 9.5$ 20.9$ 34.8$ 43.4$ 61.1$
1. Does not include post-employment benefit obligation.

42
Major Assumptions
o Volume – All platform projections based on industry standard CSM projections. Volume generally
projected at a discount to CSM projections, unless the Company had specific reason to believe otherwise
(i.e. Chrysler has a new manufacturing facility coming on line, which is not yet included in CSM’s
projections)
o Revenue – Assumed management projected selling price per unit (primarily based on contracted prices) for
all major platforms, including an annual decrease, or give back
o Material Cost – Based on two factors: i) whether an LTA has been entered into with customer and ii)
whether specific cost initiative programs have been identified and accounted for in the capital budget
o Direct Labor – Generally assumed efficiency improvements offset impact of inflation
o Other COGS & SG&A – Projected on a plant by plant basis. Generally assumed realization of operating
leverage as volumes increase
o Capex – Projected on both a platform and facility level basis
o Blue Sky – Assumed un-booked revenue is captured, specifically in out years
o Asia – Assumed full credit for Asian business, beginning ramp in 2012
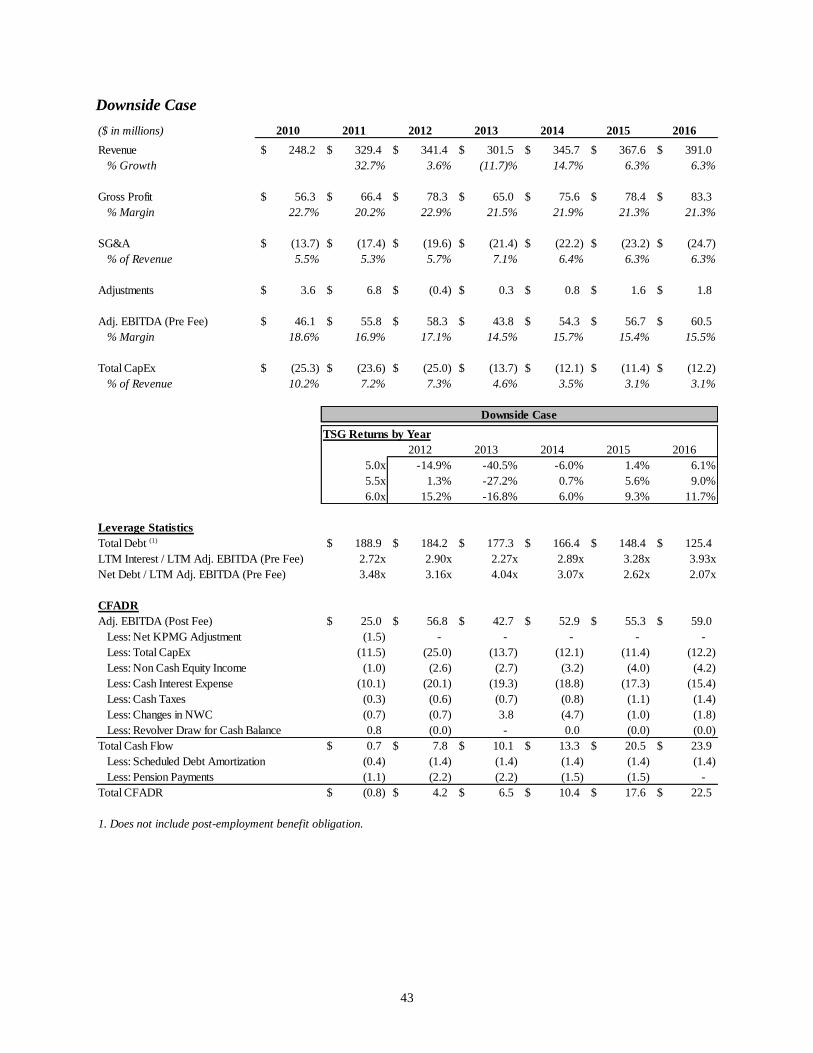
43
Downside Case
($ in millions) 2010 2011 2012 2013 2014 2015 2016
Revenue 248.2$ 329.4$ 341.4$ 301.5$ 345.7$ 367.6$ 391.0$
% Growth 32.7% 3.6% (11.7)% 14.7% 6.3% 6.3%
Gross Profit 56.3$ 66.4$ 78.3$ 65.0$ 75.6$ 78.4$ 83.3$
% Margin 22.7% 20.2% 22.9% 21.5% 21.9% 21.3% 21.3%
SG&A (13.7)$ (17.4)$ (19.6)$ (21.4)$ (22.2)$ (23.2)$ (24.7)$
% of Revenue 5.5% 5.3% 5.7% 7.1% 6.4% 6.3% 6.3%
Adjustments 3.6$ 6.8$ (0.4)$ 0.3$ 0.8$ 1.6$ 1.8$
Adj. EBITDA (Pre Fee) 46.1$ 55.8$ 58.3$ 43.8$ 54.3$ 56.7$ 60.5$
% Margin 18.6% 16.9% 17.1% 14.5% 15.7% 15.4% 15.5%
Total CapEx (25.3)$ (23.6)$ (25.0)$ (13.7)$ (12.1)$ (11.4)$ (12.2)$
% of Revenue 10.2% 7.2% 7.3% 4.6% 3.5% 3.1% 3.1%
Downside Case
TSG Returns by Year
2012 2013 2014 2015 2016
5.0x -14.9% -40.5% -6.0% 1.4% 6.1%
5.5x 1.3% -27.2% 0.7% 5.6% 9.0%
6.0x 15.2% -16.8% 6.0% 9.3% 11.7%
Leverage Statistics
Total Debt (1) 188.9$ 184.2$ 177.3$ 166.4$ 148.4$ 125.4$
LTM Interest / LTM Adj. EBITDA (Pre Fee) 2.72x 2.90x 2.27x 2.89x 3.28x 3.93x
Net Debt / LTM Adj. EBITDA (Pre Fee) 3.48x 3.16x 4.04x 3.07x 2.62x 2.07x
CFADR
Adj. EBITDA (Post Fee) 25.0$ 56.8$ 42.7$ 52.9$ 55.3$ 59.0$
Less: Net KPMG Adjustment (1.5) - - - - -
Less: Total CapEx (11.5) (25.0) (13.7) (12.1) (11.4) (12.2)
Less: Non Cash Equity Income (1.0) (2.6) (2.7) (3.2) (4.0) (4.2)
Less: Cash Interest Expense (10.1) (20.1) (19.3) (18.8) (17.3) (15.4)
Less: Cash Taxes (0.3) (0.6) (0.7) (0.8) (1.1) (1.4)
Less: Changes in NWC (0.7) (0.7) 3.8 (4.7) (1.0) (1.8)
Less: Revolver Draw for Cash Balance 0.8 (0.0) - 0.0 (0.0) (0.0)
Total Cash Flow 0.7$ 7.8$ 10.1$ 13.3$ 20.5$ 23.9$
Less: Scheduled Debt Amortization (0.4) (1.4) (1.4) (1.4) (1.4) (1.4)
Less: Pension Payments (1.1) (2.2) (2.2) (1.5) (1.5) -
Total CFADR (0.8)$ 4.2$ 6.5$ 10.4$ 17.6$ 22.5$
1. Does not include post-employment benefit obligation.

44
Major Assumptions
o Volume – All major platforms projected based on an assumed slower rebound in North American Light
Vehicle production and a significant decrease in 2013.
o Revenue – Assumed management projected selling price per unit (primarily based on contracted prices) for
all major platforms, including an annual decrease, or give back
o Material Cost – In any instance where i) an LTA has not been entered into with customer or ii) specific
cost initiative programs were not identified and accounted for in the capital budget., grew at 3.0%
o Direct Labor – Generally grew at inflationary rate of 3.0% unless specific automation improvements were
budgeted
o Other COGS & SG&A – Assumed variable costs largely did not realize benefits of operating leverage.
Grew fixed costs at inflationary rate of 3.0%
o Capex – Projected on both a platform and facility level basis; capex associated with non-credited blue sky
revenue removed; decreased North American capex in 2013 – 2015 to $8 million
o Blue Sky – Partial credit; ~30% credit in 2014 and ~50% credit in 2015
o Asia – Partial credit. Assumed delayed ramp beginning in 2013 and 25% credit (of base case volumes) in
all years

45
Major Oil Shock Case
($ in millions) 2010 2011 2012 2013 2014 2015 2016
Revenue 248.2$ 329.4$ 330.1$ 368.7$ 387.4$ 408.7$ 431.2$
% Growth 32.7% 0.2% 11.7% 5.1% 5.5% 5.5%
Gross Profit 56.3$ 66.4$ 74.0$ 81.8$ 85.6$ 87.9$ 92.7$
% Margin 22.7% 20.2% 22.4% 22.2% 22.1% 21.5% 21.5%
SG&A (13.7)$ (17.4)$ (19.6)$ (21.4)$ (22.2)$ (23.2)$ (24.5)$
% of Revenue 5.5% 5.3% 5.9% 5.8% 5.7% 5.7% 5.7%
Adjustments 3.6$ 6.8$ (0.4)$ 0.3$ 0.8$ 1.6$ 1.8$
Adj. EBITDA (Pre Fee) 46.1$ 55.8$ 54.0$ 60.7$ 64.3$ 66.3$ 70.0$
% Margin 18.6% 16.9% 16.3% 16.5% 16.6% 16.2% 16.2%
Total CapEx (25.3)$ (23.6)$ (25.0)$ (19.4)$ (13.3)$ (16.4)$ (17.0)$
% of Revenue 10.2% 7.2% 7.6% 5.3% 3.4% 4.0% 4.0%
Major Oil Shock Case
TSG Returns by Year
2012 2013 2014 2015 2016
5.0x -30.1% -1.4% 7.5% 10.4% 12.7%
5.5x -13.6% 7.3% 12.8% 14.1% 15.3%
6.0x 1.4% 15.0% 17.6% 17.4% 17.7%
Leverage Statistics
Total Debt (1) 188.9$ 187.3$ 176.7$ 154.6$ 130.6$ 101.0$
LTM Interest / LTM Adj. EBITDA (Pre Fee) 2.72x 2.68x 3.10x 3.54x 4.18x 5.25x
Net Debt / LTM Adj. EBITDA (Pre Fee) 3.48x 3.47x 2.91x 2.40x 1.97x 1.44x
CFADR
Adj. EBITDA (Post Fee) 25.0$ 52.6$ 59.1$ 62.7$ 64.6$ 68.3$
Less: Net KPMG Adjustment (1.5) - - - - -
Less: Total CapEx (11.5) (25.0) (19.4) (13.3) (16.4) (17.0)
Less: Non Cash Equity Income (1.0) (2.6) (2.7) (3.2) (4.0) (4.2)
Less: Cash Interest Expense (10.1) (20.1) (19.6) (18.1) (15.9) (13.3)
Less: Cash Taxes (0.3) (0.6) (0.7) (0.8) (1.1) (1.4)
Less: Changes in NWC (0.7) 0.4 (3.1) (2.6) (0.8) (1.8)
Less: Revolver Draw for Cash Balance 0.8 (0.0) (0.0) (0.0) - -
Total Cash Flow 0.7$ 4.8$ 13.7$ 24.6$ 26.5$ 30.5$
Less: Scheduled Debt Amortization (0.4) (1.4) (1.4) (1.4) (1.4) (1.4)
Less: Pension Payments (1.1) (2.2) (2.2) (1.5) (1.5) -
Total CFADR (0.8)$ 1.2$ 10.1$ 21.7$ 23.6$ 29.1$
1. Does not include post-employment benefit obligation.

46
Major Assumptions
o Volume – All major platforms broken down by type (i.e. compact cars or pickup trucks) of underlying
vehicles, then projected based on each vehicle type’s impact from an extended period of major oil price
increases. 2011 volumes assumed flat to the base case
o Revenue – Assumed management projected selling price per unit (primarily based on contracted prices) for
all major platforms, including an annual decrease, or give back
o Material Cost – In any instance where i) an LTA has not been entered into with customer or ii) specific
cost initiative programs were not identified and accounted for in the capital budget, grew at 3.0%
o Direct Labor – Generally grew at inflationary rate of 3.0% unless specific automation improvements were
budgeted
o Other COGS & SG&A – Assumed variable costs largely did not realize benefits of operating leverage.
Grew fixed costs at inflationary rate of 3.0%
o Capex – Projected on both a platform and facility level basis; capex associated with non-credited blue sky
revenue removed
o Blue Sky – Partial credit; ~30% credit in 2014 and ~50% credit in 2015
o Asia – Partial credit. Assumed delayed ramp beginning in 2013 and 80% credit in 2014 and 2015

47
XII. Recommendation
We completed the acquisition on terms discussed herein.

48
XIII. Appendix
Operating Initiative Score Card
The Sterling Group, LP - Initiative Scorecard
Infrastructure / Non Financial
Initiative Category
Opportunity
(0-NA,1-small,2-medium,3-large)
Management / Structure / Compensation
Fund Post Close Checklist
Annual bonus system 2
Board composition & compensation 2
Employee review processes 1
Equity incentive system 3
Management evaluation and development process 1
Strategy
Add-on acquisition identification 1
Exit plan development 3
Industry studies and analysis 1
Strategic plan development 2
Reporting Systems & Processes
Budgeting / forecasting process 1
Financial reporting package 1
Information systems 1
Legal & Compliance
Compliance systems 1
Financial
Initiative Category
Sales Growth
Geographic expansion 3
International opportunities 3
Product / service expansion 1
Sales and marketing organization and efficiency 1
Market share gains 2
Gross Margin
Pricing 2
Procurement & sourcing 2
Product mix assessment 2
Lean manufacturing 2
Outsourcing 1
Plant optimization 2
Preventative maintenance 1
Quality system 1
Supply chain logistics & freight 1
Operating Expense
Healthcare and benefits programs 1
Insurance 1
Personnel optimization 1
Balance Sheet
Asset utilization / efficiency 2
Capex planning / optimization 3
Capital structure / interest rate risk 2
Working capital management 2
Other
Heavy asset utilization 1
Vehicle & light equipment 1
Tax planning & efficiency 2
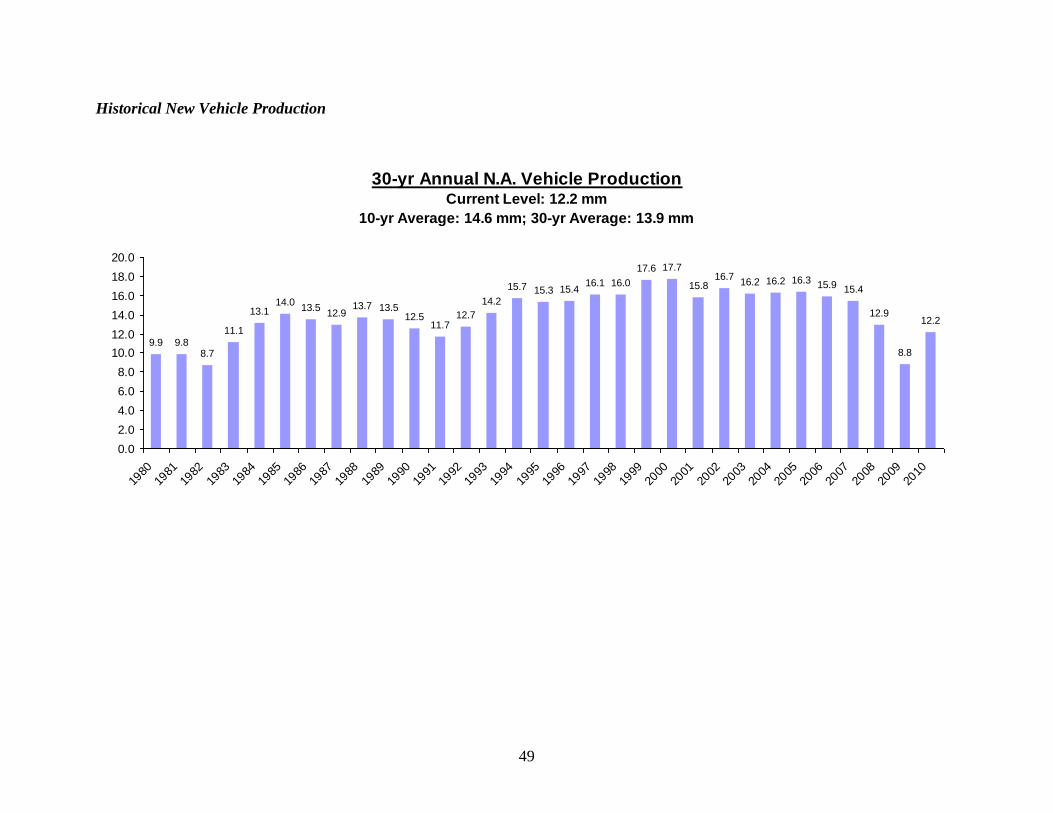
49
Historical New Vehicle Production
30-yr Annual N.A. Vehicle ProductionCurrent Level: 12.2 mm
10-yr Average: 14.6 mm; 30-yr Average: 13.9 mm
9.9 9.88.7
11.1
13.114.0
13.512.9
13.7 13.512.5
11.712.7
14.2
15.7 15.3 15.416.1 16.0
17.6 17.7
15.816.7
16.2 16.2 16.3 15.9 15.4
12.9
8.8
12.2
0.0
2.0
4.0
6.0
8.0
10.0
12.0
14.0
16.0
18.0
20.0
1980
1981
1982
1983
1984
1985
1986
1987
1988
1989
1990
1991
1992
1993
1994
1995
1996
1997
1998
1999
2000
2001
2002
2003
2004
2005
2006
2007
2008
2009
2010

50
Vehicle Production as % of U.S PopulationCurrent Level: 3.9%
10-yr Average: 4.9%; 30-yr Average: 5.2%
4.7%
6.3%
4.3% 4.3%
3.8%
5.6% 5.6%
5.9%
5.3%
5.5% 5.6%
5.0%
5.0%
4.6%
5.5%
5.8% 6.0%
5.8%
6.0%
5.9%
6.5%
5.5%
5.8%
5.6%
5.5% 5.3% 5.5%
5.1%
4.2%
2.9%
3.9%
0.0%
1.0%
2.0%
3.0%
4.0%
5.0%
6.0%
7.0%
1980
1981
1982
1983
1984
1985
1986
1987
1988
1989
1990
1991
1992
1993
1994
1995
1996
1997
1998
1999
2000
2001
2002
2003
2004
2005
2006
2007
2008
2009
2010

51
6/30/11 Adjust. Opening 2011 2012 2013 2014 2015 2016
Assets
Cash - 0.8 $0.8 $0.0 $0.0 $0.0 $0.0 $0.0 $2.4
Accounts Receivable 58.0 - 58.0 59.5 62.9 70.8 73.7 77.7 80.8
Inventories 18.8 - 18.8 19.2 19.6 21.9 23.3 23.4 24.3
Prepaid Expenses & Other - - - - - - - - -
Total Current Assets 76.7 0.8 77.5 78.7 82.6 92.6 97.0 101.1 107.5
PP&E 179.7 - 179.7 180.9 182.7 176.0 161.1 147.3 131.9
Goodwill - 83.1 83.1 83.1 83.1 83.1 83.1 83.1 83.1
Debt Issuance Costs - 9.8 9.8 9.3 8.2 7.1 6.0 4.9 3.8
Investment in Affiliate 10.5 - 10.5 11.5 14.0 16.7 19.9 23.9 28.0
Total Assets 267.0 93.7 360.7 363.4 370.6 375.5 367.1 360.3 354.3
Liabilities and Stockholders' Equity
Accounts Payable 49.9 - 49.9 51.1 53.3 59.3 61.0 64.2 66.7
Accrued Expenses 0.0 - 0.0 0.0 0.0 0.0 0.0 0.0 0.0
Accrued Income Taxes - - 0.0 0.2 0.2 0.2 0.2 0.3 0.4
Other - - 0.0 - - - - - -
Total Current Liabilities 49.9 0.0 49.9 51.2 53.5 59.5 61.2 64.5 67.1
Revolver Draw - 3.1 3.1 4.6 0.0 0.0 0.0 0.0 0.0
First Lien TL - 140.0 140.0 138.9 134.6 113.6 79.3 41.8 0.0
Mezzanine Debt - 45.0 45.0 45.5 46.4 47.3 48.3 49.2 50.2
Total Long-Term Debt 0.0 188.1 188.1 188.9 181.0 161.0 127.5 91.0 50.2
Deferred Taxes - - 0.0 0.0 0.0 0.0 0.0 0.0 0.0
Pension Obligation (Asset) - 5.7 5.7 4.6 2.4 0.2 (1.3) (2.8) (2.8)
Common Stock & APIC - 117.0 117.0 117.0 117.0 117.0 117.0 117.0 117.0
Retained Earnings 217.1 (217.1) 0.0 1.7 16.7 37.9 62.7 90.6 122.8
Total Liab. and Stock. Equity 267.0 93.7 360.7 363.4 370.6 375.5 367.1 360.3 354.3
Lender / TSG Base Case Balance Sheet

52
6/30/11 Adjust. Opening 2011 2012 2013 2014 2015 2016
Assets
Cash - 0.8 $0.8 $0.0 $0.0 $0.0 $0.0 $0.0 $32.5
Accounts Receivable 58.0 - 58.0 59.5 65.8 72.1 77.7 84.2 87.5
Inventories 18.8 - 18.8 19.2 20.4 22.0 24.2 24.9 25.8
Prepaid Expenses & Other - - - - - - - - -
Total Current Assets 76.7 0.8 77.5 78.7 86.2 94.1 101.9 109.1 145.9
PP&E 179.7 - 179.7 180.9 182.7 180.7 172.1 164.1 145.9
Goodwill - 83.1 83.1 83.1 83.1 83.1 83.1 83.1 83.1
Debt Issuance Costs - 9.8 9.8 9.3 8.2 7.1 6.0 4.9 3.8
Investment in Affiliate 10.5 - 10.5 11.5 14.0 16.7 19.9 23.9 28.0
Total Assets 267.0 93.7 360.7 363.4 374.2 381.7 383.0 385.0 406.7
Liabilities and Stockholders' Equity
Accounts Payable 49.9 - 49.9 51.1 55.4 59.7 63.4 68.2 70.8
Accrued Expenses 0.0 - 0.0 0.0 0.0 0.0 0.0 0.0 0.0
Accrued Income Taxes - - 0.0 0.2 0.2 0.2 0.2 0.3 0.4
Other - - 0.0 - - - - - -
Total Current Liabilities 49.9 0.0 49.9 51.2 55.6 59.9 63.6 68.4 71.2
Revolver Draw - 3.1 3.1 4.6 0.0 0.0 0.0 0.0 0.0
First Lien TL - 140.0 140.0 138.9 132.5 110.3 74.1 29.3 0.0
Mezzanine Debt - 45.0 45.0 45.5 46.4 47.3 48.3 49.2 50.2
Total Long-Term Debt 0.0 188.1 188.1 188.9 178.9 157.6 122.3 78.5 50.2
Deferred Taxes - - 0.0 0.0 0.0 0.0 0.0 0.0 0.0
Pension Obligation (Asset) - 5.7 5.7 4.6 2.4 0.2 (1.3) (2.8) (2.8)
Common Stock & APIC - 117.0 117.0 117.0 117.0 117.0 117.0 117.0 117.0
Retained Earnings 217.1 (217.1) 0.0 1.7 20.3 47.0 81.4 123.9 171.1
Total Liab. and Stock. Equity 267.0 93.7 360.7 363.4 374.2 381.7 383.0 385.0 406.7
Management / Upside Case Balance Sheet

53
6/30/11 Adjust. Opening 2011 2012 2013 2014 2015 2016
Assets
Cash - 0.8 $0.8 $0.0 $0.0 $0.0 $0.0 $0.0 $0.0
Accounts Receivable 58.0 - 58.0 59.5 61.0 53.2 60.7 64.6 68.7
Inventories 18.8 - 18.8 19.2 19.0 16.7 19.4 19.7 20.9
Prepaid Expenses & Other - - - - - - - - -
Total Current Assets 76.7 0.8 77.5 78.7 80.1 69.9 80.1 84.2 89.6
PP&E 179.7 - 179.7 180.9 182.7 170.8 155.4 137.9 119.5
Goodwill - 83.1 83.1 83.1 83.1 83.1 83.1 83.1 83.1
Debt Issuance Costs - 9.8 9.8 9.3 8.2 7.1 6.0 4.9 3.8
Investment in Affiliate 10.5 - 10.5 11.5 14.0 16.7 19.9 23.9 28.1
Total Assets 267.0 93.7 360.7 363.4 368.1 347.5 344.5 334.0 324.1
Liabilities and Stockholders' Equity
Accounts Payable 49.9 - 49.9 51.1 51.7 45.3 50.8 53.9 57.3
Accrued Expenses 0.0 - 0.0 0.0 0.0 0.0 0.0 0.0 0.0
Accrued Income Taxes - - 0.0 0.2 0.2 0.2 0.2 0.3 0.4
Other - - 0.0 - - - - - -
Total Current Liabilities 49.9 0.0 49.9 51.2 51.8 45.5 50.9 54.1 57.7
Revolver Draw - 3.1 3.1 4.6 0.4 0.0 0.0 0.0 0.0
First Lien TL - 140.0 140.0 138.9 137.5 130.0 118.1 99.1 75.2
Mezzanine Debt - 45.0 45.0 45.5 46.4 47.3 48.3 49.2 50.2
Total Long-Term Debt 0.0 188.1 188.1 188.9 184.2 177.3 166.4 148.4 125.4
Deferred Taxes - - 0.0 0.0 0.0 0.0 0.0 0.0 0.0
Pension Obligation (Asset) - 5.7 5.7 4.6 2.4 0.2 (1.3) (2.8) (2.8)
Common Stock & APIC - 117.0 117.0 117.0 117.0 117.0 117.0 117.0 117.0
Retained Earnings 217.1 (217.1) 0.0 1.7 12.6 7.6 11.4 17.3 26.8
Total Liab. and Stock. Equity 267.0 93.7 360.7 363.4 368.1 347.5 344.5 334.0 324.1
Downside Case Balance Sheet

54
Major Oil Shock Case Balance Sheet
6/30/11 Adjust. Opening 2011 2012 2013 2014 2015 2016
Assets
Cash - 0.8 $0.8 $0.0 $0.0 $0.0 $0.0 $0.0 $0.0
Accounts Receivable 58.0 - 58.0 59.5 59.0 65.0 68.0 71.8 75.8
Inventories 18.8 - 18.8 19.2 18.5 20.3 21.6 21.8 23.0
Prepaid Expenses & Other - - - - - - - - -
Total Current Assets 76.7 0.8 77.5 78.7 77.5 85.3 89.7 93.6 98.8
PP&E 179.7 - 179.7 180.9 182.7 176.0 161.1 147.3 131.9
Goodwill - 83.1 83.1 83.1 83.1 83.1 83.1 83.1 83.1
Debt Issuance Costs - 9.8 9.8 9.3 8.2 7.1 6.0 4.9 3.8
Investment in Affiliate 10.5 - 10.5 11.5 14.0 16.7 19.9 23.9 28.1
Total Assets 267.0 93.7 360.7 363.4 365.5 368.2 359.8 352.8 345.6
Liabilities and Stockholders' Equity
Accounts Payable 49.9 - 49.9 51.1 50.3 55.0 56.7 59.8 63.0
Accrued Expenses 0.0 - 0.0 0.0 0.0 0.0 0.0 0.0 0.0
Accrued Income Taxes - - 0.0 0.2 0.2 0.2 0.2 0.3 0.4
Other - - 0.0 - - - - - -
Total Current Liabilities 49.9 0.0 49.9 51.2 50.5 55.1 56.9 60.0 63.4
Revolver Draw - 3.1 3.1 4.6 3.4 0.0 0.0 0.0 (0.0)
First Lien TL - 140.0 140.0 138.9 137.5 129.4 106.3 81.3 50.8
Mezzanine Debt - 45.0 45.0 45.5 46.4 47.3 48.3 49.2 50.2
Total Long-Term Debt 0.0 188.1 188.1 188.9 187.3 176.7 154.6 130.6 101.0
Deferred Taxes - - 0.0 0.0 0.0 0.0 0.0 0.0 0.0
Pension Obligation (Asset) - 5.7 5.7 4.6 2.4 0.2 (1.3) (2.8) (2.8)
Common Stock & APIC - 117.0 117.0 117.0 117.0 117.0 117.0 117.0 117.0
Retained Earnings 217.1 (217.1) 0.0 1.7 8.4 19.2 32.6 48.0 67.0
Total Liab. and Stock. Equity 267.0 93.7 360.7 363.4 365.5 368.2 359.8 352.8 345.6