investment portfolio priorities powerpoint … 13, 2015 · investment portfolio priorities . ......
TRANSCRIPT

1
Investment Portfolio Priorities
Board and Executive Staff Offsite July 13, 2015
2
What We Hope to Accomplish Today
• Inform – Progress since last update
• Understand – Portfolio priorities and other key initiatives
• Discuss – Continue dialogue – Illustrative examples – Outcomes – Next steps
3
Contents
Inform
i. Refresh – Portfolio Priority Characteristics ii. How did we get to this point iii. Where are we trying to get to

4
Refresh| Why Are Portfolio Priorities Important? 1. Focus attention on the overall mission
• Investment Belief 2 – Long Time Horizon
2. Provide clear basis for portfolio trade-off considerations (e.g., appreciation vs. income)
• Investment Belief 9 – Multi-faceted Risk
3. Align Investment Staff activities • Investment Belief 5 – Accountability
4. Define asset allocation strategic levers • Investment Belief 6 – Strategic Allocation

5
Portfolio Priorities| What do we have today
In order to be implementable, there must be a small number of specific priorities that support our fiduciary considerations
1. Protect the Funded Ratio 2. Stabilize Employer Contribution Rates 3. Ensure Sufficient Cash to Pay Benefits 4. Achieve Long-term Required Rate of Return
6
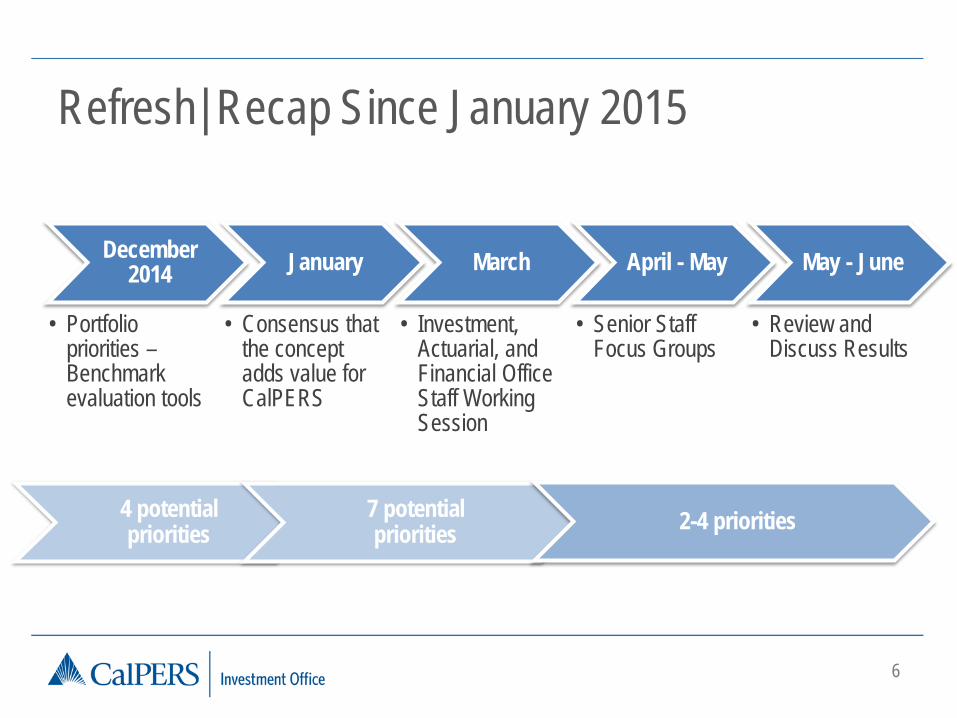
Refresh| Recap Since January 2015
December 2014
• Portfolio priorities – Benchmark evaluation tools
January
• Consensus that the concept adds value for CalPERS
March
• Investment, Actuarial, and Financial Office Staff Working Session
April - May
• Senior Staff Focus Groups
May - June
• Review and Discuss Results
4 potential priorities
7 potential priorities 2-4 priorities

7
Portfolio Priorities | Anticipated Outcomes
1. Enhance Asset Liability Management (ALM) process and benchmark selection methodology
2. Opportunity for dialogue and shared understanding
8
Contents
Understand – Portfolio Priorities & Other Work
i. Investment Beliefs ii. Liabilities Management iii. Investment Office 2020 Vision iv. CalPERS Strategic Plan

9
CalPERS’ Investment and Pension Beliefs
Asset Liability Management Process
Portfolio Priorities
Benchmarks – Reflect priorities – Assess success
Portfolio Construction | Reflects Our Priorities
Outcome of ALM Process – Policy Portfolio

10
Portfolio Priorities & Investment Beliefs |
–“How do you turn beliefs into execution?”
–“Investment Beliefs inform portfolio construction priorities”
May 2015 Towers Watson Presentation Highlights
11
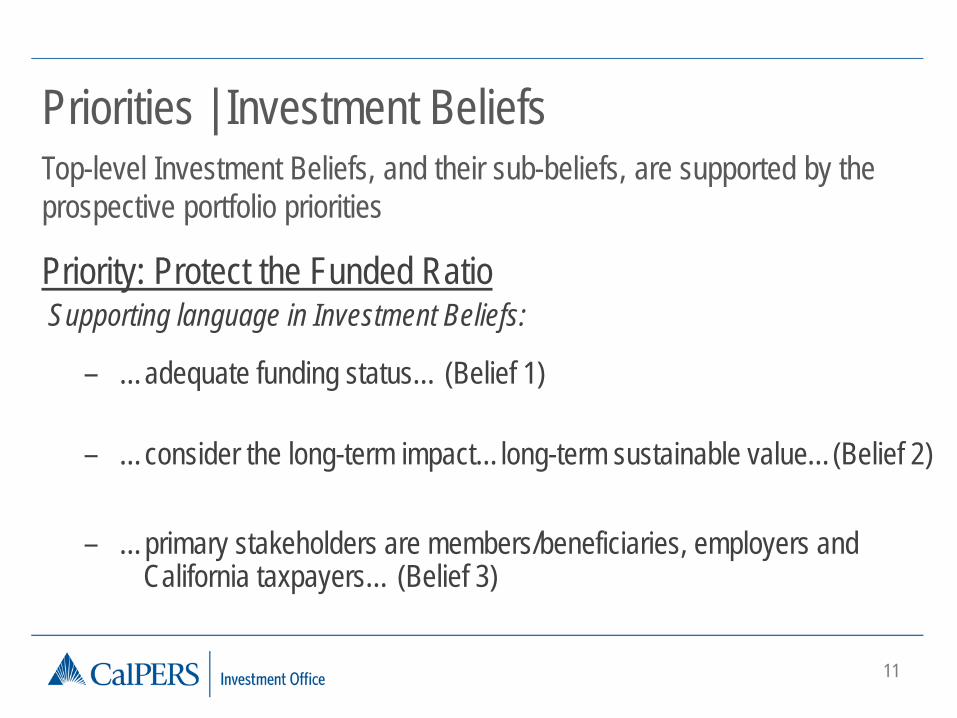
Priorities | Investment Beliefs Top-level Investment Beliefs, and their sub-beliefs, are supported by the prospective portfolio priorities
Priority: Protect the Funded Ratio Supporting language in Investment Beliefs:
– …adequate funding status… (Belief 1) – …consider the long-term impact…long-term sustainable value…(Belief 2) – …primary stakeholders are members/beneficiaries, employers and
California taxpayers… (Belief 3)

12
Priorities | Investment Beliefs Top-level Investment Beliefs, and their sub-beliefs, are supported by the prospective portfolio priorities
Priority: Stabilize Employer Contribution Rates Supporting language in Investment Beliefs:
– …hedge inflation (Belief 1) – …Tolerate some volatility… (Belief 2) – The path of returns matters… (Belief 9)

13
Portfolio Priorities | Investment Beliefs Top-level Investment Beliefs, and their sub-beliefs, are supported by the prospective priorities
Priority: Ensure Sufficient Cash to Pay Benefits Supporting language in Investment Beliefs:
– …growing cash requirement… (Belief 1) – ...cares about income and appreciation components… (Belief 1) – …Aligns interests… (Belief 10)

14
Priorities | Investment Beliefs Top-level Investment Beliefs, and their sub-beliefs, are supported by the prospective portfolio priorities
Priority: Achieve Long-term Required Rate of Return Supporting language in Investment Beliefs:
– …Invest in illiquid assets, provided appropriate premium is earned… (Belief 2)
– …delivery of long-term target return… (Belief 5) – …material impact on portfolio risk and return (Belief 6)

15
Interrelated Initiatives |
Investment & Pension Beliefs
Strategic Plan
Vision 2020 Liabilities
Management Priorities
Diagram is for illustrative purposes only

16
Priorities & Liabilities
― “Focus of risk mitigation should be a desired risk level, not a discount rate”
― “Where do we want to be as our goal?” ― “The volatility of investments is more important than
the discount rate” ― “Focusing on risk allocation instead of asset
allocation”
May 2015 ALM Board Workshop Highlights

17
Priorities & Liabilities
Key Risk Considerations – Funded Ratio
– Employer Contribution Rate Levels
– Employer Contribution Rate Volatility
Investment & Pension Beliefs
Strategic Plan
Vision 2020
Liabilities Management
Portfolio Priorities

18
Priorities & 2020 Vision
– Focused Portfolio
– Reduce Complexity
– Manage Risks
Investment & Pension Beliefs
Strategic Plan
Vision 2020
Liabilities Management
Portfolio Priorities

19
Priorities & CalPERS Strategic Plan
– Strategic Plan Goal: Improve long-term pension…sustainability
Investment & Pension Beliefs
Strategic Plan
Vision 2020
Liabilities Management
Portfolio Priorities

20
―Comments & Questions
21
Contents
Discuss – Continue Dialogue
i. Refined Portfolio Priorities ii. Illustrative Examples iii. Implications and Outcomes iv. Next Steps
22
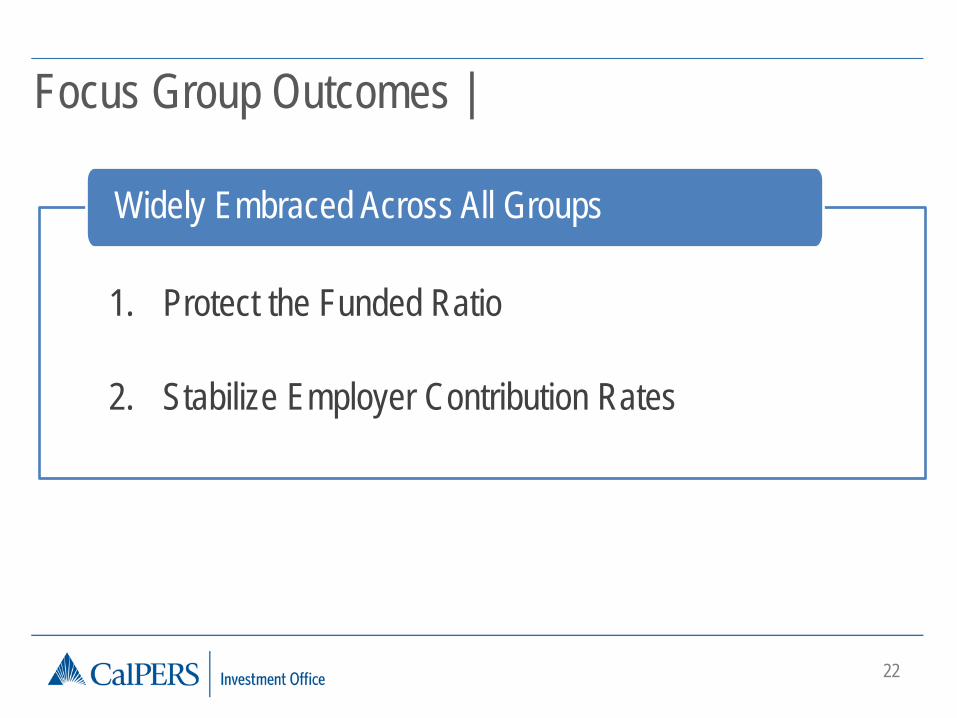
Focus Group Outcomes |
1. Protect the Funded Ratio
2. Stabilize Employer Contribution Rates
Widely Embraced Across All Groups

23
Focus Group Outcomes |
3. Ensure Sufficient Cash to Pay Benefits
4. Achieve Long-term Required Rate of Return
Wide Support, but With Interpretive Differences

24
Portfolio Priorities | Ensure Sufficient Cash to Pay Benefits
― “Checking Account” vs. “Reserve Account” ―Harvesting Income vs. Tapping Liquidity
Focus Group Discussion Observations

25
Portfolio Priorities | Achieve Long-term Required Rate of Return
― “Given” vs. Constraint ― Interplay with risk mitigation goals ― Long-term, not annual goal
Focus Group Discussion Observations

26
―Comments & Questions

27
Divergent Time Horizons
• Incentives 1-3 year
• ALM Cycle 4 year
• Capital Market Assumptions 10 year
• ALM Horizon – Blended Expected Returns 60 year
28
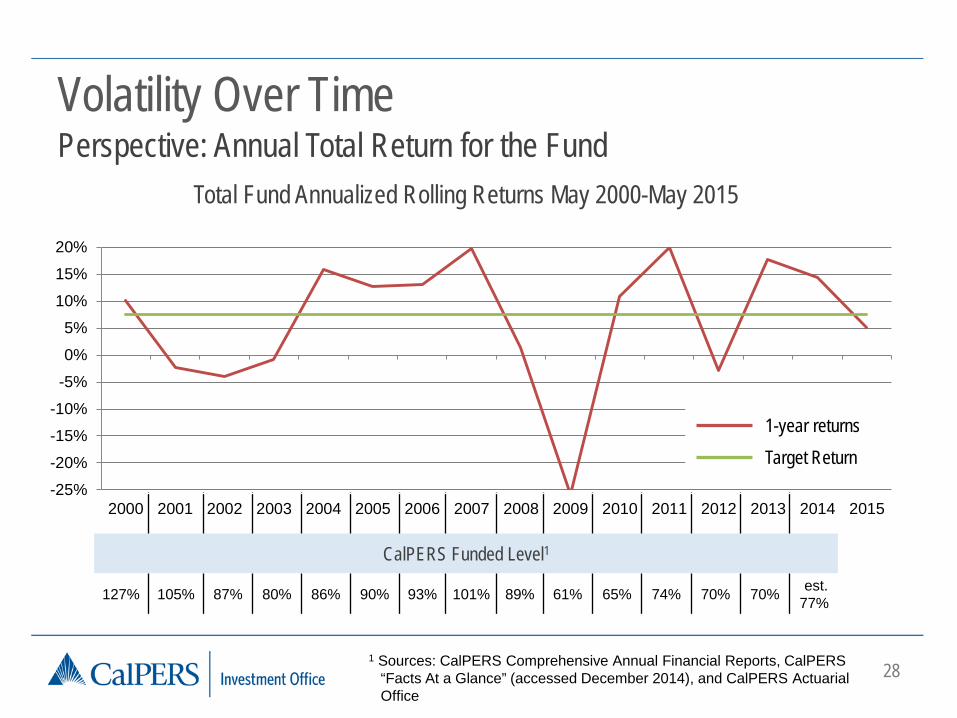
Volatility Over Time Perspective: Annual Total Return for the Fund
Total Fund Annualized Rolling Returns May 2000-May 2015
-25%
-20%
-15%
-10%
-5%
0%
5%
10%
15%
20%
2000 2001 2002 2003 2004 2005 2006 2007 2008 2009 2010 2011 2012 2013 2014 2015
1 Sources: CalPERS Comprehensive Annual Financial Reports, CalPERS “Facts At a Glance” (accessed December 2014), and CalPERS Actuarial Office
CalPERS Funded Level1
127% 105% 87% 80% 86% 90% 93% 101% 89% 61% 65% 74% 70% 70% est. 77%
1-year returns Target Return

29
-25%
-20%
-15%
-10%
-5%
0%
5%
10%
15%
20%
2000 2001 2002 2003 2004 2005 2006 2007 2008 2009 2010 2011 2012 2013 2014 2015
Volatility Over Time Perspective: 1-year vs. 4-year Returns for the Fund
Total Fund annualized rolling returns, May 2000 – May 2015
CalPERS Funded Level
127% 105% 87% 80% 86% 90% 93% 101% 89% 61% 65% 74% 70% 70% est. 77%
1-year returns
Target Return 4-year returns
30
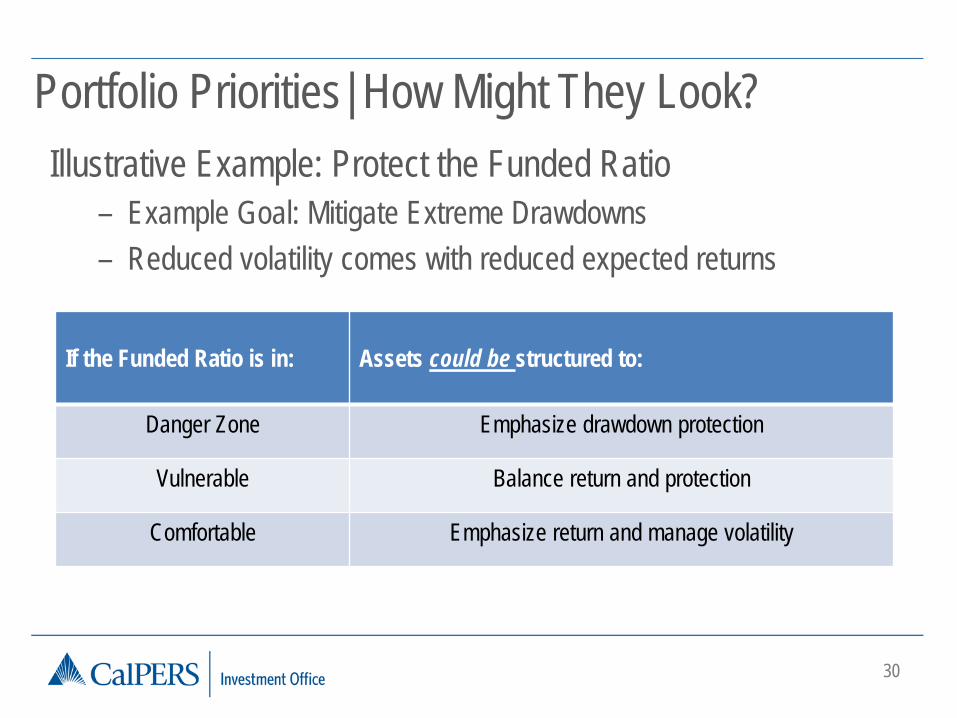
Portfolio Priorities| How Might They Look? Illustrative Example: Protect the Funded Ratio
– Example Goal: Mitigate Extreme Drawdowns – Reduced volatility comes with reduced expected returns
If the Funded Ratio is in: Assets could be structured to:
Danger Zone Emphasize drawdown protection
Vulnerable Balance return and protection
Comfortable Emphasize return and manage volatility

31
Portfolio Priorities| How Might They Look? Illustrative Example: Stabilize Employer Contribution Rates
– Example Goal: Manage volatility to stabilize contributions
1993 1994 1995 1996 1997 1998 1999 2000 2001 2002 2003 2004 2005 2006 2007 2008 2009 2010 2011Cont Rate Change 5.4% 0.0% 0.0% 0.7% 0.5% 0.5% -3.5% -4.5% -0.2% 1.4% 3.1% 6.6% 3.9% 0.0% -0.3% 0.6% -1.0% 0.1% 1.5%
-6.0%-4.0%-2.0%0.0%2.0%4.0%6.0%8.0%
Employer Contribution Rate Change FY1993-2011
Source: CalPERS Comprehensive Annual Financial Reports (PERF)
32
Portfolio Priorities| How Might They Look? Stabilize Employer Contribution Rates Continued
– Mitigating overall volatility through effective use of diversification
– Focus on total risk
33
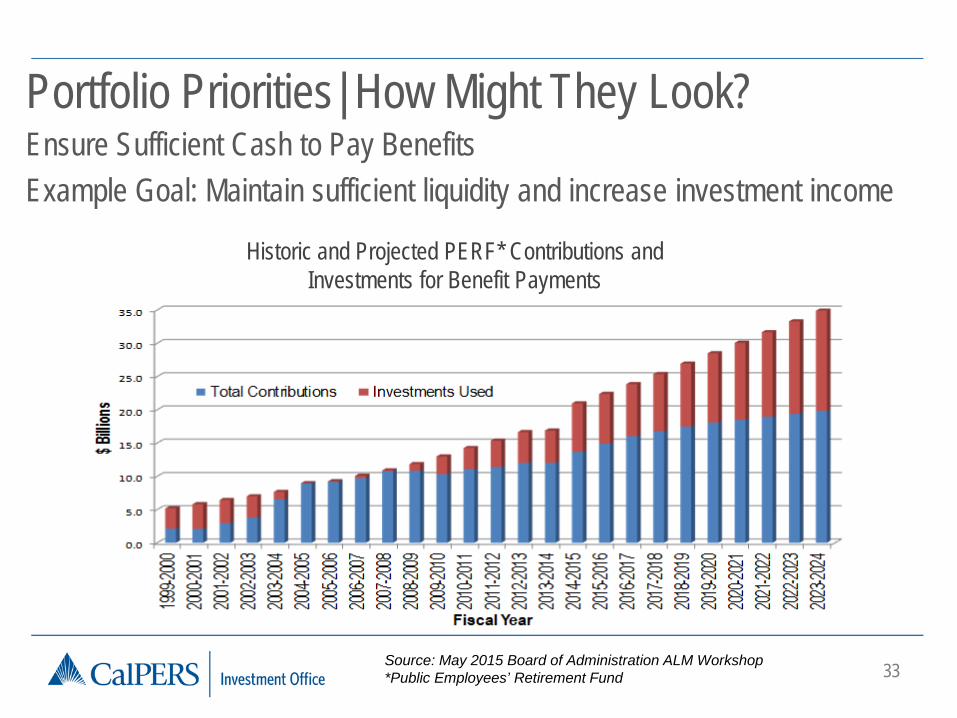
Portfolio Priorities| How Might They Look? Ensure Sufficient Cash to Pay Benefits Example Goal: Maintain sufficient liquidity and increase investment income
Source: May 2015 Board of Administration ALM Workshop *Public Employees’ Retirement Fund
Historic and Projected PERF* Contributions and Investments for Benefit Payments
34
Portfolio Priorities| How Might They Look? Achieving Required Long-Term Rate of Return
– Current return targets come with significant market risk – Goal is to refine our market exposure to best reflect chosen risk
and return tradeoffs

35
Underlying Portfolio Attribute
Priority
Portfolio Attributes to Address Priorities-Examples
Protect the Funded Ratio
Uncorrelated assets
Stabilize Employer Contribution Rates
Low Volatility & Managed Correlations
Ensure Sufficient Cash to Pay
Benefits
Dependable Investment
Income
Achieve Long-Term Required Returns
Risk Premia (Illiquidity,
Value, etc.)

36
―Comments & Questions

37
ALM Implications
Prior ALM processes have focused on forecasts of: – Returns – Volatility – Correlation
How could the 2017-18 ALM be different?

38
Return
Volatility
Dividend Yield
Illustration | Analysis Must Account for Uncertainty
1.5% to 2.8%
12% to 16.5%
-3.4% to 19.5%
Ranges for S&P 500 Over 10-year Periods (1988-2015)
Forecast accuracy for dividend yield and volatility is higher than
returns

39
Asset Allocation Implications
― Board focus on risk profile and balancing priorities ― Continuing integration of risk exposures (assets and
liabilities) ― Analysis and success criteria (including benchmarks) reflect
the portfolio priorities
For 2017-18 ALM we expect:

Portfolio Priorities| Potential Enhancements to Next ALM
ALM Analysis - Liabilities
Create simulated liabilities, contribution and payroll costs
Investment Committee chooses a policy portfolio
Step 6
Step 8
ALM Analysis - Assets
Determine CMAs1 and constraints
Create simulated annual returns for each distinct candidate portfolio
Step 4
Step 5 Create candidate portfolios
Updated - Step 7
1 Capital Market Assumptions (CMAs)
Portfolio Priorities: Review Investment Objectives and Asset Class Roles
Portfolio Priorities: Review Benchmarks
Updated - Step 2
Updated - Step 3
Forecast growth in liabilities
Conduct Review of CalPERS’ Investment Beliefs Updated - Step 1
40
Evaluate each candidate portfolio for alignment with portfolio priorities and key risk considerations

41
Benchmark Considerations – Reflect our priorities
– Are measurable and representative
– Are long-term in nature
– Represents shared goals – Consider multiple
benchmarks to fit specific purposes

42
Underlying Portfolio Attribute
Priority
Benchmarks | Selected to Emphasize Desired Attributes
Benchmarks
Protect the Funded Ratio
Uncorrelated assets
Stabilize Employer Contribution Rates
Low Volatility & Managed Correlations
Ensure Sufficient Cash to Pay
Benefits
Dependable Investment
Income
Achieve Long-Term Required Returns
Risk Premia (Illiquidity,
Value, etc.)

43
Summary| Benchmark Implications
From To From

44
―Comments & Questions

45
―Next Steps