investment opportunities in the philippine energy sector · notes a. required reserve margin (rm)...
TRANSCRIPT

Investment Opportunities in the Philippine Energy Sector
Department of Energy
Presentation Outline
Power
Oil & Gas
Coal
Natural Gas
Alternative Fuels
Renewable Energy

Power

POWER SITUATIONER
Source: DOE List of Existing Power Plants as of June 2014
• Includes embedded generators
• Excludes off-grid generators
Interconnection Line Capacity
• Leyte-Luzon (440 MW)
• Leyte-Cebu (400 MW)
• Leyte-Bohol (100 MW)
• Cebu-Negros (200 MW)
• Negros-Panay (100 MW)
FUEL TYPE LUZON VISAYAS MINDANAO PHILIPPINES
MW* % Share MW % Share MW % Share MW % Share
Coal 4,531 35.42 806 32.74 232 10.87 5,568 32.02
Oil Based 2,020 15.79 670 27.24 697 32.65 3,388 19.48
Natural Gas 2,861 22.37 1 0.04 0 0 2,862 16.46
Geothermal 844 6.60 915 37.19 108 5.08 1,868 10.74
Hydro 2,464 19.26 11 0.46 1,061 49.68 3,536 20.34
Wind 33 0.26 0 0 0 0 33 0.19
Biomass 38 0.30 44 1.80 36 1.68 119 0.68
Solar 13 0.53 1 0.05 14 0.08
TOTAL 12,792 2,461 2,135 17,387

LUZON SUPPLY-DEMAND OUTLOOK 2014-2020
Notes a. Required Reserve Margin (RM) i.e. 4% regulating reserve and contingency and dispatchable reserve requirement b. 4.2 % peak demand growth rate resulted from observed 0.6 elasticity ratio of demand for electric power with national economic growth applied to 7
percent GDP growth rate (GR) target for 2014-2015. c. 4.8 % peak demand growth rate resulted from observed 0.6 elasticity ratio of demand for electric power with national economic growth applied to 8
percent GDP growth rate (GR) target for 2016-2020. d. Assumed average forced outage of the total available capacity
Actual
Month Jan Feb Mar Apr May Jun Jul Aug Sep Oct Nov Dec
(%) 5.3 6.2 6.3 4.9 7.7 7.0 6.3 4.7 5.5 8.2 5.89 5.6
MW 677 794 801 621 983 888 800 601 708 1041 738 716
2017 Nov: 420 MW Pagbilao 3
2018 Jun: 460 MW SBPL**
2014 Nov: 19 MW NWPDC Wind Ph3* 87 MW Burgos Wind Ph1* 81 Caparispisan Wind* Dec: 135 MW SLTEC Puting Bato U1* 10 MW Pampanga Solar 63 MW Burgos Wind Ph2* 24 MW SCJIpower Bio 7.5 MW Bataan Cogen
2016 Jan: 12 MW Green Innov Bio Mar: 450 MW San Gabriel NG May: 150 MW Limay Coal U1 Sep: 150 MW Limay Coal U2
2015 Mar : 150 MW SLPGC Coal U1 18 MW IBEC Bio Jun: 150 MW SLPGC Coal U2 13 MW Sabangan HEPP Jul: 67.5 MW Pililia Wind Oct: 82 MW Anda Coal Nov: 150 MW SLTEC Puting Bato Coal U2 Dec: 4 MW Bicol Biomass
** Upon Secretary’s consideration
Note: 100 MW Avion and 40 MW Majestics considered as
additional capacity (not in the committed power projects)
* On-going testing and commissioning

Notes
a. Reserve Margin (RM) i.e. 4% regulating reserve and largest online unit for contingency and dispatchable reserve requirement
(100 MW to increase by 135 MW in 2016)
b. 7 % peak demand growth rate resulted from observed 1 elasticity ratio of demand for electric power with national economic
growth applied to 7 percent GDP growth rate (GR) target for 2014-2015.
c. 8 % peak demand growth rate resulted from observed 1 elasticity ratio of demand for electric power with national economic
growth applied to 8 percent GDP growth rate (GR) target for 2016-2020.
d. Assumed 4.35 percent average forced outage of the total available capacity
VISAYAS SUPPLY-DEMAND OUTLOOK 2014-2020 2014
Nov: 8 MW Villasiga HEP
Dec: 82 MW TPC Expansion*
54 MW San Lorenzo Wind
46 MW URC Bio
12 MW Hpo Bagasse
2015 Jan: 34 MW Nabas Wind Ph1
Sep: 16 MW Nabas Wind Ph2
Dec: 20 MW SCBiopower
2016 Jun: 135 MW Concepcion Coal 1
Nov: 135 MW Concepcion Coal 2
2017 Jun: 8 MW Cantakoy HEPP
34 MW VMCI Bio (TBD**)
** TBD – To be determined (target commercial operation)
* On-going testing and commissioning
Actual
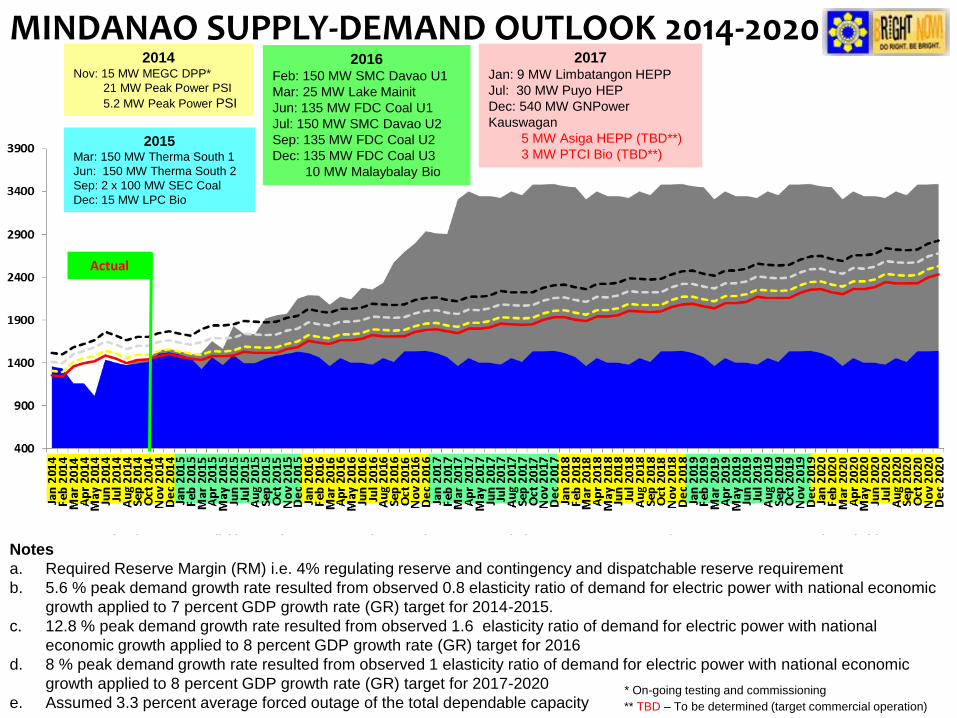
MINDANAO SUPPLY-DEMAND OUTLOOK 2014-2020
Notes
a. Required Reserve Margin (RM) i.e. 4% regulating reserve and contingency and dispatchable reserve requirement
b. 5.6 % peak demand growth rate resulted from observed 0.8 elasticity ratio of demand for electric power with national economic
growth applied to 7 percent GDP growth rate (GR) target for 2014-2015.
c. 12.8 % peak demand growth rate resulted from observed 1.6 elasticity ratio of demand for electric power with national
economic growth applied to 8 percent GDP growth rate (GR) target for 2016
d. 8 % peak demand growth rate resulted from observed 1 elasticity ratio of demand for electric power with national economic
growth applied to 8 percent GDP growth rate (GR) target for 2017-2020
e. Assumed 3.3 percent average forced outage of the total dependable capacity ** TBD – To be determined (target commercial operation)
* On-going testing and commissioning
Actual
2015 Mar: 150 MW Therma South 1
Jun: 150 MW Therma South 2
Sep: 2 x 100 MW SEC Coal
Dec: 15 MW LPC Bio
2014 Nov: 15 MW MEGC DPP*
21 MW Peak Power PSI
5.2 MW Peak Power PSI
2016 Feb: 150 MW SMC Davao U1
Mar: 25 MW Lake Mainit
Jun: 135 MW FDC Coal U1
Jul: 150 MW SMC Davao U2
Sep: 135 MW FDC Coal U2
Dec: 135 MW FDC Coal U3
10 MW Malaybalay Bio
2017 Jan: 9 MW Limbatangon HEPP
Jul: 30 MW Puyo HEP
Dec: 540 MW GNPower
Kauswagan
5 MW Asiga HEPP (TBD**)
3 MW PTCI Bio (TBD**)

Oil & Gas
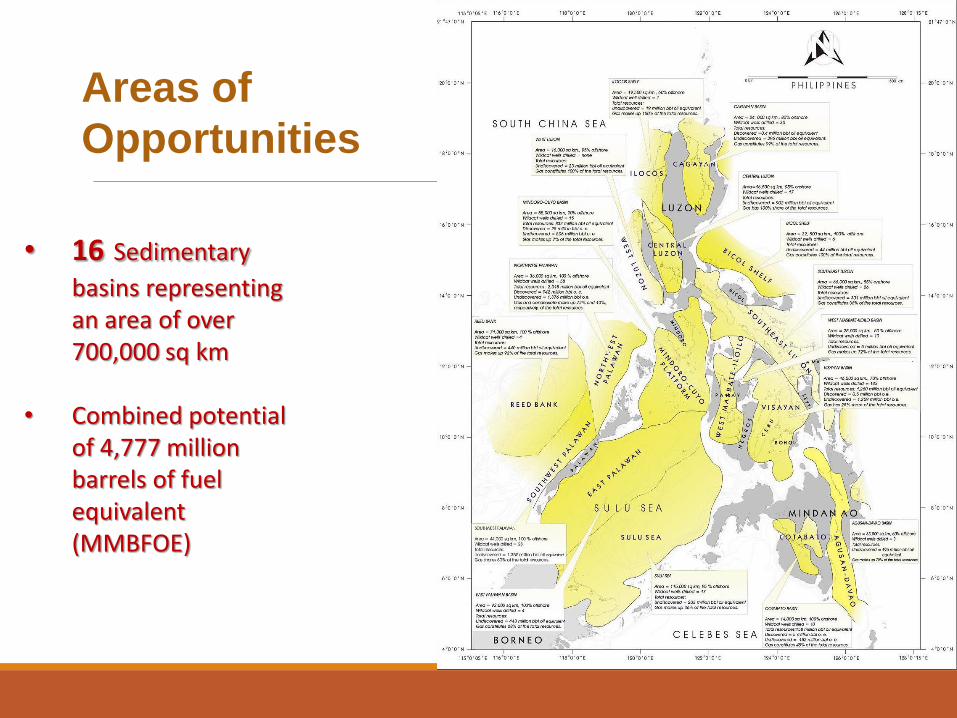
• 16 Sedimentary
basins representing an area of over 700,000 sq km
• Combined potential of 4,777 million barrels of fuel equivalent (MMBFOE)
Areas of
Opportunities

• 29 existing petroleum service contracts
• Produced 1.44 MMB, 112 BCF of gas & 3.82 MMB condensate
Upstream Oil & Gas
Exploration
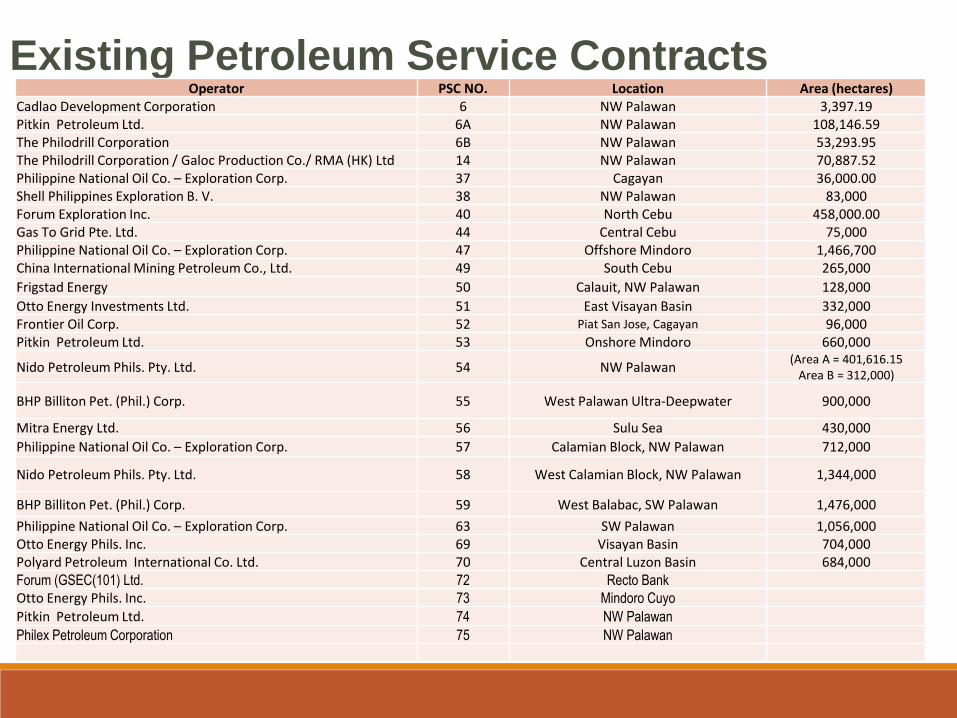
Existing Petroleum Service Contracts Operator PSC NO. Location Area (hectares)
Cadlao Development Corporation 6 NW Palawan 3,397.19
Pitkin Petroleum Ltd. 6A NW Palawan 108,146.59
The Philodrill Corporation 6B NW Palawan 53,293.95
The Philodrill Corporation / Galoc Production Co./ RMA (HK) Ltd 14 NW Palawan 70,887.52
Philippine National Oil Co. – Exploration Corp. 37 Cagayan 36,000.00
Shell Philippines Exploration B. V. 38 NW Palawan 83,000
Forum Exploration Inc. 40 North Cebu 458,000.00
Gas To Grid Pte. Ltd. 44 Central Cebu 75,000
Philippine National Oil Co. – Exploration Corp. 47 Offshore Mindoro 1,466,700
China International Mining Petroleum Co., Ltd. 49 South Cebu 265,000
Frigstad Energy 50 Calauit, NW Palawan 128,000
Otto Energy Investments Ltd. 51 East Visayan Basin 332,000
Frontier Oil Corp. 52 Piat San Jose, Cagayan 96,000
Pitkin Petroleum Ltd. 53 Onshore Mindoro 660,000
Nido Petroleum Phils. Pty. Ltd. 54 NW Palawan (Area A = 401,616.15
Area B = 312,000)
BHP Billiton Pet. (Phil.) Corp. 55 West Palawan Ultra-Deepwater 900,000
Mitra Energy Ltd. 56 Sulu Sea 430,000
Philippine National Oil Co. – Exploration Corp. 57 Calamian Block, NW Palawan 712,000
Nido Petroleum Phils. Pty. Ltd. 58 West Calamian Block, NW Palawan 1,344,000
BHP Billiton Pet. (Phil.) Corp. 59 West Balabac, SW Palawan 1,476,000
Philippine National Oil Co. – Exploration Corp. 63 SW Palawan 1,056,000
Otto Energy Phils. Inc. 69 Visayan Basin 704,000
Polyard Petroleum International Co. Ltd. 70 Central Luzon Basin 684,000
Forum (GSEC(101) Ltd. 72 Recto Bank
Otto Energy Phils. Inc. 73 Mindoro Cuyo
Pitkin Petroleum Ltd. 74 NW Palawan
Philex Petroleum Corporation 75 NW Palawan

Petroleum areas offered in PECR5
BASIN AREAS
SOUTHEAST LUZON
AREA 1
MASBATE-ILOILO
AREAS 2 & 3
NORTHEAST PALAWAN
AREAS 4 & 5
SOUTHEAST PALAWAN
AREA 6
RECTO BANK AREA 7
WEST LUZON AREAS 8,9,10 & 11

PECR Timeline
www.doe.gov.ph/pecr5

Coal

SAMAR
Resource Potential - 27.00
In-situ Reserves - 8.59
SURIGAO
Resource Potential - 209.00
In-situ Reserves - 69.55
DAVAO
Resource Potential - 100.00
In-situ Reserves - 0.21
SARANGANI
Resource Potential - 120.00
MASBATE
Resource Potential - 2.50
In-situ Reserves - 0.08
MINDORO
Resource Potential - 100.00
In-situ Reserves - 1.44
SEMIRARA
Resource Potential - 570.00
In-situ Reserves - 112.32
NEGROS
Resource Potential - 4.50
In-situ Reserves - 2.01
BUKIDNON
Resource Potential - 50.00
ZAMBOANGA
Resource Potential - 45.00
In-situ Reserves - 37.99
MAGUINDANAO
Resource Potential - 108.00
SULTAN KUDARAT
Resource Potential - 300.30
SOUTH COTABATO
Resource Potential - 230.40
In-situ Reserves - 81.07
CEBU
Resource Potential - 165.00
In-situ Reserves - 11.63
BATAN-POLILLO-
CATANDUANES
Resource Potential - 17.00
In-situ Reserves - 6.02
QUEZON
Resource Potential - 2.00
In-situ Reserves - 0.09
CAGAYAN VALLEY
Resource Potential - 336.00
In-situ Reserves - 82.57
2013 Summary of Regional Coal Reserves (in Metric Tons)
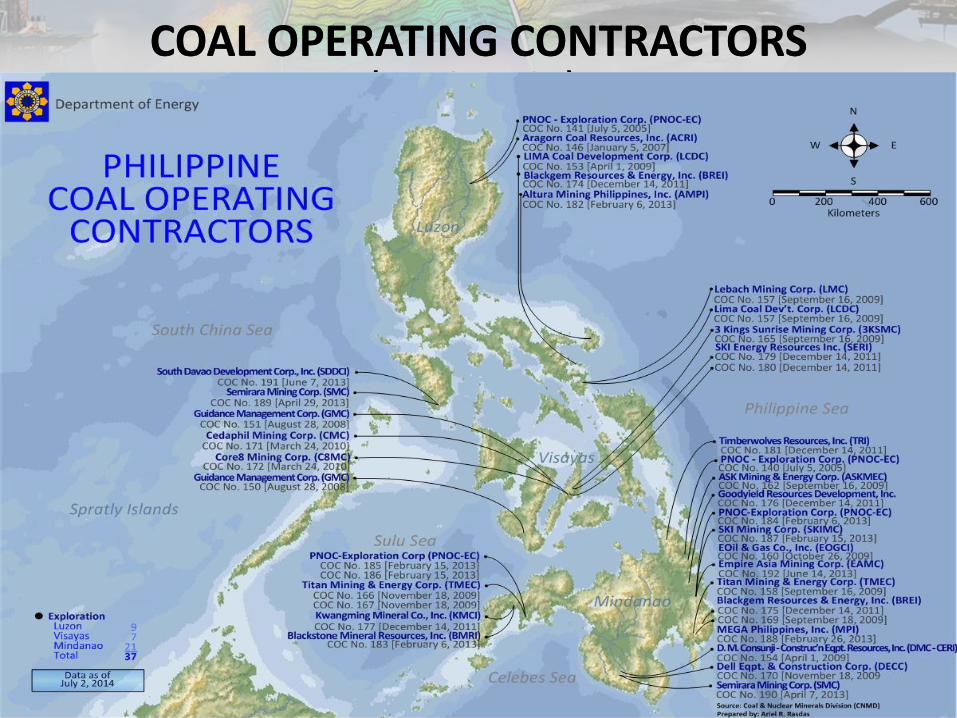
COAL OPERATING CONTRACTORS (EXPLORATION)s

COAL OPERATING CONTRACTORS DEVELOPMENT / PRODUCTION

Coal Areas for Offer in PECR5
• Nominated by private companies
• Previously offered areas in PECR 4 with no winning applicants
• Located in traditional coal mining provinces in the following Coal Regions in Mindanao:
a. Surigao Coal Region
b. Agusan-Davao Coal Region
c. Zamboanga Coal Region
d. Cotabato-Saranggani Coal
Region

Natural Gas

Malampaya Gas Field
2.7 TCF (2001)
1,000 MW Sta. Rita
First Gen/ IPP
1,200 MW Ilijan Power Plant
NPC IPP(KEPCO)
CNG Bus (2008)
Natural Gas Vehicles Program for Public Transport (NGVPPT)
•200 buses in the Southern Luzon-Manila route
•serviced thru the South Expressway NGV Refueling Station
•at a fixed/discounted price for 7 yrs.
Shell Refinery
Natural Gas Industry 560 MW San Lorenzo First Gen IPP

NATURAL GAS
Develop strategic infrastructure for receiving, storage, transmission and distribution
Promote use of natural gas beyond power
Serve as major alternative fuel for transport especially public transport
BATMAN 1
(Batangas Manila)
80-100 kms. (2015-17)
BATMAN 2
(Bataan - Manila)
140 kms. (2020)
BATCAVE
(Batangas – Cavite)
40 kms (2022)
SU-MA
(Sucat - Malaya)
35 kms. (2017)
ET LOOP
(EDSA – Taft Loop)
40 kms. (2020)

NATURAL GAS – LNG Terminals
MINDANAO

Alternative Fuels

ALTERNATIVE FUELS
11,977 taxis as of December 2013
239 auto-LPG stations (67 garage-based and 172 public)
Ongoing bidding of 3,000 electric tricycles (E-Trikes)
Business Model for Financing is being enhanced to
enable greater access of drivers for the acquisition of E-
Trikes
Rebidding of 2 modular CNG stations in Biñan, Laguna and Port Area, Batangas City by PNOC-EC
Secured DOTC commitment for franchise of the CNG buses to complete the pilot phase
Completed 2014-2030 Road Map for Alternative Fuels and Vehicles
Targets: 15,000 units CNG buses; 16,000 units CNG taxis by 2030; 150 refilling stations nationwide

Renewable
Energy

National Renewable Energy Program Develop Indigenous Energy Resources = Triple RE Installed Capacity by 2030

Renewable Energy Development (as of 31 October 2014)
RESOURCES NO. OF
PROJECTS
POTENTIAL CAPACITY
(MW)
INSTALLED CAPACITY
(MW)
FOR CONVERSION WITH CERTIFICATE OF
CONFIRMATION OF COMMERCIALITY
No. of Projects
Capacity (MW)
No. of Projects Capacity
(MW)
Hydro Power 394 6,199.31 118.93 5 42.0 44 354.75
Grid – Use 393 6197.81 118.93
Own - Use 1 1.50
Ocean Energy 5 25.00 - - - - -
Geothermal 41 750.00 1,866.19
Wind 55 1,547.51 51.9 1 45.0 12 706.90
Grid – Use 54 1,547.50 51.90
Own - Use 1 0.006
Solar 75 1,203.46 22.0 9 215.89 7 162.00
Grid – Use 67 1,201.45 22.00
Own - Use 8 2.015
Biomass 68 342.75 147.80 - - 10 94.51
Grid – Use 43 336.95 147.80
Own - Use 25 5.80
TOTAL 638 10,068.03 2,206.82 15 302.89 73 1,318.16

Issued DO No. 2013-10-0018 on October 2013 mandating that evaluation process
of RESCs shall not exceed 45 working days
Facilitated the issuance of Resolution No. 9 (“A Resolution Adopting the Rules on
Net-metering Program for Renewable Energy”) by ERC on July 2013
Relative to its establishment of the Renewable Energy Market (REM), DOE
directed PEMC to conduct the study on “REM Development and Draft Market
Design Document”
Issued DC 2013-05-009 prescribing DOE Guidelines for the Selection Process of
Renewable Energy Projects Under FIT System and the Award of Certificate for FIT
Eligibility
RE Mechanisms
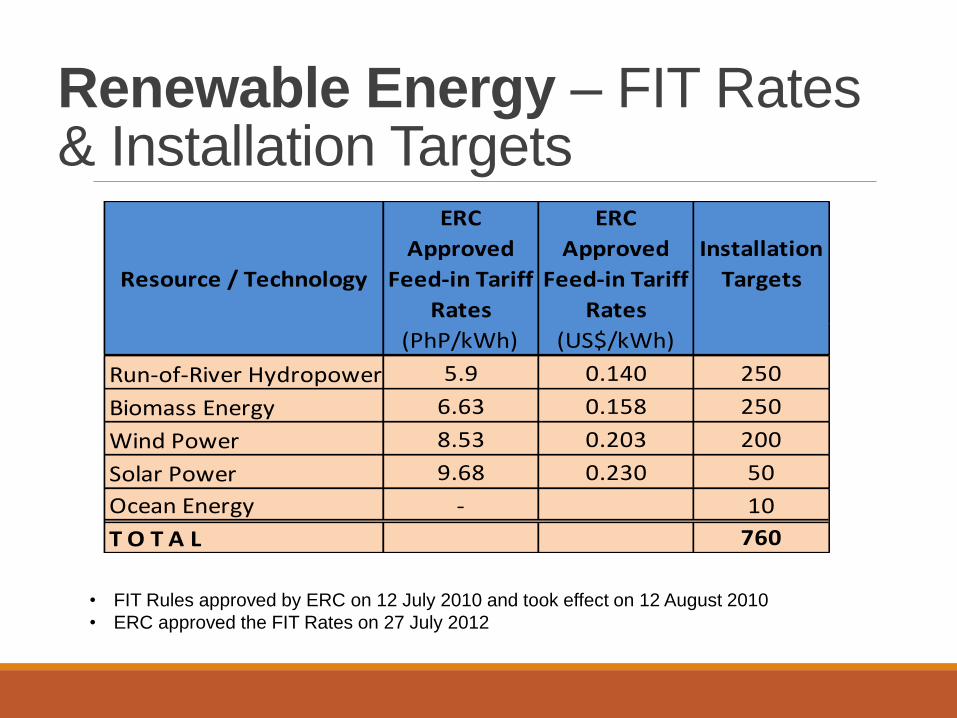
Renewable Energy – FIT Rates & Installation Targets
ERC
Approved
Feed-in Tariff
Rates
ERC
Approved
Feed-in Tariff
Rates
Installation
Targets
(PhP/kWh) (US$/kWh)
Run-of-River Hydropower 5.9 0.140 250
Biomass Energy 6.63 0.158 250
Wind Power 8.53 0.203 200
Solar Power 9.68 0.230 50
Ocean Energy - 10
T O T A L 760
Resource / Technology
• FIT Rules approved by ERC on 12 July 2010 and took effect on 12 August 2010
• ERC approved the FIT Rates on 27 July 2012

THANK YOU

Contact Details:
Investment Promotion Office (IPO)
Energy Center
Rizal Drive, Bonifacio Global City
Taguig, Metro Manila
Philippines
Trunkline : (+632) 479-2900 locals 371 and 389 Telefax No. : (+632) 840-2255
E-mail address : [email protected] [email protected]