investment management committee
TRANSCRIPT

INVESTMENT MANAGEMENT COMMITTEE
December 2017


TEACHER RETIREMENT SYSTEM OF TEXAS MEETING BOARD OF TRUSTEES
AND INVESTMENT MANAGEMENT COMMITTEE
(Committee Chair and Members are Subject to Change at the December Board Meeting: Mr. Colonnetta, Chair; Mr. Corpus, Mr. Moss, and Ms. Ramirez,)
All or part of the December 14, 2017, meeting of the TRS Investment Management Committee and Board of Trustees may be held by telephone or video conference call as authorized under Sections 551.130 and 551.127 of the Texas Government Code. The Board intends to have a quorum and the presiding officer of the meeting physically present at the following location, which will be open to the public during the open portions of the meeting: 1000 Red River, Austin, Texas 78701 in the TRS East Building, 5th Floor, Boardroom.
AGENDA
December 14, 2017 – 1:30 p.m. TRS East Building, 5th Floor, Boardroom
1. Call roll of the Committee Members.
2. Consider the approval of the proposed minutes of the September 21, 2017,committee meeting – Committee Chair.
3. Review the Multi-Asset Strategies Group – Mohan Balachandran, Ashley Baum,Kyle Schmidt and Matt Talbert.
4. Review the Risk Group Annual Update – James Nield and Mark Telschow.
NOTE: The Board of Trustees (Board) of the Teacher Retirement System of Texas will not consider or act upon any item before the Investment Management Committee (Committee) at this meeting of the Committee. This meeting is not a regular meeting of the Board. However, because the full Investment Management Committee constitutes a quorum of the Board, the meeting of the Committee is also being posted as a meeting of the Board out of an abundance of caution.

Minutes of the Investment Management Committee
September 21, 2017
The Investment Management Committee of the Board of Trustees of the Teacher Retirement System of Texas met on September 21, 2017, in the boardroom located on the fifth floor of the TRS East Building offices at 1000 Red River Street, Austin, Texas.
Committee Members present: Mr. Joe Colonnetta, Chair Mr. David Corpus Mr. David Kelly Mr. Chris Moss Ms. Dolores Ramirez Other Board Members present: Ms. Karen Charleston Mr. John Elliott Dr. Greg Gibson Others present: Brian Guthrie, TRS Steve Huff, Fiduciary Counsel, Reinhart Boerner Van Deuren s.c. Ken Welch, TRS Steve Voss, Aon Hewitt Carolina de Onis, TRS Mike Comstock, Aon Hewitt Jerry Albright, TRS Michael McCormick, Aon Hewitt Jase Auby, TRS Ted Melina Raab, Texas AFT James Nield, TRS Ann Fickel, TCTA Mike Pia, TRS J.B Daumerie, TRS Dale West, TRS Susanne Gealy, TRS Brad Gilbert, TRS Heather Traeger, TRS Katherine Farrell, TRS Dr. Keith Brown, Investment Advisor Investment Management Committee Chair Mr. Colonnetta called the meeting to order at 1:00 p.m.
1. Call roll of Committee members.
Ms. Farrell called the roll. A quorum was present.
2. Consider the approval of the proposed minutes of the June 1, 2017 committee meeting – Committee Chair Joe Colonnetta.

On a motion by Mr. Corpus, seconded by Mr. Kelly, the committee voted to approve the proposed minutes for the June 1, 2017, Investment Management Committee meeting as presented.
3. Review the External Public Markets Portfolio – Dale West.
Mr. Dale West explained the external public markets group is charged with hiring external managers, both in traditional long oriented fashion and hedge funds in the public markets. Mr. West provided a summary of the results for the year. He stated the year began right after Brexit. He stated in essence they were starting at the bottom and rebounded – the absolute returns from both portfolios were extremely strong. Mr. West reported the external public market portfolios were just under $40 billion as of June 30th, representing about 28 percent of the Trust. He said the portfolios in aggregate returned 18.3 percent over the one-year period; 4 percent annualized over three years and 9 percent annualized over five years. Mr. West reported that all six asset class portfolios outperformed their benchmarks in the 12-month period with five of six ahead of the benchmark for five years. He said the U.S. portfolios is the exception over the long term. . Ms. Susanne Gealy reported on the global equity external manager program. She stated the total global equity portfolio of $27.8 billion returned 22.3 percent and 161 basis points of excess return beyond the benchmark over the last year. This portfolio is broken out into four equity asset class mandates: US portfolio, non- US developed, emerging market and world equity. Ms. Gealy said the three international portfolios were reporting significant success and results. Ms. Gealy discussed the critical process of reunderwriting underperforming managers of external public markets. She said while underperforming managers, while regrettable and not preferred are a natural course of the investment cycle and the investment opportunity set. She said as soon as a CUSUM risk signal is triggered, they move into re-underwriting the manager. A CUSUM risk signal is the statistical description of cumulative sum, which comes from industry or manufacturing. Ms. Gealy said in this application, it is used to identify when a manager’s information ratio is beyond or below what is expected to occur. Mr. Brad Gilbert stated on the hedge fund side, both portfolios outperformed their benchmarks. He said the two separate hedge fund portfolios equate to 8 percent of Trust assets and 2 percent of risk. He reported the directional portfolio returned 11.7 percent, which is 538 basis points ahead of its benchmark. He also reported the stable value portfolio returned 7 percent, which is 168 basis points ahead of its benchmark. Mr. Gilbert discussed why they were investing in hedge funds and what they are looking to create with this allocation. He said the directional portfolio is named so because it tends to move directionally with equity markets but has less than one-half the volatility of equities. The stable value portfolio, he said, has outperformed Treasuries by 80 basis points each year since inception, with about one-fifth of the volatility in Treasuries. Mr. Gilbert discussed other methods of viewing the performance of the two portfolios. Mr. Gilbert then discussed the work on hedge fund fees over the last year, implementing one or thirty structure which began in the fourth quarter of 2016. Mr. West described the fee savings for the Trust. Mr. Gilbert reported Credit Suisse did a midyear survey stating 14 percent of investors

and 18 percent of pensions are now either implementing or looking to implement the one or 30 structure.
4. Review the Public Strategic Partnership Network – Michael Pia and J.B. Daumerie.
Mr. Mike Pia provided the annual report on the public SPN. He reported the public SPN portfolio is a $7.5 billion portfolio with four global firms. He said the portfolio exceeded its alpha target of 200 basis points, by returning 214 basis points on a one-year basis. He stated the tracking error has been muted at 84 basis points.
Mr. J.B. Daumerie provided greater detail as to the public SPN performance. He said there was a politically driven bull market, which helped partners have a negative view on bonds. He reported relative valuations and easing monetary policies internationally, provided opportunities for the partners to capitalize on themes.
Mr. Daumerie discussed one of the key strengths of the partnership is the key force multiplier on the Trust. He stated the partners are not just an external allocation of capital but they also serve the Trust in a variety of avenues. The partners share insights on specific market events and investment problems and collaborate on research projects.
5. Global Equity Best Practices Update – Jase Auby and Dale West.
Mr. Jase Auby discussed the global equity best practices examination within the global equity portfolio. He said this was the third and final presentation. The first presentation covered phase one where the best practices across the industry were reviewed. Phase two begain to focus in on what alpha streams we had and how to optimize the portfolio. And for the final phase, phase three is the implementation of the plan. Mr. Auby characterized the strategy as rather than trying to do all things in the US market and cover all the bases, they are going to be much more selective. He said they have moved some of the money into passive and are focusing on smaller, more niche strategies.
Mr. Auby reported there are four areas of focus. The first is to improve the organization and have it focused on the overall result of the portfolio. The second area of focus is to potentially increase the newer internal quantitative portfolios, scaling up innovation. The third area of focus is to address the challenge of negative alpha in the US portfolios. And the fourth area is increasing the focus on the management of compensated risk premium.
Mr. West reported that in looking across the Trust, the international alpha streams have consistently generated positive returns and added value while the US alpha streams have been a consistent drag. He said they were also able to identify some that were duplicative and not necessary. As a result, he said, a handful of external managers were terminated over the last couple of months, as redundant.
Mr. West stated the preference is for internal portfolios when there is the internal capability. He said after allocation to internal portfolios then they complete the rest of the target asset allocation with external portfolios. He said a risk model is used to review the stocks in each portfolio to

determine the risk footprint of a given strategy. Mr. West said the risk model is to make sure the exposures are what they want in terms of targeted and compensated risk premiums. Without further discussion, the meeting adjourned at 2:12 p.m. APPROVED BY THE INVESTMENT MANAGEMENT COMMITTEE OF THE BOARD OF TRUSTEES OF THE TEACHER RETIREMENT SYSTEM OF TEXAS ON THE 14TH DAY OF DECEMBER 2017.
______________________________ _________________ Katherine H. Farrell Date Secretary of the TRS Board of Trustees

Multi-Asset Strategies GroupMohan Balachandran, Senior Managing DirectorAshley Baum, Senior Investment ManagerMatt Talbert and Kyle Schmidt, Investment Manager
December 2017

2
Agenda
I. Mandate
II. Multi-Asset Strategies Group Organization
III. Performance
IV. Team Overviews• Quantitative Equity Strategies Team• Fixed Income Team• Alternative Risk Premia Team• Special Opportunities Team

3
S t a b l e Va l u e1 6 %
G l o b a l E q u i t y5 7 %
R e a l R e t u r n2 2 %
Category:
Asset Class:
Economic Conditions:
The Trust is allocated across the following groups:
Multi-Asset Strategies Mandate
•GDP surprises are negative•Inflation surprisingly low with weak demand•Negative earnings surprises•Out of line valuations•Flight to quality
•Positive GDP surprises•Inflation surprises not dramatic•Positive earnings surprises•Reasonable valuations•Political stability
•Real GDP growth too low•Inflation surprises on the high side•Real earnings too low•Commodity-oriented demand exceeds supply by an above normal margin
Treasuries 11%Stable Value Hedge Funds 4%
Cash 1%Absolute Return 0%
44% Public Equities:USA18%
Non-US Developed 13%Emerging Markets 9%
Directional Hedge Funds 4%
13% Private Equity
Global TIPS 3%Real Estate & Other Real Assets 14%
Energy & Natural Resources 5%Commodities 0%
REITS 0%
Risk Parity 5%

4
Multi-Asset Strategies Mandate
• Alternative Risk Premia: Harvest systematic, empirically tested sources of return through dynamic long-short multi-asset strategiesARP
• Special Opportunities: Access opportunistic investments that are accretive to the overall Trust not targeted in other areas
Spec Opps
• Quantitative Equity Strategies: Manage systematic active equity portfolios using alpha models and risk premiaQES
• Treasury: Manage Trust liquidity, rebalancing process and securities lendingTreasury
• Fixed Income: Manage US Treasury, cash and global inflation-linked portfolios with a low tracking errorFixed Income
SAA
• Multi-Asset Research & Development: Conduct research and development across equities, fixed income, credit and commoditiesR&D
Manage the Trust’s multi-asset exposures and develop alpha strategies
Alph
aBe
taTr
ust
• Strategic Asset Allocation: Develop and implement Trust-wide strategic asset allocation based on long-term risk, return and diversification expectations

5
Multi-Asset Strategies Group
Mohan Balachandran, PhDSr. Managing DirectorPhD, Physics, Brown University
Wayne Speer, CFASr. Investment ManagerMBA, SMU
Don StanleyAssociateBBA, Finance UT Austin
Shruti SureshContractorMS, StatisticsColumbia University
Solomon GoldInvestment ManagerMS, Economics, UT Austin
Hasim MardinSr. AssociateMS, Economics, UT Austin
Jingshan Fu, PhDInvestment ManagerPhD, Demography, Harvard University
ANALYTICS/ RESEARCH
Mark Albert, CFASr. DirectorMBA, University of Michigan
Ashley Baum, CFA, CPASr. Investment ManagerMPA Accounting, UT Austin
Matt Talbert, PhDInvestment Manager PhD, Economics, UT Austin
Multi-Asset Strategies Group HighlightsFour PhDs
Eleven Masters DegreesSix CFAs
Patrick Zerda, CFASr. AssociateMPA Accounting, UT Austin
Sibei Wen, CFAContractorMS, Statistics UT Austin
Ryan LearySr. AssociateMBA, Rice University
Paul WaclawskyAdministrativeBS, AccountingUniversity of Maryland
Eric Morris, CFAAssociateMBA, UT Austin
Gabriel Salinas, PhDSr. AssociatePhD, Economics UT Austin
Kyle SchmidtInvestment ManagerMBA, SMU
QES Spec Opps ARP ARP/QES

6
Performance Executive SummaryAs of September 30, 2017
Source: State Street Bank, TRS IMD1The Special Opportunities benchmark is a blend of the underlying trust benchmarks weighted by the NAV of the underlying investments against the relevant benchmark (a combination of the Trust’s US equity benchmark and Absolute Return (LIBOR plus 200 bp) benchmark). Historically, the benchmark has also included weighted contributions from the real estate and energy and natural resources benchmarks. 2 Returns on overlay portfolio scaled to 12% volatility on $284MM NAV, equivalent to 2.5 bps of Trust risk3Portfolio live since 9/30/15
Multi-Asset Strategies Group
PortfolioTotal Assets Return Alpha (bp)
$, bn % Trust 1-Year 3-Year 1-Year 3-Year
Global Equity $4.0 2.8%
Quantitative Equity Strategies 3.1 2.1% 22.4% 8.4% +330 +60
Low Volatility 0.9 0.6% 19.3% 15.9% +13 +456
Stable Value $14.2 9.7%
Treasury 13.6 9.3% -6.0% 5.1% +33 +21
Special Opportunities 0.7 0.4% 7.7% 6.1% +141 1 +176 1
Real Return
TIPS $4.3 3.0% -0.4% 1.9% +31 +26
Overlay
Alternative Risk Premia $0 2 0% 2 11.3% 10.1% 3 +1128 +1006 3
Total $22.6 $15.4%
7
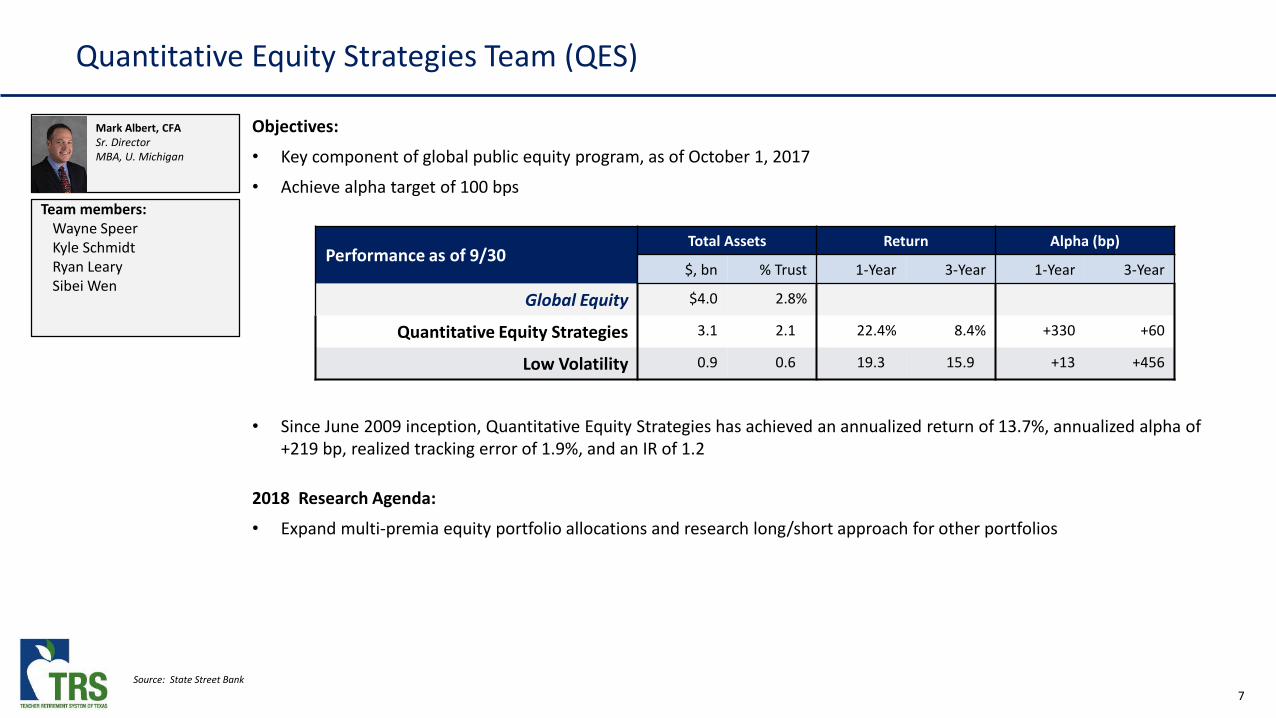
Quantitative Equity Strategies Team (QES)
Objectives:
• Key component of global public equity program, as of October 1, 2017
• Achieve alpha target of 100 bps
• Since June 2009 inception, Quantitative Equity Strategies has achieved an annualized return of 13.7%, annualized alpha of +219 bp, realized tracking error of 1.9%, and an IR of 1.2
2018 Research Agenda:
• Expand multi-premia equity portfolio allocations and research long/short approach for other portfolios
Mark Albert, CFASr. DirectorMBA, U. Michigan
Team members:Wayne SpeerKyle SchmidtRyan LearySibei Wen
Source: State Street Bank
Performance as of 9/30Total Assets Return Alpha (bp)
$, bn % Trust 1-Year 3-Year 1-Year 3-Year
Global Equity $4.0 2.8%
Quantitative Equity Strategies 3.1 2.1% 22.4% 8.4% +330 +60
Low Volatility 0.9 0.6% 19.3% 15.9% +13 +456

8
Fixed Income Team
Objectives:
• Manage total Trust asset allocation of $17.9 billion in internal US treasury and global inflation-linked portfolios
• Oversee and communicate SAA implementation
• Manage global inflation-linked bond allocation for Risk Parity portfolio
2018 Research Agenda:
• Research global sovereign bond portfolio
• Develop emerging market debt portfolio capabilities
Mohan Balachandran, PhDSr. Managing DirectorPhD, Physics, Brown University
Team members:Hasim MardinPatrick ZerdaEric Morris
Source: State Street Bank
Performance as of 9/30Total Assets Return Alpha (bp)
$, bn % Trust 1-Year 3-Year 1-Year 3-Year
Treasury $13.6 9.3% -6.0% 5.1% +33 +21
TIPS $4.3 3.0% -0.4% 1.9% +31 +26

9
Alternative Risk Premia Team
Objectives:
• Use overlay strategies to generate excess return for Public Markets
• Achieve portfolio returns through a diversified set of risk premia targeting a Sharpe ratio of 0.7
2018 Research Agenda:
• Right size the ARP portfolio
• Investigate new strategies and applications for risk premia investing
Matt Talbert, PhDInvestment ManagerPhD, Economics, University of Texas
Team members:Jingshan FuSolomon GoldKyle SchmidtGabriel SalinasRyan Leary
Source: State Street Bank, TRS IMD1 Returns on overlay portfolio scaled to 12% volatility on $284 million NAV, equivalent to 2.5 bps of Trust risk2Portfolio live since 9/30/15
Performance as of 9/301Total Assets Return Alpha (bp)
$, bn % Trust 1-Year 3-Year 1-Year 3-Year
Alternative Risk Premia $0 1 0% 1 11.3% 10.1% 2 +1128 +1006 2

10
This slide was intentionally left blank.

11
This slide was intentionally left blank.

12
Special Opportunities Team
Objectives:• Capture unique opportunities from TRS’ external network that are accretive to the overall Trust with acceptable risk and
liquidity• Outperform allocated funding source over a three year period
Accomplishments:• Increased Special Opportunities platform co-investment capacity, including two new partners to now total six relationships• Reviewed 65 unique opportunities over the last 12 months• Invested in 9 co-investments in the last 12 months totaling $432 million• Launched direct lending mandate for $600 million across corporate, senior, mezzanine and real estate credits (legal pending)
2018 Research Agenda:• Support and implement Illiquid Credit initiative• Continue building Special Opportunities external network
Source: StateStreet Bank1 Inception date is June 4, 20122 The Special Opportunities benchmark is a blend of the underlying trust benchmarks weighted by the NAV of the underlying investments against the relevant benchmark (a combination of the Trust’s US equity benchmark and Absolute Return (LIBOR plus 200 bp) benchmark). Historically, the benchmark has also included weighted contributions from the real estate and energy and natural resources benchmarks.
Ashley Baum, CFA, CPASr. Investment ManagerMPA and BBA, UT Austin
Team members:Don StanleyShruti Suresh
Performance as of 9/30Total Assets Return Alpha (bp) SI
IRR1SI
MOIC$, bn % Trust 1-Year 3-Year 1-Year 3-Year
Special Opportunities $0.7 0.4% 7.7% 6.1% +141 2 +176 2 11.8% 1.1x

13
This slide was intentionally left blank.

14
This slide was intentionally left blank.

15
This slide was intentionally left blank.
16
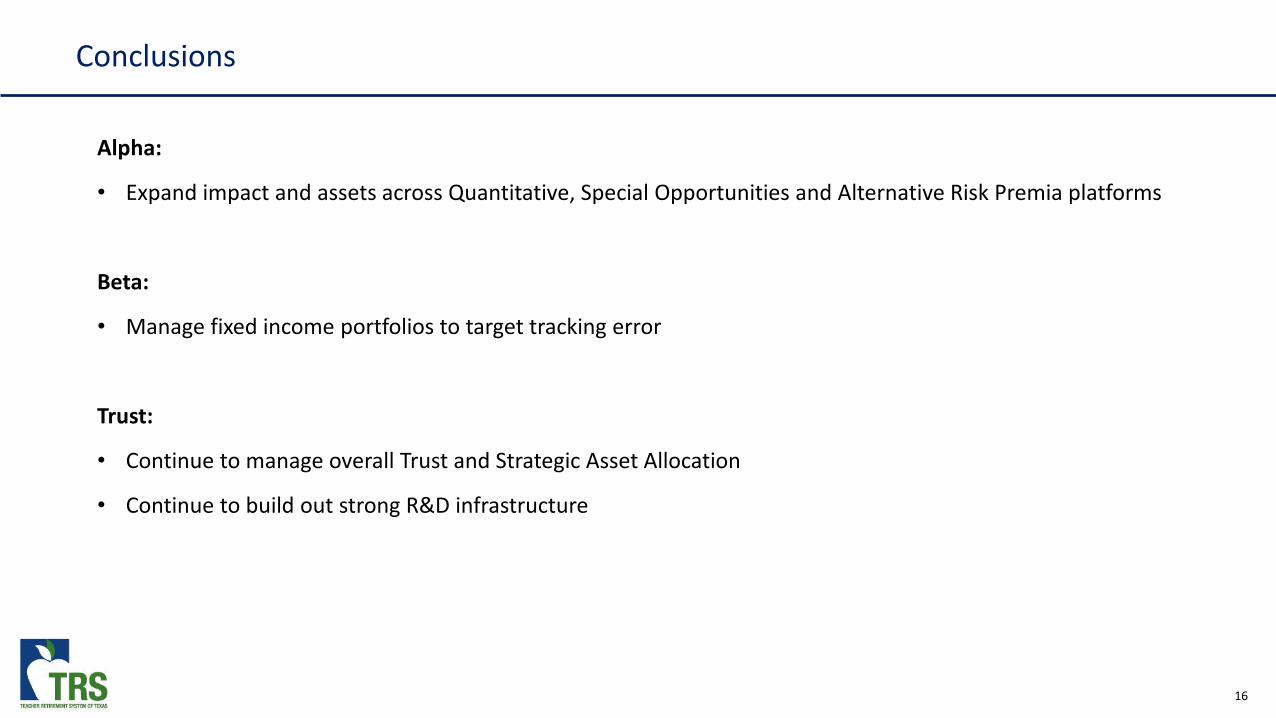
Conclusions
Alpha:
• Expand impact and assets across Quantitative, Special Opportunities and Alternative Risk Premia platforms
Beta:
• Manage fixed income portfolios to target tracking error
Trust:
• Continue to manage overall Trust and Strategic Asset Allocation
• Continue to build out strong R&D infrastructure

APPENDIX

18
This slide was intentionally left blank.

19
This slide was intentionally left blank.


Risk Group Annual UpdateJames Nield, Chief Risk OfficerMark Telschow, Senior Investment Manager
December 2017

2
Agenda
I. Mandate: Enable Efficient Risk Usage
II. Risk Group Organization
III. Risk Management• Identify, Prepare, Act
IV. Risk Strategies• Performance• Strategy Overview

3
Risk Mandate
Source: State Street
• Enable efficient risk usage through Risk Management and Risk Strategies
Risk Strategies
Risk Parity Low Volatility
Tilts
Dynamic FX Reinsurance
Risk Management
MacroTotal Trust Portfolios
• One-year and three-year returns of 9.1% and 6.1%• One-year and three-year alpha of +49 bp and +140 bp
• Systematically monitor over 300 signals each day• “Identify, Prepare, Act” approach to Risk Management

4
Risk Group Organization
James Nield, CFA, FRMChief Risk OfficerMBA, Finance, New York UniversityBS, Finance, Pennsylvania State University
Mark Telschow, CFASenior Investment ManagerBS, Civil Engineering, University of Texas
Mike Simmons, CFA Senior AssociateMPA, Accounting, University of TexasBBA, Finance,Texas A&M University
Steven LambertAssociateBS, Business Management,Saint Joseph’s College
Stephen Kim State Street EmployeeMBA, Finance, University of TexasBS, Computer Science,Dartmouth College
Josiah StevensonSenior AnalystMS, Economics, University of TexasBS, Economics, Texas A&M University
Paul WaclawskyAdministrativeBS, Accounting,University of Maryland
Risk Group Highlights
Five Advanced DegreesThree CFAsOne FRM
Elona RikaContractorPhD Economics & Finance,Brandeis University
Pierre PfarrAnalystBA, Economics,University of Texas
5
• Allocation• Counterparty• Currency• Derivatives• Leverage• Liquidity• Scenarios• Tracking Error• VaR
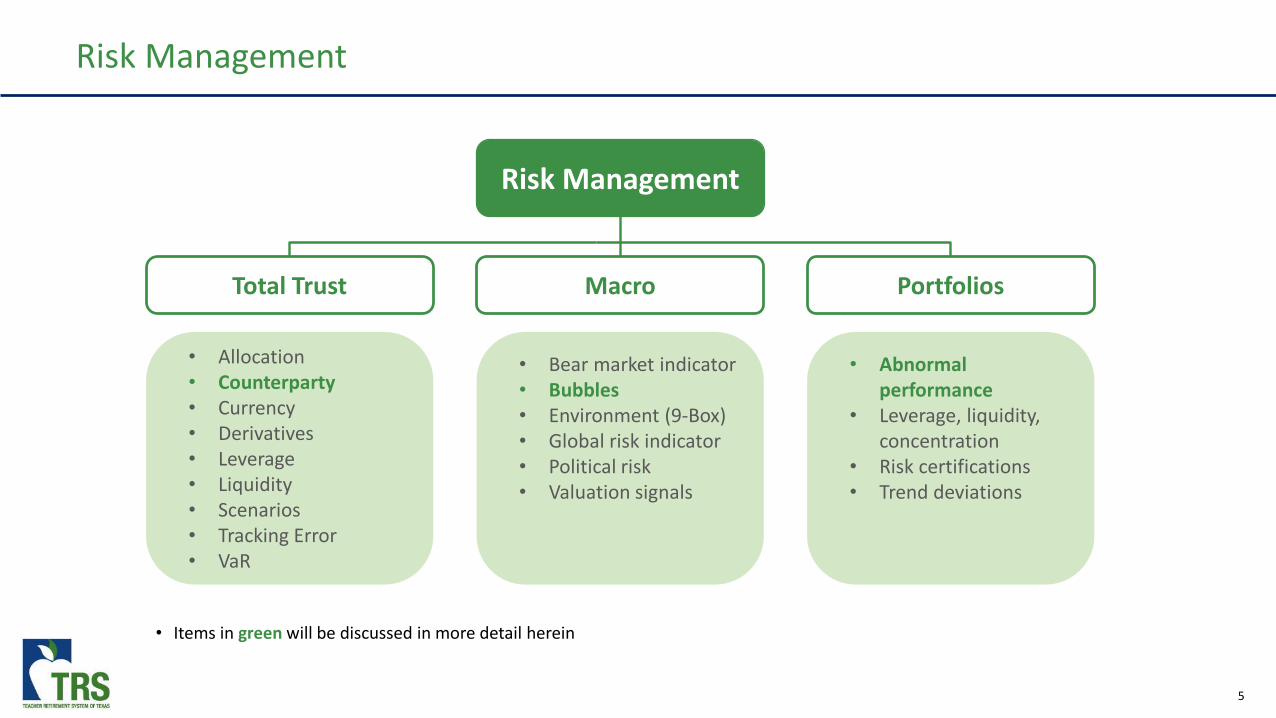
Risk Management
Risk Management
MacroTotal Trust Portfolios
• Bear market indicator• Bubbles• Environment (9-Box)• Global risk indicator• Political risk• Valuation signals
• Abnormal performance
• Leverage, liquidity, concentration
• Risk certifications• Trend deviations
• Items in green will be discussed in more detail herein

6
Identify, Prepare, Act
• Counterparty Risk
• Reduce trade duration• Limit types of trades• Cease trading• Move trades
• Diversify exposures• Multiple counterparties• Daily margin• Internal and policy credit limits
Risk Management
Total Trust PortfoliosMacro
Identify
Prepare
Act

7
Counterparty RiskIdentify, Prepare, Act
• Metrics we follow:1. CDS Spreads2. Capital Ratio3. Common Ratio
Risk Management
MacroTotal Trust Portfolios
4. Equity Returns5. Ratings / Changes6. Rating Outlook
3
3
1 2
1 2
3
3
2 1
1 2
2 1
3
1 2
3
3
1 2
0 10 31 1 0
TD
UBS
Tot.
DB
GS
JPM
Mac
MS
SG
CS
Credit Ratings
AAA
AA A BBB
BB
BoA
Bar
BNP
CIBC
CitCounterparty Rating Trend
Source: TRS IMD, Bloomberg
0
2
4
6
8
10
12
Oct-14 Apr-15 Oct-15 Apr-16 Oct-16 Apr-17 Oct-17
Upgrades Downgrades Net
8
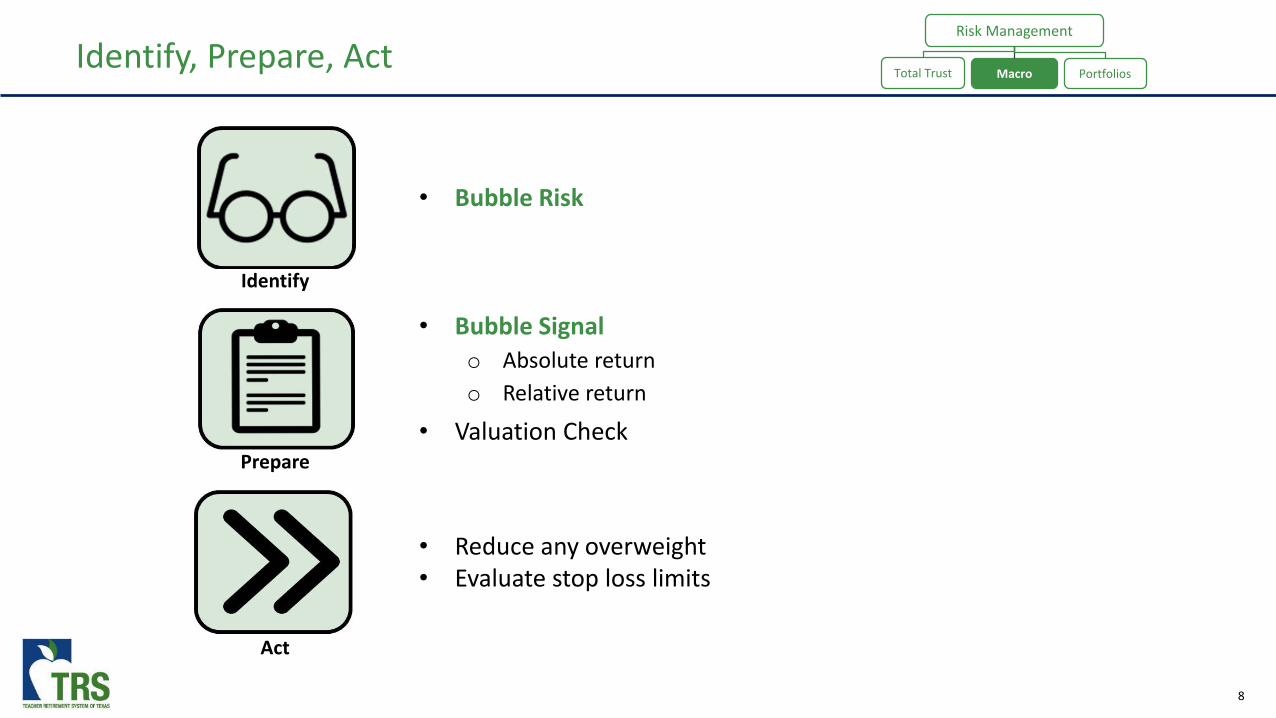
Identify, Prepare, Act
• Bubble Risk
• Reduce any overweight• Evaluate stop loss limits
• Bubble Signalo Absolute returno Relative return
• Valuation Check
Risk Management
Total Trust PortfoliosMacro
Identify
Prepare
Act

9
Bubble RiskIdentify, Prepare, Act
• No bubble signals as of September 2017o We track over one hundred assets across five different asset classeso Currently in the longest time period without a bubble signalo This is consistent with an expansion cycle that has been longer than most cycles
Risk Management
Total Trust PortfoliosMacro
Monthly bubble signals by asset class
-
2
4
6
8
10
12
14
02 03 04 05 06 07 08 09 10 11 12 13 14 15 16 17
Num
ber o
f Sig
nals
Equities Fixed Income Commodities Currencies Alternatives
Source: TRS IMD

10
Bubble RiskIdentify, Prepare, Act
Criteria: Over the past 7 years:
1. Has asset value doubled from a low?
2. How different is current price from the asset’s average price?
3. Are the asset returns similar or different from a basket of asset returns?
Risk Management
Total Trust PortfoliosMacro
Has asset doubled?
How different is current price?
0%
50%
100%
150%
200%
S&P EAFE+C EM DIR. HF PVT EQ. TRSRY SV HF H. YLD TIPS ENRI R. ASSETS COMDTY
7 Yr
. Ret
urn
% Increase from Trough (Past 7 Yrs) Criteria #1: Has Asset Doubled?
-3
-2
-1
0
1
2
3
S&P EAFE+C EM DIR. HF PVT EQ. TRSRY SV HF H. YLD TIPS ENRI R. ASSETS COMDTY
Std.
Dev
iatio
n# Standard Deviations from Average (Past 7 Yrs) Criteria #2: 2.75 Std Dev from Avg
Source: TRS IMDNote: criteria #1 and #2 are considered super criteria and both criteria must be met to generate a bubble signal. Criteria #3 only impacts the magnitude of the signal

11
Identify, Prepare, Act
• Abnormal performance
• Mandatory re-underwriting• Buy or sell rating
• Manager limits• Trend deviation signal• CUSUM (Cumulative sum of Information Ratio)
Risk Management
Total Trust PortfoliosMacro
Identify
Prepare
Act

12
$
$
• CUSUM: Systematic sampling process to determine if our public market portfolios are producing the desired alphao Objective is to quickly detect any errors in the processo CUSUM signal triggers a mandatory re-underwriting of the investment
CUSUMIdentify, Prepare, Act
Normal Variation
Abnormal Variation
$ $$ $ $ $ $
$ $$ $ $ $ $
Risk Management
Total Trust PortfoliosMacro

13
CUSUMIdentify, Prepare, Act
• Since 2010, we have evaluated 115 CUSUM signalso “Buy” recommendation 80% of the time o CUSUM decisions have a hit rate of 57%
• In total, this process has produced an incremental $530 million in alpha since inception
Risk Management
Total Trust PortfoliosMacro
-$300
$0
$300
$600
$900
$1,200
Jan-10 Jan-11 Jan-12 Jan-13 Jan-14 Jan-15 Jan-16 Jan-17
$ m
illio
ns
$ Impact of CUSUM Process
Source: TRS IMD, CUSUM dollar impact based on 3-year performance following CUSUM signal. Signals with less than 12 months of data are excluded from analysis

14
Risk Strategies
Risk Strategies
Risk Parity Low Volatility
Tilts
Dynamic FX Reinsurance

15
Risk Strategies Overview
Investing in a diversified portfolio that uses leverage to target a desired risk level
• Items in blue will be discussed in more detail herein
Tilts
Generating equity-like returns with less market risk (beta) by capitalizing on behavioral biases
Hedging unwanted currency exposure to generate risk budget that can be used elsewhere
Reinsurance Adding a non-correlated return stream to further diversify the Trust
Portfolio: Enable efficient risk usage by....
Low Vol
Risk Parity
Dynamic FX
Adjusting Risk Parity positions based on market conditions

16
• One-year and three-year returns of 9.1% and 6.1%• One-year and three-year alpha of +49 bp and +140 bp• Three-year return of $1.3 billion and three-year alpha of $181 million
Risk Strategies PerformanceAs of September 30, 2017
Risk Strategies
PortfolioTotal Assets Returns (%) Alpha (bp)
$, millions % Trust 1-Year 3-Year 1-Year 3-Year
Risk Parity $7,301 5.0% 8.5% 4.9% +97 +98
Low Volatility 2,020 1.4% 19.3% 15.9% +13 +456
Reinsurance 300 0.2% -7.5% 4.9% -1167 +312
Dynamic Currency 1 0 0.0% 0.1% -0.3% +11 -29
Total $9,620 6.6% 9.1% 6.1% +49 +140
Source: State Street Bank; currency return equals contribution to Risk Group performance1 Dynamic Currency hedging portfolio was launched in February 2015
17
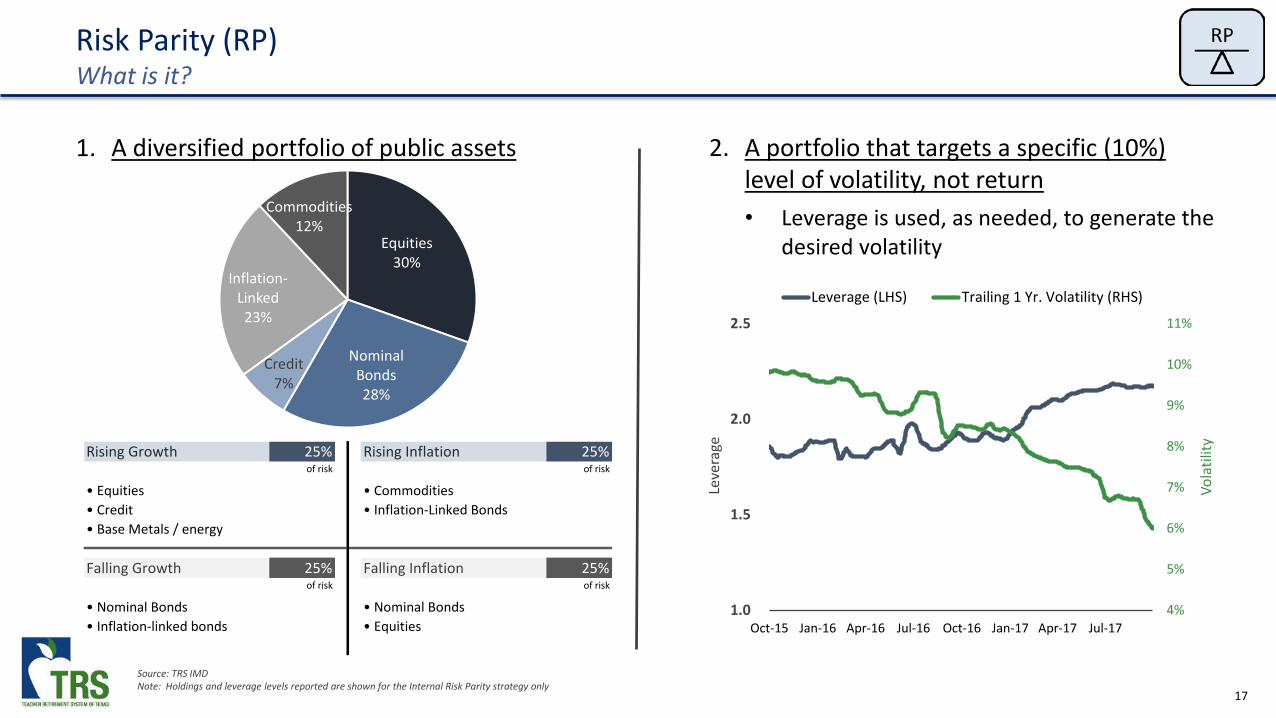
Risk Parity (RP)What is it?
1. A diversified portfolio of public assets 2. A portfolio that targets a specific (10%) level of volatility, not return• Leverage is used, as needed, to generate the
desired volatility
Rising Growth 25% Rising Inflation 25%of risk of risk
• Equities • Commodities• Credit • Inflation-Linked Bonds• Base Metals / energy
Falling Growth 25% Falling Inflation 25%of risk of risk
• Nominal Bonds • Nominal Bonds• Inflation-linked bonds • Equities
4%
5%
6%
7%
8%
9%
10%
11%
1.0
1.5
2.0
2.5
Oct-15 Jan-16 Apr-16 Jul-16 Oct-16 Jan-17 Apr-17 Jul-17
Vola
tility
Leve
rage
Leverage (LHS) Trailing 1 Yr. Volatility (RHS)
Equities30%
Nominal Bonds28%
Credit7%
Inflation-Linked23%
Commodities12%
Source: TRS IMDNote: Holdings and leverage levels reported are shown for the Internal Risk Parity strategy only

18
Equities58%
Bonds4%
IL12%
Commod.21%
Credit5%Equities
97%
Bonds3%
RP60/40
'08 '09 '10 '11 '12 '13 '14 '15 '16 '17 10 Yr. Avg
RP
Treasury RP RP TIP RP Credit Treasury Credit Credit Global Eq. RP
TIPS Global Eq. TIPS Treasury TIPS Global
Eq. RP Treasury RP Credit TIPS
RP TIPS Credit RP Credit RP TIPS Global Eq. TIPS RP Credit
Credit Comdty Comdty Global Eq.
Global Eq. Comdty Global
Eq. TIPS Comdty Treasury Treasury
Comdty Credit Treasury Credit Treasury Treasury Credit RP Global Eq. TIPS Global
Eq.
Global Eq. Treasury Global
Eq. Comdty Comdty TIPS Comdty Comdty Treasury Comdty Comdty
Risk Parity (RP)Why do we like it?
1. Diversifying to Trust
2. Diversified exposures within the portfolio
3. Balance through time
3.5%
5.0%
0% 1% 2% 3% 4% 5% 6%
Risk Contribution
$ Allocation
• Rank of Return/Risk ratio by asset shown below
Source: TRS IMD; State Street ; Bloomberg
• Past 10 year portfolio risk contributions:

19
Risk Parity (RP)How does it efficiently use risk?
1. Diversification enables higher returns for the same level of volatility
2. Further efficiencies achieved by implementing half of the portfolio internally• Estimated annual fee savings of $12 million (at current size)• Internal Risk Parity has outperformed the Risk Parity benchmark by +340 bp on a three-year basis
retuning an incremental $142 million in returns
-40%
-20%
0%
20%
40%
60%
80%
100%
Sep-07 Sep-08 Sep-09 Sep-10 Sep-11 Sep-12 Sep-13 Sep-14 Sep-15 Sep-16 Sep-17
Cum
ulat
ive
Retu
rn
Risk Parity (10 Vol.) 60/40 (10 Vol.)
Source: TRS IMD, Bloomberg (HFR Risk Parity 10 Vol Benchmark used for Risk Parity; ACWI and US Aggregate indices used for 60/40 portfolio); fee savings calculated using estimated management fee of 35 bp

20
Low Volatility (LV)What is it?
1. A portfolio of low volatility stocks...• Research shows that low
volatility stocks tend to outperform due to leverage aversion and behavioral biases
2. That provides defensive factor exposure• Defensive exposure is
diversifying to the total Global Equity portfolio

21
Low Volatility (LV)Why do we like it?
0.86
0.92
0.88
0 1
USA
EAFE+C
EM
Realized Beta
1. Defensive Beta 2. Diversifying Alpha
-0.2
-0.5
-0.1
-1.0-0.50.00.51.0
USA
EAFE+C
EM
Correlation to Total Public Equity Alpha
Source: TRS IMD, Beta and correlation shown since funding
More Diversifying Alpha(low correlations are more diversifying)

22
Low Volatility (LV)How does it efficiently use risk?
1. Defensive beta plus diversifying alpha produces benchmark or better returns at lower risk
2. Further efficiencies achieved by implementing the portfolio internally• Estimated annual fee savings of $10 million (at current size)• Low Volatility has outperformed the benchmark by +456 bp on a three-year annualized basis retuning an
incremental $52 million in returns
0%
20%
40%
60%
80%
100%
120%
140%
Dec-12 Jun-13 Dec-13 Jun-14 Dec-14 Jun-15 Dec-15 Jun-16 Dec-16 Jun-17
Cum
ulat
ive
Retu
rn
Total LowVol Benchmark
Source: TRS IMDNote: Fee savings calculated using an estimated management fee of 50 bp

23
Risk GroupAccomplishments and Priorities
2017 Accomplishments
• Executed our mandate to enable efficient risk usage
• Produced positive alpha over both a 1 year (+49 bp) and 3 year (+140 bp) basis
• Delivered on key priorities which include:1. Contributed to development of Global Equity
Best Practices2. Launched Risk Parity Tilts portfolio3. Supported Real Assets currency hedging4. Created a new internal risk event report 5. Expanded Low Volatility portfolio
2018 Priorities (Preliminary)
• Continue to execute mandate to enable efficient risk usage
• Further apply “Identify, Prepare, Act” process across key risks
• Enhance Tilts portfolio
• Rebalance Risk Parity portfolio
• Develop additional Risk Strategies to support Trust performance through the business cycle
• Support update of 2018 Investment Policy Statement (IPS)
Note: Sample internal risk event report in appendix

24
Risk Group Key Points
1. Efficient risk usage = Risk Management + Risk Strategies
2. “Identify, Prepare, Act” is the process we employ to manage risk
3. Risk Strategies generated strong performance

APPENDIX

26
ReinsurancePortfolio Overview
Size: $0.3 billion
Start Date: October 2013
Team: Risk, Hedge Funds
Benchmark: HFRI Fund of Funds Conservative
Objective: Capture premium of providing capital to insurance companies. Provide diversified returns to TRS
Update: Portfolio was negatively impacted by Hurricanes Harvey, Irma, and Maria along with California wildfires• Losses were in-line with expectations given
events• We do see some improved opportunity for 2018
which we are evaluating• Since inception returns of 7.9%
TRS Portfolio Impact: Historical / Simulated Events
Andrew 1:100 QuakeKatrina 1:100 HurricaneWTC - 9/11 1:250 Quake1906 SF Quake 1:250 Hurricane
Rtn.
-17.1% -53.4%
Rtn.-9.2% -23.4%
-5.1% -36.3%-37.8% -66.7%
Cumulative Performance:
RE
0%
10%
20%
30%
40%
50%
Dec-13 Jun-14 Dec-14 Jun-15 Dec-15 Jun-16 Dec-16 Jun-17
TRS Re Benchmark
Source: TRS IMD, Bloomberg, State Street

27
This slide was intentionally left blank.

28
Risk Signals
• Signals highlight key metrics for further evaluation• Generate 174 signals on average each month
Example: • Metric: US Economic Surprise• Ticker: CESIUSD• Threshold: Down, -50
-
100
200
300
400
500
600
Aug-15 Nov-15 Feb-16 May-16 Aug-16 Nov-16 Feb-17 May-17 Aug-17
Liquidity Leverage Relative Weight Market Return
Counterparty Exposure Economic Market Signal Credit Ratings
0
0.1
0.2
0.3
0.4
0.5
0.6
0.7
0.8
0.9
1
-100
-80
-60
-40
-20
0
20
40
60
80
Dec-14 Jun-15 Dec-15 Jun-16 Dec-16 Jun-17
Signal US Econ. Surp Threshold
Source: TRS IMD