investment community update: 33% dividend increase .../media/enb/documents/investor relations... ·...
TRANSCRIPT

Investment Community Update: 33% Dividend Increase Financial Restructuring Plan Revised Dividend Policy 2015 Earnings Guidance President & CEO
Wanda Opheim Senior Vice President Finance
December 4, 2014
Al Monaco
Richard Bird Executive Vice President Corporate Development

Legal Notice This presentation includes certain forward looking information (FLI) to provide Enbridge shareholders and potential investors with information about Enbridge and management’s assessment of its future plans and operations, which may not be appropriate for other purposes. FLI is typically identified by words such as “anticipate”, “expect”, “project”, “estimate”, “forecast”, “plan”, “intend”, “target”, “believe” and similar words suggesting future outcomes or statements regarding an outlook. All statements other than statements of historical fact may be forward-looking statements. In particular, this Presentation may contain forward-looking statements pertaining to the following: expectations regarding the restructuring, revised dividend payout policy and earnings per share guidance, including the negotiation of definitive terms, satisfaction of conditions and the obtaining of consents and approvals required to complete the restructuring; effect, results and perceived benefits of the restructuring; expected timing and completion of the restructuring and revised dividend payout policy; impact of the restructuring, revised dividend payout policy and adjusted earnings guidance on the Company’s future cash flows and capital project funding; impact of the restructuring and revised dividend payout policy on the Company’s credit ratings; and future equity and debt offerings and proposed financing of the restructuring.
Although we believe that our FLI is reasonable based on the information available today and processes used to prepare it, such statements are not guarantees of future performance and you are cautioned against placing undue reliance on FLI. By its nature, FLI involves a variety of assumptions, risks, uncertainties and other factors which may cause actual results, levels of activity and achievements to differ materially from those expressed or implied in our FLI. Material assumptions include assumptions about: expected timing and terms of the restructuring; anticipated completion of the restructuring; adoption of the revised dividend policy; receipt of regulatory, shareholder and third party consents and approvals with respect to the restructuring; impact of the restructuring and revised dividend policy on the Company’s future cash flows and capital project funding; impact of the restructuring and revised dividend policy on the Company’s credit ratings; expected earnings/(loss) or adjusted earnings/(loss); expected earnings/(loss) or adjusted earnings/(loss) per share; expected future cash flows; estimated future dividends; debt and equity market conditions; expected supply and demand for crude oil, natural gas and natural gas liquids; prices of crude oil, natural gas and natural gas liquids; expected exchange rates; inflation; interest rates; availability and price of labour and pipeline construction materials; operational reliability; anticipated in-service dates and weather. Due to the interdependencies and correlation of these macroeconomic factors, the impact of any one assumption on FLI cannot be determined with certainty, particularly with respect to expected earnings and associated per unit or per share amounts, or estimated future distributions or dividends.
Our FLI is subject to risks and uncertainties pertaining to the restructuring, revised dividend policy, adjusted earnings guidance, operating performance, regulatory parameters, weather, economic conditions, exchange rates, interest rates and commodity prices, including but not limited to those discussed more extensively in our filings with Canadian and US securities regulators. The impact of any one risk, uncertainty or factor on any particular FLI is not determinable with certainty as these are interdependent and our future course of action depends on management’s assessment of all information available at the relevant time. Except to the extent required by law, we assume no obligation to publicly update or revise any FLI, whether as a result of new information, future events or otherwise. All FLI in this presentation is expressly qualified in its entirety by these cautionary statements.
You should be cautioned that there is no assurance that the planned restructuring will be completed in the manner contemplated, or at all, or that the current market conditions and Enbridge’s assumptions and forecasts based on such market conditions will not materially change.
This presentation will make reference to non-GAAP measures including adjusted earnings, adjusted funds from operations and free cash flow, together with respective per share amounts. These measures are not measures that have a standardized meaning prescribed by U.S. GAAP and may not be comparable with similar measures presented by other issuers. Additional information on the Company’s use of non-GAAP measures can be found in Management’s Discussion and Analysis available on the Company’s website and www.SEDAR.com.
2

Outline
• 2015 EPS Guidance
• Context and Overview
• Canadian Restructuring and Drop Down Plan
• Revised Dividend Payout Policy
• Funding Update and Guidance Components
• Conclusion
3

Industry Leading Adjusted EPS* Growth
2015 Adjusted EPS* Guidance Range $2.05 to $2.35 (excluding partial year effect of drop down accretion)
*Adjusted earnings is a non-GAAP measure. For more information on non-GAAP measures please refer to disclosure in MD&A.
$1.78 $1.84 $2.05
2013 2014e 2015e
$2.04
$2.35
4

Strategic Context
• Record growth capital plan of $44 billion drives exceptional EPS & DPS growth through 2018 and beyond
• Growth capital plan progressing well - Major Projects execution - Securing low cost funding
• Sponsored vehicles increasingly well positioned to contribute to ENB value
• Increasing focus on rebalancing asset mix post Liquids Pipelines build out
Enbridge Day 2014 5

Record, Visible Organic Growth
Enbridge Day 20122012-2016
Enbridge Day 20132013 - 2017
Current2014 - 2018
Secured Unsecured
$18
$26
$33 $17 $10
$11 $35 $36
$44
* Enterprise wide program, includes EEP and ENF 6
$Billions
$44 billion organic growth capital program, 75% secured, drives 10% - 12% EPS growth through 2018

Dependable Organic Growth
7
Reliable business model and financial risk management provide highly dependable organic growth
• Reliable Low Risk Business Model - Conservative commercial
structures - Major projects execution - Prudent financial management - Disciplined investment process
EPS Guidance Adjusted EPS*
$0.60
$0.80
$1.00
$1.20
$1.40
$1.60
$1.80
$2.00
2008 2009 2010 2011 2012 2013 2014E
DPS
Growing Predictable EPS/DPS
*Adjusted earnings are non-GAAP measures. For more information on non-GAAP measures please refer to disclosure in MD&A.

8
• Legacy Assets •
ENB
EIF Canadian LP assets
Revised Payout Policy
70%
60%
85%
75%
Accelerate DPS/EPS growth
Enhance funding cost competitiveness
Transform EIF/EIFH to high growth vehicle
Reinforce growth beyond 2018
Value
ENB EIFH
Financial Structure/Strategy Optimization Overview

Drop Down Plan Overview
9
Large scale drop down to EIF enhances shareholder value for both ENB and EIFH
Assets Canadian Liquids Pipelines & Renewable Energy
Book Value ~$17 billion Secured Growth Capital ~$15 billion EBITDA Multiple 13x – 15x Enbridge Incentive Share 25%
Accretive to ENB Accretive to EIFH ENB Economic Interest in EIF (post transaction) 90%
Estimated Closing Mid 2015

Existing Structure (Simplified)
10
• Legacy Assets
Enbridge Inc.
EIF
EIFH
EPI EPA EGD GP&P
• Canadian Mainline • Renewable
Energy • EEP
• Regional Oil Sands System
U.S. LP
19.9% 80.1%
Public
42% 58%

New Structure (Simplified) - 2015
11
Enbridge Inc.
EIF
EIFH
EEP EGD GP&P U.S. LP
19.9% 80.1%
Public
12% 88%
EPI EPA

Asset description Six adjacent pipelines originating in western Canada that deliver into the US system Lines 8, 9 and 10 that deliver into eastern Canada Residual interest in Southern Lights diluent line
Total assets $10 billion
2013 adjusted earnings $460 million
Secured growth capital $9 billion
Canadian Liquids Pipelines Assets – Mainline
12

Asset description
Total assets $6 billion
2013 adjusted earnings $170 million
Secured growth capital $6 billion
Canadian Liquids Pipelines Assets – Regional
13
Wood Buffalo Pipeline Waupisoo Pipeline Athabasca Pipeline Woodland Pipeline Norealis Pipeline Athabasca Twin Pipeline Woodland Pipeline Extension Wood Buffalo Extension Norlite Diluent Pipeline Other

Renewable Assets
14
Asset description • Blackspring Ridge: 50% ownership in 300 MW • Lac Alfred: 67.5% ownership in 308 MW • Massif du Sud: 80% ownership in 153 MW • St. Robert Bellarmin: 50% ownership in 82 MW
Total assets $1 billion

0%
20%
40%
60%
80%
100%
2013 2014 2015 2018
Expected EIF Equity Funding and Ownership
15
EIF
EIFH
67%
~90%
~80%
66%
ENB Economic Interest in EIF Equity Funding ($millions annually)
Public
$600 - $800
$750 - $1,000
$150 - $200
ENB
~$1,500 (2016 – 2018)

EIFH Expected DPS Growth
16 2015 2018e
• Currently 1% annual growth, supplemented with ad hoc drop downs
• Expect approximately 10% 2015 – 2018 CAGR - Sequential investments in EIF - Participation in Canadian LP asset cash flow growth
$1.57

2015e 2015Pro Forma
(Annualized)
2018e
ENB Expected EPS Accretion
*Adjusted earnings are non-GAAP measures. For more information on non-GAAP measures please refer to disclosure in MD&A. 17
Drop down plan expected to contribute an approximate 10% uplift in EPS for each full year from closing to 2018
Adjusted EPS*
Expected Drop Down
Uplift
+10%
$2.05
$2.35

Post Drop Down Opportunity Development
Opportunity Type Equity Funding Vehicle U.S. Midstream MEP/EEP
U.S. Liquids Pipelines EEP/ENB Canadian Liquids Pipelines Canadian Renewable Energy
Gas Pipelines – Alliance EIFH/ENB
Gas Pipelines Canadian Midstream Gas Distribution Power Generation & Transmission International Energy Services
ENB
18

Drop Down Benefits to ENB Shareholders
• Accretion from drop down supports higher ENB EPS and DPS growth through 2018
• Advantageous supplementary source of equity funding supports ENB funding requirements and higher dividend payout
• Well positioned in 2018 for longer term growth and diversification
- ample access to funding at a competitive cost - reinforcing contribution from tilted returns and accelerating
free cash flow
19

Dividend Payout Considerations
1. Record organic growth capital program
2. Rising internal free cash flow
3. Progress in 2014 on equity prefunding
4. Robustness of equity funding options (sponsored investments)
2014-2018 Equity Requirement Gross $6.2 billion DRIP (2.8) Net 3.4 Complete (1.5) Remaining $1.9 billion
20

0%
20%
40%
60%
80%
100%
Prior Revised Prior Revised
Revised Payout Policy
*Adjusted earnings is a non-GAAP measure. For more information on non-GAAP measures please refer to disclosure in MD&A.
70%
60% 60%
70%
Adjusted EPS* Payout
2015 2018
21

0%
20%
40%
60%
80%
100%
Prior Revised Prior Revised
Revised Payout Policy
*Adjusted earnings is a non-GAAP measure. For more information on non-GAAP measures please refer to disclosure in MD&A.
70%
60%
85%
60%
70%
85%
75%
Adjusted EPS* Payout
2015 2018
21b
75%

Expected DPS Growth – Drop Down and Revised Payout Policy
22
2013 2014 2015 2018e
Dividends Per Share
$1.26 $1.40
$1.86
33% DPS increase in 2015, 14% - 16% CAGR from 2015 to 2018

Maintenance & Integrity Capital 5.0 5.2
Secured Growth Capital 23.3 23.4
Risked Growth Capital 9.0 9.2
37.3 37.8
Cash Flow Net of Dividends (15.4) (13.7)
Net Funding Requirement* 21.9 24.1
Total Requirement 15.7 15.7 2014 – 2018 Maturities 6.6 6.6
Cash on Hand (0.5) (0.5)
Requirement, Net of Cash 21.8 21.8
2014 Preferred Share Issuances (0.7) (0.7)
2014 EIFH Drop Down Debt (0.6) (0.6)
Debt Already Issued (5.5) (5.5)
Debt Requirement 15.0 15.0
Revised Proforma Funding Plan (2014-2018)
Debt Equity Total Requirement 6.2 8.4 DRIP/ESOP (2.8) (2.4)
Requirement, Net of DRIP 3.4 6.0
2014 EIFH Drop Down Equity (0.3) (0.3)
2014 Common Share Issuances (0.5) (0.5)
2014 Preferred Share Issuances (0.7) (0.7)
2015 – 2018 EIFH Drop Down Equity (3.0)
Equity Requirement 1.9 1.5
$ Billions
Financing requirements remain very manageable
23
Base Revised
Base Revised
Base Revised
* Base excludes ALL sponsored investments ** Revised Includes EIF but excludes EEP and MEP

2014 Guidance Range
2014 Adjusted EPS* Guidance Outlook
24
Headwinds Energy Services Equity prefunding
Tailwinds Liquids Pipelines
- Line 9B delay
*Adjusted earnings is a non-GAAP measure. For more information on non-GAAP measures please refer to disclosure in MD&A..
$1.84
$2.04
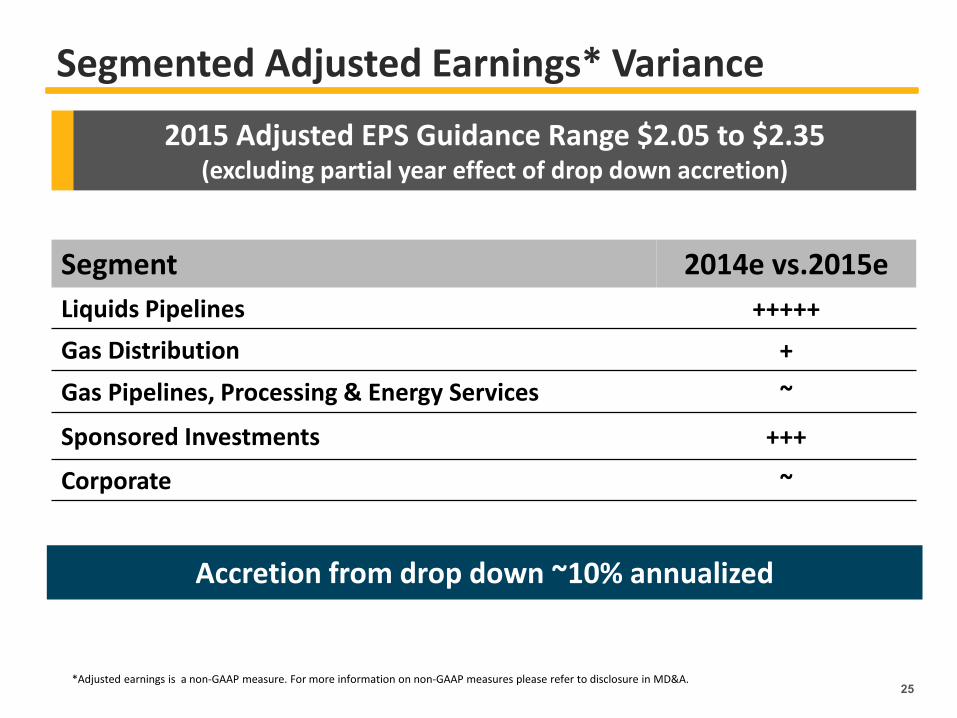
Segmented Adjusted Earnings* Variance
Segment 2014e vs.2015e Liquids Pipelines +++++ Gas Distribution + Gas Pipelines, Processing & Energy Services ~
Sponsored Investments +++
Corporate ~
*Adjusted earnings is a non-GAAP measure. For more information on non-GAAP measures please refer to disclosure in MD&A.
2015 Adjusted EPS Guidance Range $2.05 to $2.35 (excluding partial year effect of drop down accretion)
25
Accretion from drop down ~10% annualized

26
Projects Estimated Cost ($ Billion)
Liquids Pipelines (Alberta Regional Infrastructure): AOC Hangingstone $0.2 Sunday Creek Terminal Expansion $0.2 Woodland Pipeline Expansion $0.6
Liquids Pipelines (Market Access Initiatives): Western USGC Access:
Associated Mainline Expansions
$0.7 Light Oil Market Access:
Southern Access Extension Chicago Connectivity Associated Mainline Expansions
$0.6 $0.5 $1.9
Edmonton to Hardisty Expansion $1.8 Gas Pipelines:
Beckville Cryogenic Processing Facility $0.1 Walker Ridge Gas Gathering $0.4 Big Foot Oil Pipeline $0.2
Gas Distribution: Greater Toronto Area Project $0.7 Other EGD Growth Capital $0.2
Green Power: Keechi Creek Wind Project $0.2
$8.3 Billion in-service in 2015
2015 Capital In-service

2015 Capital* – By In-Service Date
2017
2016
2015
2014
$44
* Enterprise wide program, includes EEP and ENF
2015
201
5
Projects in service in 2015
Q1 Keechi Wind ($0.2B) Beckville Cryogenic ($0.1B) Walker Ridge ($0.4B)
Q2 Cdn Mainline System Flexibility & Connectivity ($0.7B) Edmonton to Hardisty ($1.8B)
Q3
Mainline Expansions ($2.4B) Woodland Pipeline Extension ($0.6B) Sunday Creek Terminal ($0.2B) Big Foot Oil ($0.2B)
Q4
AOC Hangingstone ($0.2B) GTA Project ($0.7B) Southern Access Extension ($0.6B) EGD Growth Capital ($0.2B)
By in service date
$ Billions
27
$1.7
$3.4
$2.5
$0.7
Q4
Q3
Q2
Q1

2013 2018e
Expected Adjusted EPS* Growth
*Adjusted earnings are non-GAAP measures. For more information on non-GAAP measures please refer to disclosure in MD&A.
• Drop down accretion adds ~10% to EPS from 2015 through 2018 - Highly transparent outlook
• Extending EIFH funding beyond 2018 reinforces other sources of post 2018 growth
28
• Liquids Pipelines • $44 billion growth program
• Drop down accretion
• Tilted Return Projects • Natural Gas • New Growth Platforms • Liquids Pipelines
•Extended EIFH Funding / Enhanced Competitiveness

2013 2015 2018e
Expected DPS Growth
• Enhanced EPS growth • Surplus cash flow • Extended EIFH Funding
Enhanced Competitiveness
29
• Drop down accretion and revised payout policy provide 33% increase in 2015, 14%-16% expected growth for 2015 through 2018
• Extended EIFH funding beyond 2018 reinforces other sources of post 2018 growth
$1.86
$1.26

Summary of Benefits
• Enhanced EPS and DPS growth through 2018
• Enhanced/diversified access to equity funding for $44 billion
organic growth capital program
• Enhanced competitiveness in securing new organic and asset
acquisition investment opportunities
• Reinforces 2018 positioning to supplement tilted return growth
with new investment in natural gas, new growth platforms and
liquids pipelines
30

Question & Answer Period
BUSINESS UNIT HEADER IMAGE GOES HERE