investment choices performance report - nationwide … · investment choices performance report...
TRANSCRIPT

Investment choices performance reportApril 30, 2018
Nationwide DestinationSM Navigator 2.0
Invest in your future
Answers to frequently asked questions.What you should know about purchasing a variable annuity
What is a variable annuity?
A variable annuity is an insurance contract designed to
help you create a fixed or variable stream of retirement
income through a process called annuitization. With a
variable annuity, you can invest in one product with
multiple underlying investment options and direct money
into subaccounts based on how much risk you’re willing
to take.
Variable annuities are for long-term investing; they’re not
appropriate for short-term financial goals. And variable
annuities have fees and charges that include mortality
and expense fees, administrative fees and contract
maintenance fees. These fees are a percentage of the
investment account value.
What kind of investmentscan I choose from?
Variable annuities offer a wide range of professionally
managed investment options. With choices such as
equity, bond and money market funds, you can create a
portfolio designed to meet your investment goals. Please
keep in mind that because these investment choices are
subject to market fluctuation, investment risk and
possible loss of principal, your annuity’s value will vary
depending on how they perform.
Investment choices within a variable annuity are not
publicly traded mutual funds and are only available for
purchase in variable products. Fees in investment choices
cover the fund manager’s services and the costs of the
underlying investments.
Why should I consider avariable annuity?
Variable annuities offer tax deferral and compounding,
unique features that can help you prepare for retirement.
Investment gains within a variable annuity are tax
deferred, meaning they’re not taxed until you take money
from the annuity. This allows more of your money to
remain invested. And when combined with the power of
compounding, your investment has the potential to
accumulate faster than taxable investments earning the
same rate of return.
When you decide to withdraw money from a variable
annuity, the taxable portion will be subject to ordinary
income tax. If you take your money out early, surrender
charges may apply and, if you take it out before age 59½,
a 10% federal tax penalty may apply.
When would I be able to drawincome from an annuity?
Income from an annuity can be either deferred or
immediate depending on the type of annuity you own
and its features. Keep in mind that the guarantee of
continued payments depends on the claims-paying
ability of the insurance company.
Deferred annuities
Deferred annuities are designed to help you grow your
assets and provide income at a later time. They’re for
long-term goals, like planning for retirement. They can be
purchased through payments over time or with a single
payment.
Immediate annuities
Immediate annuities are designed to start providing
income right away. They’re usually purchased with a
lump-sum payment by people who have already retired
or are close to retirement.
What are the other features?
Some variable annuities offer living features, like
guaranteed accumulation, guaranteed withdrawal
features or principal protection for extra security, at an
additional cost.
Most variable annuities offer a death feature — a
payment made to your beneficiary after your death —
which will be adjusted proportionally for any previous
withdrawals. Other features, known as riders, may be
offered at an additional cost as optional features.
Investment choices performance reportQuality investments, confident choices What matters most to you also matters to us. That’s why our team of investment specialists devotes both time and effort to build a lineup of quality investment options that you can choose from with confidence. We do the homework for you — researching investments, crunching the numbers and looking for options that have demonstrated consistency in style, management and performance over time.
The result is a lineup of investment options from brand-name managers across multiple asset classes. For the investment options that bear the Nationwide Variable Insurance Trust (NVIT) name, we’ve hired many of these managers as subadvisors to bring their strategies and experience to your portfolio. Other investment options are available to you directly from third-party managers.
We brought investors like you greater choice back in 1982 by pioneering the multi-manager approach to variable insurance products. Today, you can benefit from Nationwide’s experience as a “manager of managers” to bring you the investment options that can help you meet your financial goals.
It’s natural to want to know how your investments are doing over timeThis performance report shows how the investment choices within this variable annuity have performed over a series of time periods. These investment choices are not publicly traded mutual funds and are only available for purchase in variable products.
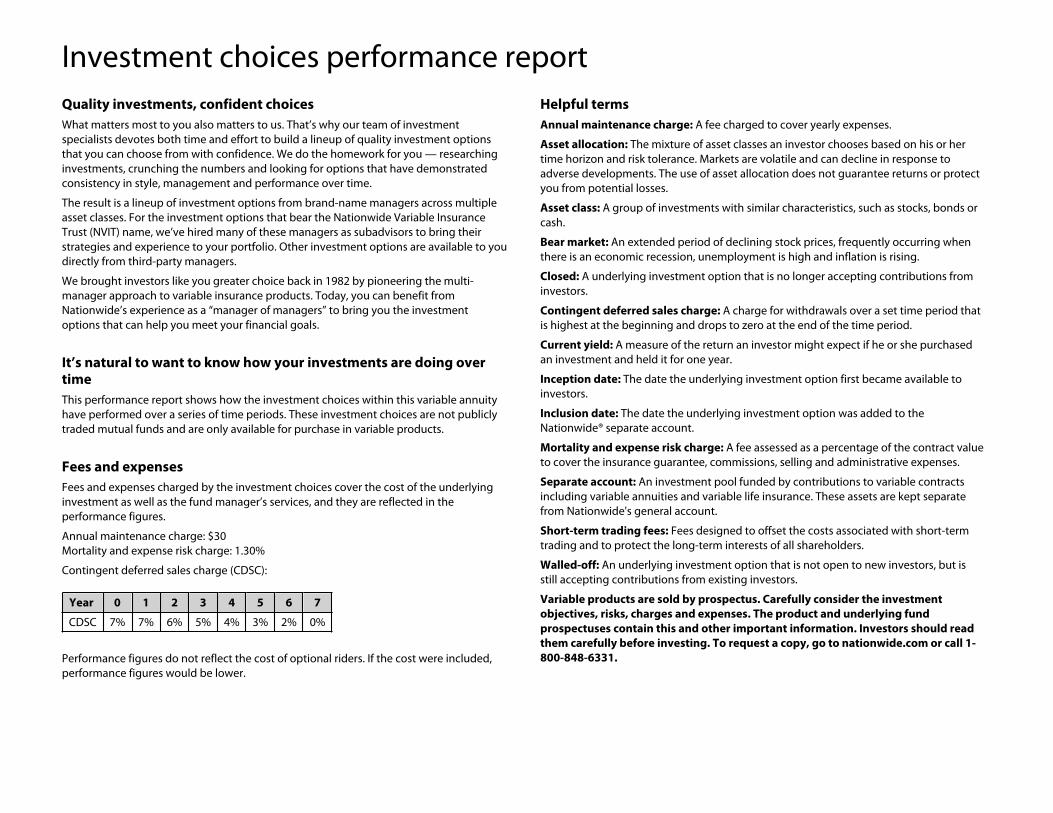
Fees and expensesFees and expenses charged by the investment choices cover the cost of the underlying investment as well as the fund manager’s services, and they are reflected in the performance figures.
Annual maintenance charge: $30Mortality and expense risk charge: 1.30%
Contingent deferred sales charge (CDSC):
Performance figures do not reflect the cost of optional riders. If the cost were included, performance figures would be lower.
Year 0 1 2 3 4 5 6 7
CDSC 7% 7% 6% 5% 4% 3% 2% 0%
Helpful termsAnnual maintenance charge: A fee charged to cover yearly expenses.
Asset allocation: The mixture of asset classes an investor chooses based on his or her time horizon and risk tolerance. Markets are volatile and can decline in response to adverse developments. The use of asset allocation does not guarantee returns or protect you from potential losses.
Asset class: A group of investments with similar characteristics, such as stocks, bonds or cash.
Bear market: An extended period of declining stock prices, frequently occurring when there is an economic recession, unemployment is high and inflation is rising.
Closed: A underlying investment option that is no longer accepting contributions from investors.
Contingent deferred sales charge: A charge for withdrawals over a set time period that is highest at the beginning and drops to zero at the end of the time period.
Current yield: A measure of the return an investor might expect if he or she purchased an investment and held it for one year.
Inception date: The date the underlying investment option first became available to investors.
Inclusion date: The date the underlying investment option was added to the Nationwide® separate account.
Mortality and expense risk charge: A fee assessed as a percentage of the contract value to cover the insurance guarantee, commissions, selling and administrative expenses.
Separate account: An investment pool funded by contributions to variable contracts including variable annuities and variable life insurance. These assets are kept separate from Nationwide's general account.
Short-term trading fees: Fees designed to offset the costs associated with short-term trading and to protect the long-term interests of all shareholders.
Walled-off: An underlying investment option that is not open to new investors, but is still accepting contributions from existing investors.
Variable products are sold by prospectus. Carefully consider the investment objectives, risks, charges and expenses. The product and underlying fund prospectuses contain this and other important information. Investors should read them carefully before investing. To request a copy, go to nationwide.com or call 1-800-848-6331.
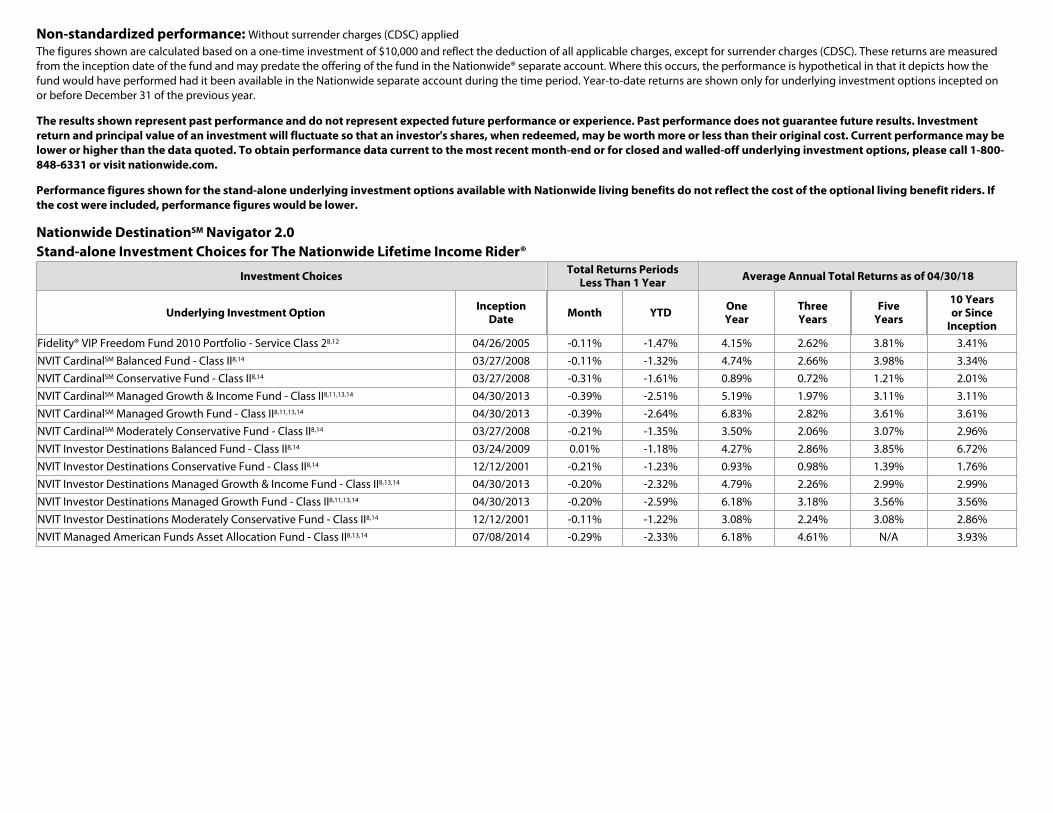
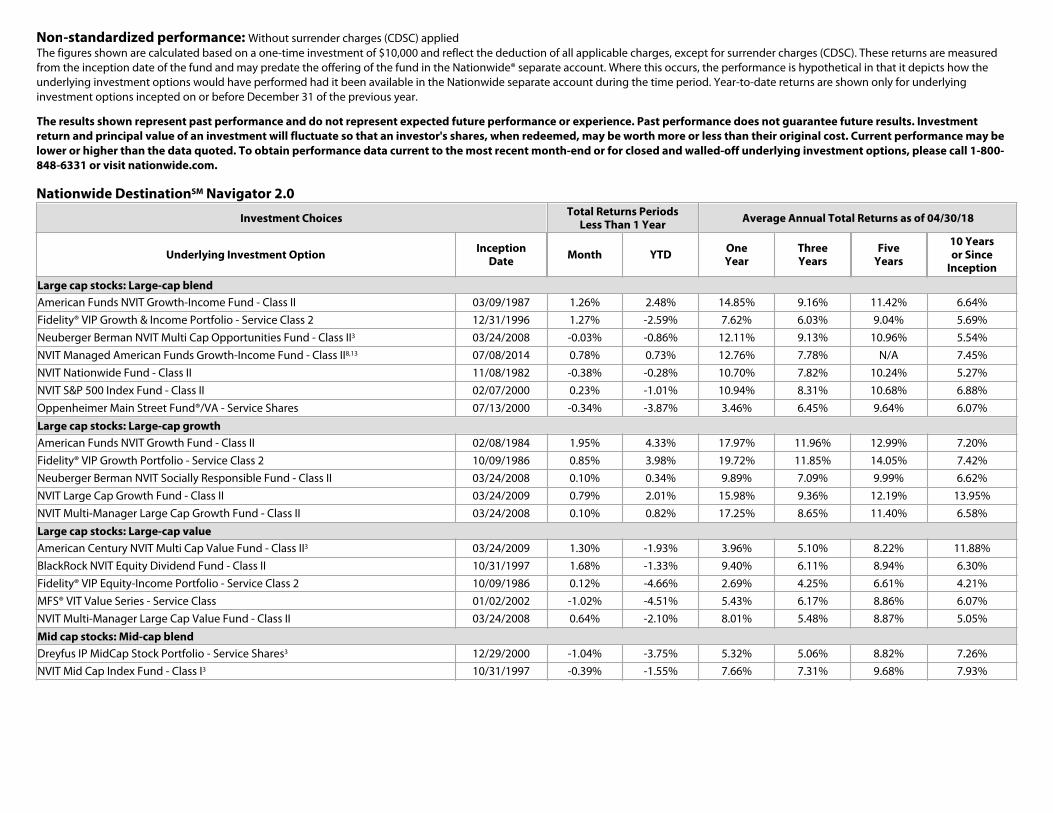
Non-standardized performance: Without surrender charges (CDSC) appliedThe figures shown are calculated based on a one-time investment of $10,000 and reflect the deduction of all applicable charges, except for surrender charges (CDSC). These returns are measured from the inception date of the fund and may predate the offering of the fund in the Nationwide® separate account. Where this occurs, the performance is hypothetical in that it depicts how the fund would have performed had it been available in the Nationwide separate account during the time period. Year-to-date returns are shown only for underlying investment options incepted on or before December 31 of the previous year.
The results shown represent past performance and do not represent expected future performance or experience. Past performance does not guarantee future results. Investment return and principal value of an investment will fluctuate so that an investor's shares, when redeemed, may be worth more or less than their original cost. Current performance may be lower or higher than the data quoted. To obtain performance data current to the most recent month-end or for closed and walled-off underlying investment options, please call 1-800-848-6331 or visit nationwide.com.
Performance figures shown for the stand-alone underlying investment options available with Nationwide living benefits do not reflect the cost of the optional living benefit riders. If the cost were included, performance figures would be lower.
Nationwide DestinationSM Navigator 2.0Stand-alone Investment Choices for The Nationwide Lifetime Income Rider®
Investment ChoicesTotal Returns Periods
Less Than 1 Year Average Annual Total Returns as of 04/30/18
Underlying Investment Option InceptionDate Month YTD One
YearThreeYears
FiveYears
10 Yearsor Since
Inception
Fidelity® VIP Freedom Fund 2010 Portfolio - Service Class 28,12 04/26/2005 -0.11% -1.47% 4.15% 2.62% 3.81% 3.41%
NVIT CardinalSM Balanced Fund - Class II8,14 03/27/2008 -0.11% -1.32% 4.74% 2.66% 3.98% 3.34%
NVIT CardinalSM Conservative Fund - Class II8,14 03/27/2008 -0.31% -1.61% 0.89% 0.72% 1.21% 2.01%
NVIT CardinalSM Managed Growth & Income Fund - Class II8,11,13,14 04/30/2013 -0.39% -2.51% 5.19% 1.97% 3.11% 3.11%
NVIT CardinalSM Managed Growth Fund - Class II8,11,13,14 04/30/2013 -0.39% -2.64% 6.83% 2.82% 3.61% 3.61%
NVIT CardinalSM Moderately Conservative Fund - Class II8,14 03/27/2008 -0.21% -1.35% 3.50% 2.06% 3.07% 2.96%
NVIT Investor Destinations Balanced Fund - Class II8,14 03/24/2009 0.01% -1.18% 4.27% 2.86% 3.85% 6.72%
NVIT Investor Destinations Conservative Fund - Class II8,14 12/12/2001 -0.21% -1.23% 0.93% 0.98% 1.39% 1.76%
NVIT Investor Destinations Managed Growth & Income Fund - Class II8,13,14 04/30/2013 -0.20% -2.32% 4.79% 2.26% 2.99% 2.99%
NVIT Investor Destinations Managed Growth Fund - Class II8,11,13,14 04/30/2013 -0.20% -2.59% 6.18% 3.18% 3.56% 3.56%
NVIT Investor Destinations Moderately Conservative Fund - Class II8,14 12/12/2001 -0.11% -1.22% 3.08% 2.24% 3.08% 2.86%
NVIT Managed American Funds Asset Allocation Fund - Class II8,13,14 07/08/2014 -0.29% -2.33% 6.18% 4.61% N/A 3.93%
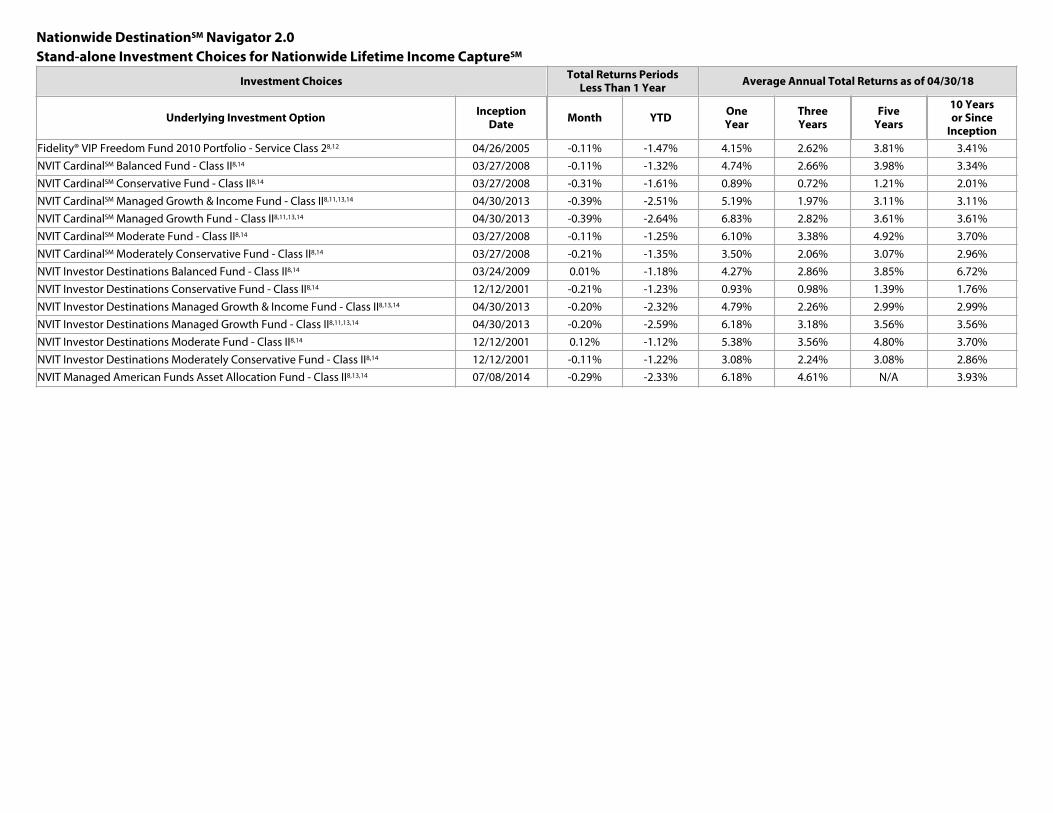
Nationwide DestinationSM Navigator 2.0Stand-alone Investment Choices for Nationwide Lifetime Income CaptureSM
Investment Choices Total Returns PeriodsLess Than 1 Year Average Annual Total Returns as of 04/30/18
Underlying Investment Option InceptionDate Month YTD One
YearThreeYears
FiveYears
10 Yearsor Since
Inception
Fidelity® VIP Freedom Fund 2010 Portfolio - Service Class 28,12 04/26/2005 -0.11% -1.47% 4.15% 2.62% 3.81% 3.41%
NVIT CardinalSM Balanced Fund - Class II8,14 03/27/2008 -0.11% -1.32% 4.74% 2.66% 3.98% 3.34%
NVIT CardinalSM Conservative Fund - Class II8,14 03/27/2008 -0.31% -1.61% 0.89% 0.72% 1.21% 2.01%
NVIT CardinalSM Managed Growth & Income Fund - Class II8,11,13,14 04/30/2013 -0.39% -2.51% 5.19% 1.97% 3.11% 3.11%
NVIT CardinalSM Managed Growth Fund - Class II8,11,13,14 04/30/2013 -0.39% -2.64% 6.83% 2.82% 3.61% 3.61%
NVIT CardinalSM Moderate Fund - Class II8,14 03/27/2008 -0.11% -1.25% 6.10% 3.38% 4.92% 3.70%
NVIT CardinalSM Moderately Conservative Fund - Class II8,14 03/27/2008 -0.21% -1.35% 3.50% 2.06% 3.07% 2.96%
NVIT Investor Destinations Balanced Fund - Class II8,14 03/24/2009 0.01% -1.18% 4.27% 2.86% 3.85% 6.72%
NVIT Investor Destinations Conservative Fund - Class II8,14 12/12/2001 -0.21% -1.23% 0.93% 0.98% 1.39% 1.76%
NVIT Investor Destinations Managed Growth & Income Fund - Class II8,13,14 04/30/2013 -0.20% -2.32% 4.79% 2.26% 2.99% 2.99%
NVIT Investor Destinations Managed Growth Fund - Class II8,11,13,14 04/30/2013 -0.20% -2.59% 6.18% 3.18% 3.56% 3.56%
NVIT Investor Destinations Moderate Fund - Class II8,14 12/12/2001 0.12% -1.12% 5.38% 3.56% 4.80% 3.70%
NVIT Investor Destinations Moderately Conservative Fund - Class II8,14 12/12/2001 -0.11% -1.22% 3.08% 2.24% 3.08% 2.86%
NVIT Managed American Funds Asset Allocation Fund - Class II8,13,14 07/08/2014 -0.29% -2.33% 6.18% 4.61% N/A 3.93%
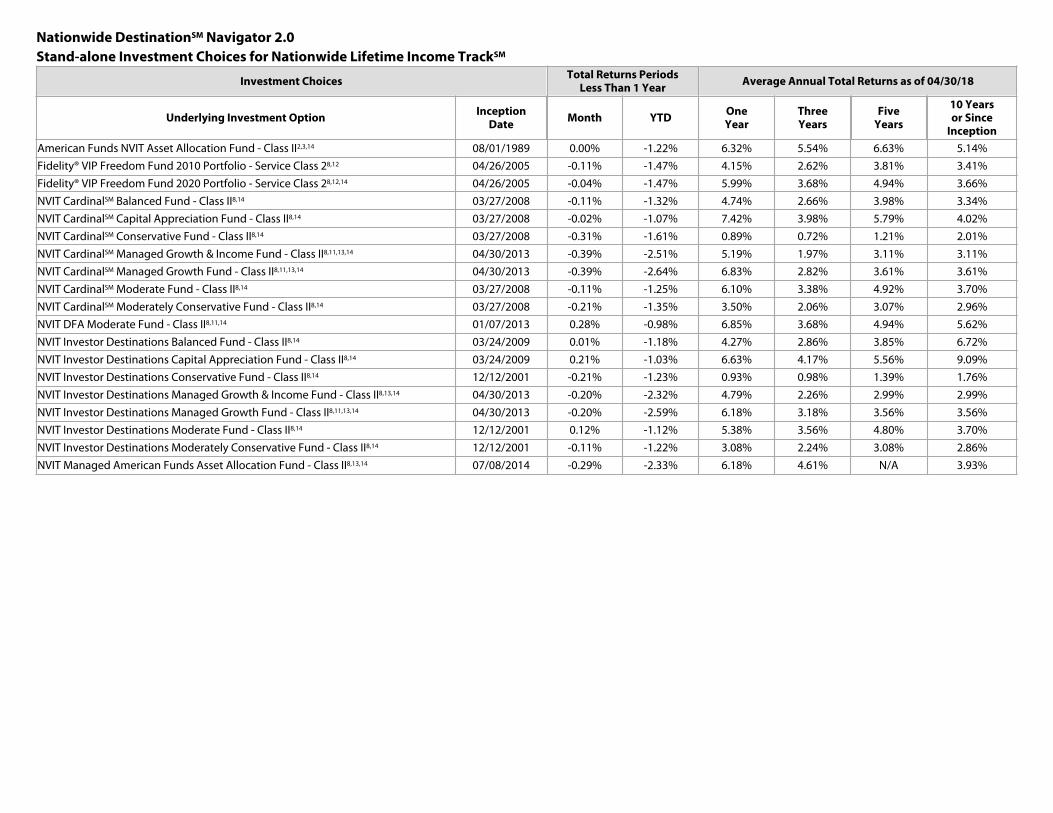
Nationwide DestinationSM Navigator 2.0Stand-alone Investment Choices for Nationwide Lifetime Income TrackSM
Investment Choices Total Returns PeriodsLess Than 1 Year Average Annual Total Returns as of 04/30/18
Underlying Investment Option InceptionDate Month YTD One
YearThreeYears
FiveYears
10 Yearsor Since
Inception
American Funds NVIT Asset Allocation Fund - Class II2,3,14 08/01/1989 0.00% -1.22% 6.32% 5.54% 6.63% 5.14%
Fidelity® VIP Freedom Fund 2010 Portfolio - Service Class 28,12 04/26/2005 -0.11% -1.47% 4.15% 2.62% 3.81% 3.41%
Fidelity® VIP Freedom Fund 2020 Portfolio - Service Class 28,12,14 04/26/2005 -0.04% -1.47% 5.99% 3.68% 4.94% 3.66%
NVIT CardinalSM Balanced Fund - Class II8,14 03/27/2008 -0.11% -1.32% 4.74% 2.66% 3.98% 3.34%
NVIT CardinalSM Capital Appreciation Fund - Class II8,14 03/27/2008 -0.02% -1.07% 7.42% 3.98% 5.79% 4.02%
NVIT CardinalSM Conservative Fund - Class II8,14 03/27/2008 -0.31% -1.61% 0.89% 0.72% 1.21% 2.01%
NVIT CardinalSM Managed Growth & Income Fund - Class II8,11,13,14 04/30/2013 -0.39% -2.51% 5.19% 1.97% 3.11% 3.11%
NVIT CardinalSM Managed Growth Fund - Class II8,11,13,14 04/30/2013 -0.39% -2.64% 6.83% 2.82% 3.61% 3.61%
NVIT CardinalSM Moderate Fund - Class II8,14 03/27/2008 -0.11% -1.25% 6.10% 3.38% 4.92% 3.70%
NVIT CardinalSM Moderately Conservative Fund - Class II8,14 03/27/2008 -0.21% -1.35% 3.50% 2.06% 3.07% 2.96%
NVIT DFA Moderate Fund - Class II8,11,14 01/07/2013 0.28% -0.98% 6.85% 3.68% 4.94% 5.62%
NVIT Investor Destinations Balanced Fund - Class II8,14 03/24/2009 0.01% -1.18% 4.27% 2.86% 3.85% 6.72%
NVIT Investor Destinations Capital Appreciation Fund - Class II8,14 03/24/2009 0.21% -1.03% 6.63% 4.17% 5.56% 9.09%
NVIT Investor Destinations Conservative Fund - Class II8,14 12/12/2001 -0.21% -1.23% 0.93% 0.98% 1.39% 1.76%
NVIT Investor Destinations Managed Growth & Income Fund - Class II8,13,14 04/30/2013 -0.20% -2.32% 4.79% 2.26% 2.99% 2.99%
NVIT Investor Destinations Managed Growth Fund - Class II8,11,13,14 04/30/2013 -0.20% -2.59% 6.18% 3.18% 3.56% 3.56%
NVIT Investor Destinations Moderate Fund - Class II8,14 12/12/2001 0.12% -1.12% 5.38% 3.56% 4.80% 3.70%
NVIT Investor Destinations Moderately Conservative Fund - Class II8,14 12/12/2001 -0.11% -1.22% 3.08% 2.24% 3.08% 2.86%
NVIT Managed American Funds Asset Allocation Fund - Class II8,13,14 07/08/2014 -0.29% -2.33% 6.18% 4.61% N/A 3.93%
Non-standardized performance: Without surrender charges (CDSC) appliedThe figures shown are calculated based on a one-time investment of $10,000 and reflect the deduction of all applicable charges, except for surrender charges (CDSC). These returns are measured from the inception date of the fund and may predate the offering of the fund in the Nationwide® separate account. Where this occurs, the performance is hypothetical in that it depicts how the underlying investment options would have performed had it been available in the Nationwide separate account during the time period. Year-to-date returns are shown only for underlying investment options incepted on or before December 31 of the previous year.
The results shown represent past performance and do not represent expected future performance or experience. Past performance does not guarantee future results. Investment return and principal value of an investment will fluctuate so that an investor's shares, when redeemed, may be worth more or less than their original cost. Current performance may be lower or higher than the data quoted. To obtain performance data current to the most recent month-end or for closed and walled-off underlying investment options, please call 1-800-848-6331 or visit nationwide.com.
Nationwide DestinationSM Navigator 2.0
Investment Choices Total Returns PeriodsLess Than 1 Year Average Annual Total Returns as of 04/30/18
Underlying Investment Option InceptionDate Month YTD One
YearThreeYears
FiveYears
10 Yearsor Since
Inception
Large cap stocks: Large-cap blend
American Funds NVIT Growth-Income Fund - Class II 03/09/1987 1.26% 2.48% 14.85% 9.16% 11.42% 6.64%
Fidelity® VIP Growth & Income Portfolio - Service Class 2 12/31/1996 1.27% -2.59% 7.62% 6.03% 9.04% 5.69%
Neuberger Berman NVIT Multi Cap Opportunities Fund - Class II3 03/24/2008 -0.03% -0.86% 12.11% 9.13% 10.96% 5.54%
NVIT Managed American Funds Growth-Income Fund - Class II8,13 07/08/2014 0.78% 0.73% 12.76% 7.78% N/A 7.45%
NVIT Nationwide Fund - Class II 11/08/1982 -0.38% -0.28% 10.70% 7.82% 10.24% 5.27%
NVIT S&P 500 Index Fund - Class II 02/07/2000 0.23% -1.01% 10.94% 8.31% 10.68% 6.88%
Oppenheimer Main Street Fund®/VA - Service Shares 07/13/2000 -0.34% -3.87% 3.46% 6.45% 9.64% 6.07%
Large cap stocks: Large-cap growth
American Funds NVIT Growth Fund - Class II 02/08/1984 1.95% 4.33% 17.97% 11.96% 12.99% 7.20%
Fidelity® VIP Growth Portfolio - Service Class 2 10/09/1986 0.85% 3.98% 19.72% 11.85% 14.05% 7.42%
Neuberger Berman NVIT Socially Responsible Fund - Class II 03/24/2008 0.10% 0.34% 9.89% 7.09% 9.99% 6.62%
NVIT Large Cap Growth Fund - Class II 03/24/2009 0.79% 2.01% 15.98% 9.36% 12.19% 13.95%
NVIT Multi-Manager Large Cap Growth Fund - Class II 03/24/2008 0.10% 0.82% 17.25% 8.65% 11.40% 6.58%
Large cap stocks: Large-cap value
American Century NVIT Multi Cap Value Fund - Class II3 03/24/2009 1.30% -1.93% 3.96% 5.10% 8.22% 11.88%
BlackRock NVIT Equity Dividend Fund - Class II 10/31/1997 1.68% -1.33% 9.40% 6.11% 8.94% 6.30%
Fidelity® VIP Equity-Income Portfolio - Service Class 2 10/09/1986 0.12% -4.66% 2.69% 4.25% 6.61% 4.21%
MFS® VIT Value Series - Service Class 01/02/2002 -1.02% -4.51% 5.43% 6.17% 8.86% 6.07%
NVIT Multi-Manager Large Cap Value Fund - Class II 03/24/2008 0.64% -2.10% 8.01% 5.48% 8.87% 5.05%
Mid cap stocks: Mid-cap blend
Dreyfus IP MidCap Stock Portfolio - Service Shares3 12/29/2000 -1.04% -3.75% 5.32% 5.06% 8.82% 7.26%
NVIT Mid Cap Index Fund - Class I3 10/31/1997 -0.39% -1.55% 7.66% 7.31% 9.68% 7.93%
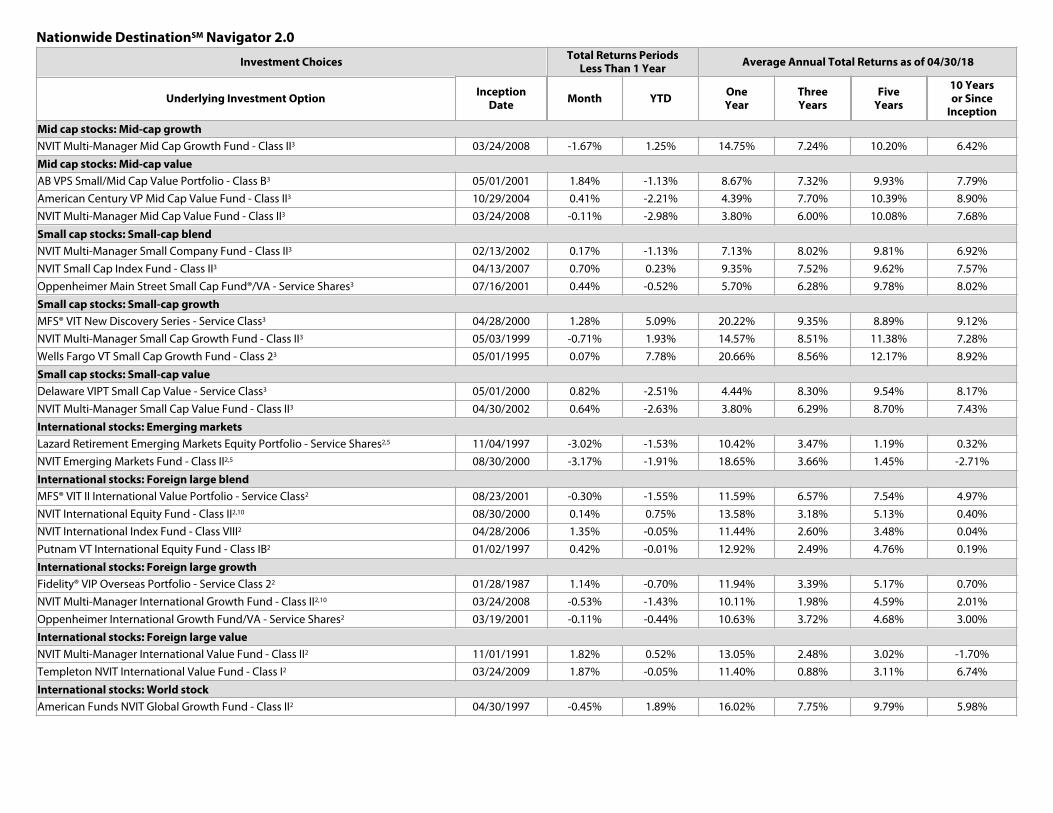
Nationwide DestinationSM Navigator 2.0
Investment ChoicesTotal Returns Periods
Less Than 1 Year Average Annual Total Returns as of 04/30/18
Underlying Investment Option InceptionDate Month YTD One
YearThreeYears
FiveYears
10 Yearsor Since
Inception
Mid cap stocks: Mid-cap growth
NVIT Multi-Manager Mid Cap Growth Fund - Class II3 03/24/2008 -1.67% 1.25% 14.75% 7.24% 10.20% 6.42%
Mid cap stocks: Mid-cap value
AB VPS Small/Mid Cap Value Portfolio - Class B3 05/01/2001 1.84% -1.13% 8.67% 7.32% 9.93% 7.79%
American Century VP Mid Cap Value Fund - Class II3 10/29/2004 0.41% -2.21% 4.39% 7.70% 10.39% 8.90%
NVIT Multi-Manager Mid Cap Value Fund - Class II3 03/24/2008 -0.11% -2.98% 3.80% 6.00% 10.08% 7.68%
Small cap stocks: Small-cap blend
NVIT Multi-Manager Small Company Fund - Class II3 02/13/2002 0.17% -1.13% 7.13% 8.02% 9.81% 6.92%
NVIT Small Cap Index Fund - Class II3 04/13/2007 0.70% 0.23% 9.35% 7.52% 9.62% 7.57%
Oppenheimer Main Street Small Cap Fund®/VA - Service Shares3 07/16/2001 0.44% -0.52% 5.70% 6.28% 9.78% 8.02%
Small cap stocks: Small-cap growth
MFS® VIT New Discovery Series - Service Class3 04/28/2000 1.28% 5.09% 20.22% 9.35% 8.89% 9.12%
NVIT Multi-Manager Small Cap Growth Fund - Class II3 05/03/1999 -0.71% 1.93% 14.57% 8.51% 11.38% 7.28%
Wells Fargo VT Small Cap Growth Fund - Class 23 05/01/1995 0.07% 7.78% 20.66% 8.56% 12.17% 8.92%
Small cap stocks: Small-cap value
Delaware VIPT Small Cap Value - Service Class3 05/01/2000 0.82% -2.51% 4.44% 8.30% 9.54% 8.17%
NVIT Multi-Manager Small Cap Value Fund - Class II3 04/30/2002 0.64% -2.63% 3.80% 6.29% 8.70% 7.43%
International stocks: Emerging markets
Lazard Retirement Emerging Markets Equity Portfolio - Service Shares2,5 11/04/1997 -3.02% -1.53% 10.42% 3.47% 1.19% 0.32%
NVIT Emerging Markets Fund - Class II2,5 08/30/2000 -3.17% -1.91% 18.65% 3.66% 1.45% -2.71%
International stocks: Foreign large blend
MFS® VIT II International Value Portfolio - Service Class2 08/23/2001 -0.30% -1.55% 11.59% 6.57% 7.54% 4.97%
NVIT International Equity Fund - Class II2,10 08/30/2000 0.14% 0.75% 13.58% 3.18% 5.13% 0.40%
NVIT International Index Fund - Class VIII2 04/28/2006 1.35% -0.05% 11.44% 2.60% 3.48% 0.04%
Putnam VT International Equity Fund - Class IB2 01/02/1997 0.42% -0.01% 12.92% 2.49% 4.76% 0.19%
International stocks: Foreign large growth
Fidelity® VIP Overseas Portfolio - Service Class 22 01/28/1987 1.14% -0.70% 11.94% 3.39% 5.17% 0.70%
NVIT Multi-Manager International Growth Fund - Class II2,10 03/24/2008 -0.53% -1.43% 10.11% 1.98% 4.59% 2.01%
Oppenheimer International Growth Fund/VA - Service Shares2 03/19/2001 -0.11% -0.44% 10.63% 3.72% 4.68% 3.00%
International stocks: Foreign large value
NVIT Multi-Manager International Value Fund - Class II2 11/01/1991 1.82% 0.52% 13.05% 2.48% 3.02% -1.70%
Templeton NVIT International Value Fund - Class I2 03/24/2009 1.87% -0.05% 11.40% 0.88% 3.11% 6.74%
International stocks: World stock
American Funds NVIT Global Growth Fund - Class II2 04/30/1997 -0.45% 1.89% 16.02% 7.75% 9.79% 5.98%
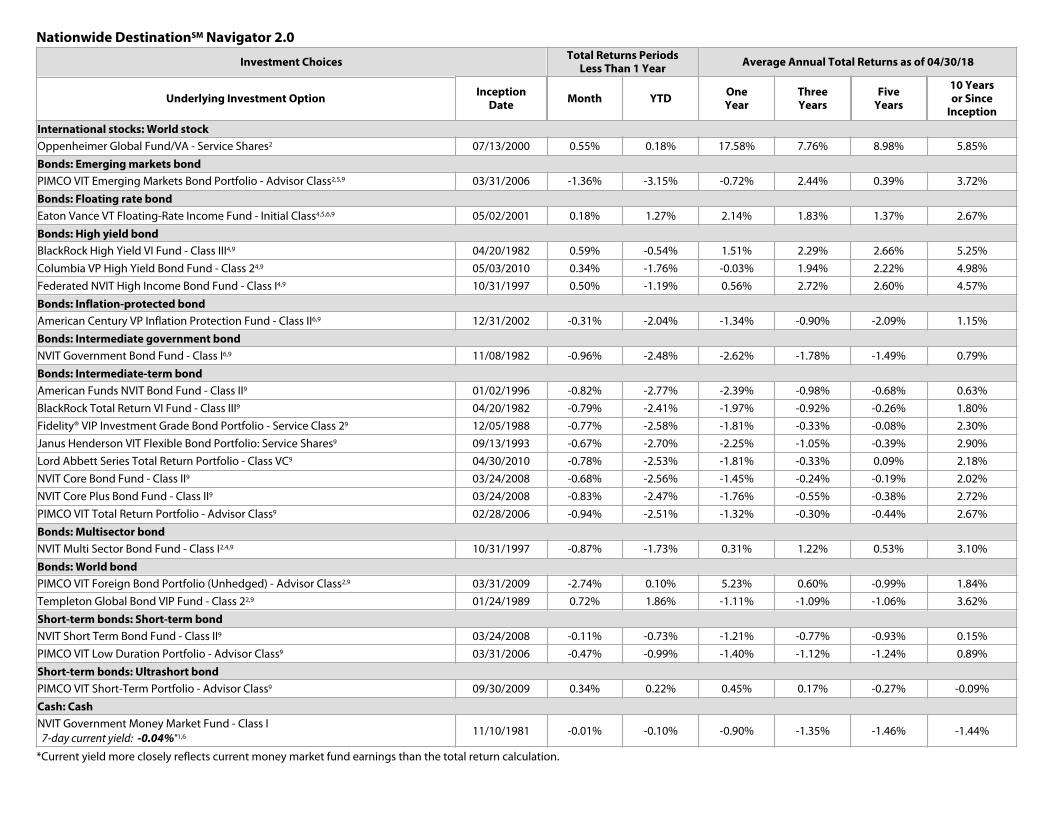
Nationwide DestinationSM Navigator 2.0
Investment ChoicesTotal Returns Periods
Less Than 1 Year Average Annual Total Returns as of 04/30/18
Underlying Investment Option InceptionDate Month YTD One
YearThreeYears
FiveYears
10 Yearsor Since
Inception
International stocks: World stock
Oppenheimer Global Fund/VA - Service Shares2 07/13/2000 0.55% 0.18% 17.58% 7.76% 8.98% 5.85%
Bonds: Emerging markets bond
PIMCO VIT Emerging Markets Bond Portfolio - Advisor Class2,5,9 03/31/2006 -1.36% -3.15% -0.72% 2.44% 0.39% 3.72%
Bonds: Floating rate bond
Eaton Vance VT Floating-Rate Income Fund - Initial Class4,5,6,9 05/02/2001 0.18% 1.27% 2.14% 1.83% 1.37% 2.67%
Bonds: High yield bond
BlackRock High Yield VI Fund - Class III4,9 04/20/1982 0.59% -0.54% 1.51% 2.29% 2.66% 5.25%
Columbia VP High Yield Bond Fund - Class 24,9 05/03/2010 0.34% -1.76% -0.03% 1.94% 2.22% 4.98%
Federated NVIT High Income Bond Fund - Class I4,9 10/31/1997 0.50% -1.19% 0.56% 2.72% 2.60% 4.57%
Bonds: Inflation-protected bond
American Century VP Inflation Protection Fund - Class II6,9 12/31/2002 -0.31% -2.04% -1.34% -0.90% -2.09% 1.15%
Bonds: Intermediate government bond
NVIT Government Bond Fund - Class I6,9 11/08/1982 -0.96% -2.48% -2.62% -1.78% -1.49% 0.79%
Bonds: Intermediate-term bond
American Funds NVIT Bond Fund - Class II9 01/02/1996 -0.82% -2.77% -2.39% -0.98% -0.68% 0.63%
BlackRock Total Return VI Fund - Class III9 04/20/1982 -0.79% -2.41% -1.97% -0.92% -0.26% 1.80%
Fidelity® VIP Investment Grade Bond Portfolio - Service Class 29 12/05/1988 -0.77% -2.58% -1.81% -0.33% -0.08% 2.30%
Janus Henderson VIT Flexible Bond Portfolio: Service Shares9 09/13/1993 -0.67% -2.70% -2.25% -1.05% -0.39% 2.90%
Lord Abbett Series Total Return Portfolio - Class VC9 04/30/2010 -0.78% -2.53% -1.81% -0.33% 0.09% 2.18%
NVIT Core Bond Fund - Class II9 03/24/2008 -0.68% -2.56% -1.45% -0.24% -0.19% 2.02%
NVIT Core Plus Bond Fund - Class II9 03/24/2008 -0.83% -2.47% -1.76% -0.55% -0.38% 2.72%
PIMCO VIT Total Return Portfolio - Advisor Class9 02/28/2006 -0.94% -2.51% -1.32% -0.30% -0.44% 2.67%
Bonds: Multisector bond
NVIT Multi Sector Bond Fund - Class I2,4,9 10/31/1997 -0.87% -1.73% 0.31% 1.22% 0.53% 3.10%
Bonds: World bond
PIMCO VIT Foreign Bond Portfolio (Unhedged) - Advisor Class2,9 03/31/2009 -2.74% 0.10% 5.23% 0.60% -0.99% 1.84%
Templeton Global Bond VIP Fund - Class 22,9 01/24/1989 0.72% 1.86% -1.11% -1.09% -1.06% 3.62%
Short-term bonds: Short-term bond
NVIT Short Term Bond Fund - Class II9 03/24/2008 -0.11% -0.73% -1.21% -0.77% -0.93% 0.15%
PIMCO VIT Low Duration Portfolio - Advisor Class9 03/31/2006 -0.47% -0.99% -1.40% -1.12% -1.24% 0.89%
Short-term bonds: Ultrashort bond
PIMCO VIT Short-Term Portfolio - Advisor Class9 09/30/2009 0.34% 0.22% 0.45% 0.17% -0.27% -0.09%
Cash: Cash
NVIT Government Money Market Fund - Class I 7-day current yield: -0.04%*1,6
11/10/1981 -0.01% -0.10% -0.90% -1.35% -1.46% -1.44%
*Current yield more closely reflects current money market fund earnings than the total return calculation.
Nationwide DestinationSM Navigator 2.0
Investment ChoicesTotal Returns Periods
Less Than 1 Year Average Annual Total Returns as of 04/30/18
Underlying Investment Option InceptionDate Month YTD One
YearThreeYears
FiveYears
10 Yearsor Since
Inception
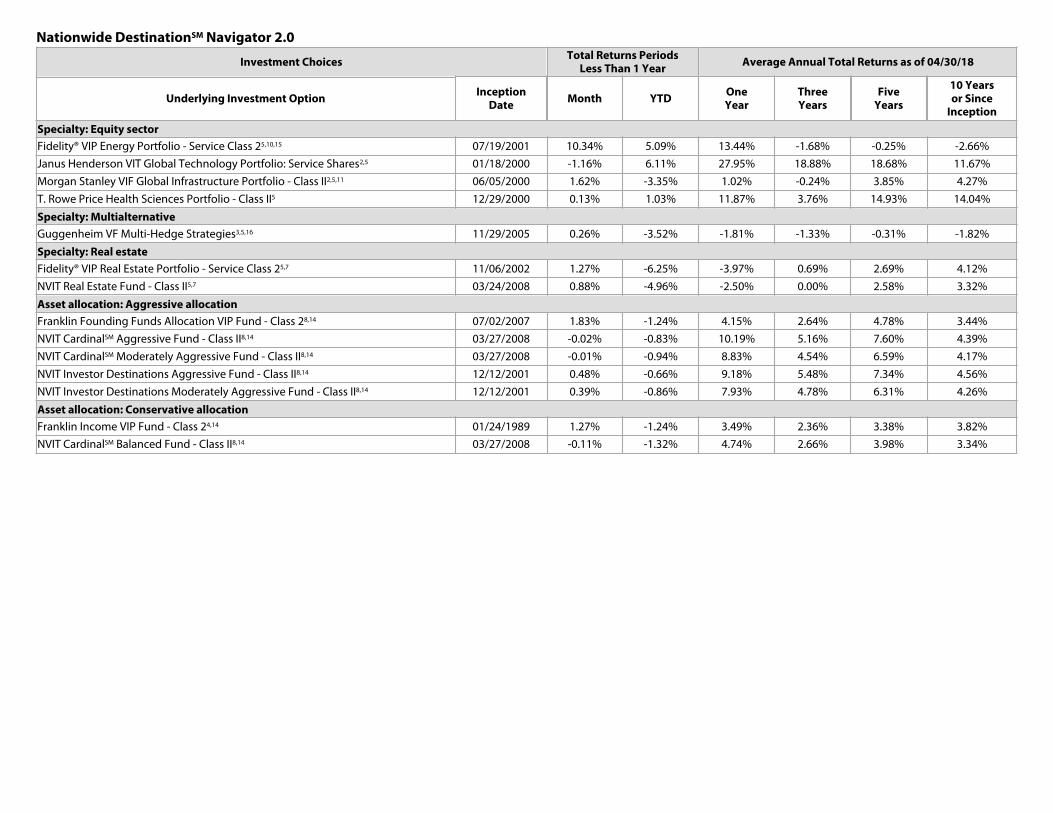
Specialty: Equity sector
Fidelity® VIP Energy Portfolio - Service Class 25,10,15 07/19/2001 10.34% 5.09% 13.44% -1.68% -0.25% -2.66%
Janus Henderson VIT Global Technology Portfolio: Service Shares2,5 01/18/2000 -1.16% 6.11% 27.95% 18.88% 18.68% 11.67%
Morgan Stanley VIF Global Infrastructure Portfolio - Class II2,5,11 06/05/2000 1.62% -3.35% 1.02% -0.24% 3.85% 4.27%
T. Rowe Price Health Sciences Portfolio - Class II5 12/29/2000 0.13% 1.03% 11.87% 3.76% 14.93% 14.04%
Specialty: Multialternative
Guggenheim VF Multi-Hedge Strategies3,5,16 11/29/2005 0.26% -3.52% -1.81% -1.33% -0.31% -1.82%
Specialty: Real estate
Fidelity® VIP Real Estate Portfolio - Service Class 25,7 11/06/2002 1.27% -6.25% -3.97% 0.69% 2.69% 4.12%
NVIT Real Estate Fund - Class II5,7 03/24/2008 0.88% -4.96% -2.50% 0.00% 2.58% 3.32%
Asset allocation: Aggressive allocation
Franklin Founding Funds Allocation VIP Fund - Class 28,14 07/02/2007 1.83% -1.24% 4.15% 2.64% 4.78% 3.44%
NVIT CardinalSM Aggressive Fund - Class II8,14 03/27/2008 -0.02% -0.83% 10.19% 5.16% 7.60% 4.39%
NVIT CardinalSM Moderately Aggressive Fund - Class II8,14 03/27/2008 -0.01% -0.94% 8.83% 4.54% 6.59% 4.17%
NVIT Investor Destinations Aggressive Fund - Class II8,14 12/12/2001 0.48% -0.66% 9.18% 5.48% 7.34% 4.56%
NVIT Investor Destinations Moderately Aggressive Fund - Class II8,14 12/12/2001 0.39% -0.86% 7.93% 4.78% 6.31% 4.26%
Asset allocation: Conservative allocation
Franklin Income VIP Fund - Class 24,14 01/24/1989 1.27% -1.24% 3.49% 2.36% 3.38% 3.82%
NVIT CardinalSM Balanced Fund - Class II8,14 03/27/2008 -0.11% -1.32% 4.74% 2.66% 3.98% 3.34%
Nationwide DestinationSM Navigator 2.0
Investment ChoicesTotal Returns Periods
Less Than 1 Year Average Annual Total Returns as of 04/30/18
Underlying Investment Option InceptionDate Month YTD One
YearThreeYears
FiveYears
10 Yearsor Since
Inception
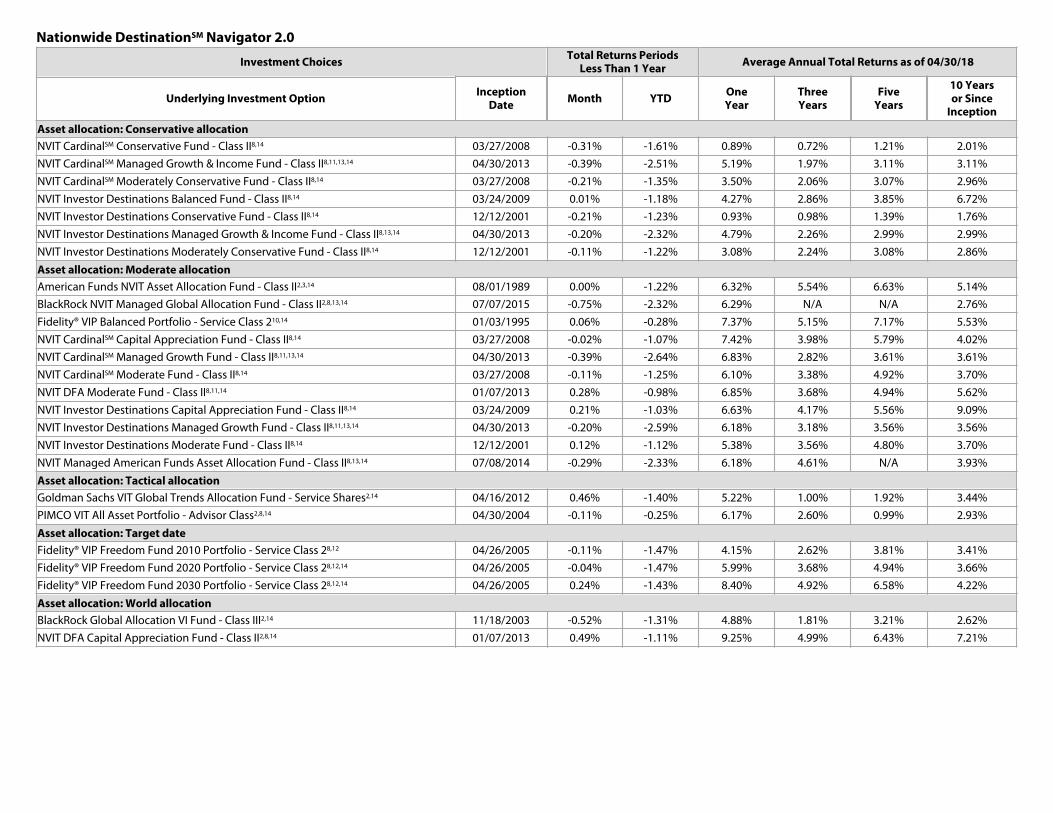
Asset allocation: Conservative allocation
NVIT CardinalSM Conservative Fund - Class II8,14 03/27/2008 -0.31% -1.61% 0.89% 0.72% 1.21% 2.01%
NVIT CardinalSM Managed Growth & Income Fund - Class II8,11,13,14 04/30/2013 -0.39% -2.51% 5.19% 1.97% 3.11% 3.11%
NVIT CardinalSM Moderately Conservative Fund - Class II8,14 03/27/2008 -0.21% -1.35% 3.50% 2.06% 3.07% 2.96%
NVIT Investor Destinations Balanced Fund - Class II8,14 03/24/2009 0.01% -1.18% 4.27% 2.86% 3.85% 6.72%
NVIT Investor Destinations Conservative Fund - Class II8,14 12/12/2001 -0.21% -1.23% 0.93% 0.98% 1.39% 1.76%
NVIT Investor Destinations Managed Growth & Income Fund - Class II8,13,14 04/30/2013 -0.20% -2.32% 4.79% 2.26% 2.99% 2.99%
NVIT Investor Destinations Moderately Conservative Fund - Class II8,14 12/12/2001 -0.11% -1.22% 3.08% 2.24% 3.08% 2.86%
Asset allocation: Moderate allocation
American Funds NVIT Asset Allocation Fund - Class II2,3,14 08/01/1989 0.00% -1.22% 6.32% 5.54% 6.63% 5.14%
BlackRock NVIT Managed Global Allocation Fund - Class II2,8,13,14 07/07/2015 -0.75% -2.32% 6.29% N/A N/A 2.76%
Fidelity® VIP Balanced Portfolio - Service Class 210,14 01/03/1995 0.06% -0.28% 7.37% 5.15% 7.17% 5.53%
NVIT CardinalSM Capital Appreciation Fund - Class II8,14 03/27/2008 -0.02% -1.07% 7.42% 3.98% 5.79% 4.02%
NVIT CardinalSM Managed Growth Fund - Class II8,11,13,14 04/30/2013 -0.39% -2.64% 6.83% 2.82% 3.61% 3.61%
NVIT CardinalSM Moderate Fund - Class II8,14 03/27/2008 -0.11% -1.25% 6.10% 3.38% 4.92% 3.70%
NVIT DFA Moderate Fund - Class II8,11,14 01/07/2013 0.28% -0.98% 6.85% 3.68% 4.94% 5.62%
NVIT Investor Destinations Capital Appreciation Fund - Class II8,14 03/24/2009 0.21% -1.03% 6.63% 4.17% 5.56% 9.09%
NVIT Investor Destinations Managed Growth Fund - Class II8,11,13,14 04/30/2013 -0.20% -2.59% 6.18% 3.18% 3.56% 3.56%
NVIT Investor Destinations Moderate Fund - Class II8,14 12/12/2001 0.12% -1.12% 5.38% 3.56% 4.80% 3.70%
NVIT Managed American Funds Asset Allocation Fund - Class II8,13,14 07/08/2014 -0.29% -2.33% 6.18% 4.61% N/A 3.93%
Asset allocation: Tactical allocation
Goldman Sachs VIT Global Trends Allocation Fund - Service Shares2,14 04/16/2012 0.46% -1.40% 5.22% 1.00% 1.92% 3.44%
PIMCO VIT All Asset Portfolio - Advisor Class2,8,14 04/30/2004 -0.11% -0.25% 6.17% 2.60% 0.99% 2.93%
Asset allocation: Target date
Fidelity® VIP Freedom Fund 2010 Portfolio - Service Class 28,12 04/26/2005 -0.11% -1.47% 4.15% 2.62% 3.81% 3.41%
Fidelity® VIP Freedom Fund 2020 Portfolio - Service Class 28,12,14 04/26/2005 -0.04% -1.47% 5.99% 3.68% 4.94% 3.66%
Fidelity® VIP Freedom Fund 2030 Portfolio - Service Class 28,12,14 04/26/2005 0.24% -1.43% 8.40% 4.92% 6.58% 4.22%
Asset allocation: World allocation
BlackRock Global Allocation VI Fund - Class III2,14 11/18/2003 -0.52% -1.31% 4.88% 1.81% 3.21% 2.62%
NVIT DFA Capital Appreciation Fund - Class II2,8,14 01/07/2013 0.49% -1.11% 9.25% 4.99% 6.43% 7.21%
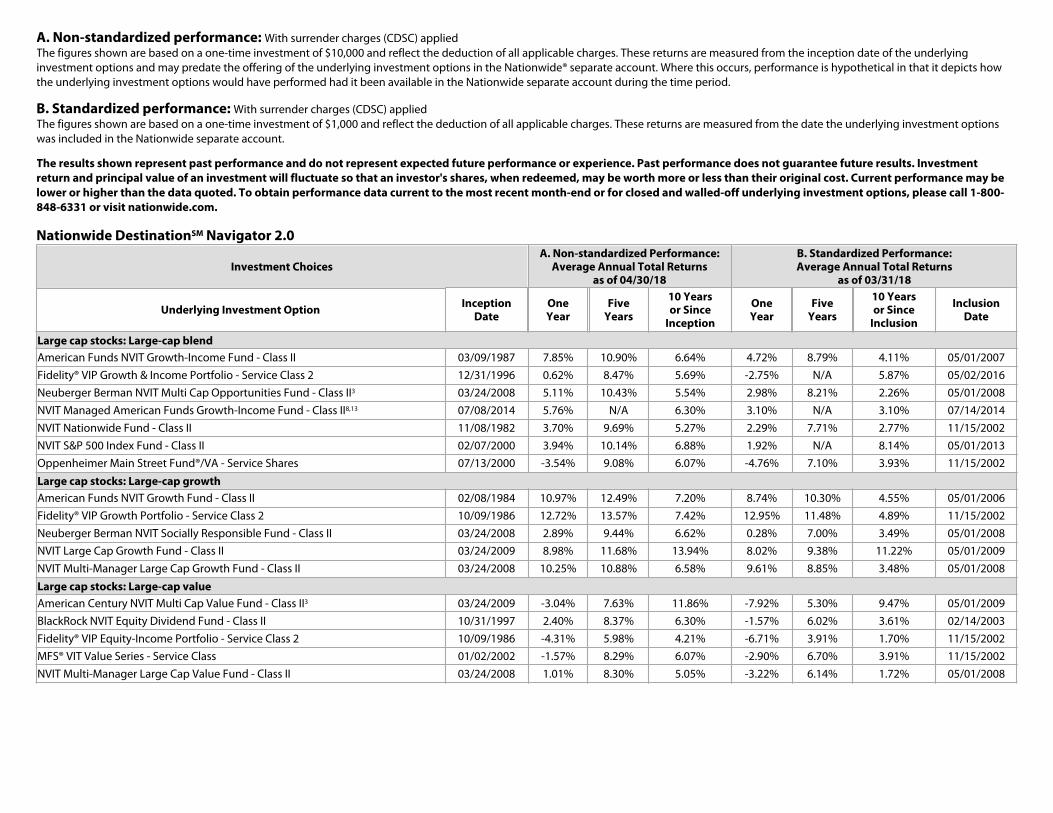
A. Non-standardized performance: With surrender charges (CDSC) appliedThe figures shown are based on a one-time investment of $10,000 and reflect the deduction of all applicable charges. These returns are measured from the inception date of the underlying investment options and may predate the offering of the underlying investment options in the Nationwide® separate account. Where this occurs, performance is hypothetical in that it depicts how the underlying investment options would have performed had it been available in the Nationwide separate account during the time period.
B. Standardized performance: With surrender charges (CDSC) appliedThe figures shown are based on a one-time investment of $1,000 and reflect the deduction of all applicable charges. These returns are measured from the date the underlying investment options was included in the Nationwide separate account.
The results shown represent past performance and do not represent expected future performance or experience. Past performance does not guarantee future results. Investment return and principal value of an investment will fluctuate so that an investor's shares, when redeemed, may be worth more or less than their original cost. Current performance may be lower or higher than the data quoted. To obtain performance data current to the most recent month-end or for closed and walled-off underlying investment options, please call 1-800-848-6331 or visit nationwide.com.
Nationwide DestinationSM Navigator 2.0
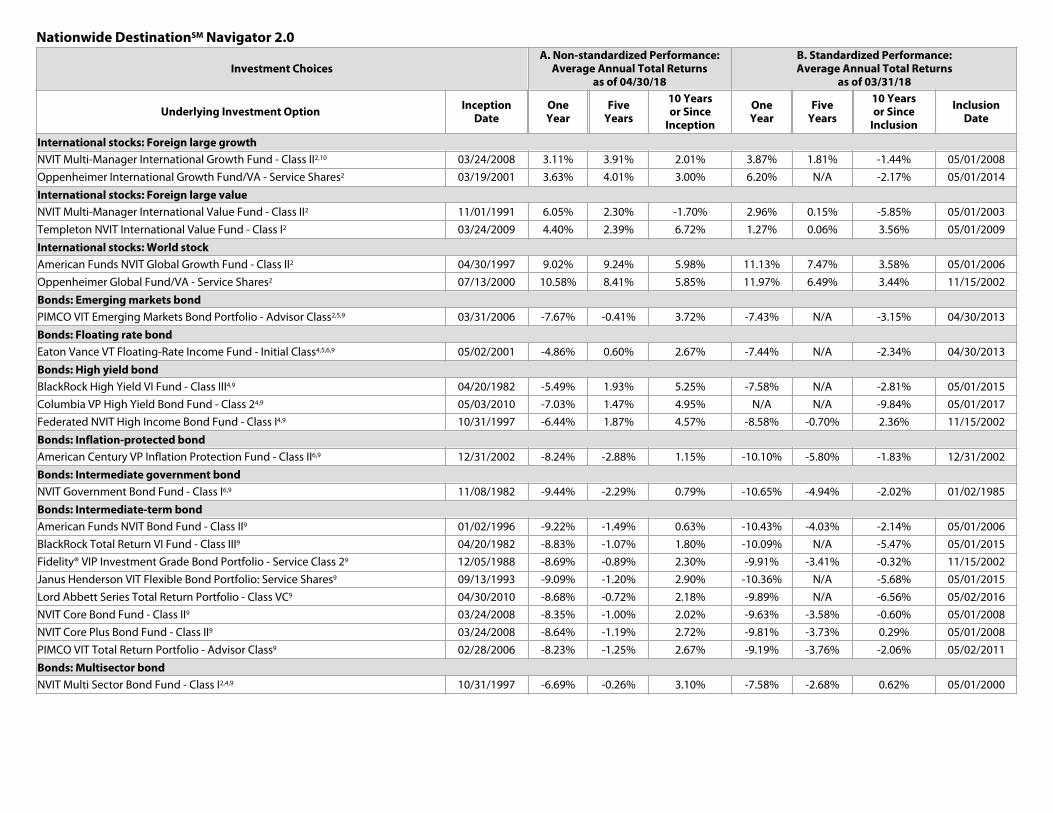
Investment ChoicesA. Non-standardized Performance:
Average Annual Total Returnsas of 04/30/18
B. Standardized Performance:Average Annual Total Returns
as of 03/31/18
Underlying Investment Option InceptionDate
OneYear
FiveYears
10 Yearsor Since
Inception
OneYear
FiveYears
10 Yearsor Since
Inclusion
InclusionDate
Large cap stocks: Large-cap blend
American Funds NVIT Growth-Income Fund - Class II 03/09/1987 7.85% 10.90% 6.64% 4.72% 8.79% 4.11% 05/01/2007
Fidelity® VIP Growth & Income Portfolio - Service Class 2 12/31/1996 0.62% 8.47% 5.69% -2.75% N/A 5.87% 05/02/2016
Neuberger Berman NVIT Multi Cap Opportunities Fund - Class II3 03/24/2008 5.11% 10.43% 5.54% 2.98% 8.21% 2.26% 05/01/2008
NVIT Managed American Funds Growth-Income Fund - Class II8,13 07/08/2014 5.76% N/A 6.30% 3.10% N/A 3.10% 07/14/2014
NVIT Nationwide Fund - Class II 11/08/1982 3.70% 9.69% 5.27% 2.29% 7.71% 2.77% 11/15/2002
NVIT S&P 500 Index Fund - Class II 02/07/2000 3.94% 10.14% 6.88% 1.92% N/A 8.14% 05/01/2013
Oppenheimer Main Street Fund®/VA - Service Shares 07/13/2000 -3.54% 9.08% 6.07% -4.76% 7.10% 3.93% 11/15/2002
Large cap stocks: Large-cap growth
American Funds NVIT Growth Fund - Class II 02/08/1984 10.97% 12.49% 7.20% 8.74% 10.30% 4.55% 05/01/2006
Fidelity® VIP Growth Portfolio - Service Class 2 10/09/1986 12.72% 13.57% 7.42% 12.95% 11.48% 4.89% 11/15/2002
Neuberger Berman NVIT Socially Responsible Fund - Class II 03/24/2008 2.89% 9.44% 6.62% 0.28% 7.00% 3.49% 05/01/2008
NVIT Large Cap Growth Fund - Class II 03/24/2009 8.98% 11.68% 13.94% 8.02% 9.38% 11.22% 05/01/2009
NVIT Multi-Manager Large Cap Growth Fund - Class II 03/24/2008 10.25% 10.88% 6.58% 9.61% 8.85% 3.48% 05/01/2008
Large cap stocks: Large-cap value
American Century NVIT Multi Cap Value Fund - Class II3 03/24/2009 -3.04% 7.63% 11.86% -7.92% 5.30% 9.47% 05/01/2009
BlackRock NVIT Equity Dividend Fund - Class II 10/31/1997 2.40% 8.37% 6.30% -1.57% 6.02% 3.61% 02/14/2003
Fidelity® VIP Equity-Income Portfolio - Service Class 2 10/09/1986 -4.31% 5.98% 4.21% -6.71% 3.91% 1.70% 11/15/2002
MFS® VIT Value Series - Service Class 01/02/2002 -1.57% 8.29% 6.07% -2.90% 6.70% 3.91% 11/15/2002
NVIT Multi-Manager Large Cap Value Fund - Class II 03/24/2008 1.01% 8.30% 5.05% -3.22% 6.14% 1.72% 05/01/2008
Nationwide DestinationSM Navigator 2.0
Investment ChoicesA. Non-standardized Performance:
Average Annual Total Returnsas of 04/30/18
B. Standardized Performance:Average Annual Total Returns
as of 03/31/18
Underlying Investment Option InceptionDate
OneYear
FiveYears
10 Yearsor Since
Inception
OneYear
FiveYears
10 Yearsor Since
Inclusion
InclusionDate
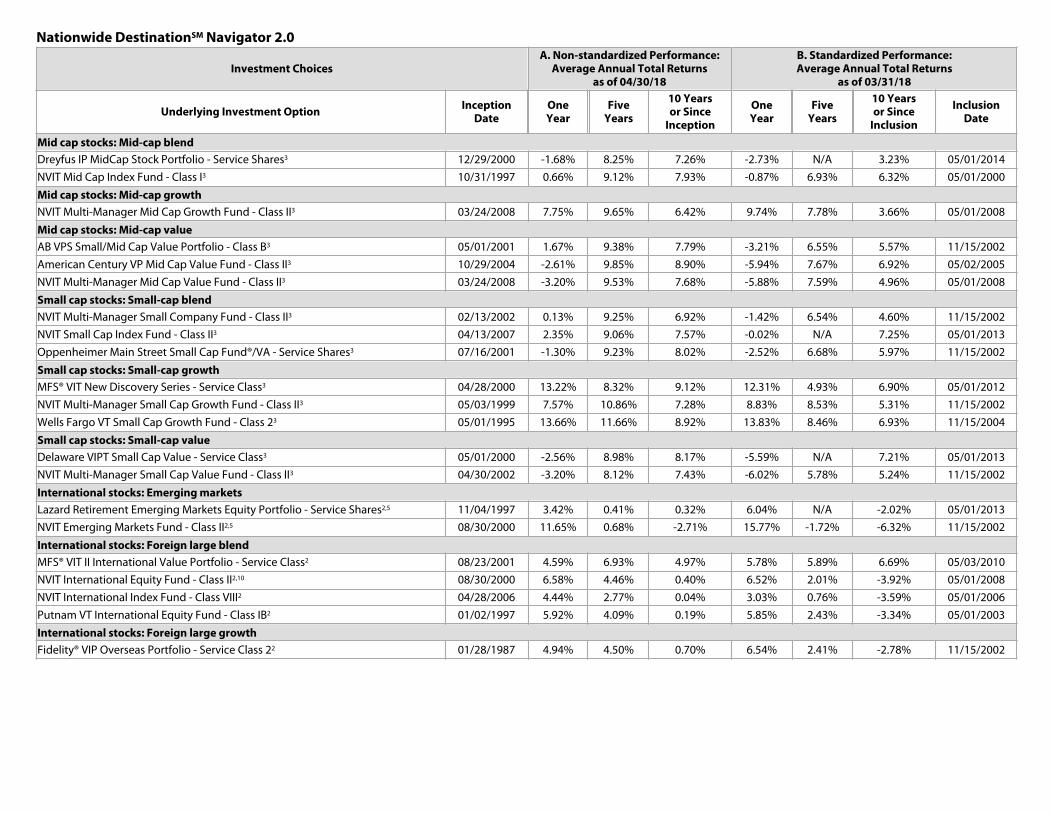
Mid cap stocks: Mid-cap blend
Dreyfus IP MidCap Stock Portfolio - Service Shares3 12/29/2000 -1.68% 8.25% 7.26% -2.73% N/A 3.23% 05/01/2014
NVIT Mid Cap Index Fund - Class I3 10/31/1997 0.66% 9.12% 7.93% -0.87% 6.93% 6.32% 05/01/2000
Mid cap stocks: Mid-cap growth
NVIT Multi-Manager Mid Cap Growth Fund - Class II3 03/24/2008 7.75% 9.65% 6.42% 9.74% 7.78% 3.66% 05/01/2008
Mid cap stocks: Mid-cap value
AB VPS Small/Mid Cap Value Portfolio - Class B3 05/01/2001 1.67% 9.38% 7.79% -3.21% 6.55% 5.57% 11/15/2002
American Century VP Mid Cap Value Fund - Class II3 10/29/2004 -2.61% 9.85% 8.90% -5.94% 7.67% 6.92% 05/02/2005
NVIT Multi-Manager Mid Cap Value Fund - Class II3 03/24/2008 -3.20% 9.53% 7.68% -5.88% 7.59% 4.96% 05/01/2008
Small cap stocks: Small-cap blend
NVIT Multi-Manager Small Company Fund - Class II3 02/13/2002 0.13% 9.25% 6.92% -1.42% 6.54% 4.60% 11/15/2002
NVIT Small Cap Index Fund - Class II3 04/13/2007 2.35% 9.06% 7.57% -0.02% N/A 7.25% 05/01/2013
Oppenheimer Main Street Small Cap Fund®/VA - Service Shares3 07/16/2001 -1.30% 9.23% 8.02% -2.52% 6.68% 5.97% 11/15/2002
Small cap stocks: Small-cap growth
MFS® VIT New Discovery Series - Service Class3 04/28/2000 13.22% 8.32% 9.12% 12.31% 4.93% 6.90% 05/01/2012
NVIT Multi-Manager Small Cap Growth Fund - Class II3 05/03/1999 7.57% 10.86% 7.28% 8.83% 8.53% 5.31% 11/15/2002
Wells Fargo VT Small Cap Growth Fund - Class 23 05/01/1995 13.66% 11.66% 8.92% 13.83% 8.46% 6.93% 11/15/2004
Small cap stocks: Small-cap value
Delaware VIPT Small Cap Value - Service Class3 05/01/2000 -2.56% 8.98% 8.17% -5.59% N/A 7.21% 05/01/2013
NVIT Multi-Manager Small Cap Value Fund - Class II3 04/30/2002 -3.20% 8.12% 7.43% -6.02% 5.78% 5.24% 11/15/2002
International stocks: Emerging markets
Lazard Retirement Emerging Markets Equity Portfolio - Service Shares2,5 11/04/1997 3.42% 0.41% 0.32% 6.04% N/A -2.02% 05/01/2013
NVIT Emerging Markets Fund - Class II2,5 08/30/2000 11.65% 0.68% -2.71% 15.77% -1.72% -6.32% 11/15/2002
International stocks: Foreign large blend
MFS® VIT II International Value Portfolio - Service Class2 08/23/2001 4.59% 6.93% 4.97% 5.78% 5.89% 6.69% 05/03/2010
NVIT International Equity Fund - Class II2,10 08/30/2000 6.58% 4.46% 0.40% 6.52% 2.01% -3.92% 05/01/2008
NVIT International Index Fund - Class VIII2 04/28/2006 4.44% 2.77% 0.04% 3.03% 0.76% -3.59% 05/01/2006
Putnam VT International Equity Fund - Class IB2 01/02/1997 5.92% 4.09% 0.19% 5.85% 2.43% -3.34% 05/01/2003
International stocks: Foreign large growth
Fidelity® VIP Overseas Portfolio - Service Class 22 01/28/1987 4.94% 4.50% 0.70% 6.54% 2.41% -2.78% 11/15/2002
Nationwide DestinationSM Navigator 2.0
Investment ChoicesA. Non-standardized Performance:
Average Annual Total Returnsas of 04/30/18
B. Standardized Performance:Average Annual Total Returns
as of 03/31/18
Underlying Investment Option InceptionDate
OneYear
FiveYears
10 Yearsor Since
Inception
OneYear
FiveYears
10 Yearsor Since
Inclusion
InclusionDate
International stocks: Foreign large growth
NVIT Multi-Manager International Growth Fund - Class II2,10 03/24/2008 3.11% 3.91% 2.01% 3.87% 1.81% -1.44% 05/01/2008
Oppenheimer International Growth Fund/VA - Service Shares2 03/19/2001 3.63% 4.01% 3.00% 6.20% N/A -2.17% 05/01/2014
International stocks: Foreign large value
NVIT Multi-Manager International Value Fund - Class II2 11/01/1991 6.05% 2.30% -1.70% 2.96% 0.15% -5.85% 05/01/2003
Templeton NVIT International Value Fund - Class I2 03/24/2009 4.40% 2.39% 6.72% 1.27% 0.06% 3.56% 05/01/2009
International stocks: World stock
American Funds NVIT Global Growth Fund - Class II2 04/30/1997 9.02% 9.24% 5.98% 11.13% 7.47% 3.58% 05/01/2006
Oppenheimer Global Fund/VA - Service Shares2 07/13/2000 10.58% 8.41% 5.85% 11.97% 6.49% 3.44% 11/15/2002
Bonds: Emerging markets bond
PIMCO VIT Emerging Markets Bond Portfolio - Advisor Class2,5,9 03/31/2006 -7.67% -0.41% 3.72% -7.43% N/A -3.15% 04/30/2013
Bonds: Floating rate bond
Eaton Vance VT Floating-Rate Income Fund - Initial Class4,5,6,9 05/02/2001 -4.86% 0.60% 2.67% -7.44% N/A -2.34% 04/30/2013
Bonds: High yield bond
BlackRock High Yield VI Fund - Class III4,9 04/20/1982 -5.49% 1.93% 5.25% -7.58% N/A -2.81% 05/01/2015
Columbia VP High Yield Bond Fund - Class 24,9 05/03/2010 -7.03% 1.47% 4.95% N/A N/A -9.84% 05/01/2017
Federated NVIT High Income Bond Fund - Class I4,9 10/31/1997 -6.44% 1.87% 4.57% -8.58% -0.70% 2.36% 11/15/2002
Bonds: Inflation-protected bond
American Century VP Inflation Protection Fund - Class II6,9 12/31/2002 -8.24% -2.88% 1.15% -10.10% -5.80% -1.83% 12/31/2002
Bonds: Intermediate government bond
NVIT Government Bond Fund - Class I6,9 11/08/1982 -9.44% -2.29% 0.79% -10.65% -4.94% -2.02% 01/02/1985
Bonds: Intermediate-term bond
American Funds NVIT Bond Fund - Class II9 01/02/1996 -9.22% -1.49% 0.63% -10.43% -4.03% -2.14% 05/01/2006
BlackRock Total Return VI Fund - Class III9 04/20/1982 -8.83% -1.07% 1.80% -10.09% N/A -5.47% 05/01/2015
Fidelity® VIP Investment Grade Bond Portfolio - Service Class 29 12/05/1988 -8.69% -0.89% 2.30% -9.91% -3.41% -0.32% 11/15/2002
Janus Henderson VIT Flexible Bond Portfolio: Service Shares9 09/13/1993 -9.09% -1.20% 2.90% -10.36% N/A -5.68% 05/01/2015
Lord Abbett Series Total Return Portfolio - Class VC9 04/30/2010 -8.68% -0.72% 2.18% -9.89% N/A -6.56% 05/02/2016
NVIT Core Bond Fund - Class II9 03/24/2008 -8.35% -1.00% 2.02% -9.63% -3.58% -0.60% 05/01/2008
NVIT Core Plus Bond Fund - Class II9 03/24/2008 -8.64% -1.19% 2.72% -9.81% -3.73% 0.29% 05/01/2008
PIMCO VIT Total Return Portfolio - Advisor Class9 02/28/2006 -8.23% -1.25% 2.67% -9.19% -3.76% -2.06% 05/02/2011
Bonds: Multisector bond
NVIT Multi Sector Bond Fund - Class I2,4,9 10/31/1997 -6.69% -0.26% 3.10% -7.58% -2.68% 0.62% 05/01/2000
Nationwide DestinationSM Navigator 2.0
Investment ChoicesA. Non-standardized Performance:
Average Annual Total Returnsas of 04/30/18
B. Standardized Performance:Average Annual Total Returns
as of 03/31/18
Underlying Investment Option InceptionDate
OneYear
FiveYears
10 Yearsor Since
Inception
OneYear
FiveYears
10 Yearsor Since
Inclusion
InclusionDate
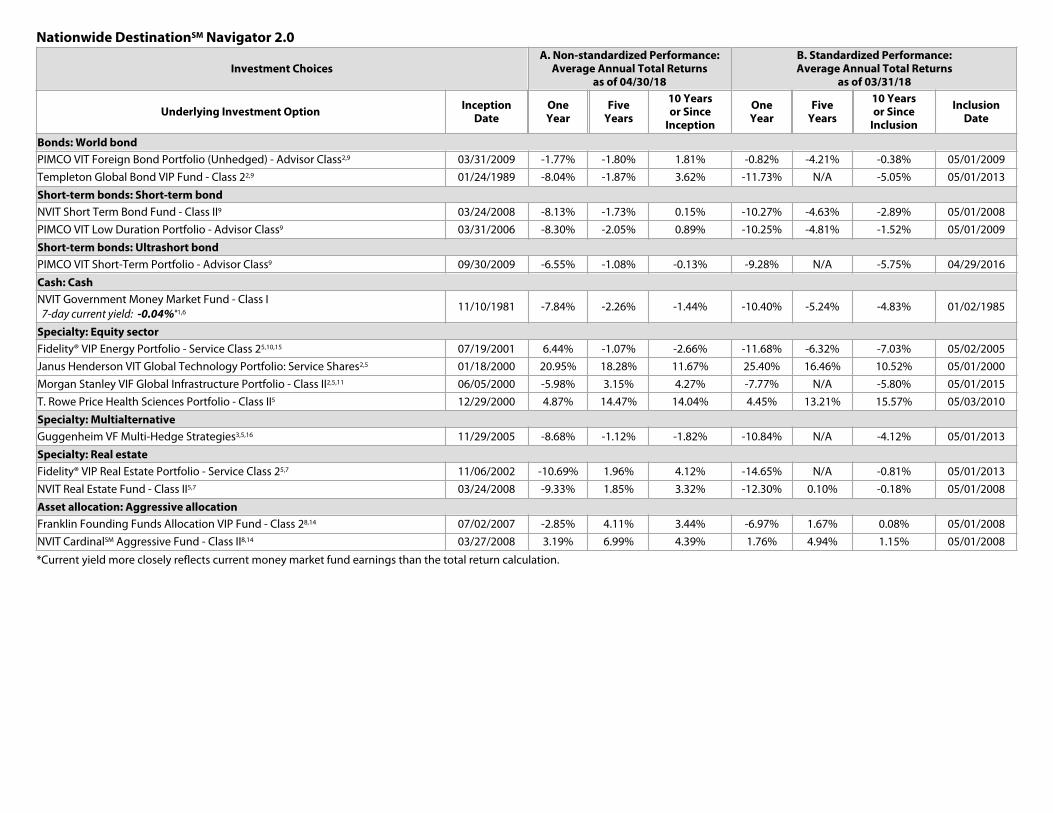
Bonds: World bond
PIMCO VIT Foreign Bond Portfolio (Unhedged) - Advisor Class2,9 03/31/2009 -1.77% -1.80% 1.81% -0.82% -4.21% -0.38% 05/01/2009
Templeton Global Bond VIP Fund - Class 22,9 01/24/1989 -8.04% -1.87% 3.62% -11.73% N/A -5.05% 05/01/2013
Short-term bonds: Short-term bond
NVIT Short Term Bond Fund - Class II9 03/24/2008 -8.13% -1.73% 0.15% -10.27% -4.63% -2.89% 05/01/2008
PIMCO VIT Low Duration Portfolio - Advisor Class9 03/31/2006 -8.30% -2.05% 0.89% -10.25% -4.81% -1.52% 05/01/2009
Short-term bonds: Ultrashort bond
PIMCO VIT Short-Term Portfolio - Advisor Class9 09/30/2009 -6.55% -1.08% -0.13% -9.28% N/A -5.75% 04/29/2016
Cash: Cash
NVIT Government Money Market Fund - Class I 7-day current yield: -0.04%*1,6
11/10/1981 -7.84% -2.26% -1.44% -10.40% -5.24% -4.83% 01/02/1985
Specialty: Equity sector
Fidelity® VIP Energy Portfolio - Service Class 25,10,15 07/19/2001 6.44% -1.07% -2.66% -11.68% -6.32% -7.03% 05/02/2005
Janus Henderson VIT Global Technology Portfolio: Service Shares2,5 01/18/2000 20.95% 18.28% 11.67% 25.40% 16.46% 10.52% 05/01/2000
Morgan Stanley VIF Global Infrastructure Portfolio - Class II2,5,11 06/05/2000 -5.98% 3.15% 4.27% -7.77% N/A -5.80% 05/01/2015
T. Rowe Price Health Sciences Portfolio - Class II5 12/29/2000 4.87% 14.47% 14.04% 4.45% 13.21% 15.57% 05/03/2010
Specialty: Multialternative
Guggenheim VF Multi-Hedge Strategies3,5,16 11/29/2005 -8.68% -1.12% -1.82% -10.84% N/A -4.12% 05/01/2013
Specialty: Real estate
Fidelity® VIP Real Estate Portfolio - Service Class 25,7 11/06/2002 -10.69% 1.96% 4.12% -14.65% N/A -0.81% 05/01/2013
NVIT Real Estate Fund - Class II5,7 03/24/2008 -9.33% 1.85% 3.32% -12.30% 0.10% -0.18% 05/01/2008
Asset allocation: Aggressive allocation
Franklin Founding Funds Allocation VIP Fund - Class 28,14 07/02/2007 -2.85% 4.11% 3.44% -6.97% 1.67% 0.08% 05/01/2008
NVIT CardinalSM Aggressive Fund - Class II8,14 03/27/2008 3.19% 6.99% 4.39% 1.76% 4.94% 1.15% 05/01/2008
*Current yield more closely reflects current money market fund earnings than the total return calculation.

Nationwide DestinationSM Navigator 2.0
Investment ChoicesA. Non-standardized Performance:
Average Annual Total Returnsas of 04/30/18
B. Standardized Performance:Average Annual Total Returns
as of 03/31/18
Underlying Investment Option InceptionDate
OneYear
FiveYears
10 Yearsor Since
Inception
OneYear
FiveYears
10 Yearsor Since
Inclusion
InclusionDate
Asset allocation: Aggressive allocation
NVIT CardinalSM Moderately Aggressive Fund - Class II8,14 03/27/2008 1.83% 5.96% 4.17% 0.28% 3.77% 1.07% 05/01/2008
NVIT Investor Destinations Aggressive Fund - Class II8,14 12/12/2001 2.18% 6.73% 4.56% 0.33% 4.60% 2.02% 01/25/2002
NVIT Investor Destinations Moderately Aggressive Fund - Class II8,14 12/12/2001 0.93% 5.67% 4.26% -0.96% 3.45% 1.73% 01/25/2002
Asset allocation: Conservative allocation
Franklin Income VIP Fund - Class 24,14 01/24/1989 -3.51% 2.67% 3.82% -7.51% 0.13% 1.52% 05/01/2006
NVIT CardinalSM Balanced Fund - Class II8,14 03/27/2008 -2.26% 3.29% 3.34% -4.00% 0.87% 0.42% 05/01/2008
NVIT CardinalSM Conservative Fund - Class II8,14 03/27/2008 -6.11% 0.43% 2.01% -7.83% -2.16% -0.82% 05/01/2008
NVIT CardinalSM Managed Growth & Income Fund - Class II8,11,13,14 04/30/2013 -1.81% 2.39% 2.39% -3.10% N/A -0.17% 05/01/2013
NVIT CardinalSM Moderately Conservative Fund - Class II8,14 03/27/2008 -3.50% 2.35% 2.96% -5.32% -0.12% 0.09% 05/01/2008
NVIT Investor Destinations Balanced Fund - Class II8,14 03/24/2009 -2.73% 3.16% 6.70% -4.54% 0.72% 4.01% 05/01/2009
NVIT Investor Destinations Conservative Fund - Class II8,14 12/12/2001 -6.07% 0.62% 1.76% -7.98% -1.98% -0.98% 01/25/2002
NVIT Investor Destinations Managed Growth & Income Fund - Class II8,13,14 04/30/2013 -2.21% 2.27% 2.27% -3.64% N/A -0.36% 05/01/2013
NVIT Investor Destinations Moderately Conservative Fund - Class II8,14 12/12/2001 -3.92% 2.36% 2.86% -5.78% -0.11% 0.26% 01/25/2002
Asset allocation: Moderate allocation
American Funds NVIT Asset Allocation Fund - Class II2,3,14 08/01/1989 -0.68% 6.00% 5.14% -2.59% 3.91% 2.76% 05/01/2006
BlackRock NVIT Managed Global Allocation Fund - Class II2,8,13,14 07/07/2015 -0.71% N/A 0.59% -1.00% N/A -2.67% 07/13/2015
Fidelity® VIP Balanced Portfolio - Service Class 210,14 01/03/1995 0.37% 6.56% 5.53% -1.24% N/A 3.10% 05/02/2016
NVIT CardinalSM Capital Appreciation Fund - Class II8,14 03/27/2008 0.42% 5.14% 4.02% -1.26% 2.90% 0.98% 05/01/2008
NVIT CardinalSM Managed Growth Fund - Class II8,11,13,14 04/30/2013 -0.17% 2.91% 2.91% -1.35% N/A 0.38% 05/01/2013
NVIT CardinalSM Moderate Fund - Class II8,14 03/27/2008 -0.90% 4.25% 3.70% -2.61% 1.91% 0.74% 05/01/2008
NVIT DFA Moderate Fund - Class II8,11,14 01/07/2013 -0.15% 4.27% 5.12% -2.19% N/A 1.76% 05/01/2013
NVIT Investor Destinations Capital Appreciation Fund - Class II8,14 03/24/2009 -0.37% 4.91% 9.07% -2.20% 2.64% 6.35% 05/01/2009
NVIT Investor Destinations Managed Growth Fund - Class II8,11,13,14 04/30/2013 -0.82% 2.85% 2.85% -2.07% N/A 0.27% 05/01/2013
NVIT Investor Destinations Moderate Fund - Class II8,14 12/12/2001 -1.62% 4.12% 3.70% -3.41% 1.79% 1.17% 01/25/2002
NVIT Managed American Funds Asset Allocation Fund - Class II8,13,14 07/08/2014 -0.82% N/A 2.66% -2.33% N/A -0.34% 07/14/2014
Asset allocation: Tactical allocation
Goldman Sachs VIT Global Trends Allocation Fund - Service Shares2,14 04/16/2012 -1.78% 1.17% 3.11% -4.17% -0.94% 0.18% 05/01/2012
PIMCO VIT All Asset Portfolio - Advisor Class2,8,14 04/30/2004 -0.83% 0.20% 2.93% -3.11% -2.39% -1.06% 05/01/2012
Asset allocation: Target date
Fidelity® VIP Freedom Fund 2010 Portfolio - Service Class 28,12 04/26/2005 -2.85% 3.11% 3.41% -4.03% 0.73% 0.87% 05/02/2005
Fidelity® VIP Freedom Fund 2020 Portfolio - Service Class 28,12,14 04/26/2005 -1.01% 4.27% 3.66% -1.87% 1.97% 1.12% 05/02/2005
Nationwide DestinationSM Navigator 2.0
Investment ChoicesA. Non-standardized Performance:
Average Annual Total Returnsas of 04/30/18
B. Standardized Performance:Average Annual Total Returns
as of 03/31/18
Underlying Investment Option InceptionDate
OneYear
FiveYears
10 Yearsor Since
Inception
OneYear
FiveYears
10 Yearsor Since
Inclusion
InclusionDate
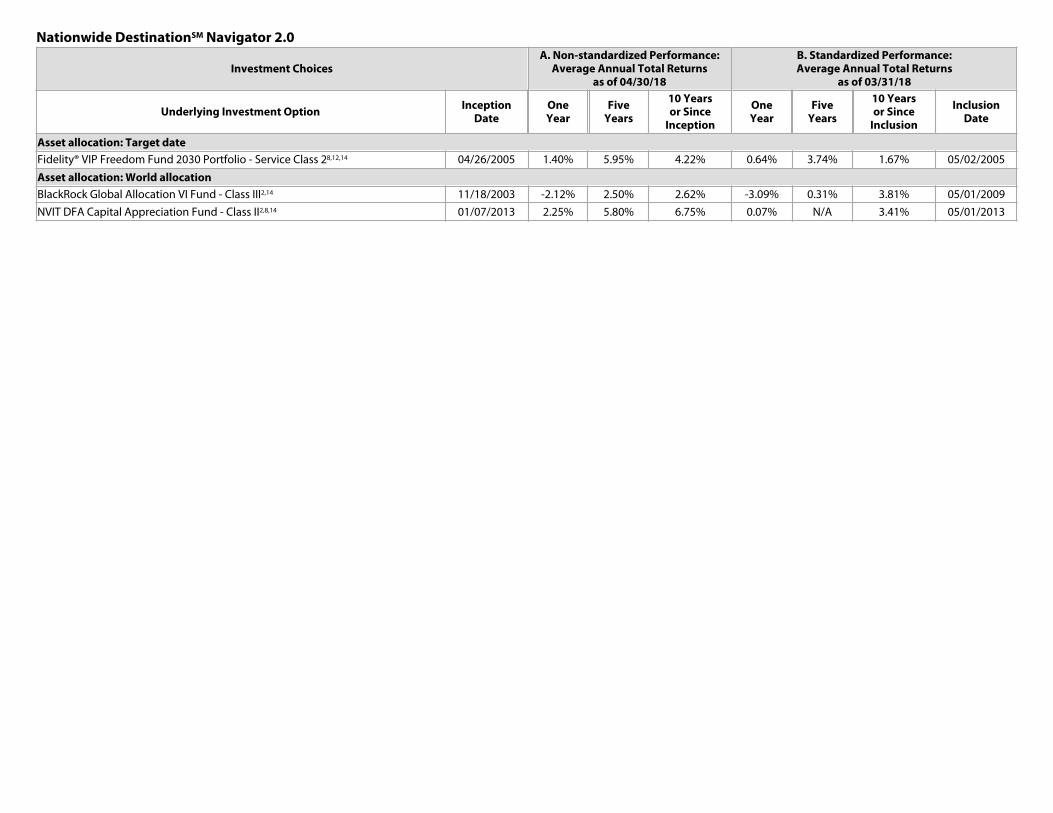
Asset allocation: Target date
Fidelity® VIP Freedom Fund 2030 Portfolio - Service Class 28,12,14 04/26/2005 1.40% 5.95% 4.22% 0.64% 3.74% 1.67% 05/02/2005
Asset allocation: World allocation
BlackRock Global Allocation VI Fund - Class III2,14 11/18/2003 -2.12% 2.50% 2.62% -3.09% 0.31% 3.81% 05/01/2009
NVIT DFA Capital Appreciation Fund - Class II2,8,14 01/07/2013 2.25% 5.80% 6.75% 0.07% N/A 3.41% 05/01/2013
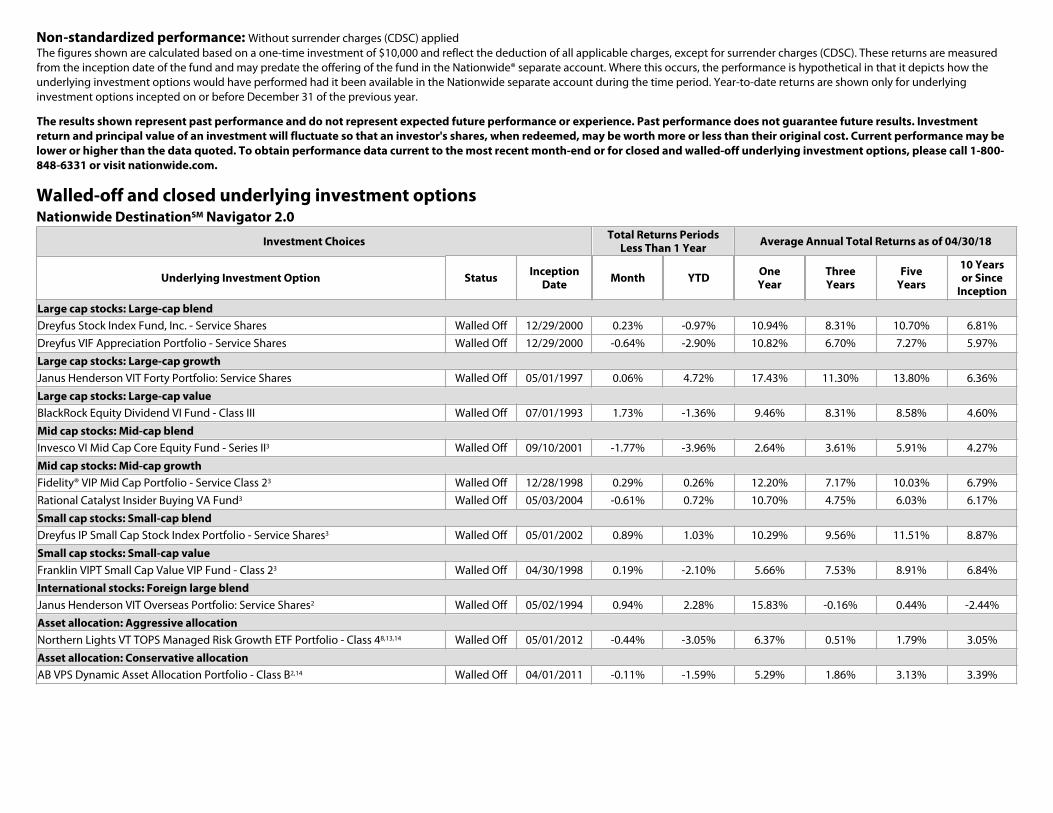
Non-standardized performance: Without surrender charges (CDSC) appliedThe figures shown are calculated based on a one-time investment of $10,000 and reflect the deduction of all applicable charges, except for surrender charges (CDSC). These returns are measured from the inception date of the fund and may predate the offering of the fund in the Nationwide® separate account. Where this occurs, the performance is hypothetical in that it depicts how the underlying investment options would have performed had it been available in the Nationwide separate account during the time period. Year-to-date returns are shown only for underlying investment options incepted on or before December 31 of the previous year.
The results shown represent past performance and do not represent expected future performance or experience. Past performance does not guarantee future results. Investment return and principal value of an investment will fluctuate so that an investor's shares, when redeemed, may be worth more or less than their original cost. Current performance may be lower or higher than the data quoted. To obtain performance data current to the most recent month-end or for closed and walled-off underlying investment options, please call 1-800-848-6331 or visit nationwide.com.
Walled-off and closed underlying investment optionsNationwide DestinationSM Navigator 2.0
Investment Choices Total Returns PeriodsLess Than 1 Year Average Annual Total Returns as of 04/30/18
Underlying Investment Option Status InceptionDate Month YTD One
YearThreeYears
FiveYears
10 Yearsor Since
Inception
Large cap stocks: Large-cap blend
Dreyfus Stock Index Fund, Inc. - Service Shares Walled Off 12/29/2000 0.23% -0.97% 10.94% 8.31% 10.70% 6.81%
Dreyfus VIF Appreciation Portfolio - Service Shares Walled Off 12/29/2000 -0.64% -2.90% 10.82% 6.70% 7.27% 5.97%
Large cap stocks: Large-cap growth
Janus Henderson VIT Forty Portfolio: Service Shares Walled Off 05/01/1997 0.06% 4.72% 17.43% 11.30% 13.80% 6.36%
Large cap stocks: Large-cap value
BlackRock Equity Dividend VI Fund - Class III Walled Off 07/01/1993 1.73% -1.36% 9.46% 8.31% 8.58% 4.60%
Mid cap stocks: Mid-cap blend
Invesco VI Mid Cap Core Equity Fund - Series II3 Walled Off 09/10/2001 -1.77% -3.96% 2.64% 3.61% 5.91% 4.27%
Mid cap stocks: Mid-cap growth
Fidelity® VIP Mid Cap Portfolio - Service Class 23 Walled Off 12/28/1998 0.29% 0.26% 12.20% 7.17% 10.03% 6.79%
Rational Catalyst Insider Buying VA Fund3 Walled Off 05/03/2004 -0.61% 0.72% 10.70% 4.75% 6.03% 6.17%
Small cap stocks: Small-cap blend
Dreyfus IP Small Cap Stock Index Portfolio - Service Shares3 Walled Off 05/01/2002 0.89% 1.03% 10.29% 9.56% 11.51% 8.87%
Small cap stocks: Small-cap value
Franklin VIPT Small Cap Value VIP Fund - Class 23 Walled Off 04/30/1998 0.19% -2.10% 5.66% 7.53% 8.91% 6.84%
International stocks: Foreign large blend
Janus Henderson VIT Overseas Portfolio: Service Shares2 Walled Off 05/02/1994 0.94% 2.28% 15.83% -0.16% 0.44% -2.44%
Asset allocation: Aggressive allocation
Northern Lights VT TOPS Managed Risk Growth ETF Portfolio - Class 48,13,14 Walled Off 05/01/2012 -0.44% -3.05% 6.37% 0.51% 1.79% 3.05%
Asset allocation: Conservative allocation
AB VPS Dynamic Asset Allocation Portfolio - Class B2,14 Walled Off 04/01/2011 -0.11% -1.59% 5.29% 1.86% 3.13% 3.39%
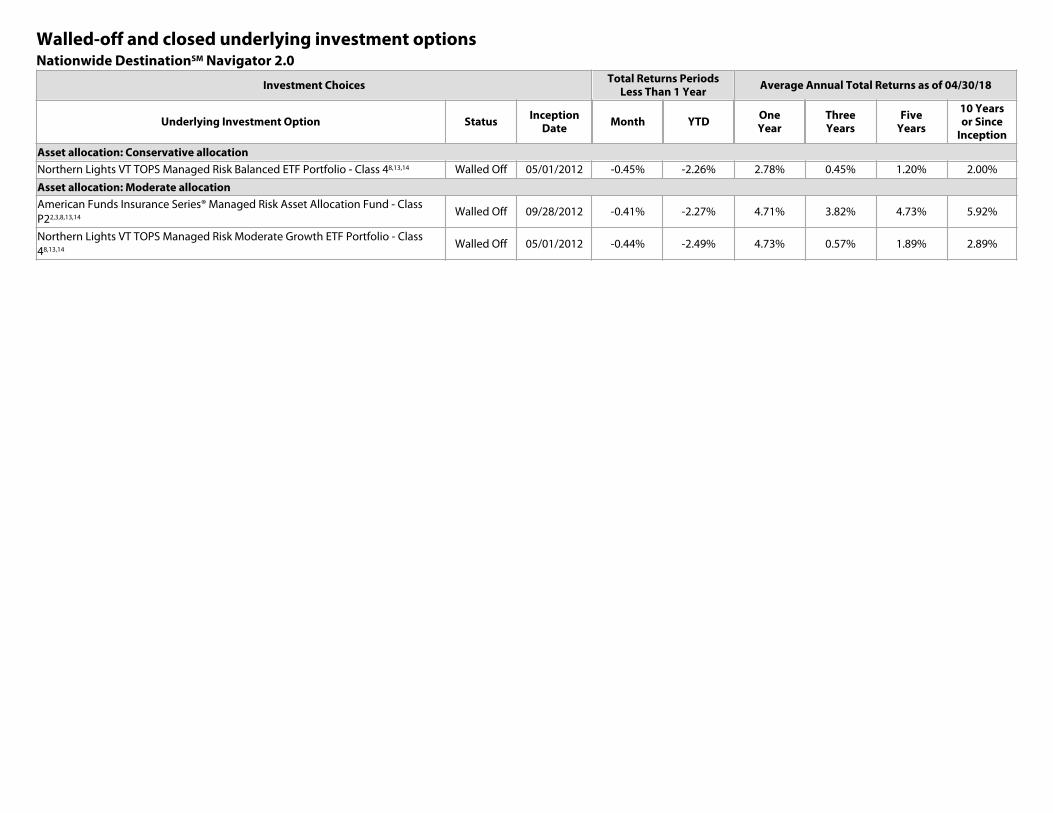
Walled-off and closed underlying investment optionsNationwide DestinationSM Navigator 2.0
Investment Choices Total Returns PeriodsLess Than 1 Year Average Annual Total Returns as of 04/30/18
Underlying Investment Option Status InceptionDate Month YTD One
YearThreeYears
FiveYears
10 Yearsor Since
Inception
Asset allocation: Conservative allocation
Northern Lights VT TOPS Managed Risk Balanced ETF Portfolio - Class 48,13,14 Walled Off 05/01/2012 -0.45% -2.26% 2.78% 0.45% 1.20% 2.00%
Asset allocation: Moderate allocation
American Funds Insurance Series® Managed Risk Asset Allocation Fund - Class P22,3,8,13,14
Walled Off 09/28/2012 -0.41% -2.27% 4.71% 3.82% 4.73% 5.92%
Northern Lights VT TOPS Managed Risk Moderate Growth ETF Portfolio - Class 48,13,14
Walled Off 05/01/2012 -0.44% -2.49% 4.73% 0.57% 1.89% 2.89%
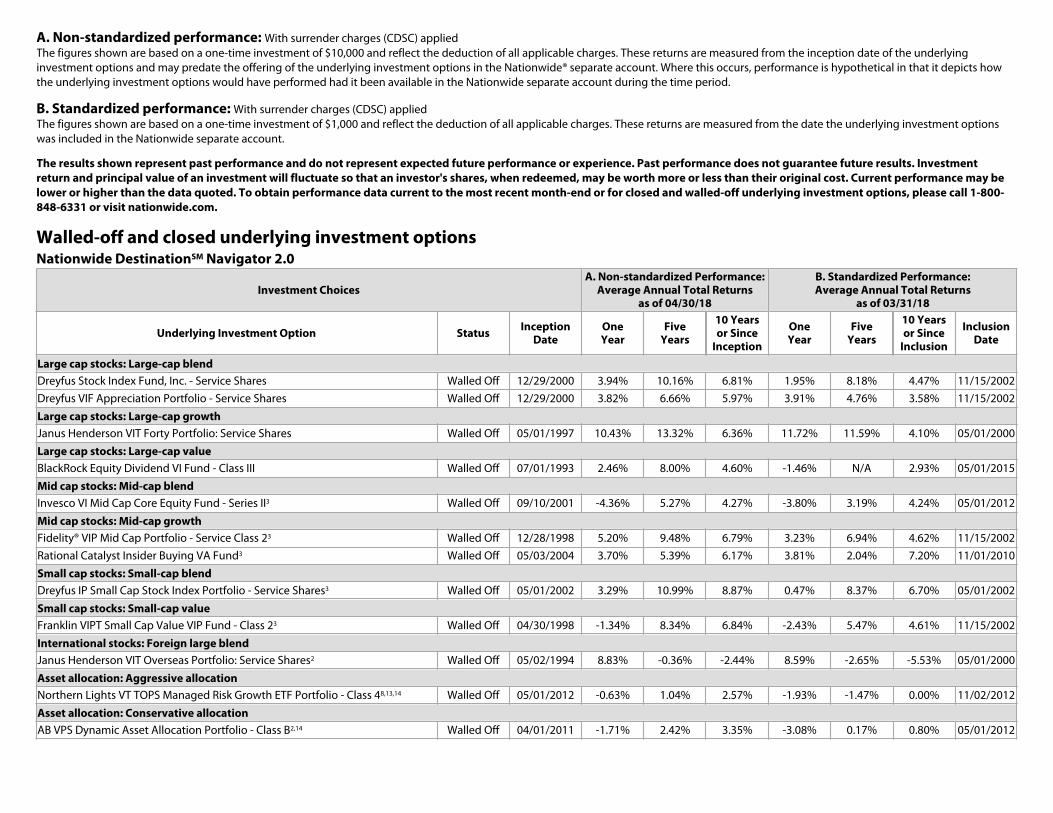
A. Non-standardized performance: With surrender charges (CDSC) appliedThe figures shown are based on a one-time investment of $10,000 and reflect the deduction of all applicable charges. These returns are measured from the inception date of the underlying investment options and may predate the offering of the underlying investment options in the Nationwide® separate account. Where this occurs, performance is hypothetical in that it depicts how the underlying investment options would have performed had it been available in the Nationwide separate account during the time period.
B. Standardized performance: With surrender charges (CDSC) appliedThe figures shown are based on a one-time investment of $1,000 and reflect the deduction of all applicable charges. These returns are measured from the date the underlying investment options was included in the Nationwide separate account.
The results shown represent past performance and do not represent expected future performance or experience. Past performance does not guarantee future results. Investment return and principal value of an investment will fluctuate so that an investor's shares, when redeemed, may be worth more or less than their original cost. Current performance may be lower or higher than the data quoted. To obtain performance data current to the most recent month-end or for closed and walled-off underlying investment options, please call 1-800-848-6331 or visit nationwide.com.
Walled-off and closed underlying investment optionsNationwide DestinationSM Navigator 2.0
Investment ChoicesA. Non-standardized Performance:
Average Annual Total Returnsas of 04/30/18
B. Standardized Performance:Average Annual Total Returns
as of 03/31/18
Underlying Investment Option Status InceptionDate
OneYear
FiveYears
10 Yearsor Since
Inception
OneYear
FiveYears
10 Yearsor Since
Inclusion
InclusionDate
Large cap stocks: Large-cap blend
Dreyfus Stock Index Fund, Inc. - Service Shares Walled Off 12/29/2000 3.94% 10.16% 6.81% 1.95% 8.18% 4.47% 11/15/2002
Dreyfus VIF Appreciation Portfolio - Service Shares Walled Off 12/29/2000 3.82% 6.66% 5.97% 3.91% 4.76% 3.58% 11/15/2002
Large cap stocks: Large-cap growth
Janus Henderson VIT Forty Portfolio: Service Shares Walled Off 05/01/1997 10.43% 13.32% 6.36% 11.72% 11.59% 4.10% 05/01/2000
Large cap stocks: Large-cap value
BlackRock Equity Dividend VI Fund - Class III Walled Off 07/01/1993 2.46% 8.00% 4.60% -1.46% N/A 2.93% 05/01/2015
Mid cap stocks: Mid-cap blend
Invesco VI Mid Cap Core Equity Fund - Series II3 Walled Off 09/10/2001 -4.36% 5.27% 4.27% -3.80% 3.19% 4.24% 05/01/2012
Mid cap stocks: Mid-cap growth
Fidelity® VIP Mid Cap Portfolio - Service Class 23 Walled Off 12/28/1998 5.20% 9.48% 6.79% 3.23% 6.94% 4.62% 11/15/2002
Rational Catalyst Insider Buying VA Fund3 Walled Off 05/03/2004 3.70% 5.39% 6.17% 3.81% 2.04% 7.20% 11/01/2010
Small cap stocks: Small-cap blend
Dreyfus IP Small Cap Stock Index Portfolio - Service Shares3 Walled Off 05/01/2002 3.29% 10.99% 8.87% 0.47% 8.37% 6.70% 05/01/2002
Small cap stocks: Small-cap value
Franklin VIPT Small Cap Value VIP Fund - Class 23 Walled Off 04/30/1998 -1.34% 8.34% 6.84% -2.43% 5.47% 4.61% 11/15/2002
International stocks: Foreign large blend
Janus Henderson VIT Overseas Portfolio: Service Shares2 Walled Off 05/02/1994 8.83% -0.36% -2.44% 8.59% -2.65% -5.53% 05/01/2000
Asset allocation: Aggressive allocation
Northern Lights VT TOPS Managed Risk Growth ETF Portfolio - Class 48,13,14 Walled Off 05/01/2012 -0.63% 1.04% 2.57% -1.93% -1.47% 0.00% 11/02/2012
Asset allocation: Conservative allocation
AB VPS Dynamic Asset Allocation Portfolio - Class B2,14 Walled Off 04/01/2011 -1.71% 2.42% 3.35% -3.08% 0.17% 0.80% 05/01/2012
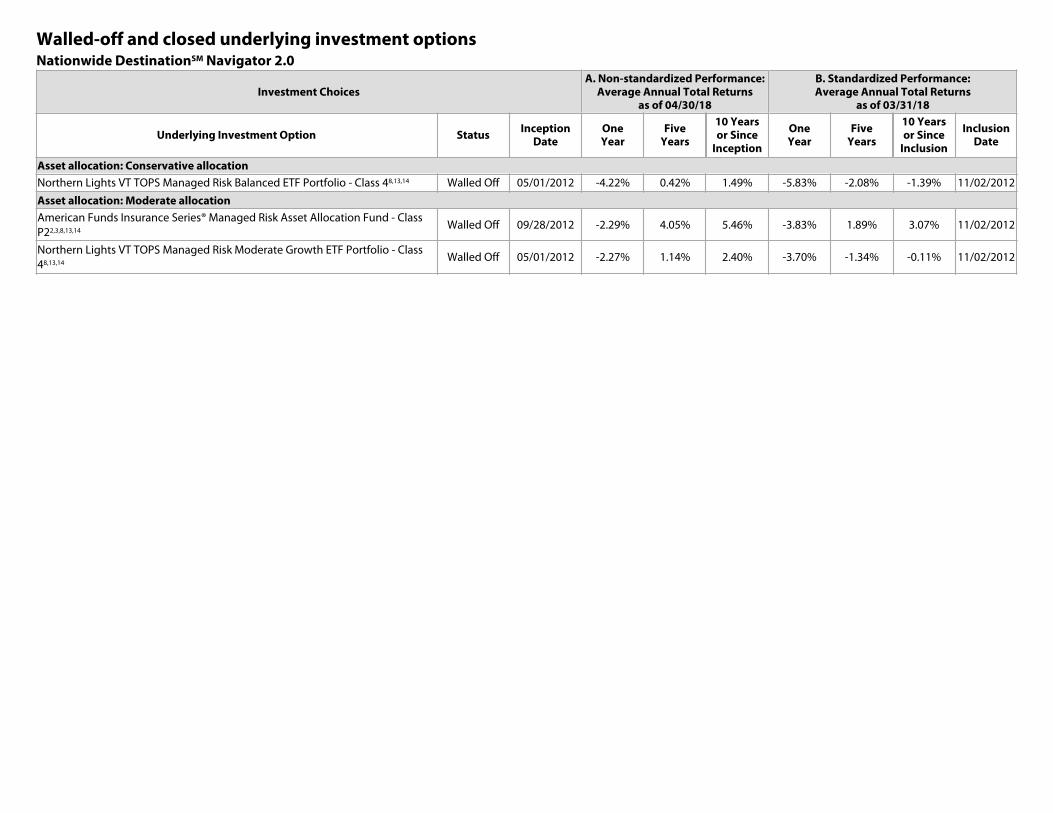
Walled-off and closed underlying investment optionsNationwide DestinationSM Navigator 2.0
Investment ChoicesA. Non-standardized Performance:
Average Annual Total Returnsas of 04/30/18
B. Standardized Performance:Average Annual Total Returns
as of 03/31/18
Underlying Investment Option Status InceptionDate
OneYear
FiveYears
10 Yearsor Since
Inception
OneYear
FiveYears
10 Yearsor Since
Inclusion
InclusionDate
Asset allocation: Conservative allocation
Northern Lights VT TOPS Managed Risk Balanced ETF Portfolio - Class 48,13,14 Walled Off 05/01/2012 -4.22% 0.42% 1.49% -5.83% -2.08% -1.39% 11/02/2012
Asset allocation: Moderate allocation
American Funds Insurance Series® Managed Risk Asset Allocation Fund - Class P22,3,8,13,14
Walled Off 09/28/2012 -2.29% 4.05% 5.46% -3.83% 1.89% 3.07% 11/02/2012
Northern Lights VT TOPS Managed Risk Moderate Growth ETF Portfolio - Class 48,13,14
Walled Off 05/01/2012 -2.27% 1.14% 2.40% -3.70% -1.34% -0.11% 11/02/2012

Understanding Risks
Here's a list of some of the risks associated with the variable annuity underlying investment choices. For specific risks related to each investment, see the prospectus.
1. Money market funds: Funds are not insured or guaranteed by the Federal Deposit Insurance Corporation or any other government agency. Although they seek to preserve the value of the investment at $1.00 per share, it’s possible to lose money by investing in the fund. The fund may impose a fee upon sale of shares or temporarily suspend the ability to sell shares if the fund's liquidity falls below required minimums because of market conditions or other factors.
2. International/emerging markets funds: Funds that invest internationally involve risks not associated with investing solely in the United States, such as currency fluctuation, political risk, differences in accounting and the limited availability of information.
3. Small-/Mid-cap funds: Funds investing in stocks of small-cap, mid-cap or emerging companies may have less liquidity than those investing in larger, established companies and may be subject to greater price volatility and risk than the overall stock market.
4. High-yield funds: Funds that invest in high-yield securities are subject to greater credit risk, liquidity risk, and price fluctuations than funds that invest in higher-quality securities. The prices of high-yield bonds tend to be more sensitive to adverse economic and business conditions than are higher-rated corporate bonds. Increased volatility may reduce the market value of high-yield bonds. They are also subject to the claims-paying ability of the issuing company.
5. Nondiversified funds: Funds that invest in a concentrated sector or focus on a relatively small number of securities may be subject to greater volatility than a more diversified investment.
6. Government funds: While the funds invest primarily in the securities of the U.S. government and its agencies, the values are not guaranteed by these entities.
7. Real estate funds: Funds that focus on real estate investing are sensitive to economic and business cycles, changing demographic patterns and government actions.
8. Fund-of-funds: Designed to provide diversification and asset allocation across several types of investments and asset classes, primarily by investing in underlying funds. Therefore, in addition to the expenses of the portfolio, you are indirectly paying a proportionate share of the applicable fees and expenses of the underlying funds.
9. Bond funds: These funds have the same interest rate, inflation and credit risks associated with the underlying bonds owned by the fund. Interest rate risk is the possibility of a change in the value of a bond due to changing interest rates. Inflation risk arises from the decline in value of cash flows due to loss of purchasing power. Credit risk is the potential loss on an investment based on the bond issuer's failure to repay on the amount borrowed.
10. A short-term trading fee may apply for exchanges made within 60 days of original allocation to this fund. Please refer to the prospectus for details.
11. For six trades occurring within a calendar quarter, Nationwide will issue a warning letter. If there are more than 11 trades in two consecutive quarters or 20 trades occurring within a calendar year involving limited transfer funds, Nationwide may limit contract owner to submitting transfer requests involving limited transfer funds via U.S. mail on a Nationwide-issued form. See prospectus for more details.
12. Target Date/Maturity funds: For products that do include Target Date/Maturity funds please keep in mind that like other funds, target date funds are subject to market risk and loss. Loss of principal can occur at any time, including before, at or after the target date. There is no guarantee that target date funds will provide enough income for retirement.
13. Managed volatility funds: Funds that are designed to offer traditional long-term investments blended with a strategy that seeks to mitigate risk and manage portfolio volatility. These funds may not be successful in reducing volatility, and it is possible that the funds' volatility management strategies could result in losses greater than if the funds did not use such strategies.
14. Asset allocation funds: These funds may invest across multiple asset classes including, but not limited to, domestic and foreign stocks, bonds, and cash. The use of diversification and asset allocation as a part of an overall investment strategy does not assure a profit or protect against loss in declining market.
15. Commodities/Natural resources: Specific uncertainties associated with commodities and natural resources investing include changes in supply-and-demand relationships due to environmental, economic and political factors, which may cause increased volatility and decreased liquidity.
16. These funds may provide less common return patterns than traditional equity or fixed income. These funds incorporate investment strategies that may increase or decrease volatility due to the fund's use of options or futures. Leveraged exposure can result in accelerated losses as well as accelerated gains, depending on how the market moves.
Contract/Policy numbers: All state variations of: VAC-0120AO; In OK: VAC-0120OKPP.1

Finding solutions that fitYour investment professional is a personal resource with the knowledge
and commitment to help you determine how to best meet your
investment and life insurance needs. Working with him or her, you can
learn more about how Nationwide’s many products can help you achieve
your financial goals. For more information, visit nationwide.com.
This material is not a recommendation to buy, sell, hold or rollover any asset, adopt an investment strategy, retain a specific investment manager or use a particular account type. It does not take into account the specific investment objectives, tax and financial condition, or particular needs of any specific person. Investors should work with their financial professional to discuss their specific situation.
Issued by Nationwide Life Insurance Company or Nationwide Life and Annuity Insurance Company, Columbus, Ohio. The general distributor is Nationwide Investment Services Corporation, member FINRA.
Nationwide Funds distributed by Nationwide Fund Distributors LLC (NFD), member FINRA, King of Prussia, Pa. NFD is not affiliated with any subadviser contracted by Nationwide Fund Advisors (NFA), with the exception of Nationwide Asset Management, LLC (NWAM).
For the specific contract number, please refer to the variable annuity investment choices performance report inside.
Nationwide, Nationwide is on your side and the Nationwide N and Eagle are service marks of Nationwide Mutual Insurance Company. Nationwide Destination, The Nationwide Lifetime Income Rider, Nationwide Lifetime Income Capture and Nationwide Lifetime Income Track are service marks of Nationwide Mutual Insurance Company.
© 2018 Nationwide Mutual Insurance Company
VAX-0317AO-0418
• Not a deposit • Not FDIC or NCUSIF insured • Not guaranteed by the institution • Not insured by any federal government agency • May lose value