investment banking relationships and analyst affiliation...
TRANSCRIPT
Investment Banking Relationships and Analyst Affiliation Bias: The Impact of the Global Settlement on Sanctioned and Non-Sanctioned Banks
Shane A. Corwin* Mendoza College of Business
University of Notre Dame Notre Dame, IN 46556
Stephannie Larocque Mendoza College of Business
University of Notre Dame Notre Dame, IN 46556
Mike Stegemoller Hankamer School of Business
Baylor University Waco, TX 76798
February 2016
Abstract
We examine the impact of the Global Settlement on affiliation bias in analyst recommendations. Using a broad measure of investment bank-firm relationships, we find a substantial reduction in analyst affiliation bias following the settlement for sanctioned banks. In contrast, we find strong evidence of bias both before and after the settlement for affiliated analysts at non-sanctioned banks. Our results suggest that the settlement led to an increase in the expected costs of issuing biased coverage at sanctioned banks, while concurrent SRO rule changes were largely ineffective at reducing the influence of investing banking on analyst research at large non-sanctioned banks.
JEL classification: G10, G24, G34, L14
Keywords: Analysts, Recommendations, Investment Banking, Investment Banking Relationships
* We thank Robert Battalio, Larry Brown, Akash Chattopadhyay, Gus De Franco, Trevor Harris, Marcus Kirk, Tim Loughran, Hai Lu, Paul Schultz, Beverly Walther, seminar participants at The Ohio State University and the University of Notre Dame, and participants at the American Accounting Association Annual Meeting and the Notre Dame Accounting Research Conference for helpful comments. Steven Carroll, Brian Ford, and Travis Johnson provided excellent research assistance. Any remaining errors are the responsibility of the authors.
1
1. Introduction
Conflicts of interest within financial institutions have received significant attention from both
regulators and academics (see Mehran and Stulz (2007) for a discussion). One area of particular focus is
the inherent conflict that arises when financial institutions provide both analyst research and investment
banking services. At the heart of this conflict is the idea that analysts provide optimistic research coverage
in an attempt to curry favor with their firm’s existing clients or to win future investment banking business
from covered firms. Consistent with this, prior research finds that analysts are overly optimistic when
their employers have underwriting relationships with covered firms (Dugar and Nathan 1995; Lin and
McNichols 1998) and that biased recommendations improve a bank’s chances of winning future
underwriting mandates (Ljungqvist, Marston, and Wilhelm 2009).
Regulatory scrutiny of analyst research peaked in the early 2000s, leading to the 2003 Global
Analyst Research Settlement (the settlement).1 A primary goal of both the settlement and concurrent
changes to self-regulatory organization (SRO) rules was to reduce conflicts of interest by separating the
investment banking and research roles within banks. Previous studies suggest that analysts changed their
behavior following the settlement (see, for example, Kadan, Madureira, Wang, and Zach 2009). However,
survey evidence from Brown, Call, Clement, and Sharp (2015) and continuing enforcement actions
related to analyst research suggest that these conflicts may not have been completely eliminated.2 Further,
prior research provides little evidence on the relative effectiveness of the settlement vs. industry-wide
SRO rules or on the differential impact of the settlement on sanctioned and non-sanctioned banks. While
SRO rule changes may have affected analyst behavior, we argue that the investigation and punishment of
the 12 sanctioned banks led to a substantial increase in the expected costs of issuing biased
1 The Global Analyst Research Settlement was reached between the SEC, NYSE, NASD, New York Attorney General, and North American Securities Administrators Association and 12 of the largest investment banks. The original settlement included Bear Stearns, CSFB, Goldman Sachs, JP Morgan, Lehman Brothers, Merrill Lynch, Morgan Stanley, Citigroup, UBS Warburg, and U.S. Bancorp Piper Jaffray, with Deutsche Bank and Thomas Weisel added in 2004. We refer to these 12 banks (and subsequent name variations) as “sanctioned banks”. 2 From 2005 to 2010, FINRA took 10 enforcement actions related to analyst research and investment banking conflicts and the SEC took three such enforcement actions (GAO 2012). More recently, FINRA fined Citigroup $15 million in November 2014 for violations involving research analysts and IPO roadshows and fined 10 investment banks a total of $43.5 million in December 2014 for violations related to the Toys “R” Us IPO.
2
recommendations for this subset of banks. We therefore expect a more pronounced decrease in affiliation
bias at sanctioned banks than at other large non-sanctioned banks.
To test this hypothesis, we investigate analyst affiliation bias at sanctioned and non-sanctioned
banks between 1998 and 2009. Our main variable of interest is the analyst’s relative recommendation,
defined as the difference between the analyst’s recommendation and the median recommendation across
all analysts covering the stock. We examine the link between this variable and measures of affiliation,
allowing for differences before and after the settlement and across the two types of banks. Following prior
research, we define an affiliated analyst as one whose employer has an investment banking relationship
with the covered firm. While existing studies focus primarily on affiliation through equity underwriting
relationships3, we note that equity underwriting is only one of many services that investment banks
provide. For the 2015 fiscal year, for example, equity underwriting accounted for only 22% of total
investment banking revenues at Goldman Sachs, compared to 49% and 29% for financial advising and
debt underwriting, respectively. We therefore analyze affiliation through equity, debt, and M&A
relationships, both individually and in combination.
Consistent with prior research, we find strong evidence of affiliation bias prior to the settlement
for both types of banks. However, results from the post-settlement period point to stark differences across
banks. While we find some evidence of affiliation bias at sanctioned banks following the settlement, the
bias is reduced by as much as 81% relative to the pre-settlement period. In contrast, affiliated analysts at
non-sanctioned banks continue to exhibit strong bias after the settlement. These findings are robust to
several alternative specifications and affiliation measures, and are not driven by the shift of many
investment banks from five-tier to three-tier recommendation schemes following the settlement. In
addition, logit models show that the continued post-settlement affiliation bias at non-sanctioned banks is
evident in both more frequent positive recommendations and less frequent negative recommendations.
A more detailed analysis of the post-settlement period reveals that affiliation bias at sanctioned
3 Exceptions include Ljungqvist, Marston, Starks, Wei, and Yan (2007), who investigate both equity and debt underwriting affiliations, and Kolasinski and Kothari (2008), who study analyst conflicts tied to M&A advisory relationships.
3
banks continues to dissipate in the years following the settlement and is eliminated by the end of our
sample period. Moreover, the lingering bias at these banks immediately following the settlement appears
to stem from analysts who were employed prior to the settlement. Over time, these analysts are replaced
with new analysts who exhibit no affiliation bias. This distinction between old and new analysts suggests
that the long-term reduction in affiliation bias at sanctioned banks reflects a shift in culture, hiring, or
training practices following the settlement. We find no such distinction at non-sanctioned banks, where
both old and new analysts exhibit affiliation bias throughout the post-settlement period.
Our research contributes to the broad literature on conflicts of interest within financial institutions
and, in particular, to studies that examine the effects of the Global Settlement on analyst behavior. These
studies show that Buy (Sell) recommendations became less (more) frequent after the settlement, with the
reduction in optimism being most pronounced for investment bank, and particularly sanctioned bank,
analysts (Barber, Lehavy, McNichols, and Trueman 2006; Kadan et al. 2009; Clarke, Khorana, Patel, and
Rau 2011; and Guan, Lu, and Wong 2012).4 Our work is most closely related to Kadan et al. (2009), who
find that affiliated analysts are less likely to issue optimistic recommendations after the settlement, but
remain reluctant to issue pessimistic recommendations. We add to this literature by examining the
differential impact of the settlement and contemporaneous regulatory changes on analyst affiliation bias at
sanctioned and non-sanctioned banks. We also examine the link between affiliation bias and the equity,
debt, and M&A components of investment banking relationships.
In summary, we document a sharp reduction in analyst affiliation bias at sanctioned banks that is
consistent with the settlement leading to a significant increase for these banks in the expected costs of
producing biased coverage. At the same time, the limited impact on non-sanctioned banks suggests that
industry-wide SRO rules were largely ineffective at reducing the influence of investment banking on
analyst research.
4 Prior research also suggests that the settlement brought analysts’ recommendations more in line with their earnings forecasts (Barniv, Hope, Myring, and Thomas 2009; Chen and Chen 2009). In unreported results we also examined the relation between affiliation and earnings forecasts. While we find some evidence of optimistic forecasts by affiliated analysts at sanctioned banks in the period prior to the settlement, we find little evidence of such a link for sanctioned banks in the post period or for non-sanctioned banks in either the pre or post period.
4
The remainder of the paper is organized as follows. Section 2 describes prior evidence on analyst
affiliation bias, summarizes the history and features of the settlement, and develops the economic
rationale for differences between sanctioned and non-sanctioned banks. In Section 3, we describe our data
and sample construction. Section 4 presents our main findings and Section 5 provides additional evidence
related to the post-settlement period. Section 6 concludes.
2. Background and Hypothesis Development
2.1. The Costs and Benefits of Analyst Affiliation Bias
There is considerable evidence that affiliated analysts issue more optimistic recommendations,
earnings forecasts, and long-term growth forecasts than unaffiliated analysts (Dugar and Nathan 1995;
Lin and McNichols 1998; and Dechow, Hutton, and Sloan 2000) and are slower to reveal negative news
(O’Brien, McNichols, and Lin 2005).5 The existence of this affiliation bias suggests that analyst optimism
has benefits. At the firm level, banks appear to benefit through an increase in future business. In
particular, while Ljungqvist, Marston, and Wilhelm (2006) find little evidence of a direct link between
analyst optimism and future lead underwriting mandates, Ljungqvist et al. (2009) show that optimistic
coverage increases the likelihood of winning co-managing appointments, which in turn lead to future lead
mandates. This increased business may also lead to direct benefits for the individual analysts, to the extent
that their compensation or status within the firm is tied to investment banking revenues.
Given the potential benefits, economic theory suggests that the decision to produce biased
recommendations will reflect a cost-benefit tradeoff, where the expected costs depend on both the
likelihood of being detected and the costs imposed on the analyst or their firm if detected (Becker 1968).
Prior research provides some evidence of this tradeoff. For example, Cowen, Groysberg, and Healy
(2006) find that affiliation bias is lower for bulge bracket investment banks than for lower-tier banks,
5 Malmendier and Shanthikumar (2014) find that affiliated analysts strategically issue more positive recommendations, but similar or more negative forecasts, than unaffiliated analysts. More generally, Bradshaw, Richardson, and Sloan (2006) find that a firm’s level of external financing is an important driver of analyst optimism, such that even unaffiliated analysts may bias their coverage in anticipation of future business. Examining the impact of affiliation bias on investors, Michaely and Womack (1999) find that buy recommendations by affiliated analysts underperform those of other analysts and De Franco, Lu, and Vasvari (2007) provide evidence of a wealth transfer from individuals to institutional investors in cases where analysts’ public disclosures differ from their revealed private beliefs.
5
suggesting that the reputational concerns of large banks at least partially offset the benefits of biased
analyst coverage. Further, Ljungqvist et al. (2007) argue that analysts’ career concerns lead them to be
less biased in stocks that are highly visible to institutional investors, on whom the analysts rely for
performance ratings and trading commissions.
We argue that the settlement resulted in a substantial increase in the expected costs of issuing
biased research coverage for the 12 sanctioned banks, providing an economic rationale for expecting
differences across the two types of banks. In particular, we expect the resulting shift in the cost-benefit
tradeoff to lead to a reduction in affiliation bias at sanctioned banks that is larger than any change for non-
sanctioned banks. Below, we summarize the main features of the settlement and concurrent SRO rule
changes, and describe the impact of the settlement on the cost-benefit tradeoff faced by analysts firms.
2.2. Investigations into Conflicts of Interest and the Global Settlement
Allegations of analyst research tainted by investment banking conflicts attracted the attention of
regulators following the dot-com bubble of the late 1990s. In 2001, New York Attorney General Elliot
Spitzer began investigating these issues at Merrill Lynch, reaching a settlement agreement with the firm
in May 2002. Following this agreement, Spitzer combined forces with the SEC, the NYSE, the NASD,
and several state regulators to expand the investigation to 11 other top investment banks.6 The
investigation culminated in 2003 with the Global Analyst Research Settlement. In total, the settlement
required the payment of nearly $1.5 billion, including $935 million in penalties and disgorgement, $460
million to fund independent research, and $85 million to fund investor education. In addition, the
settlement required the 12 sanctioned banks to implement numerous structural reforms designed to
minimize the influence of investment banking on analyst research.
While Spitzer’s investigation was prominent in the headlines, ties between analyst research and
investment banking were simultaneously under examination by other regulators and lawmakers. Through 6 Cassidy (2003) provides a detailed discussion of the investigation. Although specific events may have drawn the attention of regulators to some banks, including Merrill Lynch, our (untabulated) examination of bank-specific levels of affiliation bias suggests that the selection of these banks was related primarily to market share rather than pre-period bias. Among the 12 banks, only Thomas Weisel and U.S. Bancorp were ranked outside the top ten in Investment Dealers’ Digest’s league tables based on U.S. common stock offerings from January through June of 2002, with Thomas Weisel ranked 14th based on common stock and U.S. Bancorp ranked 12th based on IPOs.
6
the Sarbanes-Oxley Act (SOX) in 2002, Congress charged the SEC and securities industry SROs with
addressing conflicts of interest involving analysts. The NYSE subsequently amended its Rule 351
(Reporting Requirements) and Rule 472 (Communications with the Public), while the NASD released
Rule 2711 (Research Analysts and Research Reports). These rule changes, along with subsequent
amendments, imposed many of the same structural changes as the settlement, but at an industry-wide
level.7 For example, both the settlement and SRO rules prohibited investment banking involvement in the
supervision or evaluation of research analysts and eliminated any direct link between investment banking
revenues and analyst compensation. Further, both the settlement and SRO rules established significant
firewalls regarding communication between research and investment banking personnel, prohibited
analysts from participating in road shows or other efforts to solicit investment banking business, and
required research reports to disclose investment banking ties to covered firms.
Despite these similarities, there were important differences between the structural changes
imposed by the settlement and the SRO rules. For example, the settlement required all sanctioned banks
to pay for and provide their customers access to independent research and required most of the sanctioned
banks to fund investor education. The settlement also went beyond the communication firewalls imposed
by SRO rules, requiring the physical separation of the research and investment banking departments, a
separate legal/compliance staff dedicated to research, and an oversight committee to review and monitor
research quality.8 Some have argued that these differences created an environment in which non-
sanctioned banks operate under a different set of rules than sanctioned banks. For example, in a 2012
report to Congress, the Government Accountability Office (GAO) notes that sanctioned banks are
7 Following their initial approval in May 2002, the SRO rules were subsequently amended to further promote the objectivity of research analysts and to comply with the requirements of SOX and the JOBS Act. In November 2014, FINRA proposed a consolidated rule (Rule 2241) that would take the place of NASD Rule 2711 and NYSE Rule 472. This rule proposal remains under consideration by the SEC. 8 In August 2009, the remaining sanctioned banks submitted a motion to the court proposing modifications to the terms of the settlement on the basis that many of these provisions were now covered by SRO rules. The court approved the majority of the proposed modifications in March 2010, but denied a proposal to allow communication between investment bankers and analysts. In denying this proposal, the judge stated that it “would undermine the separation between research and investment banking.” Other important components of the settlement that were not addressed in the proposed change and remain in effect include the physical separation of and separate reporting lines for research and investment banking, prohibition of investment banking input into the research budget and company-specific coverage decisions, and the requirement of research oversight committees.

7
“subject to the requirements of the settlement and the SRO research analyst rules, while other firms that
provide the same services are subject only to the SRO research analyst rules. As a result, investors may
not be provided the same level of protection” across the two sets of banks (GAO 2012).9
Perhaps the most important distinction between the settlement and the SRO rules was the
payment of substantial penalties and disgorgement by the 12 sanctioned banks. Beyond the monetary
costs, these penalties likely resulted in a loss of reputational capital. For example, in a May 2003 Senate
hearing on the impact of the Global Settlement, SEC Chairman William H. Donaldson stated that “the
cost in reputation that these acts have brought forth is incalculable in terms of the damage done to these
institutions and the years and monies that were spent to establish their reputations.” It is also likely that
the investigations of these 12 banks increased their litigation risk. In the same Senate hearing, Chairman
Donaldson noted that related civil penalties could exceed the penalties paid as part of the settlement.
While the immediate costs to sanctioned banks were substantial, we argue that the settlement also
increased the expected future costs of producing biased coverage for these 12 banks. This increase in
expected costs derives from two possible channels. First, because these banks were included in the
original investigation and face ongoing monitoring by regulators, they likely face an increased
probability, either real or perceived, of being detected if they fail to comply with the new requirements.
Second, should the sanctioned banks be found to repeat their previous behavior, it is plausible that the
penalties in terms of fines, legal liability, and reputation would be at least as large as the original
settlement costs. Based on these arguments, we expect the cost-benefit tradeoff at sanctioned banks to
shift, resulting in a reduction in affiliation bias that is larger than any change for non-sanctioned banks.
3. Data and Sample Characteristics
We begin with the sample of all U.S. firms with listed common stock (CRSP share codes 10 or
11) between 1996 and 2009. We exclude firms classified as financials, utilities, and government 9 A 2004 Wall Street Journal Article highlighted this uneven playing field, arguing that smaller banks were slow to react to the new regulations and continued to issue more buy recommendations than sanctioned banks (Craig 2004). Ongoing differences between the two groups of banks were further illustrated following the passage of the JOBS Act in 2012, when sanctioned banks were reluctant to take advantage of less-restrictive rules for analysts following small firm IPOs (Demos 2012). The SEC subsequently confirmed that the JOBS Act does not relieve sanctioned banks from their obligations under the settlement. See the GAO Report to Congress (2012) and the NASD/NYSE Joint Report (2005) for a comparison of the settlement and SRO rules.
8
agencies (SIC codes 6000-6999, 4900-4999, and 9000-9999), because capital market decisions at these
firms may be affected by regulatory considerations and capital requirements. For the resulting sample of
8,322 firms, we collect information from SDC on all public and private issues of equity and debt by the
firm and any M&A transactions in which the firm is either the acquirer or the target. We identify firms
based on PERMCO in CRSP and CIDGEN in SDC. We then match firms between the two databases
using CUSIP and, where possible, ticker. To provide meaningful analysis of investment banking
relationships, we exclude transactions for which either the transaction value or the identity of the
underwriter/advisor is missing.
To analyze affiliation bias, we focus on the most important investment banks. We start with the
full sample of banks labeled as lead or co-managing underwriters in equity and debt issues or as advisors
in M&A transactions. We then calculate market share ranks on an annual basis for each transaction type
(equity, debt, and M&A) and compute each bank’s average market share rank in each transaction type
category across all years during which the bank appears in the sample. Finally, we limit our analysis to
those investment banks with an average market share rank of 25 or higher in at least one category. In
cases where a top 25 bank reflects the merger of two or more predecessor banks, all predecessor banks are
also included. As shown in Table A1 in the Appendix, the resulting sample includes 57 different
investment bank names during the sample period, with 48 active at the beginning of the period and 28
active at the end of the period.10
We collect analyst recommendations from I/B/E/S and link the recommendations to the sample of
CRSP firms using CUSIPs. We then hand-match the broker names in I/B/E/S to the sample investment
banks using the I/B/E/S broker translation file. Following Ljungqvist et al. (2007), we examine
recommendations quarterly. For each quarter end and each firm in our sample, we select the most recent
recommendation issued during the preceding 12 months by each analyst covering the stock. We code 10 Investment bank names are cleaned to eliminate multiple variations of the same name and to adjust for mergers among banks. Following bank mergers, we assume that investment banking relationships from both predecessor banks are retained by the combined bank. For clarity following large investment bank mergers, we assign a new name to the combined bank. For example, we refer to the combination of Citibank and Salomon Smith Barney as Citigroup Salomon Smith Barney. The 28 ultimate banks considered here compare to 16 studied in Ljungqvist et al. (2006) and Ljungqvist et al. (2007). Lehman and Merrill Lynch are eliminated from the sample because their recommendations are excluded from I/B/E/S for all or part of our sample period.

9
recommendations as 1 (Strong Sell) through 5 (Strong Buy) and define each analyst’s relative
recommendation, RelRec, by subtracting the consensus (i.e., median) recommendation across all analysts
covering the firm in the same one-year window. Finally, we limit our sample to stocks covered by two or
more analysts, at least one of which must be employed by a sample investment bank. The resulting
sample includes 216,242 quarterly observations, involving 4,628 analysts and 5,111 stocks.
Our main empirical tests examine the relation between RelRec and investment banking
relationships, after controlling for firm, analyst, and investment bank characteristics that have been shown
to affect recommendations. The control variables are summarized below and defined in Appendix Table
A2. Our methodology closely follows that in Ljungqvist et al. (2007), with several important differences.
First, we examine investment banking relationships across a wider set of transaction types, including
equity, debt, and M&A transactions, as well as all combined transactions. Second, we examine affiliation
bias both before and after the settlement, allowing for differences between investment banks sanctioned in
the settlement and other large non-sanctioned banks.
To measure investment banking relationships, we examine each firm’s equity, debt, and M&A
transactions during the 36 months preceding each quarter end. We then define relationship indicator
variables that equal one if the investment bank acted as a lead or co-managing underwriter on one of the
firm’s equity or debt issues, or as an advisor on one of the firm’s M&A transactions.11 Relationships are
defined both by transaction type and across all combined transactions. We expect affiliation bias to be
better captured by overall relationships than type-specific relationships for two reasons. First, equity,
debt, and M&A transactions are discrete measures of what is likely an ongoing relationship. Thus, the use
of multiple transaction types should better capture the ongoing nature of any underlying relationship.
Second, any pressure placed on the analyst to produce optimistic coverage would only be magnified when
the relationship spans multiple functional areas.
11 While the majority of our tests utilize relationship indicator variables, we provide robustness tests using continuous relationship measures based on the proportion of each firm’s total transaction value for which the bank acted as lead or co-managing underwriter, or advisor. The continuous relationship measure averages 3.2%, 2.7%, and 2.4% based on equity, debt, and M&A transactions, respectively, and 5.9% based on combined transactions.

10
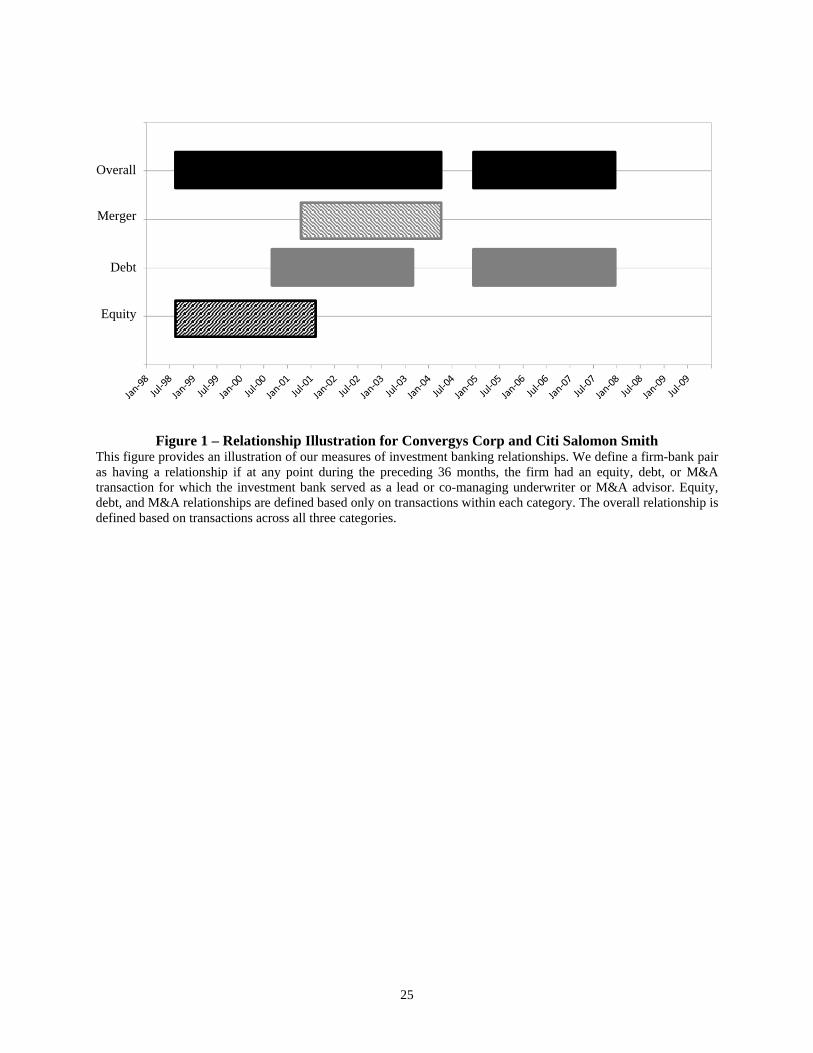
To illustrate the potential benefits of the overall relationship measure, Figure 1 plots the time
series of relationships between Convergys Corp. and Citi-Salomon-Smith, based on 36-month windows.
Convergys used this bank as lead equity underwriter in August 1998, as lead debt underwriter in
September 2000 and December 2004, and as an M&A advisor in April 2001. When we define
relationships based on individual transaction types, the relationship measures are spotty and cover only
subperiods. However, when we incorporate all three transaction types, we are able to capture the ongoing
nature of the relationship between Convergys and Citi-Salomon-Smith over nearly the entire period.
Our remaining control variables are motivated by prior literature and closely follow Ljungqvist et
al. (2007). We define investment bank size (Size) as the number of analysts employed by the bank during
quarter t, based on I/B/E/S recommendations, and investment bank market share (MktShare) as the
proportion of total deal value across all firms during the previous 12 months for which the bank acted as a
lead or co-managing underwriter or M&A advisor. Like the relationship measures, MktShare is defined
by transaction type and across all transactions.
We define six analyst-level characteristics. Seniority is the number of years since the analyst first
appeared in I/B/E/S and Seasoning is the number of years since the analyst initiated coverage on the
particular stock. NFollow is the number of firms followed by the analyst during the quarter and JobMove
is an indicator variable that equals 1 if the analyst changed employers during the quarter. Following Hong
and Kubik (2003), we define relative forecast accuracy (RelAccuracy) based on the analyst’s average
earnings forecast accuracy across all followed stocks. Finally, AllStar is an indicator variable that equals
one if the analyst is ranked as an All-Star by Institutional Investor during year t-1, and 0 otherwise.
To capture firm characteristics, we define four additional variables. ANF is the number of
analysts issuing recommendations for the firm during the previous 12 months and MV is the firm’s market
value of equity at the end of the prior calendar year. InstHoldings is the percentage of shares held by
institutional investors at the end of the quarter, based on Thomson Reuters’ 13F filings. Proceeds is
defined for equity, debt, M&A, and combined transactions, and equals the value of the firm’s transactions
11
during the previous 36 months.
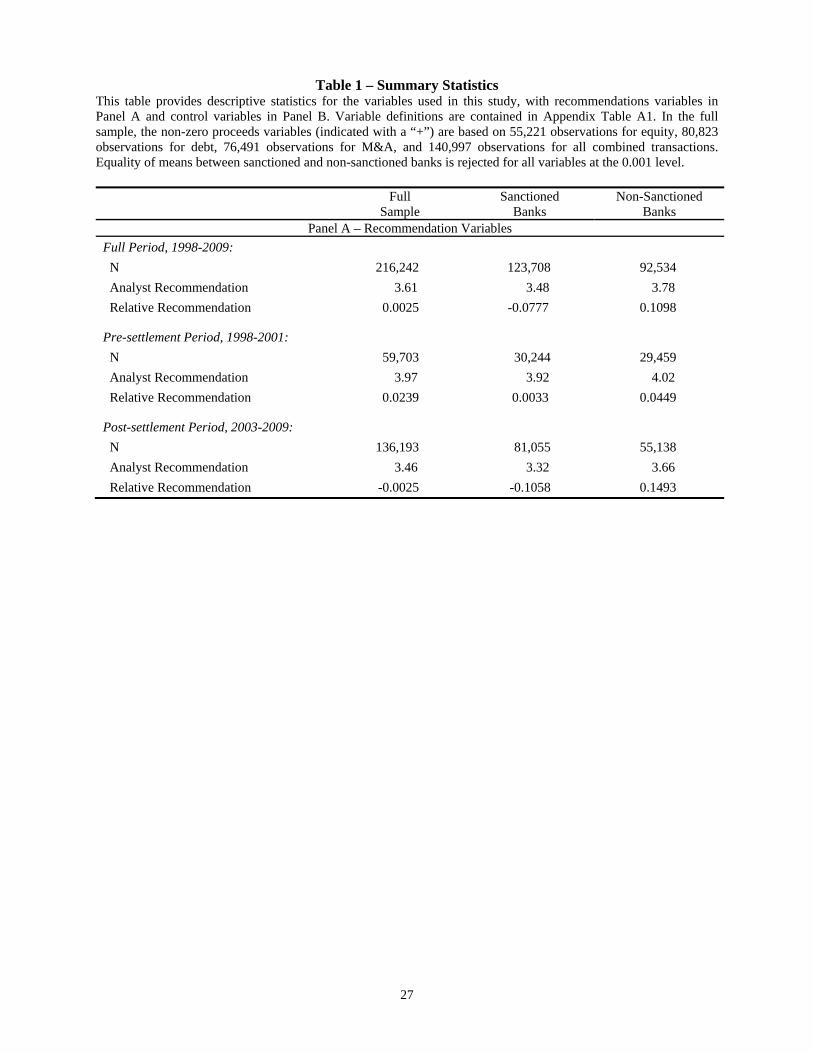
Table 1 provides summary statistics for both the recommendation variables (Panel A) and control
variables (Panel B). Mean values from the full sample are listed in column one and means from the
subsamples involving sanctioned and non-sanctioned banks are listed in columns two and three,
respectively. Of the quarterly observations, 57% are from sanctioned and 43% are from non-sanctioned
banks. For all variables in the table, equality of means across the two types of banks is easily rejected.
Consistent with previous research, Panel A shows that analysts tend to issue more Buys than
Sells, with a mean recommendation across all observations of 3.61. In addition, both recommendations
and relative recommendations are higher at non-sanctioned banks than sanctioned banks. The mean
recommendation (relative recommendation) is 3.78 (0.110) for non-sanctioned banks, compared to 3.48
(-0.078) for sanctioned banks.12 To highlight the potential impact of the settlement, Panel A also provides
results for the pre-settlement (1998-2001) and post-settlement (2003-2009) subperiods. Average
recommendations drop following the settlement for both types of banks, with the mean recommendation
falling from 3.92 to 3.32 for sanctioned banks and from 4.02 to 3.66 for non-sanctioned banks. At the
same time, the difference in relative recommendations across the two types of banks increases, with
average RelRec decreasing from 0.003 to -0.106 for sanctioned banks and increasing from 0.045 to 0.149
for non-sanctioned banks.
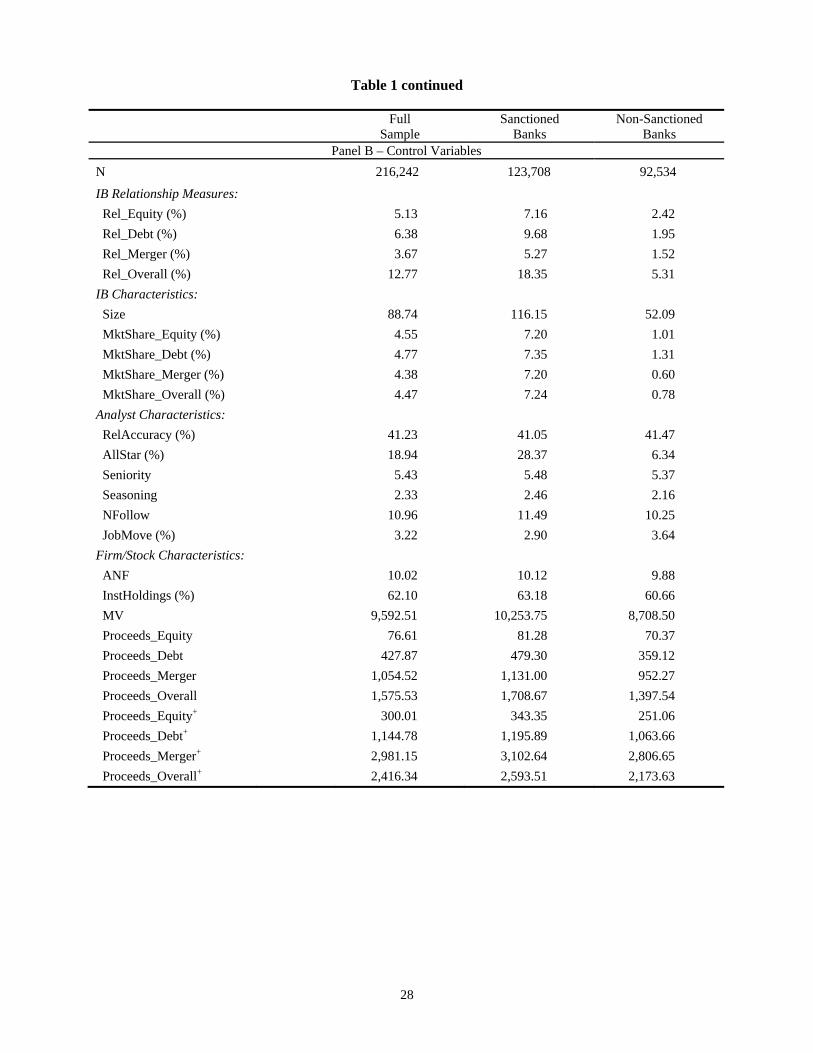
The investment banking relationship variables are summarized at the top of Panel B. We find that
12.8% of quarterly observations involve analysts who are affiliated with the covered firm through an
overall investment banking relationship. This compares to 5.1%, 6.4%, and 3.7% of observations based
on equity, debt, and M&A relationships, respectively. These proportions suggest that the overall measure
captures components of ongoing relationships that are not reflected in the type-specific measures. In
addition, the proportion of sample observations involving relationships is higher for sanctioned banks
12 Like Kadan et al. (2009), we find that many large banks shifted from 5-tier to 3-tier recommendation schemes following the settlement. For example, Deutsche Bank issued Strong Buy, Buy, Hold, Underperform, and Sell recommendations from 1998-2001, but issued only Buy, Hold, and Sell recommendations from 2004-2009. In later analyses, we show that our conclusions are robust to the use of a 3-tier recommendation scheme across all banks.

12
(18.4%) than non-sanctioned banks (5.3%).
The remaining rows in Panel B describe investment bank, analyst, and firm characteristics. We
find that the mean number of analysts per bank is 89 and investment bank market shares average 4.55%,
4.77%, and 4.38% for equity, debt, and M&A, respectively. Based on cross-sectional means, the typical
analyst in our sample follows 11 stocks and has seniority of 5.4 years, seasoning of 2.3 years, and relative
accuracy of 41.2%. In addition, 18.9% of the observations are issued by All-Star analysts and 3.2% by
analysts that changed employers during the quarter. The average firm in the sample is followed by 10
analysts and has market capitalization of $9.6 billion, institutional holdings of 62%, and three-year
proceeds for equity, debt, and M&A of $77 million, $428 million, and $1,055 million, respectively.
A comparison of columns 2 and 3 points to significant differences across the two subsamples. As
expected, sanctioned banks are larger and have higher market shares than non-sanctioned banks. For
example, the mean values of investment bank Size and equity MktShare are 116.2 and 7.2% for
sanctioned banks, compared to 52.1 and 1.01% for non-sanctioned banks. Analysts employed by
sanctioned banks are more likely to be ranked as All Stars, have higher Seniority and Seasoning, and
follow more stocks than analysts employed by non-sanctioned banks. In addition, analysts employed by
sanctioned banks tend to follow larger stocks, with higher institutional ownership and more equity, debt,
and M&A activity. These differences highlight the importance of controlling for investment bank, analyst,
and stock characteristics in the analysis to follow.
4. Results
4.1 Recommendation Frequencies and Investment Banking Relationships
To highlight the association between investment banking relationships and analyst
recommendations, Figure 2 plots recommendations for affiliated and unaffiliated analysts at sanctioned
and non-sanctioned banks. Results for the periods before and after the settlement are provided in Panels A
and B, respectively.
It is clear from the graph that Sell recommendations are rare in the period before the settlement.

13
While negative recommendations become more common in the post period, they remain relatively rare,
making it difficult to draw conclusions about affiliation bias. Turning to positive recommendations, the
graph shows that affiliated analysts are more likely to issue Strong Buy recommendations than
unaffiliated analysts. Although this apparent bias is reduced after the settlement, it does not appear to be
eliminated for either group of banks, and remains particularly strong for non-sanctioned banks. At
sanctioned banks, the difference in the Strong Buy frequency between affiliated and unaffiliated analysts
is 7.0% in the pre-settlement period and drops to 1.2% following the settlement. This compares to a
decrease from 10.8% to 6.9% for non-sanctioned banks. Untabulated results based on a three-tier
recommendation scale provide similar conclusions.
4.2 Relative Recommendations and Investment Banking Relationships
The results in Figure 2 suggest that analyst affiliation bias persists following the settlement. In
this section, we use a multivariate framework to test for analyst affiliation bias at sanctioned and non-
sanctioned banks after controlling for other factors. Using the quarterly data described above, we estimate
variations of the following general model specification:
ijkt
K
kkk
J
jjj
I
iiijjktjjktijkt
StockCharIBChar
rAnalystChaNonGSRelGSRelRelRec
11
121
(1)
where Reljkt indicates an investment banking relationship between investment bank j and firm k during the
36 months ending in quarter t, and the remaining variables represent controls for analyst, investment
bank, and stock characteristics, as defined in Appendix Table A2. Standard errors are clustered by firm
and the regressions include year and firm fixed effects.
Our main tests are based on a comparison of the relationship interaction terms involving GS and
NonGS, which are indicator variables that distinguish between banks that were and were not sanctioned in
the Global Settlement. In our initial tests, we interact the relationship variables with an indicator variable
equal to one for all quarters after the settlement and zero otherwise. In later tests, we provide separate

14
results for the subperiods before and after the settlement. Following Kadan et al. (2009), we define the
implementation of the settlement as September 2002. However, in the subperiod analyses, we exclude
observations from 2002 to reflect that the related investigations were ongoing during this period.
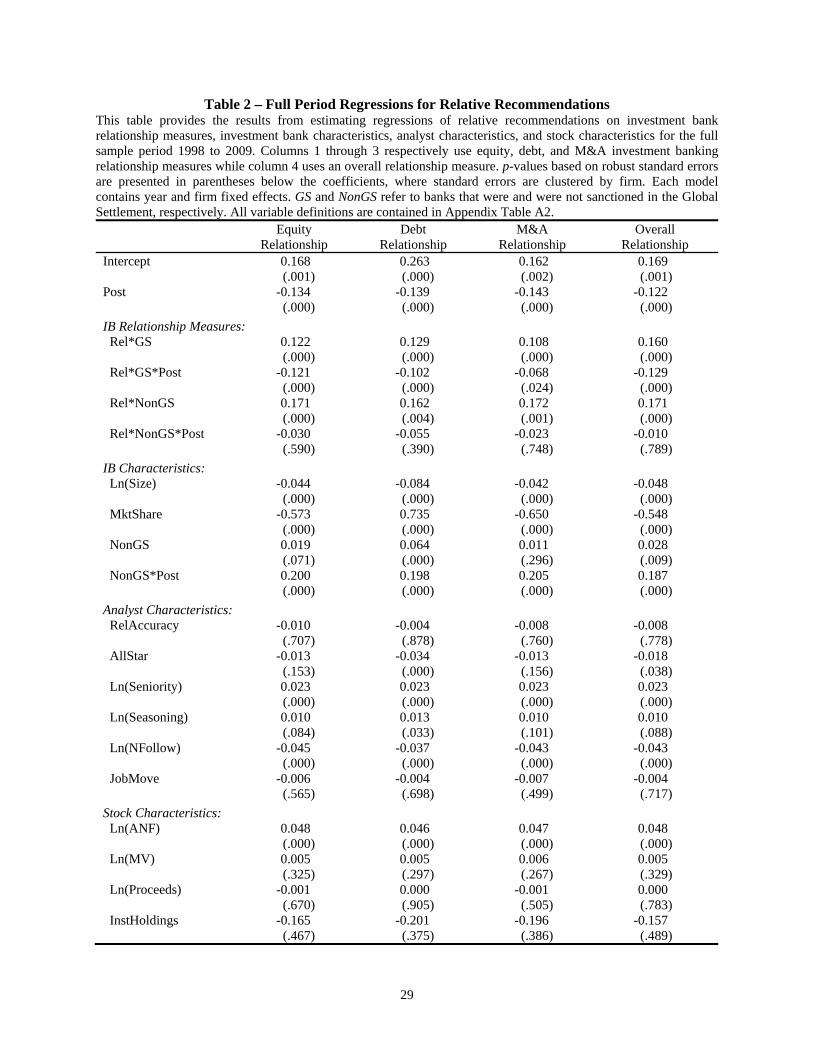
Full period regression results are presented in Table 2, with p-values based on robust standard
errors reported below the coefficients. Examining the coefficients on the investment banking relationship
measures, we find that analysts at both types of banks exhibit significant affiliation bias in the pre-
settlement period. This result holds for each type-specific relationship (equity, debt, and M&A), as well
as the overall relationship. However, the interaction terms point to significant differences between
sanctioned and non-sanctioned banks in the period following the settlement.
For sanctioned banks, analyst affiliation bias is significantly reduced in the post-settlement
period. In particular, the combined post-settlement effects listed at the bottom of the table show that
affiliation bias at sanctioned banks is insignificant in the post-settlement period for equity relationships,
and marginally significant for debt and M&A relationships. The results for overall relationships point to
statistically significant affiliation bias for sanctioned banks following the settlement, but the magnitude is
substantially reduced from the pre-settlement period. Based on coefficients for the overall relationship
variable (0.160) and the post-settlement interaction term (-0.129), affiliation bias at sanctioned banks is
reduced by approximately 81% in the post-settlement period. For non-sanctioned banks, there is strong
evidence of continued affiliation bias in the period following the settlement, regardless of the relationship
measure used. Based on coefficients for the overall relationship variable (0.171) and the post-settlement
interaction term (-0.010), affiliation bias for non-sanctioned banks is reduced by only 5.9% in the post-
settlement period and this reduction is statistically insignificant.
In terms of economic significance, the Rel coefficients of 0.16 for sanctioned banks and 0.17 for
non-sanctioned banks are approximately equivalent to an increase of one recommendation level (e.g.,
from Buy to Strong Buy) by one in six affiliated analysts during the pre-settlement period. While the
combined effects indicate little post-settlement change in this magnitude for non-sanctioned banks

15
(combined coefficient = 0.16), the post-settlement effect for sanctioned banks (combined coefficient =
0.03) is equivalent to a one level recommendation increase by only one in 32 affiliated analysts.13
Turning to the control variables, we see that relative recommendations are lower for large
investment banks and for analysts that cover more stocks, and higher for more experienced analysts and
for stocks followed by more analysts. Investment bank market share is positively related to relative
recommendations for equity, M&A, and overall, but negatively related for debt. Consistent with Table 1,
relative recommendations decrease in the post-settlement period and non-sanctioned bank analysts tend to
issue higher recommendations than sanctioned bank analysts, especially in the post-settlement period.
The evidence in Table 2 of a substantial post-settlement decrease in analyst affiliation bias at
sanctioned banks is consistent with an increase in the expected costs of issuing biased recommendations
for this subset of banks. In contrast, we find little evidence of a reduction in affiliation bias for analysts at
non-sanctioned banks, suggesting that the settlement was more effective than industry-wide SRO rules at
mitigating conflicts of interest involving investment banking and analyst research.
In the analysis to follow, we provide several robustness tests, as well as additional tests to help
interpret the economics driving these effects. To focus on the effects of affiliation bias in the period after
the settlement, we present all subsequent analyses for the pre and post-settlement subperiods. To conserve
space, we also focus exclusively on the overall relationship measure and suppress the reporting of control
variable coefficients in all subsequent tables.14 Full results are available from the authors upon request.
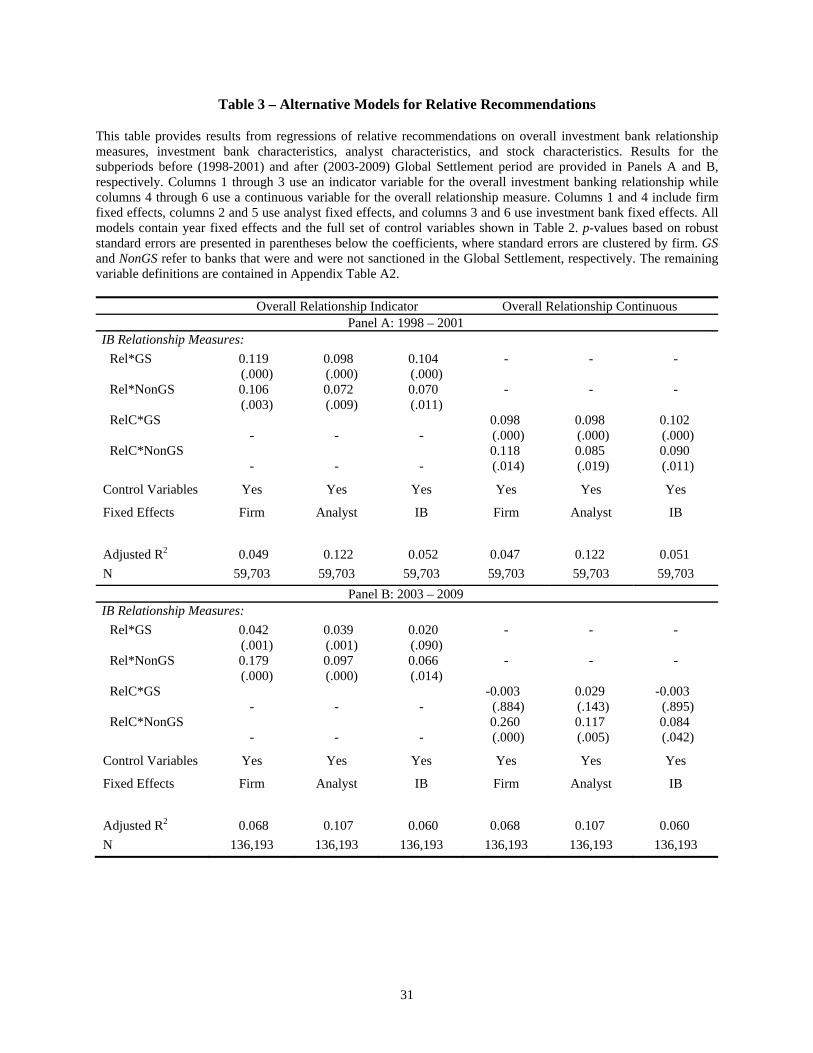
The specifications in Table 2 follow prior literature by including firm fixed effects. Table 3
reports results from alternative specifications incorporating analyst and investment bank fixed effects
using both the indicator and continuous relationship measures. Regardless of specification, the results
13 In untabulated results, we repeat the full-period regressions after replacing the GS and Non-GS dummy variables with bank-specific indicator variables. While this analysis leads to noisy bias estimates and must be interpreted with caution, the results suggest that the observed decrease in affiliation bias following the settlement was not limited to a small number of sanctioned banks and most sanctioned banks experienced a substantial decrease in affiliation bias. In contrast, while some non-sanctioned banks appear to experience a decrease in affiliation bias following the settlement, the majority of these banks continue to exhibit high levels of bias and several have higher levels of bias in the post-settlement period than the pre period. 14 Subperiod tests based on type-specific relationship measures provide results similar to those in Table 2. When we include type-specific and overall relationship measures simultaneously, we find little evidence that type-specific measures provide incremental explanatory power.
16
point to significant affiliation bias prior to the settlement (Panel A). In the post-settlement period (Panel
B), the results are somewhat weaker with investment bank fixed effects, but remain significant, especially
for non-sanctioned banks. Further, while the post-settlement results for sanctioned banks are sensitive to
the choice of relationship measure, affiliation bias for non-sanctioned banks is statistically significant
based on both indicator and continuous relationship measures. Overall, the conclusions from Table 3 are
consistent with those from Table 2 and suggest that our findings are robust to alternative specifications.15
4.3. Relative Recommendations based on a 3-Tier System
Kadan et al. (2009) document that many brokerage houses shifted from 5-tier to 3-tier
recommendation scales following the settlement, with all ten of the original sanctioned banks adopting 3-
tier scales in 2002 or soon thereafter. If only sanctioned banks shifted to this new recommendation scale
or if the shift differs by bank type, it is possible that our relative recommendation measure is inflated for
non-sanctioned banks relative to sanctioned banks. To ensure that our results are not driven by this shift in
recommendation scales, we re-estimate our main regressions after redefining all recommendations based
on a 3-tier scale. Specifically, we recalculate relative recommendations after redefining I/B/E/S
recommendations such that a 3 represents a Buy or Strong Buy and a 1 represents a Sell or Strong Sell.
Table 4 describes regressions based on this redefined relative recommendation variable, with
results for the subperiods before and after the settlement reported in Panels A and B, respectively. For
completeness, we provide results based on both transaction type and overall relationship measures. For
both subperiods, the results are generally consistent with our main findings. In the pre-settlement period,
there is evidence of affiliation bias for sanctioned banks based on all relationship measures and for non-
sanctioned banks based on M&A and overall relationships. In the post-settlement period, affiliation bias
is substantially reduced for sanctioned banks, but remains large and statistically significant for non-
sanctioned banks. Thus, our main results do not appear to be driven by the shift of some investment banks
from 5-tier to 3-tier recommendation scales.
15 In unreported results, we also re-estimated the basic model for the subsets of sanctioned and non-sanctioned banks and for the subset of firms covered by at least one affiliated and one non-affiliated analyst. In all cases, the conclusions are unchanged.
17
4.4. The Impact of Lending Relationships on Analyst Affiliation Bias
The passage of the Gramm-Leach-Bliley Act in 1999 led to a substantial increase in the role of
commercial banks in investment banking and more direct ties between lending and underwriting
relationships. For example, Ljungqvist et al. (2006), Drucker and Puri (2005), Yasuda (2005), and
Bharath, Dahiya, Saunders, and Srinivasan (2007) find that lending relationships increase the likelihood
of a bank being awarded future debt and equity underwriting business, and Corwin and Stegemoller
(2014) identify important links between lending and the cross-functional nature of investment banking
relationships. In this section, we examine whether lending relationships incrementally impact analyst
affiliation bias, after controlling for investment banking relationships.16
To identify lending relationships, we use Dealscan to collect data on syndicated loans from 1996
through 2009. We then match this loan data to our sample of CRSP firms using the link table provided by
Michael Roberts and Wharton Research Data Services (see Chava and Roberts 2008). For each loan, we
identify the loan amount and all lenders identified as having lead arranger credit.17 We then hand match
lender names to our sample of large investment banks. Finally, for each investment bank-firm pair in each
quarter, we define a lending relationship variable, RelLend, which equals one if the investment bank was a
lead arranger on a syndicated loan for the firm during the previous 36 months and zero otherwise.
To analyze the incremental impact of lending, we repeat the subperiod regressions from column 1
of Table 3 after incorporating lending relationships. Table 5 describes coefficients from three alternative
specifications, with results for the pre and post-settlement periods shown in Panels A and B, respectively.
The first specification suggests that lending relationships have a positive impact on analyst affiliation
bias, but only during the pre-settlement subperiod. When we add the overall relationship measure in the
second specification, it appears that lending has an incremental impact on affiliation bias, but the impact
is again strongest during the pre-settlement subperiod. Finally, in the third specification, we redefine the 16 Although they do not analyze recommendations, Chen and Martin (2011) find that analyst forecast accuracy improves after a firm borrows from an affiliated bank, suggesting that lending provides affiliated analysts with an informational advantage. 17 Notably, the Dealscan data include both loans and revolving credit line agreements. We believe credit lines are an important part of a lending relationship, regardless of whether or not the loan is drawn down. However, the fact that these loans may not be drawn down suggests that loan values in Dealscan, and the resulting relationship measures, may not be comparable to measures based on equity, debt, and M&A transactions.
18
overall relationship to incorporate equity, debt, M&A, and lending transactions. This combined measure
produces results that are similar to those from the overall relationship measure without lending.
The results in Table 5 provide some evidence that lending may have an incremental impact on
affiliation bias beyond that captured by investment banking relationships. However, the results for non-
sanctioned banks are limited to the period before the settlement and, unlike our main results, the findings
in Table 5 are sensitive to the inclusion of alternative fixed effects. Thus, we conclude that the
incremental impact of lending relationships on affiliation bias appears weak, at best.
4.5. Logit Models for Buy/Sell Recommendations
As an alternative test, we follow Kadan et al. (2009) in estimating logit models for the likelihood
of optimistic and pessimistic recommendations, where we focus on affiliation effects and differences
between sanctioned and non-sanctioned banks. The models follow the specification described in equation
(1), but use two alternative dependent variables. The first is an indicator variable equal to one if the
analyst issues a Buy or Strong Buy recommendation and zero otherwise. The second is an indicator
variable equal to one if the analyst issues a Sell or Strong Sell recommendation and zero otherwise. The
logit framework has two advantages over the regression specifications presented earlier. First, like the
analysis in Table 4, the dependent variables are defined based on a 3-tier recommendation scale and are
therefore robust to a shift in recommendation scales by some investment banks. Second, the dependent
variables are defined directly from I/B/E/S recommendations and are therefore unaffected by the
definition of consensus ranking used in the construction of RelRec.
Table 6 presents logit model results for both the full period and the pre/post settlement
subperiods, with p-values in parentheses and odds ratios in brackets below the coefficients. In the models
for Buy/Strong Buy recommendations, the results suggest that both sanctioned and non-sanctioned banks
are significantly more likely to issue positive recommendations when affiliated with the covered firm. For
sanctioned banks, this effect is strongest during the first subperiod, but remains statistically significant
after the settlement. For non-sanctioned banks, affiliation bias is statistically significant and similar in
19
magnitude before and after the settlement. The logit results for Sell/Strong Sell recommendations point to
similar effects on the negative side, though the results appear to be driven primarily by the period after the
settlement. Specifically, during the post-settlement period, both types of banks are less likely to issue
pessimistic recommendations when affiliated with the firm through an investment banking relationship.
To interpret the economic significance of these results, we focus on the odds ratios associated
with the Rel coefficients. During the pre-settlement period, the overall sample frequency of a Buy or
Strong Buy recommendation is 67.8%. The odds ratios imply an increase in this frequency to 76.8% for
affiliated analysts at sanctioned banks (a 13.4% increase) and to 73.1% for affiliated analysts at non-
sanctioned banks (a 7.9% increase). During the post-settlement period, the overall sample frequency of a
Buy or Strong Buy recommendation drops to 42.3%. The related odds ratios suggest that analyst
affiliation increases this frequency by 10.4% at sanctioned banks and 19.0% at non-sanctioned banks.18
The logit model results are largely consistent with those based on relative recommendations and
suggest that analysts tend to issue more optimistic (or less pessimistic) recommendations on firms with
which their employer has an investment banking relationship. While the magnitude of analyst affiliation
bias appears to decrease for sanctioned banks in the post-settlement period, we find no evidence of a
decrease in bias for non-sanctioned banks.
5. Additional Evidence from the Post-Settlement Period
Our results provide clear evidence of a significant post-settlement reduction in affiliation bias for
analysts at sanctioned banks. These findings are consistent with an increase for sanctioned banks in the
expected costs of issuing biased recommendations. However, this change in analyst behavior could also
be driven by the targeted structural changes that were imposed by the settlement, including the physical
separation of investment banking and research departments. Moreover, the behavior shift that we observe
may reflect a temporary reaction by sanctioned banks to the investigation and settlement. In this section,
18 Conclusions based on sell recommendations are similar. During the pre-settlement period, the overall sample frequency of a Sell or Strong Sell is only 1.27%. Odds ratios suggest that this frequency is 43.6% (45.5%) lower for affiliated analysts at sanctioned (non-sanctioned) banks. During the post-settlement period, the overall sample frequency of a Sell or Strong Sell increases to 9.6%, with affiliation leading to a 21.2% (53.0%) lower frequency at sanctioned (non-sanctioned) banks.
20
we provide additional evidence on the temporary vs. permanent nature of the observed change in analyst
behavior, as well as the channel through which the change occurs.
To test whether the effects of the settlement were transitory, we divide the post-settlement period
into two subperiods: January 2003 through June 2006 and July 2006 through December 2009. We then
repeat the post-settlement analysis from column 1 of Table 3B, allowing the coefficients on the Rel
interaction terms to differ between these subperiods. The results are provided in the first column of Table
7. As opposed to a temporary effect, the results for sanctioned banks suggest that the sharp decrease in
analyst affiliation bias immediately after the settlement is followed by a continued dissipation of any
lingering bias over the next few years. For these banks, the coefficient on Rel is 0.046 (p=0.043) and the
coefficient on the 7/06-12/09 interaction term is -0.054 (p=0.072). The combined result is a complete
elimination of affiliation bias by the end of our sample period. These results support a permanent rather
than temporary shift in analyst behavior at sanctioned banks, though the full effect is not immediate. At
the same time, affiliation bias is large and statistically significant throughout the post-settlement period
for non-sanctioned banks.
It is possible that the gradual elimination of affiliation bias that we document for sanctioned
banks is driven by the departure of the most biased analysts from these banks, either because they were
fired or because they changed jobs. Comparing analysts that appear in the data prior to the settlement with
those in the post-settlement sample, we find little evidence that sanctioned bank analysts are more likely
to leave the sample or that high-bias analysts at sanctioned banks tend to move to non-sanctioned banks.19
Another possibility is that the post-settlement change in the cost-benefit tradeoff for sanctioned
banks led to changes in firm culture, training, or hiring practices at these banks.20 To address this
possibility, we split the sample of analysts from the post-settlement period into those that issue
19 Of the 1,295 analysts that appear in the data during the 12 months ending in June 2002, 395 (30.5%) do not appear in the post-settlement period, 793 (61.2%) stay with the same bank, and 107 (8.3%) move to a new bank. The fraction of analysts leaving the sample equals 28.4% for sanctioned banks, compared to 33.5% for non-sanctioned banks. We are able to estimate pre-period bias coefficients for only 492 analysts. From this limited sample, we find no evidence that high-bias analysts are more likely than other analysts to either leave the sample or move from sanctioned to non-sanctioned banks. 20 Following the investigations and the resulting settlement, there appears to have been a top-down push for changes at the sanctioned banks. For example, a former head of research at one sanctioned bank told us that, in the wake of the settlement, bank management were very concerned about reputation and did not want to be responsible for a repeat of what had happened.
21
recommendations both before and after the settlement (pre-settlement analysts) and those that issue
recommendations only in the post-settlement period (new analysts). We then repeat the post-settlement
analysis on these two subsets of analysts, with the results provided in columns 2 and 3 of Table 7. For
sanctioned banks, the results point to significant affiliation bias in the post-settlement period for those
analysts who remain from the pre-settlement period. These findings suggest that pre-settlement analysts,
who may have legacy relationships with investment bankers, continue to be influenced by investment
banking conflicts in the post-settlement period. Conversely, analysts hired at sanctioned banks after the
settlement show no evidence of affiliation bias, suggesting that these new analysts have either different
characteristics or different training than pre-settlement analysts.
Notably, the observed contrast between pre-settlement and new analysts helps to explain both the
lingering bias at sanctioned banks following the settlement and the elimination of this bias over time.
While new analysts account for only 25.4% of sanctioned bank observations in 2003, this proportion
increases to 73.6% by 2009. Together with the results above, this suggests that the remaining bias
observed at sanctioned banks reflects the actions of pre-settlement analysts, with the bias dissipating as
new analysts are hired. In contrast, both pre-settlement and new analysts at non-sanctioned banks exhibit
significant affiliation bias in the post-settlement period.
Structural changes, such as the physical separation of investment banking and research
departments, should impact all analysts employed at a bank. Thus, the gradual elimination of affiliation
bias at sanctioned banks and the contrast between pre-settlement and new analysts at these banks suggests
that the reduction in affiliation bias that we document is not driven solely by structural changes. Instead,
the results are consistent with a shift in the cost-benefit tradeoff faced by sanctioned banks and a resulting
change in culture, hiring, or training practices at these banks.
6. Conclusion
Previous research provides strong evidence of conflicts of interest involving the investment
banking and research departments within large financial institutions. In particular, research shows that
22
analysts tend to issue optimistic recommendations on firms with which they are affiliated through
underwriting relationships. One of the major purposes of the 2003 Global Analyst Research Settlement
reached between regulators and 12 of the largest investment banks was to mitigate these conflicts of
interest. In this study, we use a broad measure of investment bank-firm relationships to examine the
impact of the settlement on analyst affiliation bias at sanctioned and non-sanctioned banks.
While many of the structural requirements of the settlement were imposed at an industry-wide
level through SRO rule changes, we argue that the punitive and reputational aspects of the settlement led
to an increase for sanctioned banks in the expected costs of issuing biased recommendations. We
therefore expect a significant post-settlement reduction in affiliation bias for analysts at sanctioned banks
that is larger than any effect for non-sanctioned banks. Consistent with our prediction, we find that
affiliation bias is reduced by as much as 81 percent following the settlement for analysts at sanctioned
banks, while non-sanctioned bank analysts exhibit strong affiliation bias both before and after the
settlement. A more detailed analysis of the post-settlement period shows that the lingering bias observed
for sanctioned bank analysts immediately following the settlement stems from analysts who were
employed prior to the settlement, with newly-hired analysts exhibiting no affiliation bias. These results
suggest that new analysts at sanctioned banks were impacted by changes in culture, hiring, or training
practices that were not replicated at non-sanctioned banks.
Taken together, our evidence is consistent with the Global Settlement leading to a significant shift
in the cost-benefit trade-off faced by analysts at the 12 sanctioned investment banks. While the result is an
eventual elimination of analyst affiliation bias at sanctioned banks, our evidence of continued affiliation
bias at non-sanctioned banks suggests that the settlement was more effective than industry-wide SRO
rules at mitigating conflicts of interest involving investment banking and research.
23
References
Barber, B., Lehavy, R., McNichols, M., Trueman, B., 2006. Buys, holds, and sells: The distribution of investment banks’ stock ratings and the implications for the profitability of analysts’ recommendations. Journal of Accounting and Economics 41, 87-117.
Barniv, R., Hope, O.-K., Myring, M., Thomas, W., 2009. Do analysts practice what they preach and should investors listen? Effects of recent regulations. The Accounting Review 84 (4), 1015-1039.
Becker, G., 1968. Crime and punishment: An economic approach. Journal of Political Economy 76 (2), 169-217.
Bharath, S., Dahiya, S., Saunders, A., Srinivasan, A., 2007. So what do I get? The bank’s view of lending relationships, Journal of Financial Economics 85, 368-419.
Bradshaw, M., Richardson, S., Sloan, R., 2006. The relation between corporate financing activities, analysts’ forecasts and stock returns. Journal of Accounting and Economics 42, 53-85.
Brown, L., Call, A., Clement, M., Sharp, N., 2015. Inside the “black box” of sell-side financial analysts. Journal of Accounting Research 53 (1), 1-47.
Cassidy, J., 2003. The Investigation: How Eliot Spitzer humbled Wall Street, The New Yorker (April 7, 2003).
Chava, S., Roberts, M., 2008. How does financing impact investment? The role of debt covenants, Journal of Finance 63, 2085-2121.
Chen, T., Martin, X., 2011. Do bank-affiliated analysts benefit from lending relationship? Journal of Accounting Research 49 (3), 633-675.
Chen, C.-Y., Chen, P., 2009. NASD Rule 2711 and changes in analysts’ independence in making stock recommendations. The Accounting Review 84 (4), 1041-1071.
Clarke, J., Khorana, A., Patel, A., Rau, P., 2011. Independents’ day? Analyst behavior surrounding the Global Settlement. Annals of Finance 7, 529-547.
Corwin, S. A., Stegemoller, M., 2014, The changing nature of investment banking relationships. Working paper, University of Notre Dame and Baylor University.
Cowen, A., Groysberg, B., Healy, P., 2006. Which types of analyst firms are more optimistic? Journal of Accounting and Economics 41, 119-146.
Craig, S., 2004. Research Rules Trickle Down to Small Firms, Wall Street Journal (January 18, 2004).
De Franco, G., Lu, H., Vasvari, F., 2007. Wealth transfer effects of analysts’ misleading behavior. Journal of Accounting Research 45 (1), 71-110.
Dechow, P., Hutton, A., Sloan, R., 2000. The relation between analysts’ forecast of long-term earnings growth and stock price performance following equity offerings. Contemporary Accounting Research 17 (1), 1-32.
Demos, T., 2012. IPO Quiet Time: Banks Can’t Let Go, Wall Street Journal (August 20, 2012).
24
Drucker, S., Puri, M., 2005. On the benefits of concurrent lending and underwriting, Journal of Finance 60, 2763-2799.
Dugar, A., Nathan, S., 1995. The effect of investment banking relationships on financial analysts’ earnings forecasts and investment recommendations. Contemporary Accounting Research 12 (1), 131-160.
U.S. Government Accountability Office (GAO), 2012. Securities Research: Additional Actions Could Improve Regulatory Oversight of Analyst Conflicts of Interest, GAO-12-209 (January 2012).
Guan, Y., Lu, H., Wong, F., 2012. Conflict-of-interest reforms and investment bank analysts’ research biases. Journal of Accounting, Auditing, and Finance 27 (4), 443-470.
Hong, H., Kubik, J., 2003. Analyzing the analysts: career concerns and biased earnings forecasts. Journal of Finance 58, 313–351.
Kadan, O., Madureira, L., Wang, R., Zach, R., 2009. Conflicts of interest and stock recommendations – the effect of the Global Settlement and related regulations. Review of Financial Studies 22 (10), 4189-4217.
Kolasinski, A., Kothari, S.P., 2008. Investment banking and analyst objectivity: Evidence from analysts affiliated with mergers and acquisitions advisors. Journal of Financial and Quantitative Analysis 43 (4), 817-842.
Lin, H., McNichols, M., 1998. Underwriting relationships, analysts’ earnings forecasts and investment recommendations. Journal of Accounting and Economics 25 (1), 101-127.
Ljungqvist, A., Marston, F., Wilhelm, W., 2006. Competing for securities underwriting mandates: Banking relationships and analyst recommendations, Journal of Finance 61, 301-340.
Ljungqvist, A., Marston, F., Starks, L., Wei, K., Yan, H., 2007. Conflicts of interest in sell-side research and the moderating role of institutional investors. Journal of Financial Economics 85, 420-456.
Ljungqvist, A., Marston, F., Wilhelm, W., 2009. Scaling the hierarchy: How and why investment banks compete for syndicate co-management appointments. Review of Financial Studies 22 (10), 3977-4007.
Malmendier, U., Shanthikumar, D., 2014. Do security analysts speak in two tongues? Review of Financial Studies 27(5), 1287-1322.
Mehran, H., Stulz, R., 2007. The economics of conflicts of interest in financial institutions. Journal of Financial Economics 85, 267-296.
Michaely, R., Womack, K., 1999. Conflict of interest and the credibility of underwriter analyst recommendations. The Review of Financial Studies 12 (4), 653-686.
O’Brien, P., McNichols, M., Lin, H., 2005. Analyst impartiality and investment banking relationships. Journal of Accounting Research 43, 623–650.
Yasuda, A., 2005. Do bank relationships affect the firm’s underwriter choice in the corporate bond underwriting market? Journal of Finance 60, 1259-1292.
25
Figure 1 – Relationship Illustration for Convergys Corp and Citi Salomon Smith This figure provides an illustration of our measures of investment banking relationships. We define a firm-bank pair as having a relationship if at any point during the preceding 36 months, the firm had an equity, debt, or M&A transaction for which the investment bank served as a lead or co-managing underwriter or M&A advisor. Equity, debt, and M&A relationships are defined based only on transactions within each category. The overall relationship is defined based on transactions across all three categories.
Equity
Debt
Merger
Overall

26
Panel A: Pre-Global Settlement
Panel B: Post-Global Settlement
Figure 2 – Recommendation Frequency Before and After Global Settlement The figure plots recommendation frequencies for our sample of quarterly data. Analysts from banks sanctioned in the Global Settlement are shown on the left and analysts from non-sanctioned banks are shown on the right. Recommendations are further classified as affiliated or unaffiliated, based on our overall investment banking relationship measure.
27
Table 1 – Summary Statistics This table provides descriptive statistics for the variables used in this study, with recommendations variables in Panel A and control variables in Panel B. Variable definitions are contained in Appendix Table A1. In the full sample, the non-zero proceeds variables (indicated with a “+”) are based on 55,221 observations for equity, 80,823 observations for debt, 76,491 observations for M&A, and 140,997 observations for all combined transactions. Equality of means between sanctioned and non-sanctioned banks is rejected for all variables at the 0.001 level.
Full
Sample Sanctioned
Banks Non-Sanctioned
Banks Panel A – Recommendation Variables
Full Period, 1998-2009:
N 216,242 123,708 92,534
Analyst Recommendation 3.61 3.48 3.78
Relative Recommendation 0.0025 -0.0777 0.1098
Pre-settlement Period, 1998-2001:
N 59,703 30,244 29,459
Analyst Recommendation 3.97 3.92 4.02
Relative Recommendation 0.0239 0.0033 0.0449
Post-settlement Period, 2003-2009:
N 136,193 81,055 55,138
Analyst Recommendation 3.46 3.32 3.66
Relative Recommendation -0.0025 -0.1058 0.1493
28
Table 1 continued
Full
Sample Sanctioned
Banks Non-Sanctioned
Banks Panel B – Control Variables
N 216,242 123,708 92,534
IB Relationship Measures:
Rel_Equity (%) 5.13 7.16 2.42
Rel_Debt (%) 6.38 9.68 1.95
Rel_Merger (%) 3.67 5.27 1.52
Rel_Overall (%) 12.77 18.35 5.31
IB Characteristics:
Size 88.74 116.15 52.09
MktShare_Equity (%) 4.55 7.20 1.01
MktShare_Debt (%) 4.77 7.35 1.31
MktShare_Merger (%) 4.38 7.20 0.60
MktShare_Overall (%) 4.47 7.24 0.78
Analyst Characteristics:
RelAccuracy (%) 41.23 41.05 41.47
AllStar (%) 18.94 28.37 6.34
Seniority 5.43 5.48 5.37
Seasoning 2.33 2.46 2.16
NFollow 10.96 11.49 10.25
JobMove (%) 3.22 2.90 3.64
Firm/Stock Characteristics:
ANF 10.02 10.12 9.88
InstHoldings (%) 62.10 63.18 60.66
MV 9,592.51 10,253.75 8,708.50
Proceeds_Equity 76.61 81.28 70.37
Proceeds_Debt 427.87 479.30 359.12
Proceeds_Merger 1,054.52 1,131.00 952.27
Proceeds_Overall 1,575.53 1,708.67 1,397.54
Proceeds_Equity+ 300.01 343.35 251.06
Proceeds_Debt+ 1,144.78 1,195.89 1,063.66
Proceeds_Merger+ 2,981.15 3,102.64 2,806.65
Proceeds_Overall+ 2,416.34 2,593.51 2,173.63
29
Table 2 – Full Period Regressions for Relative Recommendations This table provides the results from estimating regressions of relative recommendations on investment bank relationship measures, investment bank characteristics, analyst characteristics, and stock characteristics for the full sample period 1998 to 2009. Columns 1 through 3 respectively use equity, debt, and M&A investment banking relationship measures while column 4 uses an overall relationship measure. p-values based on robust standard errors are presented in parentheses below the coefficients, where standard errors are clustered by firm. Each model contains year and firm fixed effects. GS and NonGS refer to banks that were and were not sanctioned in the Global Settlement, respectively. All variable definitions are contained in Appendix Table A2.
Equity
Relationship Debt
Relationship M&A
Relationship Overall
Relationship Intercept 0.168
(.001) 0.263 (.000)
0.162 (.002)
0.169 (.001)
Post -0.134 (.000)
-0.139 (.000)
-0.143 (.000)
-0.122 (.000)
IB Relationship Measures: Rel*GS 0.122
(.000) 0.129 (.000)
0.108 (.000)
0.160 (.000)
Rel*GS*Post -0.121 (.000)
-0.102 (.000)
-0.068 (.024)
-0.129 (.000)
Rel*NonGS 0.171 (.000)
0.162 (.004)
0.172 (.001)
0.171 (.000)
Rel*NonGS*Post -0.030 (.590)
-0.055 (.390)
-0.023 (.748)
-0.010 (.789)
IB Characteristics: Ln(Size) -0.044
(.000) -0.084 (.000)
-0.042 (.000)
-0.048 (.000)
MktShare -0.573 (.000)
0.735 (.000)
-0.650 (.000)
-0.548 (.000)
NonGS 0.019 (.071)
0.064 (.000)
0.011 (.296)
0.028 (.009)
NonGS*Post 0.200 (.000)
0.198 (.000)
0.205 (.000)
0.187 (.000)
Analyst Characteristics: RelAccuracy -0.010
(.707) -0.004 (.878)
-0.008 (.760)
-0.008 (.778)
AllStar -0.013 (.153)
-0.034 (.000)
-0.013 (.156)
-0.018 (.038)
Ln(Seniority) 0.023 (.000)
0.023 (.000)
0.023 (.000)
0.023 (.000)
Ln(Seasoning) 0.010 (.084)
0.013 (.033)
0.010 (.101)
0.010 (.088)
Ln(NFollow) -0.045 (.000)
-0.037 (.000)
-0.043 (.000)
-0.043 (.000)
JobMove -0.006 (.565)
-0.004 (.698)
-0.007 (.499)
-0.004 (.717)
Stock Characteristics: Ln(ANF) 0.048
(.000) 0.046 (.000)
0.047 (.000)
0.048 (.000)
Ln(MV) 0.005 (.325)
0.005 (.297)
0.006 (.267)
0.005 (.329)
Ln(Proceeds) -0.001 (.670)
0.000 (.905)
-0.001 (.505)
0.000 (.783)
InstHoldings -0.165 (.467)
-0.201 (.375)
-0.196 (.386)
-0.157 (.489)
30
Table 2 - continued
Combined Post Effects: GS Banks 0.001
(.951) 0.028 (.087)
0.041 (.038)
0.031 (.009)
NonGS Banks 0.142 (.000)
0.107 (.019)
0.150 (.001)
0.161 (.000)
Adjusted R2 0.051 0.052 0.051 0.052 N 216,242 216,242 216,242 216,242
31
Table 3 – Alternative Models for Relative Recommendations
This table provides results from regressions of relative recommendations on overall investment bank relationship measures, investment bank characteristics, analyst characteristics, and stock characteristics. Results for the subperiods before (1998-2001) and after (2003-2009) Global Settlement period are provided in Panels A and B, respectively. Columns 1 through 3 use an indicator variable for the overall investment banking relationship while columns 4 through 6 use a continuous variable for the overall relationship measure. Columns 1 and 4 include firm fixed effects, columns 2 and 5 use analyst fixed effects, and columns 3 and 6 use investment bank fixed effects. All models contain year fixed effects and the full set of control variables shown in Table 2. p-values based on robust standard errors are presented in parentheses below the coefficients, where standard errors are clustered by firm. GS and NonGS refer to banks that were and were not sanctioned in the Global Settlement, respectively. The remaining variable definitions are contained in Appendix Table A2.
Overall Relationship Indicator Overall Relationship Continuous Panel A: 1998 – 2001
IB Relationship Measures:
Rel*GS 0.119 (.000)
0.098 (.000)
0.104 (.000)
- - -
Rel*NonGS 0.106 (.003)
0.072 (.009)
0.070 (.011)
- - -
RelC*GS - - -
0.098 (.000)
0.098 (.000)
0.102 (.000)
RelC*NonGS - - -
0.118 (.014)
0.085 (.019)
0.090 (.011)
Control Variables Yes Yes Yes Yes Yes Yes
Fixed Effects Firm Analyst IB Firm Analyst IB
Adjusted R2 0.049 0.122 0.052 0.047 0.122 0.051
N 59,703 59,703 59,703 59,703 59,703 59,703
Panel B: 2003 – 2009 IB Relationship Measures:
Rel*GS 0.042 (.001)
0.039 (.001)
0.020 (.090)
- - -
Rel*NonGS 0.179 (.000)
0.097 (.000)
0.066 (.014)
- - -
RelC*GS - - -
-0.003 (.884)
0.029 (.143)
-0.003 (.895)
RelC*NonGS - - -
0.260 (.000)
0.117 (.005)
0.084 (.042)
Control Variables Yes Yes Yes Yes Yes Yes
Fixed Effects Firm Analyst IB Firm Analyst IB
Adjusted R2 0.068 0.107 0.060 0.068 0.107 0.060
N 136,193 136,193 136,193 136,193 136,193 136,193
32
Table 4 – Relative Recommendations based on a 3-Tier System This table provides the results from estimating regressions of relative recommendations on investment bank relationship measures, investment bank characteristics, analyst characteristics, and stock characteristics Results for the subperiods before (1998-2001) and after (2003-2009) Global Settlement period are provided in Panels A and B, respectively. In this table, relative recommendations are measured based on a 3-tier system where a Strong Buy or Buy recommendations are coded as 3 and Strong Sell or Sell recommendations are coded as 1. Columns 1 through 3 respectively use equity, debt, and M&A investment banking relationship measures, while column 4 uses an overall relationship measure. p-values based on robust standard errors are presented in parentheses below the coefficients, where standard errors are clustered by firm. Each model contains year and firm fixed effects and the full set of control variables shown in Table 2. GS and NonGS refer to banks that were and were not sanctioned in the Global Settlement, respectively. The remaining variable definitions are contained in Appendix Table A2.
Equity
Relationship Debt
Relationship M&A
Relationship Overall
Relationship Panel A: 1998 – 2001
IB Relationship Measures:
Rel*GS 0.032 (.037)
0.080 (.000)
0.044 (.011)
0.073 (.000)
Rel*NonGS 0.011 (.659)
0.011 (.724)
0.075 (.018)
0.035 (.049)
Control Variables Yes Yes Yes Yes
Adjusted R2 0.057 0.059 0.057 0.058
N 59,703 59,703 59,703 59,703
Panel B: 2003 – 2009 IB Relationship Measures:
Rel*GS 0.030 (.057)
0.036 (.007)
0.048 (.007)
0.042 (.000)
Rel*NonGS 0.086 (.001)
0.096 (.000)
0.145 (.000)
0.113 (.000)
Control Variables Yes Yes Yes Yes
Adjusted R2 0.050 0.047 0.052 0.053
N 136,193 136,193 136,193 136,193
33
Table 5 – Analyst Affiliation Effects and Lending This table provides results from regressions of relative recommendations on overall investment banking and lending relationship measures, and a set of control variables related to investment bank, analyst, and stock characteristics. Results for the subperiod before Global Settlement (1998-2001) are presented in Panel A and results for the post-settlement period (2003-2009) are presented in Panel B. p-values based on robust standard errors are presented in parentheses below the coefficients, where standard errors are clustered by firm. Each model contains year and firm fixed effects and the full set of control variables shown in Table 2. GS and NonGS refer to banks that were and were not sanctioned in the Global Settlement, respectively. The remaining variable definitions are contained in Table A2 of Appendix 1.
Panel A: 1998 – 2001
IB Relationship Measures:
RelLend*GS 0.095 (.008)
0.154 (.000)
-
RelLend*NonGS 0.110 (.009)
0.234 (.000)
-
RelOverall*GS - 0.108 (.000)
-
RelOverall*NonGS - 0.080 (.023)
-
RelOverall+Lend*GS - - 0.093 (.000)
RelOverall+Lend*NonGS - - 0.135 (.000)
Control Variables Yes Yes Yes
Adjusted R2 0.058 0.050 0.052
N 59,703 59,703 59,703
Panel B: 2003 – 2009
IB Relationship Measures:
RelLend*GS 0.025 (.246)
0.072 (.001)
-
RelLend*NonGS 0.064 (.113)
0.069 (.109)
-
RelOverall*GS - 0.028 (.035)
-
RelOverall*NonGS - 0.159 (.000)
-
RelOverall+Lend*GS - - 0.030 (.014)
RelOverall+Lend*NonGS - - 0.121 (.000)
Control Variables Yes Yes Yes
Adjusted R2 0.067 0.069 0.067
N 136,193 136,193 136,193
34
Table 6 – Logit Models for Buy/Sell Recommendations This table provides the results from estimating logistic regressions of the probability that an analyst issues a Buy or Strong Buy (Sell or Strong Sell) recommendation on overall investment bank relationship measures, investment bank characteristics, analyst characteristics, and stock characteristics in columns 1 to 3 (4 to 6). Results for the full sample period from 1998 to 2009 are presented in columns 1 and 4. The remaining columns present results for the subperiods before (1998-2001) and after (2003-2009) Global Settlement. p-values based on robust standard errors that are clustered by firm are presented in parentheses below the coefficients, followed by odds ratios shown in brackets. Each model contains year and firm fixed effects and the full set of control variables shown in Table 2. GS and NonGS refer to banks that were and were not sanctioned in the Global Settlement, respectively. The remaining variable definitions are contained in Table A2 of Appendix 1. Buy or Strong Buy Sell or Strong Sell Full Period 1998-2001 2003-2009 Full Period 1998-2001 2003-2009 IB Relationship Measures:
Rel*GS 0.529 (.000)
[1.6968]
0.455 (.000)
[1.5765]
- -0.786 (.000)
[0.4556]
-0.579 (.130)
[0.5606]
-
Rel*GS*Post -0.345 (.000)
[0.7084]
- 0.178 (.000)
[1.1945]
0.520 (.015)
[1.6817]
- -0.261 (.000)
[0.7703]
Rel*NonGS 0.400 (.000)
[1.4917]
0.256 (.030)
[1.2919]
- -1.313 (.000)
[0.2691]
-0.612 (.144)
[0.5422]
-
Rel*NonGS*Post -0.107 (.318)
[0.8983]
- 0.324 (.000)
[1.3832]
0.513 (.168)
[1.6705]
- -0.809 (.000)
[0.4452]
Control Variables Yes Yes Yes Yes Yes Yes
Combined Post Effects:
GS Banks 0.184 (.000)
[1.2022]
- - -0.266 (.000)
[0.7662]
- -
NonGS Banks 0.293 (.000)
[1.3401]
- - -0.800 (.000)
[0.4495]
- -
Pseudo R2 0.078 0.060 0.027 0.112 0.163 0.034
N 212,107 54,219 133,483 171,542 11,111 109,467
35
Table 7: Additional Evidence on Analyst Affiliation Bias following Global Settlement This table describes results from regressions of relative recommendations on investment bank relationship measures, investment bank characteristics, analyst characteristics, and stock characteristics. The results are for the period after the Global Settlement and include data from 2003-2009. In column 1, the post-settlement period is split into two equal subperiods, with D7/06-12/09 defined as a dummy variable that equals one for all observations in the second subperiod. In columns 2 and 3, we estimate the post-settlement regressions on two subsets of analysts: those that appear in the data before both before and after 2002 and those that appear in the data only after 2002 (whereas those that first appear during 2002 are excluded). p-values based on robust standard errors are presented in parentheses below the coefficients, where standard errors are clustered by firm. Each model contains year and firm fixed effects and the full set of control variables shown in Table 2. GS and NonGS refer to banks that were and were not sanctioned in the Global Settlement, respectively. The remaining variable definitions are contained in Table A2 of Appendix 1.
Subperiod Analysis Pre-settlement
analysts who appear before and after 2002
New analysts who appear
only after 2002 IB Relationship Measures: Rel*GS 0.046
(0.043) 0.083
(0.000) -0.009 (0.663)
Rel*GS*D7/06-12/09 -0.054 (0.072)
- -
Rel*NonGS 0.202 (0.000)
0.206 (0.000)
0.180 (0.001)
Rel*NonGS*D7/06-12/09 -0.056 (0.502)
- -
Control Variables Yes Yes Yes
Combined 7/06-12/09 Effects: GS Banks -0.008
(0.758) - -
Non-GS Banks 0.146 (0.041)
- -
Adjusted R2 0.069 0.096 0.109
N 146,747 65,510 58,314
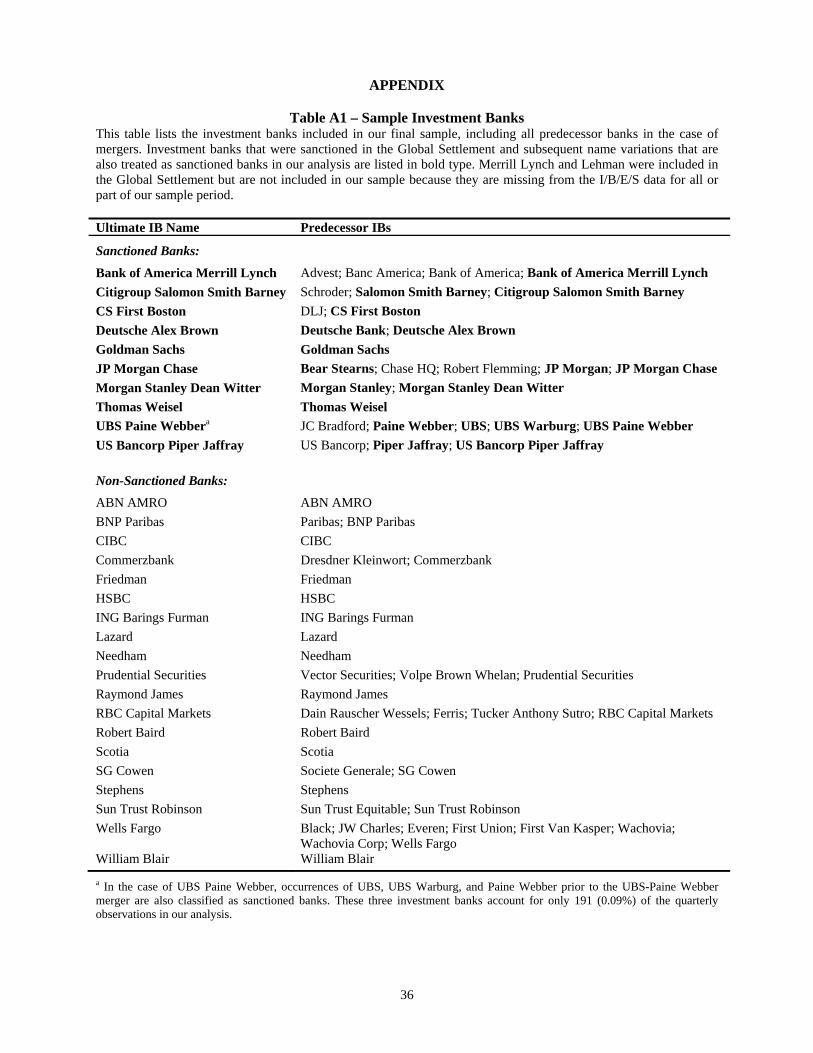
36
APPENDIX
Table A1 – Sample Investment Banks This table lists the investment banks included in our final sample, including all predecessor banks in the case of mergers. Investment banks that were sanctioned in the Global Settlement and subsequent name variations that are also treated as sanctioned banks in our analysis are listed in bold type. Merrill Lynch and Lehman were included in the Global Settlement but are not included in our sample because they are missing from the I/B/E/S data for all or part of our sample period. Ultimate IB Name Predecessor IBs
Sanctioned Banks:
Bank of America Merrill Lynch Advest; Banc America; Bank of America; Bank of America Merrill Lynch
Citigroup Salomon Smith Barney Schroder; Salomon Smith Barney; Citigroup Salomon Smith Barney
CS First Boston DLJ; CS First Boston
Deutsche Alex Brown Deutsche Bank; Deutsche Alex Brown
Goldman Sachs Goldman Sachs
JP Morgan Chase Bear Stearns; Chase HQ; Robert Flemming; JP Morgan; JP Morgan Chase
Morgan Stanley Dean Witter Morgan Stanley; Morgan Stanley Dean Witter
Thomas Weisel Thomas Weisel
UBS Paine Webbera JC Bradford; Paine Webber; UBS; UBS Warburg; UBS Paine Webber
US Bancorp Piper Jaffray US Bancorp; Piper Jaffray; US Bancorp Piper Jaffray
Non-Sanctioned Banks:
ABN AMRO ABN AMRO
BNP Paribas Paribas; BNP Paribas
CIBC CIBC
Commerzbank Dresdner Kleinwort; Commerzbank
Friedman Friedman
HSBC HSBC
ING Barings Furman ING Barings Furman
Lazard Lazard
Needham Needham
Prudential Securities Vector Securities; Volpe Brown Whelan; Prudential Securities
Raymond James Raymond James
RBC Capital Markets Dain Rauscher Wessels; Ferris; Tucker Anthony Sutro; RBC Capital Markets
Robert Baird Robert Baird
Scotia Scotia
SG Cowen Societe Generale; SG Cowen
Stephens Stephens
Sun Trust Robinson Sun Trust Equitable; Sun Trust Robinson
Wells Fargo Black; JW Charles; Everen; First Union; First Van Kasper; Wachovia; Wachovia Corp; Wells Fargo
William Blair William Blair
a In the case of UBS Paine Webber, occurrences of UBS, UBS Warburg, and Paine Webber prior to the UBS-Paine Webber merger are also classified as sanctioned banks. These three investment banks account for only 191 (0.09%) of the quarterly observations in our analysis.

37
Table A2 – Variable Definitions
Variable Definition
Analyst Recommendation and Global Settlement Variables:
RelRecijkt = Relative Recommendation. The most recent recommendation issued by analyst i (from investment bank j) for firm k during the one-year window ending in quarter t, normalized by subtracting the consensus (median) recommendation across all analysts covering firm k (whether or not they are in our sample) in the same one-year window.
Postt = Post Global Settlement. An indicator variable that equals one for all quarters after the Global Analyst Research Settlement and zero otherwise. Following Kadan et al. (2009), we define the beginning of the post Global Settlement period as September 2002.
IB Relationship Measures:
RelCjkt = Investment Bank Relationship (Continuous). The proportion of a firm k’s total transaction value over the 36 months ending in quarter t for which investment bank j acted as a lead or co-managing underwriter or an M&A advisor. This variable is calculated separately based on equity, debt, and M&A transactions, as well as the combined set of transactions across all three areas.
Reljkt = Investment Bank Relationship (Indicator). An indicator variable equal to one if REL for a particular transaction category (equity, debt, M&A, lending, or overall) is positive and zero otherwise.
IB Characteristics:
Sizejt = Investment Bank Size. The number of analysts employed by investment bank j during quarter t, according to the I/B/E/S recommendations file.
MktSharejt = Investment Bank Market Share. The proportion of total transaction value in a particular transaction category (equity, debt, M&A, or all three combined) during the previous 12 months for which investment bank j acted as lead or co-managing underwriter or advisor.
GSj (NonGSj) = Global Settlement (Non-Global Settlement) Investment Bank. Indicator variables to identify whether or not investment bank j was one of the 12 investment banks sanctioned in the Global Analyst Research Settlement (including subsequent name variations as shown in Appendix Table A2). The twelve investment banks include Bear Stearns; Citigroup (Salomon Smith Barney); CS First Boston; Deutsche Bank; Goldman Sachs; JP Morgan; Lehman Brothers; Merrill Lynch; Morgan Stanley; Thomas Weisel, UBS Warburg; and U.S. Bancorp Piper Jaffray.
Analyst Characteristics:
RelAccuracyijt = Relative Analyst Accuracy. The relative forecast accuracy of the analyst, as defined in Hong and Kubik (2003). For each analyst i following firm k, we first estimate the absolute value of the difference between the analyst’s most recent forecast of fiscal-year earnings (issued between January 1 and July 1 of year t) and actual earnings, scaled by price (as of the end of year t-1). We then rescale such that the most accurate analyst following firm k scores 1 and the least accurate analyst scores 0. Finally, each analyst’s relative forecast accuracy is defined as the mean score across all stocks followed by the analyst over years t-2 through t.

38
Table A2 continued
AllStarijt = All Star Analyst. An indicator variable that equals 1 if the analyst is a ranked as an All-Star by Institutional Investor magazine during year t-1, and 0 otherwise.
Seniorityijt = Analyst Seniority. The number of years since analyst i first appeared in I/B/E/S.
Seasoningijt = Analyst Seasoning. The number of years since analyst i initiated coverage of firm k, according to I/B/E/S.
NFollowijt = Number of Firms Followed. The number of firms followed by analyst i during quarter t, according to I/B/E/S.
JobMoveijt = Analyst Job Move. An indicator variable that equals 1 if analyst i changed employers during quarter t, according to I/B/E/S.
Stock Characteristics:
ANFkt = Analyst Following. The number of analysts issuing recommendations for firm k during the previous 12 months, according to the I/B/E/S recommendations file.
MVkt = Market Value. The market value of equity for firm k at the end of year t-1, according to CRSP.
Proceedskt = Aggregate Transaction Proceeds. The total transaction value by firm k in a particular transaction category (equity, debt, M&A, or all three combined) during the previous 36 months.
InstHoldingskt = Institutional Holdings. The percentage of shares of firm k held by institutional investors at the end of quarter t, according to Thomson Reuters’ 13F filings.