investment attractiveness of voivodships and subregions in
TRANSCRIPT

INVESTMENT ATTRACTIVENESS OF VOIVODSHIPS AND SUBREGIONS IN POLAND 2016 1
aInvestment attractiveness of voivodships and subregions in Poland 2016

2 INVESTMENT ATTRACTIVENESS OF VOIVODSHIPS AND SUBREGIONS IN POLAND 2016
INVESTMENT ATTRACTIVENESS OF VOIVODSHIPS AND SUBREGIONS IN
POLAND 2016
Gdańsk 2016

INVESTMENT ATTRACTIVENESS OF VOIVODSHIPS AND SUBREGIONS IN POLAND 2016 3
Edited byStanisław Szultka
AuthorsPhD Aleksandra Borowicz
Martyna KostyraMaciej Dzierżanowski
Stanisław SzultkaMarcin Wandałowski
Designbujny.com
ISBN: 978-83-7615-132-8

4 INVESTMENT ATTRACTIVENESS OF VOIVODSHIPS AND SUBREGIONS IN POLAND 2016
© THE GDAŃSK INSTITUTE FOR MARKET ECONOMICS
80-227 Gdansk, ul. Do studzienki 63
TEL. +48 58 524 49 00FAX +48 58 524 49 08
KONRAD-ADENAUER-STIFTUNG POLAND OFFICE02-561 Warszawa,
ul. J. Dabrowskiego 56TEL. +48 22 845 93 30FAX. +48 22 848 54 37
[email protected], WWW.KAS.DE
RESEARCH CONDUCTED AT THE GDANSK INSTITUTE FOR MARKET ECONOMICS
IN COOPERATION WITH THE KONRAD-ADENAUER-STIFTUNG

INVESTMENT ATTRACTIVENESS OF VOIVODSHIPS AND SUBREGIONS IN POLAND 2016 5
Table of contents1. 1. Introduction 6
2. Investment attractiveness of voivodships 8
2.1. Investment attractiveness of voivodships 8
2.2. Investment attractiveness of subregions 12
3. Investment attractiveness of voivodships according to location factors 14
3.1. Importance of individual location factors 14
3.2. Labor resources and costs 14
3.3. Activity towards investors 14
3.4. Transport availability 15
3.5. Market capacity 15
3.6. Economic infrastructure 15
3.7. Social infrastructure 16
3.8. Public safety 16
4. Characteristics of different voivodships and their subregions 17
5. Scope and methods of research 82
5.1. Scope of research 82
5.2. Source data and methods of research 83
6. Factors of investment attractiveness from the regional perspective 84
6.1. Transport availability 84
6.2. Labor resources 84
6.3. Market capacity 84
6.4. Economic infrastructure 84
6.5. Social infrastructure 84
6.6. Level of economic development 85
6.7. Condition of the environment 85
6.8. Level of public safety 85
6.9. Activity of voivodships towards investors 85
7. Annex 86

6 INVESTMENT ATTRACTIVENESS OF VOIVODSHIPS AND SUBREGIONS IN POLAND 2016
1. Introduction industrial activities, services and high-tech activities. This year there is a new element included which is evaluation of attractiveness in these three categories also at the level of regions.
Thanks to the described assumptions and the developed research methodology, it is possible to track changes in spatial differentiation of investment attractiveness of Polish voivodships for foreign investors. Analyzing the results, it should be considered that they constitute a certain type of average attractiveness of regional centers and peripheral areas of voivodships. It is important as quite frequently investment attractiveness of a region is associated with attractiveness of the capital city of a voivodship which constitutes unauthorized simplification. This statement is even more important in the case of analyzing results referring to units with particularly large surface areas.
To bring differentiation of investment attractiveness closer inside voivodships, an analysis at the level of subregions was performed. The obtained image, despite being created with the use of a smaller number of criteria, reflects the functional and spatial structure of the country much better, and therefore – territorial differentiation of investment attractiveness of the country - much more precisely.
In the current edition of the report, we introduced several changes which constitute a kind of evolution of the methodology of researching investment attractiveness of regions and subregions of Poland. First, we would like the report to take evaluation of the innovation potential, human capital and quality of life into account more than in previous editions. Second, we introduced elements concerning economic specializations of particular regions and incoming foreign investments being consistent with them. Such modifications aim at keeping up with the structural changes taking place in Polish economy observed both at the level of particular enterprises (looking for an exit strategy from the subcontracting model) as well as at the macro level – strengthening specializations generating higher added value based on high-tech activities to a greater extent. These trends also translate into changes in strategies to attract foreign investments which are increasingly profiled concerning the existing or developing economic specializations in a given region. A consequence of these changes is also another system of presenting results, the key element of which is introduction of profiles of particular regions.
Based on experience from the previous editions of the report, attention should be paid to the fact that its results are often interpreted in the category of success or failure of regional or local policy. It should be noted that investment policy, the fundamental task of which is to increase investment attractiveness, is a fragment of broad policy for regional or local development. Optics of investors assumed in the report do not constitute the only and most important aspect of the development
The Gdansk Institute for Market Economics (IBNGR) for the twelfth time performed an analysis of the spatial differentiation of investment attractiveness of Poland for foreign investors. Its result is another edition of the report “Investment attractiveness of voivodships and subregions of Poland”.
The purpose of the report is to specify differences in investment attractiveness of Polish voivodships and subregions. Investment attractiveness is understood as an ability to encourage investment through offering combinations of location benefits possible to achieve within business activities. Areas offering an optimal combination of location factors create the best conditions for enterprises to function, and in consequence they attract investors.
The report contains results of the analysis of investment attractiveness of voivodships and subregions. In the case of voivodships, general characteristics of investment attractiveness were defined, focusing on universal factors – essential nearly for all types of investments. Sector-specific features were also defined referring to three categories of investments: industrial activities, services and high-tech activities. Characteristics of subregions are related only to three categories of investments: industrial activities, services and high-tech activities.
Investment attractiveness has a multi-dimensional nature. To reflect it in the most detailed manner possible, several dozen variables were analyzed constituting the basis of spatial differentiation of particular benefits (factors) of location, such as transport availability, labor costs, size and quality of labor resources, market capacity, the level of development of economic and social infrastructure, the level of economic development, the level of public safety, activity of the voivodship in relation to investors. Depending on the type of business activities, various significance was given to them.
The principle according to which the report is supposed to represent the spatial differentiation of the conditions of investment attractiveness in a given timeframe as reliably as possible has been maintained in the current edition. Sometimes its maintenance requires certain modifications of research methods concerning most of all selection of indicators and their weights, depending on evolution of investors’ preferences and social and economic changes taking place in voivodships. Simultaneously, in order to maintain comparability of results in subsequent reports, an assumption was made that modifications of research methods should be limited to allow analysis of changes in synthetic values of investment attractiveness indicators in particular years.
Similar to the reports from the period 2005 to 2015, synthetic evaluation of investment attractiveness of voivodships and evaluation of attractiveness of subregions in three categories were conducted:
INVESTMENT ATTRACTIVENESS OF VOIVODSHIPS AND SUBREGIONS IN POLAND 2016 7
strategy of regions and cities. Creating investment attractiveness is therefore not a purpose itself (even though this report is limited to this matter), but it constitutes a tool to make the vision of development real and it should be evaluated in this context. It should also be highlighted that investment policy is not able to shape all location factors the level of which is often an effect of long-term and complex social and economic processes. Therefore, the report, in particular referring to voivodships, cannot be treated as a review of actions
of particular voivodship local governments concerning implementation of the development strategy. Even the category of activity towards investors does not only concern voivodship local governments. Also local governments, enterprises and natural people as well as specialized institutions (e.g. special economic zones, regional and local development agencies) are responsible for a large number of investment offers, and information and promotional activity.

8 INVESTMENT ATTRACTIVENESS OF VOIVODSHIPS AND SUBREGIONS IN POLAND 2016
2.1. Investment attractiveness of voivodships
Based on the results of this year’s study, we divided voivodships into five classes: with the highest (1-3 positions in the comparison), high (4-6), average (7-9), low (10-12) and the lowest investment attractiveness. This division refers only to positions gained by regions in the study; however, it does not present the scale of differences between particular regions. Therefore, it may occur that e.g. the difference in investment attractiveness between two regions from neighboring
classes is smaller than between two voivodships from the same class. The values of the investment attractiveness indicator for each voivodship are included in the collective table in the annex at the end of the report.
The Śląskie Voivodship remains the absolute leader regarding investment attractiveness. Its greatest attributes are very broad labor resources, the second largest market in Poland, very high activity of the region towards investors as well as very well-developed economic and social infrastructure.
2. Investment attractiveness of voivodships and subregions
Figure 1. Investment attractiveness of voivodships in 2016
Source: prepared by IBNGR.
The Dolnośląskie and Mazowieckie Voivodships were also on the podium. The former is characterized by great activity towards investors as well as the best developed economic infrastructure in Poland. While the attributes of the Mazowieckie Voivodship include most of all very high transport availability and the largest market in Poland. The position of the region could be higher if it was not for the highest labor costs in Poland.
High investment attractiveness is a typical feature of the following voivodships in Poland: Małopolskie, Wielkopolskie and Zachodniopomorskie. These three regions have high or average positions in most aspects of investment attractiveness. However, configuration of these attributes is rather diverse. The greatest attribute of the Małopolskie and Wielkopolskie Voivodships
are large labor resources with quite competitive remuneration in comparison to similar regions. In the case of the first one, its very well-developed social infrastructure and quite large market also constitute its significant attributes, while in the case of the second one – they include high activity towards investors and very large transport availability. It is also one of the main attributes of the Zachodniopomorskie Voivodship which is also characterized by very high activity towards investors.
Highest
High
Average
Low
Lowest

INVESTMENT ATTRACTIVENESS OF VOIVODSHIPS AND SUBREGIONS IN POLAND 2016 9
The group of voivodships with average attractiveness includes: Łódzkie, Pomorskie and Opolskie. The general value of the investment attractiveness indicator in the case of the first two is higher than average, while in the case of the Opolskie Voivodship – it is lower. Factors impacting investment attractiveness of the Łódzkie Voivodship are most of all labor resources with relatively low remuneration as well as more than average communication availability. The Pomeranian region is characterized by high activity towards investors and one of the largest markets in Poland.
In the class of regions with low attractiveness there are the following voivodships: Kujawsko-pomorskie, Lubuskie and Podkarpackie, while in the class of voivodships with the lowest attractiveness: Świętokrzyskie, Lubelskie, Warmińsko-mazurskie and Podlaskie. Their position is most of all a consequence of long-term social and economic processes. Low intensity of urbanization and industrialization in the period when these processes made deep transformations in numerous regions of Europe and some of Poland, did not allow formation of relevant critical mass (benefits of scale and agglomeration) concerning the most important resources for large investors. Despite the progress in extension and modernization of infrastructure at the national level, these areas are still characterized by low transport availability.
Low or very low investment attractiveness of voivodships does not mean that they do not have a chance to attract large investors – such chances exist, but they are smaller than in other voivodships. They can be increased, strengthening investment attractiveness
Figure 2. Investment attractiveness indicator for particular voivodships
Source: prepared by IBNGR.
for business activities based on unique resources and attributes of the regions – naturally they have not been included in the comparative analysis – and seeking not necessarily large investors, but those who can efficiently take advantage of available attributes.
In comparison to 2015 several transformations were observed in differentiation of investment attractiveness at the level of regions. The most significant change is certainly promotion of the Dolnośląskie Voivodship to second position, and therefore the fall of the Mazowieckie Voivodship to third position. Concerning other changes – the Łódzkie Voivodship took over the Pomeranian region and has seventh position, while the Warmińsko-mazurskie Voivodship was taken over by the Świętokrzyskie and Lubelskie Voivodships.
For the first time, voivodships were also evaluated concerning three investment categories: industrial activities, services and high-tech activities. Similar to the general comparison of investment attractiveness, we also divided them into five classes according to the position they took in particular comparisons. Detailed results of the study were presented in the tables in the annex at the end of the report.
Leaders of the comparison of voivodships with the highest investment attractiveness for industrial activities are two regions with the richest industrial traditions in Poland – Śląskie Voivodship and Dolnośląskie Voivodship. The Łódzkie Voivodship took third position. The least attractive from the perspective of industrial development are regions in the east (apart from Podkarpackie) and north-east of Poland.
-0,8 -0,6 -0,4 -0,2 0 0,2 0,4 0,6 0,8 1
PodlaskieWarmińsko-mazurskie
LubelskieŚwiętokrzyskiePodkarpackie
LubuskieKujawsko-pomorskie
OpolskiePomorskie
ŁódzkieZachodniopomorskie
WielkopolskieMałopolskieMazowieckieDolnośląskie
Śląskie

10 INVESTMENT ATTRACTIVENESS OF VOIVODSHIPS AND SUBREGIONS IN POLAND 2016
Figure 4: Investment attractiveness of voivodships concerning services in 2016Source: prepared by IBNGR.
Figure 3. Investment attractiveness of voivodships concerning industrial activities in 2016Source: prepared by IBNGR.
Highest
High
Average
Low
Lowest
Highest
High
Average
Low
Lowest

INVESTMENT ATTRACTIVENESS OF VOIVODSHIPS AND SUBREGIONS IN POLAND 2016 11
Regarding investment attractiveness from the perspective of services, the first three positions are taken by the following voivodships: Śląskie, Mazowieckie and Małopolskie. The least attractive are: Lubuskie, Lubelskie, Warmińsko-mazurskie and Podlaskie Voivodships, and therefore regions on which there are no metropolitan areas with the greatest importance for Poland, constituting a magnet attracting activities in the field of services.
Figure 5: Investment attractiveness of voivodships concerning high-tech activities in 2016Source: prepared by IBNGR.
Concerning high-tech activities regions offering most of all the highest quality of labor resources have the highest positions: Mazowieckie, Małopolskie and Dolnośląskie Voivodships. At the end of the list there are voivodships located far from the western border – and therefore from potential markets – within which the most important academic centers in Poland, apart from Lublin, are not situated. They are: Warmińsko-mazurskie, Podlaskie, Lubelskie and Świętokrzyskie Voivodships.
Highest
High
Average
Low
Lowest

12 INVESTMENT ATTRACTIVENESS OF VOIVODSHIPS AND SUBREGIONS IN POLAND 2016
2.2. Investment attractiveness of subregions
Apart from voivodships, also subregions were evaluated – concerning investment attractiveness for industrial activities, services and high-tech. They were also divided into five classes according to positions taken in particular comparisons. Subregions with the highest investment attractiveness had 1-12 position, with high – 13-24, average – 25-36, low – 37-48 and the lowest -49-60.
Among those with the highest investment attractiveness concerning industrial activities there were two compact
areas located in the south of Poland. One of them is shaped around Upper Śląskie and western Małopolskie, while another one around Wrocław, Jelenia Góra and Wałbrzych – industrial centers of Dolnośląskie. They are distinguished by long industrial traditions and therefore – a well-developed sector of production enterprises, specialized labor market and relatively good transport availability thanks to A4 motorway. Apart from the discussed area, high attractiveness from the perspective of industry is also typical for the following subregions: Łódź, Poznań and Bydgoszcz-Toruń.
Figure 6: Investment attractiveness of subregions concerning industrial activities in 2016Source: prepared by IBNGR.
Highest
High
Average
Low
Lowest

INVESTMENT ATTRACTIVENESS OF VOIVODSHIPS AND SUBREGIONS IN POLAND 2016 13
Figure 7: Investment attractiveness of subregions concerning services in 2016
Source: prepared by IBNGR.
The highest level of investment attractiveness concerning services is typical for the main subregions of a metropolitan nature. Their centers are the largest Polish cities. Most of all, they have large resources of employees with high and variously profiled competencies as well as large and capable markets. Apart from that, the largest cities offer very good communication availability and well-developed economic infrastructure. This year’s leader is the subregion of Warsaw and it is followed by the subregions of Łódź and Kraków.
The group of subregions with the highest level of investment attractiveness for high-tech activities was also dominated by subregions of a metropolitan nature. Infrastructure and research and development personnel are concentrated there. Labor market resources include specialists educated in local academic centers as well as encouraged to migrate by good living conditions, including developed cultural environment. These centers are characterized simultaneously by the best developed ICT infrastructure and relatively high availability of passenger transport. The highest positions in this year’s comparison were taken by the following subregions: Warsaw, Kraków and Poznań.
Figure 8: Investment attractiveness of subregions concerning high-tech activities in 2016
Source: prepared by IBNGR.
Highest
High
Average
Low
Lowest
Highest
High
Average
Low
Lowest
14 INVESTMENT ATTRACTIVENESS OF VOIVODSHIPS AND SUBREGIONS IN POLAND 2016
3. Investment attractiveness of voivodships according to location factors
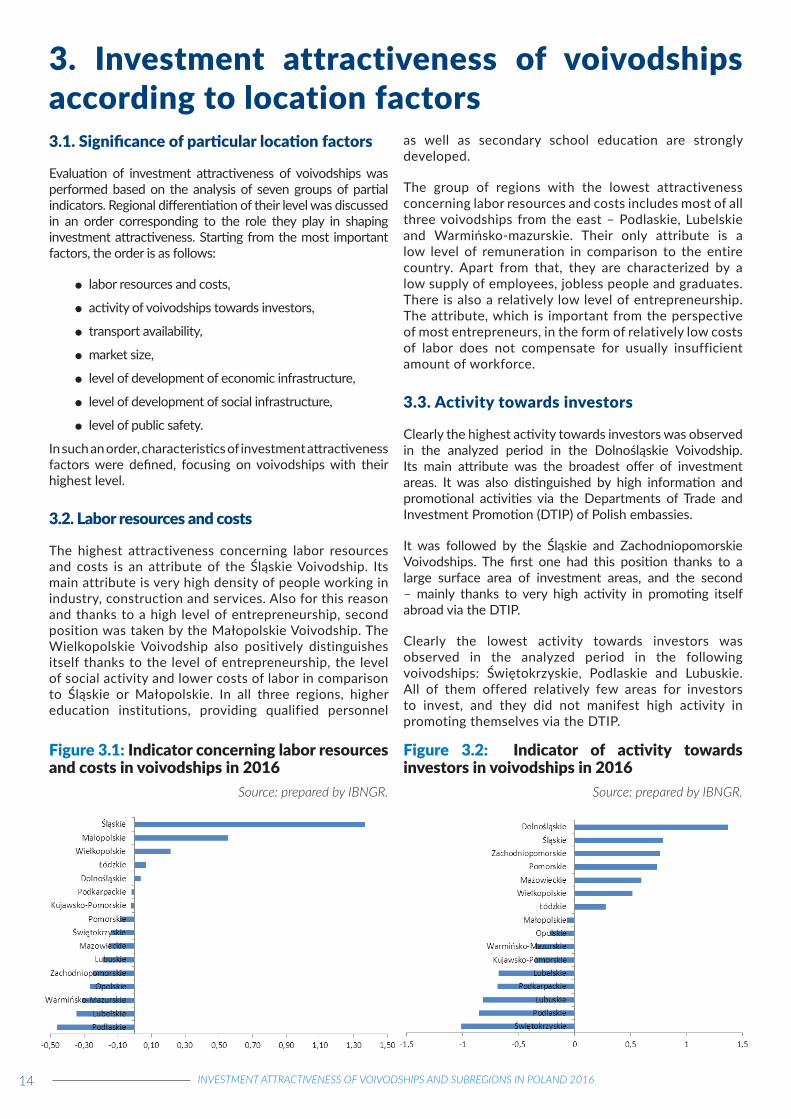
as well as secondary school education are strongly developed.
The group of regions with the lowest attractiveness concerning labor resources and costs includes most of all three voivodships from the east – Podlaskie, Lubelskie and Warmińsko-mazurskie. Their only attribute is a low level of remuneration in comparison to the entire country. Apart from that, they are characterized by a low supply of employees, jobless people and graduates. There is also a relatively low level of entrepreneurship. The attribute, which is important from the perspective of most entrepreneurs, in the form of relatively low costs of labor does not compensate for usually insufficient amount of workforce.
3.3. Activity towards investors
Clearly the highest activity towards investors was observed in the analyzed period in the Dolnośląskie Voivodship. Its main attribute was the broadest offer of investment areas. It was also distinguished by high information and promotional activities via the Departments of Trade and Investment Promotion (DTIP) of Polish embassies.
It was followed by the Śląskie and Zachodniopomorskie Voivodships. The first one had this position thanks to a large surface area of investment areas, and the second – mainly thanks to very high activity in promoting itself abroad via the DTIP.
Clearly the lowest activity towards investors was observed in the analyzed period in the following voivodships: Świętokrzyskie, Podlaskie and Lubuskie. All of them offered relatively few areas for investors to invest, and they did not manifest high activity in promoting themselves via the DTIP.
Figure 3.1: Indicator concerning labor resources and costs in voivodships in 2016
Source: prepared by IBNGR.
Figure 3.2: Indicator of activity towards investors in voivodships in 2016
Source: prepared by IBNGR.
3.1. Significance of particular location factors
Evaluation of investment attractiveness of voivodships was performed based on the analysis of seven groups of partial indicators. Regional differentiation of their level was discussed in an order corresponding to the role they play in shaping investment attractiveness. Starting from the most important factors, the order is as follows:
labor resources and costs,
activity of voivodships towards investors,
transport availability,
market size,
level of development of economic infrastructure,
level of development of social infrastructure,
level of public safety.
In such an order, characteristics of investment attractiveness factors were defined, focusing on voivodships with their highest level.
3.2. Labor resources and costs
The highest attractiveness concerning labor resources and costs is an attribute of the Śląskie Voivodship. Its main attribute is very high density of people working in industry, construction and services. Also for this reason and thanks to a high level of entrepreneurship, second position was taken by the Małopolskie Voivodship. The Wielkopolskie Voivodship also positively distinguishes itself thanks to the level of entrepreneurship, the level of social activity and lower costs of labor in comparison to Śląskie or Małopolskie. In all three regions, higher education institutions, providing qualified personnel

INVESTMENT ATTRACTIVENESS OF VOIVODSHIPS AND SUBREGIONS IN POLAND 2016 15
3.4 Transport availability
The highest transport availability was typical for regions closest to the western border – Wielkopolskie, Zachodniopomorskie, Lubuskie and Dolnośląskie. The leader concerning transport availability is still the Mazowieckie Voivodship, from which it is much further to Germany, but its attribute is the short time necessary to get to the capital city. Therefore, the Łódzkie Voivodship is relatively high in the discussed ranking. An attribute among the listed voivodships is a well-developed sector of logistics and transport.
The lowest attractiveness concerning transport availability is typical for regions in the east of Poland, furthest from the western border. They are mostly the following voivodships: Podlaskie, Warmińsko-mazurskie, Podkarpackie and Lubelskie. In each of them, the sector of transport and logistics is also poorly developed. In the case of the first two, significant distance from a larger international airport also has a negative impact. A potential attribute of three voivodships – Lubelskie, Podlaskie and Warmińsko-mazurskie – which may favor the solution of transport problems is relative proximity of Warsaw. To use the possibilities of this hub, further modernization works of infrastructure are necessary, which will significantly shorten the time of journey from the listed regions to Warsaw.
3.5. Market capacity
Voivodships with the largest market capacity are mostly those with the wealthiest households and which can afford larger expenses. Considering this, Mazowieckie is the leader; then Dolnośląskie and Upper Śląskie can be listed. However, the higher position of Śląskie in the market classification results from greater investment demand in the region.
The smallest market is typical for the following voivodships: Świętokrzyskie, Warmińsko-mazurskie, Podlaskie and Lubelskie. They are regions which are relatively poorly populated, in which households and enterprises generate clearly lower demand.
3.6. Economic infrastructure
Regarding the extent of development of economic infrastructure in this year’s comparison, the Dolnośląskie Voivodship is definitely the leader. It results mostly from efficient operation of special economic zones (SEZ) and in particular – a very broad offer of available investment areas in SEZ. Dolnośląskie is also characterized by a well-developed research and development (R&D) sector. It is followed by the Śląskie and Mazowieckie Voivodships. First of them has its position mostly thanks to the results of functioning of special economic zones, while the second – thanks to the best developed R&D sector among all regions.
The least favored regarding economic infrastructure are the following voivodships: Kujawsko-pomorskie, Podlaskie and Świętokrzyskie. In these areas, the R&D infrastructure is poorly developed. They have a rather narrow supply of available investment areas in SEZ. In all among three
Figure 3.3: Indicator of transport availability of voivodships in 2016
Source: prepared by IBNGR.
Figure 3.4: Indicator of market capacity of voivodships in 2016
Source: prepared by IBNGR.
Figure 3.5: Indicator of economic infrastructure of voivodships in 2016
Source: prepared by IBNGR.

16 INVESTMENT ATTRACTIVENESS OF VOIVODSHIPS AND SUBREGIONS IN POLAND 2016
discussed areas, also rather limited activity towards investors was observed. In the case of the Świętokrzyskie Voivodship, a traditional attribute involves significant operations within expo and exhibition activities; however, despite that, it is not able to increase its position in this ranking.
3.7. Social infrastructure
The level of development of social infrastructure is definitely highest in the Śląskie and Małopolskie Voivodships. The largest attribute of the first one is a very broad cultural offer, while of the second one – high tourist attractiveness, the result of which is well-developed tourist infrastructure. In both of these aspects, also the Dolnośląskie Voivodship is developed above the average, therefore it took third position.
The lowest level of social infrastructure is observed in the following voivodships: Lubelskie, Podlaskie, Lubuskie and Opolskie. All of them are characterized by low intensity of cultural life and poorly developed tourist infrastructure.
3.8. Public safety
The highest level of public safety is usually traditionally observed in regions with a low level of urbanization, the capital cities of which are not the largest metropolitan areas in Poland. Therefore, the following voivodships have highest positions: Podkarpackie, Lubelskie, Świętokrzyskie and Podlaskie. All these regions are characterized by a low level of crime and a high level of crime detection. The leader regarding the first indicator is the Podkarpackie Voivodship, while concerning the second indicator – the Świętokrzyskie Voivodship.
A voivodship with clearly the lowest level of public safety is the Dolnośląskie Voivodship. It is characterized by the highest crime level in Poland and one of the lowest levels of crime detection. It is followed by the following voivodships: Mazowieckie, Śląskie, Pomorskie and Lubuskie. In the Śląskie and Lubuskie Voivodships a high crime level is observed, while in the Mazowieckie and Pomorskie Voivodships – a low level of crime detection.
Figure 3.6: Indicator of social infrastructure in voivodships in 2016
Source: prepared by IBNGR.
Figure 3.7: Indicator of public safety in voivodships in 2016
Source: prepared by IBNGR.

INVESTMENT ATTRACTIVENESS OF VOIVODSHIPS AND SUBREGIONS IN POLAND 2016 17
Dolnośląskie VoivodshipInvestment attractiveness:
Position in Poland - 2Investment attractiveness
Industry Highest
Services High
High-tech Highest
Regional approach:Region in figures Innovation
Value Position Value Position
Population 2 904 207 5R&D expenditures [million PLN]
1 282,0 5
Surface area [km2] 19 947 7 Industrial enterprises innovatively active 23,1 1
Average gross remuneration 4204,24 3 Service enterprises innovatively active 11,9 6
Registered unemployment rate 7,3 4Expenditures on innovative activity in industrial enterprises [million PLN]
2956,5 3
Disposable income per person per household 1 472 2
Expenditures on innovative activity in service enterprises [million PLN]
663,3 3
Quality of life [max. 10] 4,3 9Number of students in higher education institutions per 1,000 inhabitants
46 3
The Dolnośląskie Voivodship took over the Mazowieckie Voivodship in this year’s edition of the report and concerning investment attractiveness it took second position among Polish regions. Three matters mostly decided about the improvement of the region’s position - vibrant functioning of four SEZ present in Dolnośląskie, the highest activity towards investors among the regions as well as the third large market in Poland. Improvement of the last of these aspects was particularly affected by a significant increase of disposable income of households generating growth of local demand. Regarding most of the analyzed factors of investment
attractiveness, the region has been maintaining high position among other voivodships. It is the leader regarding the extent of development of economic infrastructure; it is also among leaders regarding the extent of development of social infrastructure. Its largest disadvantage is certainly the lowest level of public safety in Poland related mostly to a very high level of crime.
From the industrial perspective, the Dolnośląskie Voivodship is particularly attractive for industrial and high-tech investments – in the regional classification it takes second

18 INVESTMENT ATTRACTIVENESS OF VOIVODSHIPS AND SUBREGIONS IN POLAND 2016
and third position. It is favored by very large labor resources, including high quality resources, well-developed economic infrastructure as well as high communication availability. An attribute of the region is also very high productivity of work in the industrial sector. Dolnośląskie takes fourth position only concerning service activities, being taken over
Chart: Factors of investment attractiveness of the Dolnośląskie Voivodship in 2016
Source: IBNGR
-2,00 -1,50 -1,00 -0,50 0,00 0,50 1,00 1,50 2,00
Labor resources and costs
Activity towards investors
Transport availability
Market
Economic infrastructure
Social infrastructure
Public safety
Chart: Change in the position of the Dolnośląskie Voivodship in comparison to other regions in 2014‒2016
Source: IBNGR
0
1
2
Laborresources and
costs
Activitytowardsinvestors
Transportavailability
Market Economicinfrastructure
Socialinfrastructure
Public safety
Foreign investments and regional specializations
Number of foreigninvestors in 2015: 192
Chart: Industry structure of foreign investments
Intelligent specializations:
Chemical and pharmaceutical industry,Spatial mobilityHigh quality foodNatural and secondary resourcesProduction of machinery and equipment, processing of materialsInformation and communication technologies (ICT)
machinery and metal industry
31
food industry 7
construction 15
chemistry 10
wood and furniture 8
electronics and electrics
10 power engineering 4
ICT 14
medicine 6
production and sale of means of transport
34
transport 4
rubber and plastic products
12
business-related services
15
others 22
by the following voivodships: Śląskie, Mazowieckie and Małopolskie. The resources of the region allow it to have very high position also in this sector.

INVESTMENT ATTRACTIVENESS OF VOIVODSHIPS AND SUBREGIONS IN POLAND 2016 19
In 2015 in the Dolnośląskie Voivodship 192 foreign inve-stors invested more than 1 million USD. Based on the indu-stry structure of foreign investors, it is possible to indicate the specializations within production and sale of means of transport (34 investors) and machinery and metal industry (31). In total, they constitute more than 1/3 of the discus-sed group. Simultaneously, these two areas of activities of investors are strongly related to two intelligent specializa-tions of the Dolnośląskie Voivodship – spatial mobility and production of machinery and devices. The remaining enter-prises from the analyzed group are characterized by relati-vely large dispersion and it is difficult to indicate areas of concentration. It is also worth paying attention to the fact that in the industry structure there are enterprises which are also consistent with the intelligent specializations iden-tified in the region, such as ICT and healthy food. However, their number is relatively small which indicates little impor-tance for regional economy.
Subregional approachThe Wrocław subregion is definitely the best location for industrial, service and high-tech activities. It is mostly affected by excellently developed economic infrastructure – the largest number of available investment areas in special economic zones in Poland which are located here (belonging mainly to Legnica SEZ and Wałbrzych SEZ). Moreover, previous effects of their functioning – in particular concerning expenditures – are highest in Poland. As a large metropolitan area, Wrocław also ensures high supply of labor resources, and due to its location, it also offers very high communication availability, especially to the western border. From the perspective of industrial activities, products of which are exported to the west to a large extent, this factor becomes significant.
Considering the fact that practically the entire Dolnośląskie region is characterized by rich industrial traditions, other subregions located here are also characterized by high investment attractiveness for industrial activities. The Jelenia Góra subregion is the leader, taking eleventh position in the scale of the entire country. Its attribute is most of all high activity of special economic zones – Kamienna Góra SEZ, Legnica SEZ and Wałbrzych SEZ. The two remaining subregions: Wałbrzych and Legnica-Głogów also have good, above average in Poland, conditions for development of
industrial activities. The main attribute of the Wałbrzych subregion is high activity of SEZ, including high supply of available investment areas within them, while in the case of the Legnica-Głogów subregion – it is both activity of the zones as well as very high added value per person working in the industry caused mainly by the presence of the copper giant – KGHM.
Concerning location of service activities in the Dolnośląskie region, much larger disproportions are observed. The unquestionable leader is obviously Wrocław, being one of the largest and best-communicated Polish metropolitan areas. It is characterized by one of the highest added value in Poland per person working in services, high supply of qualified workforce as well as high investment expenditures of enterprises. Similar to the case of attracting industrial enterprises, dynamically operating SEZ also constitute an attribute. They constitute an attribute of all subregions of the voivodships. Also, the Wałbrzych subregion is a subregion with high location attractiveness for services. Even though in most aspects it gives way to the capital city of the voivodship, it is distinguished by a beneficial structure of economy and activity of economic zones mentioned before. The same attributes and high added value per person working in services allow the Jelenia Góra subregion to be included in the class of areas with average investment attractiveness concerning services. The Legnica-Głogów subregion is the least suitable in the Dolnośląskie Voivodship for location of such investments as it is included in the group of the least attractive subregions in Poland concerning this aspect.
The interregional leader concerning location of high-tech investments is the Wrocław subregion characterized by excellently developed economic infrastructure, very high communication availability (particularly thanks to A4 motorway and Wrocław-Strachowice airport), large resources of well-qualified employees, mostly educated at renown Wrocław universities as well as – which in the case of high-tech is extremely important – high quality of life and a well-developed sector of culture. High attractiveness of other Dolnośląskie subregions was affected by active operations of SEZ; however, factors such as high or average institutional market capacity or – in particular in the case of the Legnica-Głogów subregion – a high level of development of economy, are also important.

20 INVESTMENT ATTRACTIVENESS OF VOIVODSHIPS AND SUBREGIONS IN POLAND 2016
Population 570 293 **Surface area 5571 **Average gross remuneration 3549 **Registered unemployment rate 9,7 **Number of students in higher education institutions per 1,000 inhabitants
4 *
Investment attractivenessIndustry Highest
Services Average
High-tech High
subregions
Population 664 894 ***Surface area 4179 ***Average gross remuneration 3657 ***Registered unemployment rate 11,7 ***Number of students in higher education institutions per 1,000 inhabitants
6 ***
Investment attractivenessIndustry High
Services High
High-tech High
Jelenia Góra Subregion
Wałbrzych Subregion
Wrocław Subregion
Legnica-GłogówSubregion
Population 451 458 **Surface area 3472 *Average gross remuneration 4943 ***Registered unemployment rate 8,4 **Number of students in higher education institutions per 1,000 inhabitants
15 **
Investment attractivenessIndustry High
Services Lowest
High-tech High
Population 1 217 562 ***Surface area 6725 ***Average gross remuneration 4219 ***Registered unemployment rate 5,0 ***Number of students in higher education institutions per 1,000 inhabitants
99 ***
Investment attractivenessIndustry Highest
Services Highest
High-tech Highest

INVESTMENT ATTRACTIVENESS OF VOIVODSHIPS AND SUBREGIONS IN POLAND 2016 21
Kujawsko-pomorskie VoivodshipInvestment attractiveness:
Position in Poland - 9Investment attractiveness
Industry Average
Services Average
High-tech Low
Regional approachRegion in figures Innovation
Value Position Value Position
Population 2 086 210 10R&D expenditures [million PLN]
364,4 10
Surface area [km2] 17 972 10 Industrial enterprises innovatively active 16 13
Average gross remuneration 3540 14 Service enterprises innovatively active 10,5 11
Registered unemployment rate 11,7 15Expenditures on innovative activity in industrial enterprises [million PLN]
942,2 10
Disposable income per person per household 1 246 13
Expenditures on innovative activity in service enterprises [million PLN]
322,5 9
Quality of life [max. 10] 4,3 9Number of students in higher education institutions per 1,000 inhabitants
30 8
In this year’s study on investment attractiveness, the Kujawsko-pomorskie Voivodship took tenth position. Therefore, it maintained the position it had a year ago as well as two years ago. This region is still in the group of regions with average investment attractiveness. It is worth paying attention especially to an increase of transport availability of the voivodship in comparison to other regions in the last three years. Mainly thanks to the completion of A1 motorway, the time of travelling to Warsaw and to the western border shortened significantly which allowed the voivodship to take over the following voivodships concerning communication
availability: Małopolskie and Opolskie. In recent years, the position of the region regarding social infrastructure and public safety improved slightly, as well. From the perspective of the last three years, the most noticeable decrease concerned factors related to economic infrastructure, i.a. poor development of the R&D sector as well as small surface area of available investment areas in SEZ. Thus, the Kujawsko-pomorskie Voivodship took the last position among other regions concerning this. In the last three years in comparison to other voivodships, its position concerning labor resources and costs as well as activity towards investors slightly worsened.

22 INVESTMENT ATTRACTIVENESS OF VOIVODSHIPS AND SUBREGIONS IN POLAND 2016
From the industry perspective, the Kujawsko-pomorskie Voivodship is the most attractive voivodship for the location of industrial activities. Concerning this, it takes seventh position among other regions. The region is also relatively
Chart: Factors of investment attractiveness of the Kujawsko-pomorskie Voivodship in 2016
Source: IBNGR
-2,00 -1,50 -1,00 -0,50 0,00 0,50 1,00 1,50 2,00
Labor resources and costs
Activity towards investors
Transport availability
Market
Economic infrastructure
Social infrastructure
Public safety
Chart: Change in the position of the Kujawsko-pomorskie Voivodship in comparison to other regions in 2014‒2016
Source: IBNGR
-2
-1
0
1
2
Laborresources and
costs
Activitytowardsinvestors
Transportavailability
Market Economicinfrastructure
Socialinfrastructure
Public safety
Foreign investments and regional specializations
Number of foreigninvestors in 2015: 81
Chart: Industry structure of foreign investments
Intelligent specializations:
Healthy and safe foodHealth and health tourismAdvanced materials and toolsTransport and mobilityCultural heritage and creative industriesICT ServicesEco-innovationIndustrial automatics
rubber and plastic products
13
machinery and metal industry
14
food industry 9
wood and furniture 6
electronics and electrics
10
production and sale of means of
transport 6
sale 5
others 18
attractive for service activities. However, it seems that it has smaller chances to attract high-tech investments, but even in this aspect, in Poland it has tenth position which is not the worst.

INVESTMENT ATTRACTIVENESS OF VOIVODSHIPS AND SUBREGIONS IN POLAND 2016 23
In 2015 in the Kujawsko-pomorskie Voivodship 81 fo-reign investors located their investment with the value of at least 1 million USD. Based on the industry struc-ture, the largest investors can be indicated in: speciali-zations within machinery and metal industry (14 inve-stors), production of rubber and plastic products (13) as well as electronics and electrics (10). These three indu-stries concentrated more than 45% of foreign investors in the region. The machinery and metal industry as well as electronics and electrics are related directly to two areas identified as intelligent specializations of the vo-ivodship – i.e. advanced materials and tools and indu-strial automatics. Attention should be paid to the fact that in the Kujawsko-pomorskie Voivodship, the indu-stry profile of foreign investors (despite their relatively low number) is compliant with the identified areas of intelligent specializations. Both food industry as well as production and sale of means of transport are directly related to the industries identified as intelligent.
Subregional approachIn the class of subregions with the highest investment attractiveness to locate industrial activities there are two subregions of the Kujawsko-pomorskie Voivodship: Bydgoszcz-Toruń and Inowrocław which have 10th and 12th positions respectively among all these types of territorial units. The strengths of both subregions are direct factors, but apart from common features certain differences can be also indicated. The former includes most of all high transport availability related to the relatively short time necessary to get to the Tricity sea ports and shorter than average time to get to the western border from these regions. The Inowrocław subregion’s attribute is also the presence of very well-developed logistic and transport sector. Regarding the differences, the Bydgoszcz-Toruń subregion offers high supply of labor resources which the Inowrocław subregion – one of the lowest costs of labor in Poland. A relatively good place to locate industrial investments in the Kujawsko-pomorskie Voivodship is also the Włocławek subregion taking 23rd position among all subregions. Its attractiveness is based on very low costs of labor and very high deficiency of workplaces. A potential investor would not have problems finding employees for even the simplest positions. Investment attractiveness concerning industrial activities of the Grudziądz subregion should be evaluated as average (33rd position), while of the Świeć subregion – as low (43rd position). In both cases, low costs of labor cannot compensate for weaknesses of these subregions, such as small labor resources or very poorly developed economic infrastructure.
The only attractive location in the Kujawsko-pomorskie Voivodship from the perspective of investors from the service industry is the Bydgoszcz-Toruń subregion, which takes 8th position among all subregions. Its greatest attributes are high density of people working in services, availability of qualified personnel as well as high communication availability, conditioned mainly by the presence of the international Bydgoszcz-Szwederowo airport. High institutional market capacity is also important. The group of subregions with average investment attractiveness concerning service activities also includes the following subregions: Inowrocław (30th position), Grudziądz (33rd) and Włocławek (36th). Practically, their only attributes are low costs of labor and low pressure on their growth conditioned by a very high unemployment rate. Even these advantages – because of a slightly higher level of remuneration and insignificantly lower level of unemployment – disappear to a certain extent in the Świeć subregion which is included in the group of subregions with low investment attractiveness concerning service activities (42nd position).
In respect of attractiveness concerning high-tech investments, the disproportion between the Bydgoszcz-Toruń subregion and other parts of the voivodship is even larger than in the case of services. The subregion including both capital cities of the region is included in the classification at very high position – seventh. It was possible mainly thanks to high supply of qualified workforce, presence of renown universities and high communication availability (very high to the international airport and more than average to the western border and to Warsaw). Positive factors also include high institutional market capacity and a well-developed business-related institution sector. Other subregions of the Kujawsko-pomorskie Voivodship were evaluated - from the perspective of investors from the high-tech industry as average - (Inowrocław – mainly due to rather good transport availability), little (Włocławek) or very little attractive (Grudziądz and Świeć).

24 INVESTMENT ATTRACTIVENESS OF VOIVODSHIPS AND SUBREGIONS IN POLAND 2016
Population 363 568 *Surface area 3656 ***Average gross remuneration 3322 *Registered unemployment rate 18,2 *Number of students in higher education institutions per 1,000 inhabitants
6 **
Investment attractivenessIndustry High
Services Average
High-tech Low
subregions
Population 366 246 *Surface area 4005 *Average gross remuneration 3220
Registered unemployment rate 15,8 *Number of students in higher education institutions per 1,000 inhabitants
1 *
Investment attractivenessIndustry Highest
Services Average
High-tech Average
Włocławek subregionInowrocław
subregion
Grudziądz subregion
Bydgoszcz-Toruń subregion
Population 392 027 **Surface area 4054 *Average gross remuneration 3256 *Registered unemployment rate 13,1 *Number of students in higher education institutions per 1,000 inhabitants
1 *
Investment attractivenessIndustry Average
Services Average
High-tech Lowest
Population 189 646 *Surface area 3340 *Average gross remuneration 3375 **Registered unemployment rate 12,6 *Number of students in higher education institutions per 1,000 inhabitants
4 *
Investment attractivenessIndustry Low
Services Low
High-tech Lowest
Świeć subregion Population 774 723 ***Surface area 2917 **Average gross remuneration 3819 **Registered unemployment rate 6,5 ***Number of students in higher education institutions per 1,000 inhabitants
75 ***
Investment attractivenessIndustry Highest
Services Highest
High-tech Highest
INVESTMENT ATTRACTIVENESS OF VOIVODSHIPS AND SUBREGIONS IN POLAND 2016 25
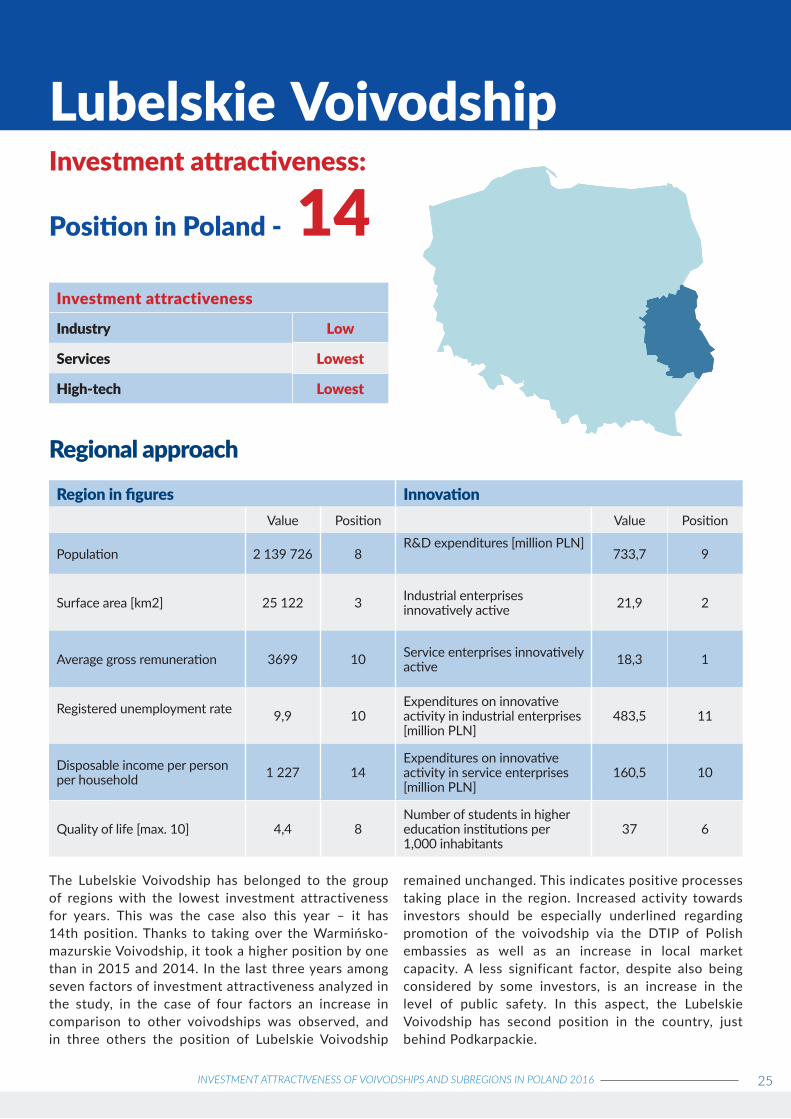
Lubelskie VoivodshipInvestment attractiveness:
Position in Poland - 14Investment attractiveness
Industry Low
Services Lowest
High-tech Lowest
Regional approachRegion in figures Innovation
Value Position Value Position
Population 2 139 726 8R&D expenditures [million PLN]
733,7 9
Surface area [km2] 25 122 3 Industrial enterprises innovatively active 21,9 2
Average gross remuneration 3699 10 Service enterprises innovatively active 18,3 1
Registered unemployment rate 9,9 10Expenditures on innovative activity in industrial enterprises [million PLN]
483,5 11
Disposable income per person per household 1 227 14
Expenditures on innovative activity in service enterprises [million PLN]
160,5 10
Quality of life [max. 10] 4,4 8Number of students in higher education institutions per 1,000 inhabitants
37 6
The Lubelskie Voivodship has belonged to the group of regions with the lowest investment attractiveness for years. This was the case also this year – it has 14th position. Thanks to taking over the Warmińsko-mazurskie Voivodship, it took a higher position by one than in 2015 and 2014. In the last three years among seven factors of investment attractiveness analyzed in the study, in the case of four factors an increase in comparison to other voivodships was observed, and in three others the position of Lubelskie Voivodship
remained unchanged. This indicates positive processes taking place in the region. Increased activity towards investors should be especially underlined regarding promotion of the voivodship via the DTIP of Polish embassies as well as an increase in local market capacity. A less significant factor, despite also being considered by some investors, is an increase in the level of public safety. In this aspect, the Lubelskie Voivodship has second position in the country, just behind Podkarpackie.

26 INVESTMENT ATTRACTIVENESS OF VOIVODSHIPS AND SUBREGIONS IN POLAND 2016
From the industry perspective, the Lubelskie Voivodship generally is not an attractive location for investment concerning industry, services or high-tech activities. It
Chart: Factors of investment attractiveness of the Lubelskie Voivodship in 2016
Source: IBNGR
-2,00 -1,50 -1,00 -0,50 0,00 0,50 1,00 1,50 2,00
Labor resources and costs
Activity towards investors
Transport availability
Market
Economic infrastructure
Social infrastructure
Public safety
Chart: Change in the position of the Lubelskie Voivodship in comparison to other regions in 2014‒2016
Source: IBNGR
0
1
2
Laborresources and
costs
Activitytowardsinvestors
Transportavailability
Market Economicinfrastructure
Socialinfrastructure
Public safety
Foreign investments and regional specializations
Number of foreigninvestors in 2015: 21
Chart: Industry structure of foreign investments
Intelligent specializations:
Bio-economyMedicine and healthLow-carbon energyInformation technology and automation
machinery industry 2 non-metal industry
1
food industry 2
textile industry 1
construction 1
wood and furniture 1
electronics and electrics
2
production and sale of means of
transport 2
aerospace industry 1
transport 1
business-related services
4
rubber and plastic products
3
has the best position – 12th – among regions concerning industrial investments, mainly due to competitive labor costs..

INVESTMENT ATTRACTIVENESS OF VOIVODSHIPS AND SUBREGIONS IN POLAND 2016 27
In 2015 in the Lubelskie Voivodship 21 foreign investors invested more than 1 million USD. Based on the indu-stry structure of foreign investors in comparison with most of the remaining voivodships, it can be concluded that foreign investors are completely scattered. It is not possible to indicate industries concentrating more than two entities apart from business-related services (4 investors). Regarding intelligent specializations, signi-ficant relations of enterprises investing directly in infor-mation technologies and automatics which is focused on production of machinery and devices for automoti-ve or aviation industries, can be indicated. In this area strengthening of this specialization by enterprises with the share of foreign capital can be observed.
Subregional approachIn the context of locating industrial investments, the most attractive subregion of the Lubelskie Voivodship, even though it is only average in the country (36th position), is the Lublin subregion. Its attribute are above average labor resources and above average productivity of the industrial sector. Other subregions are evaluated as little (Chełm-Zamość and Puławy) or very little (Biała Podlaska) attractive from the perspective of an industrial investor. Their only attribute is a relatively low level of remuneration. It seems that a barrier which is impossible to cross for all subregions of the Lubelskie Voivodship is low transport availability – conditioned mostly by its geographic location – in particular to the western border. Even greater disproportions between the core and peripheries of the voivodship are visible regarding attractiveness of subregions concerning investment in the field of services. The absolute leader is the Lublin subregion which has the 10th position in the country. Its attributes include most of all the size and quality of labor resources as well as high transport availability which concerning services is mostly conditioned by the proximity of Warsaw as well as of the international airport of Lublin. The Lublin subregion is also characterized by relatively high institutional market capacity. Other subregions of the Lubelskie Voivodship are either little (Puławy) or very little (Biała Podlaska, Chełm-Zamość) attractive for service activities. Slightly higher – 43rd – position in the country of the Puławy subregion results from better transport availability than the other two subregions. All subregions are characterized by rather competitive labor costs (in particular in the Biała Podlaska subregion); however, they are not able to compensate for deficiencies related to the small size and low quality of labor resources as well as low institutional market capacity. A similar – from the perspective of services – disproportion is also noticeable in the Lubelskie
Voivodship concerning investment attractiveness for high-tech activities. The absolute leader in the region is the Lublin subregion, which has 9th position in the country. Such a high position results mainly from high quality of labor resources, high institutional market capacity, above average productivity in the industrial sector as well as above average communication availability. Also, this factor mainly decided about the position of the Puławy subregion in the high twenties of subregions. The other two subregions – Biała Podlaska and Chełm-Zamość – which are characterized by very low transport availability, are included in the class of subregions with the lowest attractiveness to locate high-tech activities.

28 INVESTMENT ATTRACTIVENESS OF VOIVODSHIPS AND SUBREGIONS IN POLAND 2016
Population 636 541 **Surface area 9291 ***Average gross remuneration 3347 *Registered unemployment rate 11,1 **Number of students in higher education institutions per 1,000 inhabitants
6 **
Investment attractivenessIndustry Low
Services Lowest
High-tech Lowest
subregions
Population 486 619 **Surface area 5633 **Average gross remuneration 3455 **Registered unemployment rate 9,3 **Number of students in higher education institutions per 1,000 inhabitants
5 *
Investment attractivenessIndustry Low
Services Low
High-tech Average
Chełm-Zamość subregion
Puławy subregion
Lublin subregion
Biała Podlaska subregion
Population 305 116 *Surface area 5977 **Average gross remuneration 3363 *Registered unemployment rate 12,5 *Number of students in higher education institutions per 1,000 inhabitants
15 **
Investment attractivenessIndustry Lowest
Services Lowest
High-tech Lowest
Population 711 450 ***Surface area 4221 **Average gross remuneration 4020 ***Registered unemployment rate 8,4 **Number of students in higher education institutions per 1,000 inhabitants
95 ***
Investment attractivenessIndustry Average
Services Highest
High-tech Highest

INVESTMENT ATTRACTIVENESS OF VOIVODSHIPS AND SUBREGIONS IN POLAND 2016 29
Lubuskie VoivodshipInvestment attractiveness:
Position in Poland - 11Investment attractiveness
Industry Average
Services Lowest
High-tech Low
Regional approachRegion in figures Innovation
Value Position Value Position
Population 1 018 075 15R&D expenditures [million PLN]
89,4 16
Surface area [km2] 13 988 13 Industrial enterprises innovatively active 16,3 12
Average gross remuneration 3568 13 Service enterprises innovatively active 5,8 15
Registered unemployment rate 8,4 7Expenditures on innovative activity in industrial enterprises [million PLN]
272,8 13
Disposable income per person per household 1420 5
Expenditures on innovative activity in service enterprises [million PLN]
12,4 15
Quality of life [max. 10] 3,90 16Number of students in higher education institutions per 1,000 inhabitants
16 16
In this year’s comparison of investment attractiveness of regions, the Lubuskie Voivodship had 11th position. In recent years, the position of the region has not changed; it is protecting its position before the Podkarpackie Voivodship (12th position) and it is not able to take over the Kujawsko-pomorskie Voivodship. In three recent years, in comparison to other regions, the situation of the Lubuskie region has improved significantly regarding the size of the market conditioned i.a. by a clear nearly 15% increase of disposable income per person per household. Regarding the remaining
factors of investment attractiveness, the situation of the Lubuskie Voivodship in comparison to other voivodships remains unchanged or there is an insignificant decrease by one position. This happens in the case of labor resources and costs, activity towards investors and the extent of development of social infrastructure. However, these changes are insignificant so that they should not negatively affect the general image of the voivodship in the eyes of investors.

30 INVESTMENT ATTRACTIVENESS OF VOIVODSHIPS AND SUBREGIONS IN POLAND 2016
From the industry perspective, the Lubuskie Voivodship is definitely most attractive for location of industrial activities; however, in the scale of the country, it allows the region to have only 9th position among other voivodships. The largest attribute of the Lubuskie region in this context is the proximity of the western border, and therefore the market for a large part of industrial products manufactured in Poland. Due to the lack of large metropolitan areas,
Chart: Factors of investment attractiveness of the Lubuskie Voivodship in 2016Source: IBNGR
-2,00 -1,50 -1,00 -0,50 0,00 0,50 1,00 1,50 2,00
Labor resources and costs
Activity towards investors
Transport availability
Market
Economic infrastructure
Social infrastructure
Public safety
Chart: Change in the position of the Lubuskie Voivodship in comparison to other regions in 2014-2016
Source: IBNGR
-1
0
1
2
3
Laborresources and
costs
Activitytowardsinvestors
Transportavailability
Market Economicinfrastructure
Socialinfrastructure
Public safety
Foreign investments and regional specializations
Number of foreigninvestors in 2015: 58
Chart: Industry structure of foreign investments
Intelligent specializations:
Green economy
Health and Quality of life
Innovative Industry
metal industry 6 food industry
6
textile industry 3
wood and furniture 9
electronics and electrics
6 medicine
2
production and sale of means of transport
6
environment 2
transport 2
business-related services
2
rubber and plastic products
6
others 8
and thus a small number of labor resources and low institutional market capacity, the Lubuskie Voivodship has trouble attracting investors in the field of services to its area. Regarding this, it is the third least attractive region in the country. Regarding high-tech activities, it has an even lower position – 12th – and the main attributes are relatively high transport availability and relatively well-developed economic infrastructure.
INVESTMENT ATTRACTIVENESS OF VOIVODSHIPS AND SUBREGIONS IN POLAND 2016 31
In 2015 in the Lubuskie Voivodship 58 foreign investors invested more than 1 million USD. Based on the industry structure of foreign investors, significant dispersion of fo-reign investors between industries should be pointed out. Most of them – 9 – operate in the field of wood and fur-niture which is related to industries associated with wood processing, production of furniture and other products, such as paper and cardboard. Further five industries are represented by enterprises from the following industries: metal, food, electronics and electrics, production and sale of means of transport and rubber and plastic products (6 investors in each industry). These six areas constitute near-ly 60% of enterprises, in which in 2015 more than 1 million USD of foreign capital was invested. Referring to intelligent specializations of the region, special significance of foreign investors in strengthening regional specialization – innova-tive industry – should be mentioned. Also, presence of in-vestors related to the intelligent specialization: health and quality of life is noticeable.
Subregional approachThe most attractive location to locate industrial activities in the Lubuskie Voivodship is the Zielona Góra subregion. In comparison to all Polish subregions it has 17th position and its attractiveness concerning investments from sec-tor II can be determined as high. Its two basic attributes are: very high transport availability (which is especially im-portant from the perspective of industry – to the western border) and very large surface area of SEZ areas (mainly in Kostrzyn-Slubice SEZ). It allows to compensate a little for
the deficiencies of the subregion related to not the highest availability of labor resources and not the lowest level of re-muneration. This description – except for one – can apply to the Gorzów subregion which was in the group of sub-regions with average investment attractiveness concerning industrial activities. Its lower position in comparison to the position of the Zielona Góra subregion results mainly from significantly lower supply of available investment areas in SEZ. Regarding investment attractiveness concerning ser-vice activities, both subregions of the Lubuskie Voivodship belong to the group of areas with a low level of service activities. The Zielona Góra subregion had 40th position and the Gorzów subregion – 44th position among all sub-regions. Their only attributes, in particular in the context of the first one, are the well-developed sector of business-related institutions and the surface area of available invest-ment areas in SEZ. Transport availability, which was a large attribute of the entire voivodship in the context of indu-strial activities, becomes a disadvantage regarding services – from the areas of Gorzów Wielkopolski and Zielona Góra it is a long way to Warsaw, and within the region there is no international airport.
The Zielona Góra subregion will have slightly better chan-ces to attract high-tech investments in the Lubuskie Voi-vodship. In the general comparison, it has 24th position, while the Gorzów subregion has 29th position. The dif-ference between them is mostly related to two factors: higher quality of labor resource (most of all thanks to the University of Zielona Góra) and greater supply of available investment areas in SEZ in the Zielona Góra subregion.

32 INVESTMENT ATTRACTIVENESS OF VOIVODSHIPS AND SUBREGIONS IN POLAND 2016
subregions
Zielona Góra subregion
Gorzów subregion
Population 386 119 **Surface area 6113 **Average gross remuneration 3537 **Registered unemployment rate 7,7 ***Number of students in higher education institutions per 1,000 inhabitants
10 **
Investment attractivenessIndustry Average
Services Low
High-tech Average
Population 631 956 **Surface area 7875 ***Average gross remuneration 3589 **Registered unemployment rate 8,9 **Number of students in higher education institutions per 1,000 inhabitants
20 **
Investment attractivenessIndustry High
Services Low
High-tech High

INVESTMENT ATTRACTIVENESS OF VOIVODSHIPS AND SUBREGIONS IN POLAND 2016 33
Łódzkie VoivodshipInvestment attractiveness:
Position in Poland - 7Investment attractiveness
Industry Highest
Services Average
High-tech Average
Regional approachRegion in figures Innovation
Value Position Value Position
Population 2 493 603 6R&D expenditures [million PLN]
734,6 8
Surface area [km2] 18 219 9 Industrial enterprises innovatively active 15,8 14
Average gross remuneration 3 791 8 Service enterprises innovatively active 13 4
Registered unemployment rate 8,7 8Expenditures on innovative activity in industrial enterprises [million PLN]
2798,1 4
Disposable income per person per household 1 362 7
Expenditures on innovative activity in service enterprises [million PLN]
629,5 4
Quality of life [max. 10] 4,2 11Number of students in higher education institutions per 1,000 inhabitants
33 7
The Łódzkie Voivodship has been in the group of regions with above average investment attractiveness for years. This year, thanks to taking over the Pomorskie Voivodship, the Łódzkie region has 7th position, which is one position higher than in 2015 and 2014. It mainly results from two factors: a clear increase of Disposable income per person per household, increasing local market capacity as well as good effects of functioning of Łódź SEZ in the field of i.a. new workplaces and investment expenditures. Traditional advantages of the Łódzkie region in comparison to other voivodships are transport availability and promotional activity towards
investors. In the last three years, the situation of the Łódzkie voivodship in comparison to other voivodships has improved slightly concerning economic infrastructure thanks to the above-mentioned Łódź SEZ. However, in comparison to 2014 the position of the voivodship decreased by two regarding the level of development of social infrastructure. It results both from low tourist attractiveness of the Łódzkie region translating into a low level of development of the accommodation base as well as the averagely developed sector of culture.

34 INVESTMENT ATTRACTIVENESS OF VOIVODSHIPS AND SUBREGIONS IN POLAND 2016
From the industry perspective, the Łódzkie voivodship is definitely most attractive to locate industrial activities. It has third position in this aspect – after Śląskie and Dolnośląskie. It cannot be surprising as all these regions have rich industrial traditions. Attributes of the Łódzkie Voivodship are in this context especially: high supply of workforce,
Chart: Factors of investment attractiveness of the Łódzkie Voivodship in 2016
Source: IBNGR
-2,00 -1,50 -1,00 -0,50 0,00 0,50 1,00 1,50 2,00
Labor resources and costs
Activity towards investors
Transport availability
Market
Economic infrastructure
Social infrastructure
Public safety
Chart: Change in the position of the Łódzkie Voivodship in comparison to other regions in 2014-2016
Source: IBNGR
-2
-1
0
1
Laborresources and
costs
Activitytowardsinvestors
Transportavailability
Market Economicinfrastructure
Socialinfrastructure
Public safety
Foreign investments and regional specializations
Number of foreigninvestors in 2015: 115
Chart: Industry structure of foreign investments
Intelligent specializations:
Modern textile and fashion industry (including design)Advanced construction materialsMedicine, pharmacy, cosmeticsEnergy, including renewable energy sourcesInnovative agriculture and food processingInformation technology and telecommunications
machinery and metal industry
9 food industry
6 construction
9
chemistry 12
wood and furniture 7
electronics and electrics
9 power
engineering 4
ICT 5
production and sale of means of
transport 6
sale 16
transport 3
business-related services
10
rubber and plastic products
12
others 7
well-developed economic infrastructure and above average transport availability – both to the western border and to the Tricity sea ports. While concerning investments in service activities and high-tech activities, the Łódzkie Voivodship is characterized by average attractiveness in Poland.
INVESTMENT ATTRACTIVENESS OF VOIVODSHIPS AND SUBREGIONS IN POLAND 2016 35
In 2015 in the Łódzkie Voivodship 115 foreign investors in-vested at least 1 million USD. Based on the industry struc-ture of foreign investors, dispersion between 13 industries can be indicated of which the largest concentration was observed in the following industries: trade (16 investors), construction (12), production of rubber and plastic pro-ducts (12) and business-related services (10). These indu-stries concentrate nearly 50% of all enterprises in which foreign capital was invested. Other industries represent a small share in the industry structure of investors which ma-kes it difficult to indicate dominating industries. Referring to the identified intelligent specializations of the Łódzkie Voivodship, it is worth indicating that food industry, con-struction industry, textile industry and ICT industry can have great importance for their further development.
Subregional approachDefinitely the highest investment attractiveness concerning industrial activities is typical for the Łódź subregion in the voivodship. It takes very high third position among all subregions. It is thanks to very high density of people working in sector II, relatively high investment expenditures in Łódź SEZ and good communication availability – mainly thanks to relatively short time needed to get to the western border and to the Tricity sea ports in comparison to other subregions. Also, the Sieradz subregion is quite an attractive location to locate investments within industrial activities (21st position among subregions). The position of this subregion results mainly from rather good transport availability as well as relatively low costs of labor. Average investment attractiveness concerning industrial activities is typical for other two subregions of the Łódzkie Voivodship – Skierniewice (25th position) and Piotrków (26th position). They are both characterized by above average transport availability and the first one – also by a relatively low level of remuneration. Costs of labor in the Piotrków subregion – mainly thanks to the presence of a brown coal mine and a power plant in Belchatow – are among highest in Poland, however they are partially compensated for by above average labor resources and well-developed economic infrastructure, mainly thanks to good effects of operations of Łódź SEZ.
Significantly higher disproportion is observed between subregions of the Łódzkie Voivodship concerning investment attractiveness for service activities. The unquestionable leader is the Łódź subregion which has very high second position among all subregions. It results mostly from large labor resources – both existing (very high density of people working in services) and potential (thanks to high density of unemployed people), as well as very high institutional market capacity. It is also supported by very high communication availability thanks to the proximity of the international airport (Łódź Lublinek) and the proximity of Warsaw as well as high productivity of work in services. Other subregions of the Łódzkie Voivodship are characterized by average (Skierniewice) or low (Piotrków and Sieradz) investment attractiveness to locate service activities. Attributes of the Sieradz subregion and Skierniewice subregion are relatively good transport availability and relatively low costs of labor, while in the case of the Piotrków subregion, where remuneration is high in comparison to all the country, only the first attribute applies. Disadvantages of all three subregions are mostly a small size and quality of labor resources which from the perspective of an industrial investor usually have essential significance.
The interregional disproportion is also very noticeable in the context of investment attractiveness for high-tech activities. Similarly to industry and services, in the Łódzkie Voivodship, the Łódź subregion is the leader, which has 4th position among all Polish subregions. Such a high position results mostly from: very high quality of labor resources, presence of renown universities, high institutional market capacity, high communication availability as well as the relatively well-developed sector of business-related institutions. The areas of average attractiveness for high-tech activities in the Łódzkie Voivodship are: the Skierniewice and Piotrków subregions, while the area of low attractiveness is the Sieradz subregion. Their main attributes are most of all high transport availability to Warsaw and the international airport as well as above average transport availability to the western border. For most investors from the high-tech industry it may be an insufficient argument to locate investments in these areas.

36 INVESTMENT ATTRACTIVENESS OF VOIVODSHIPS AND SUBREGIONS IN POLAND 2016
Population 365 755 *Surface area 4082 **Average gross remuneration 3373 **Registered unemployment rate 8,8 **Number of students in higher education institutions per 1,000 inhabitants
7 **
Investment attractivenessIndustry Average
Services Average
High-tech Average
subregionsPopulation 1 086 993 ***Surface area 2 499 *Average gross remuneration 3856 ***Registered unemployment rate 9 **Number of students in higher education institutions per 1,000 inhabitants
70 ***
Investment attractivenessIndustry Highest
Services Highest
High-tech Highest
Skierniewice subregion
Łódź subregion
Sieradz subregion
Piotrków subregion
Population 590 635 **Surface area 5972 **Average gross remuneration 4081 ***Registered unemployment rate 8,4 **Number of students in higher education institutions per 1,000 inhabitants
5 *
Investment attractivenessIndustry Average
Services Low
High-tech Average
Population 450 220 **Surface area 5666 **Average gross remuneration 3244 *Registered unemployment rate 8,7 **Number of students in higher education institutions per 1,000 inhabitants
1 *
Investment attractivenessIndustry High
Services Low
High-tech Low

INVESTMENT ATTRACTIVENESS OF VOIVODSHIPS AND SUBREGIONS IN POLAND 2016 37
Małopolskie VoivodshipInvestment attractiveness:
Position in Poland - 4Investment attractiveness
Industry High
Services Highest
High-tech Highest
Regional approach
Region in figures InnovationValue Position Value Position
Population 3 372 618 5R&D expenditures [million PLN]
2 118,6 2
Surface area [km2] 15 183 12 Industrial enterprises innovatively active 16,3 11
Average gross remuneration 3 907 5 Service enterprises innovatively active 11,9 6
Registered unemployment rate 6,7 3Expenditures on innovative activity in industrial enterprises [million PLN]
1688 7
Disposable income per person per household 1 305 8
Expenditures on innovative activity in service enterprises [million PLN]
435,5 7
Quality of life [max. 10] 4,50 5Number of students in higher education institutions per 1,000 inhabitants
52 1
The Małopolskie Voivodship in the study on investment attractiveness of regions has had fourth position for several years. It is also the case this year. A typical attribute of this region is high supply of labor resources with affordable costs of labor. The largest attributes of Małopolskie are one of the most capable local markets and well-developed economic infrastructure thanks to the presence of the advanced R&D sector. The Małopolskie Voivodship is also – thanks to high tourist attractiveness and the dynamically operating sector of culture – a region with the second highest – after the Śląskie Voivodship – level of development of social infrastructure. A disadvantage of the region is activity towards investors which in
Poland is less than average. In comparison to 2014 the position of the Małopolskie Voivodship referring to most factors of investment attractiveness remained unchanged in comparison other regions. Only two changes concerned public safety and transport availability. The first one, mainly thanks to a noticeable growth of crime detection, increased by two positions. On the other hand, there was a negative change observed in the case of transport availability – thanks to A1 motorway, the Małopolskie region was taken over by Kujawsko-pomorskie.
From the industry perspective, the Małopolskie Voivodship is particularly attractive to locate service and high-tech activities

38 INVESTMENT ATTRACTIVENESS OF VOIVODSHIPS AND SUBREGIONS IN POLAND 2016
Foreign investments and regional specializations
Number of foreigninvestors in 2015: 123
Chart: Industry structure of foreign investments
Intelligent specializations:
ife sciencesSustainable energy Information and communication technologiesChemistryProduction of metals and metal products as well as products made of mineral nonmetallic raw materials Electrical engineering and machine industry Creative industry and free time industry
there – in this context it takes 3rd and 2nd position respectively. The greatest attributes of the region are undoubtedly the size and quality of labor resources and institutional market capacity. In this context, significant factors are also a good condition of natural environment, a high – as for a region of which the capital city is a metropolitan area – a level of public safety as well as – in particular concerning high-tech activities – well-
-2,00 -1,50 -1,00 -0,50 0,00 0,50 1,00 1,50 2,00
Labor resources and costs
Activity towards investors
Transport availability
Market
Economic infrastructure
Social infrastructure
Public safety
Chart: Change in the position of the Małopolskie Voivodship in comparison to other regions in 2014-2016
Source: IBNGR
-1
0
1
2
Laborresources and
costs
Activitytowardsinvestors
Transportavailability
Market Economicinfrastructure
Socialinfrastructure
Public safety
Chart: Factors of investment attractiveness of the Małopolskie Voivodship in 2016
Source: IBNGR
machinery and metal industry
14
food industry 12
construction 15
chemistry 5
ICT 15 medicine
5 production and sale
of means of transport
7
business-related services
18
rubber and plastic products
4
electronics and electrics
3
printing 3
power engineering 3
non-metal industry 3
others 16
developed social infrastructure. Regarding attractiveness for industrial activities, it is not as high as in the case of service and high-tech activities, but it still allows Małopolskie to be among the first five regions. The largest attribute of the voivodship in this context is the second highest number of people working in industry – after Śląskie.

INVESTMENT ATTRACTIVENESS OF VOIVODSHIPS AND SUBREGIONS IN POLAND 2016 39
In 2015 in the Małopolskie Voivodship 123 foreign in-vestors invested more than 1 million USD. Based on the industry structure of foreign investors, specializations in business-related services (18 investors), construction (15)< ICT sector (15), machinery and metal industry (14) and food industry (12) can be indicated. Other enterprises from the analyzed group are characterized by relatively significant dispersion and it is difficult to indicate concentration areas. It is worth paying attention to the fact that in the industry structure there are also enterprises which are consistent with intelligent specializations identified in the region. They concentrate around the following specializations: electrical engineering and machine industry, information and com-munication technologies, production of metals and metal products. However, their impact on development of intelli-gent specializations is limited.
Subregional approachThe most attractive areas to locate industrial activities in the Małopolskie Voivodship are two subregions with very rich industrial traditions – Oświęcim and Kraków. The first one has fifth position among all subregions, while the second one – ninth position. Their competitiveness results from different factors. Both have very large labor resources; however, the position of the Oświęcim subregion is also affected by rather low costs of labor and a small share of protected areas which predestines the area for industrial investments. Attributes of the Kraków subregion include higher transport availability as well as higher industrial productivity. Its competitiveness is negatively impacted by one of the highest levels of remuneration in the country. The Nowy Targ subregion, which may attract investors with lower than average costs of labor as well as broad resources of work, is characterized by average investment attractiveness for industrial activities. Other two subregions – Nowy Sącz and Tarnów – are among fifteen least attractive regions from the perspective of industry. Their only attributes are relatively low costs of labor and average labor resources, while the largest disadvantages – very low transport availability and poorly developed economic infrastructure.
Concerning investment attractiveness for service activities, the Kraków subregion is definitely the leader of the Małopolskie Voivodship; it also has third position in the country. It owes its high position mostly to broad labor resources and very high quality personnel. The
subregion is characterized by a high level of development of local economy, high institutional market capacity and high transport availability, mostly conditioned by the presence of a large international airport – Kraków-Balice. Areas with high attractiveness to locate investment in the service industry are also the Oświęcim (13th position among subregions) and Tarnów (19th position) subregions. Attributes of the first one include in particular: a relatively large size and quality of labor resources, high institutional market capacity and a high level of development of local economy. Attractiveness of the Tarnów subregion results from relatively low costs of labor. Peripherally located subregions of Nowy Sącz and Nowy Targ belong to the group of regions with low investment attractiveness. Their largest attributes are low costs of labor and a set of “soft” location factors, such as high quality of natural environment. Usually, it is insufficient to efficiently attract investors.
In the context of high-tech activities, the Kraków subregion is the leader in the Małopolskie Voivodship. It is the second – after the Warsaw subregion – most attractive location in the country for investors in this sector. Such a high position results mostly from very high quality of labor resources generated at Kraków universities. In high-tech industries, a significant location factor is also high quality of life which is required by companies to attract talented employees. In this context, the Kraków subregion has a broad cultural offer. Its attributes also include high institutional market capacity and high transport availability resulting mainly from the presence of the airport. Relatively high attractiveness for investments in the high-tech sector can be also observed in the Oświęcim subregion (21st position in Poland). Its attributes are mostly high institutional market capacity, relatively high transport availability and a beneficial structure of economy. Two subregions located in the Małopolskie Voivodship – Tarnów and Nowy Targ – are characterized by average attractiveness from the perspective of high-tech investments. Attributes of the first one are: relatively high institutional market capacity and above average quality of labor resources, and the second – typically “soft” factors: very well-developed social infrastructure and very high quality of natural environment. The last subregion of the Małopolskie Voivodship – Nowy Sącz – is characterized by low investment attractiveness for high-tech activities.

40 INVESTMENT ATTRACTIVENESS OF VOIVODSHIPS AND SUBREGIONS IN POLAND 2016
Population 463 601 **Surface area 2605 *Average gross remuneration 3392 **Registered unemployment rate 9 **Number of students in higher education institutions per 1,000 inhabitants
12 **
Investment attractivenessIndustry Lowest
Services High
High-tech Average
subregions
Population 342 576 *Surface area 2632 *Average gross remuneration 3257 *Registered unemployment rate 8,7 **Number of students in higher education institutions per 1,000 inhabitants
8 **
Investment attractivenessIndustry Average
Services Low
High-tech Average
Tarnów subregion
Nowy Targ subregion
Oświęcim subregion
Nowy Sącz subregion
Population 535 636 **Surface area 3524 *Average gross remuneration 3188 *Registered unemployment rate 9,1 **Number of students in higher education institutions per 1,000 inhabitants
9 **
Investment attractivenessIndustry Low
Services Low
High-tech Low
Population 553 968 **Surface area 2040 *Average gross remuneration 3489 **Registered unemployment rate 8,2 **Number of students in higher education institutions per 1,000 inhabitants
3 *
Investment attractivenessIndustry Highest
Services High
High-tech High
Population 1 476 837 ***Surface area 4 382 **Average gross remuneration 4189 ***Registered unemployment rate 4,9 ***Number of students in higher education institutions per 1,000 inhabitants
110 ***
Investment attractivenessIndustry Highest
Services Highest
High-tech Highest
Kraków subregion

INVESTMENT ATTRACTIVENESS OF VOIVODSHIPS AND SUBREGIONS IN POLAND 2016 41
Mazowieckie VoivodshipInvestment attractiveness:
Position in Poland - 3Investment attractiveness
Industry Lowest
Services Highest
High-tech Highest
Regional approachRegion in figures Innovation
Value Position Value Position
Population 5 349 114 1R&D expenditures [million PLN]
6 946,1 1
Surface area [km2] 35 558 1 Industrial enterprises innovatively active 20,2 5
Average gross remuneration 5 094 1 Service enterprises innovatively active 15,8 3
Registered unemployment rate 7,4 6Expenditures on innovative activity in industrial enterprises [million PLN]
4177,9 1
Disposable income per person per household 1 756 1
Expenditures on innovative activity in service enterprises [million PLN]
8350,6 1
Quality of life [max. 10] 5,10 1Number of students in higher education institutions per 1,000 inhabitants
51 2
After several years of taking second position, this year the Mazowieckie Voivodship took third position concerning investment attractiveness of regions. It was taken over by the Dolnośląskie Voivodship mainly because of lower activity in comparison to other voivodships, especially concerning a relatively small number of investment offers as well as due to an increase in the local market capacity of Dolnośląskie, even though it is still a clearly smaller market than the market of Mazowieckie. The largest attributes of Mazowieckie are – traditionally – the largest market as well as the highest transport availability due to the presence of the capital city and the largest airport in Poland. Disadvantages include the second lowest level of public safety among regions as well as – particularly in the context of industrial activities – the highest
costs of labor in Poland. In the last three years in comparison to other voivodships, the situation of the Mazowieckie region significantly improved concerning resources and costs of labor – it went up from 13th to 10th position. It was mostly affected by an increasing level of entrepreneurship as well as relatively high density of people working in industry, construction and services. In the same period, mainly due to the previously mentioned low supply of investment offers, a decrease by three positions (from 2nd to 5th) occurred concerning activity of the region towards investors. Also, slightly – by one position in comparison to other voivodships – the position of Mazowieckie decreased concerning the level of safety.
From the industry perspective, the Mazowieckie Voivodship
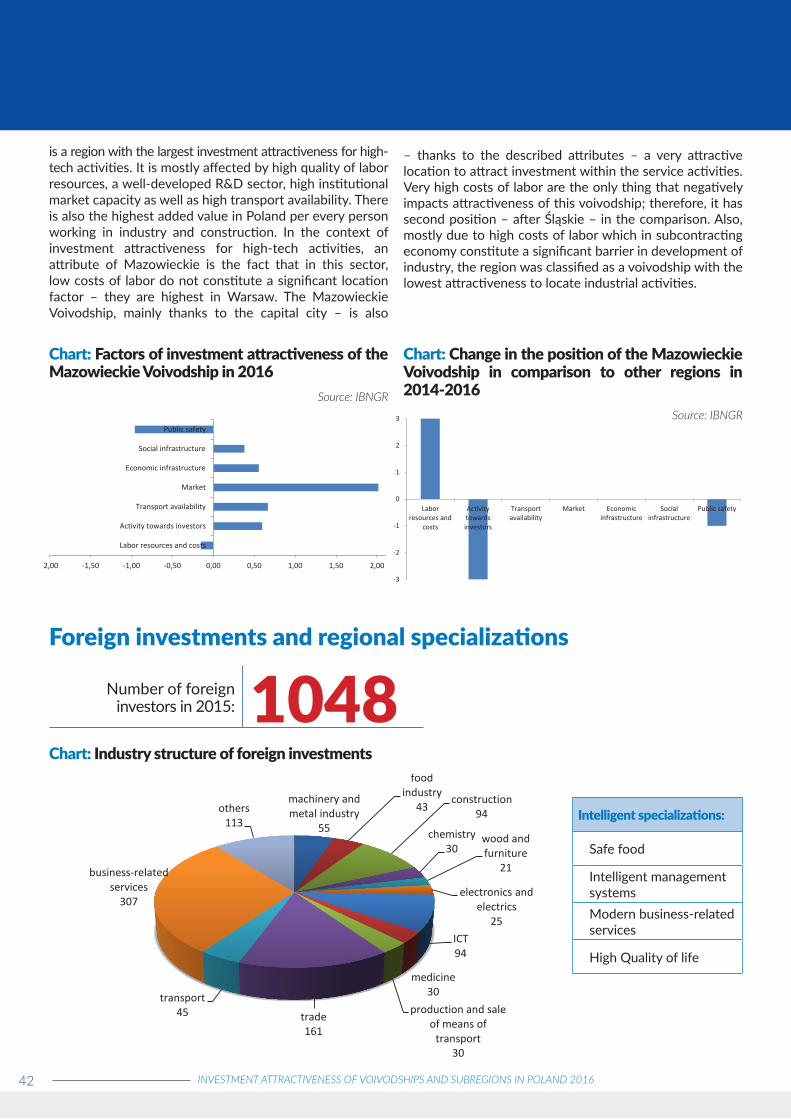
42 INVESTMENT ATTRACTIVENESS OF VOIVODSHIPS AND SUBREGIONS IN POLAND 2016
-3
-2
-1
0
1
2
3
Laborresources and
costs
Activitytowardsinvestors
Transportavailability
Market Economicinfrastructure
Socialinfrastructure
Public safety
is a region with the largest investment attractiveness for high-tech activities. It is mostly affected by high quality of labor resources, a well-developed R&D sector, high institutional market capacity as well as high transport availability. There is also the highest added value in Poland per every person working in industry and construction. In the context of investment attractiveness for high-tech activities, an attribute of Mazowieckie is the fact that in this sector, low costs of labor do not constitute a significant location factor – they are highest in Warsaw. The Mazowieckie Voivodship, mainly thanks to the capital city – is also
Chart: Factors of investment attractiveness of the Mazowieckie Voivodship in 2016
Source: IBNGR
-2,00 -1,50 -1,00 -0,50 0,00 0,50 1,00 1,50 2,00
Labor resources and costs
Activity towards investors
Transport availability
Market
Economic infrastructure
Social infrastructure
Public safety
Chart: Change in the position of the Mazowieckie Voivodship in comparison to other regions in 2014-2016
Source: IBNGR
Foreign investments and regional specializations
Number of foreigninvestors in 2015: 1048
Chart: Industry structure of foreign investments
Intelligent specializations:
Safe food
Intelligent management systemsModern business-related services
High Quality of life
machinery and metal industry
55
food industry
43 construction
94
chemistry 30
wood and furniture
21
electronics and electrics
25 ICT 94
medicine 30
production and sale of means of
transport 30
trade 161
transport 45
business-related services
307
others 113
– thanks to the described attributes – a very attractive location to attract investment within the service activities. Very high costs of labor are the only thing that negatively impacts attractiveness of this voivodship; therefore, it has second position – after Śląskie – in the comparison. Also, mostly due to high costs of labor which in subcontracting economy constitute a significant barrier in development of industry, the region was classified as a voivodship with the lowest attractiveness to locate industrial activities.

INVESTMENT ATTRACTIVENESS OF VOIVODSHIPS AND SUBREGIONS IN POLAND 2016 43
In 2015 in the Mazowieckie Voivodship 1,048 foreign inve-stors invested more than 1 million USD. Based on the in-dustry structure of foreign investors, specializations in the following areas can be indicated: business-related services (307 investors), trade (161 investors), ICT (94) and constru-ction (94). In total, they constitute nearly 2/3 of the discus-sed group. In particular, the area of business-related servi-ces is associated with two intelligent specializations of the Mazowieckie Voivodship – modern business-related servi-ces and intelligent management systems. Strong concen-tration is visible here. Other enterprises from the analyzed group are characterized by relatively significant dispersion. In the structure of enterprises with foreign capital there are also representatives of industries which are consistent with intelligent specializations identified in the region, such as high quality of life and healthy food, but due to a relatively small number of them, they do not significantly impact de-velopment of regional specializations.
Subregional approachThe most attractive location for industrial activities in the Mazowieckie Voivodship is the Warsaw subregion. Its attractiveness in the country must be determined as rather high, but not very high – it has 24th position. It results mostly from the highest costs of labor in Poland, which are not compensated for by large labor resources or the highest level of development of local economy. The Radom subregion is a region with average attractiveness from the perspective of industry. It has 29th position in comparison to all voivodships, and its strengths include rather competitive costs of labor as well as – in particular – deficiency of workplaces. Entities which would like to run industrial activities in the Radom subregion should not have problems finding people willing to work even at the simplest low-paid positions. Other subregions are characterized by low (Ostrołęka) or very low (Ciechanów, Płock, Siedlce) location attractiveness for industrial activities. The case of the Płock subregion is especially interesting, where due to the presence of the Płock refinery, productivity of industry is highest in the country according to the statistics, but despite that, the level of remuneration is also high which may discourage investors from sector II.
Concerning service activities, the Warsaw subregion remains – which cannot be surprising – unmatched. It is characterized by the highest supply of qualified workforce in Poland, the highest institutional market capacity, the highest – thanks to Warsaw and the Warsaw Chopin airport – communication availability as well as the highest added value generated by people working in the sector of services. The only disadvantage are the highest costs of labor in the country, resulting i.a. from the fact that in Warsaw, there is the largest number of investments in the field of advanced services. The Radom subregion has average investment attractiveness concerning location of services. Its attributes include relatively competitive costs of labor as well as average availability of highly qualified workforce and an average level of institutional market capacity. The remaining four subregions of the Mazowieckie Voivodship are among twelve least attractive subregions from the perspective of investments in the field of services. It results mainly from small recourses of labor and their low quality as well as low institutional market capacity.
The Warsaw subregion is also characterized by the highest investment attractiveness in Poland from the perspective of high-tech activities. Its attributes are related mostly to direct attractiveness factors – very high quality of labor resources, presence of renown universities and scientific and research centers, very high transport availability, the highest institutional market capacity as well as a very well-developed business-related institution sector. Among areas with high attractiveness in the country the Płock subregion (18th position) was included. Such a high position results from very high productivity of industry, good communication availability to Warsaw and therefore, the international airport as well as relatively high institutional market capacity. Other subregions were included in the group of low (Ciechanów, Siedlce) and very low (Ostrołęka, Radom) attractiveness from the perspective of high-tech investments. A slightly higher position of the Siedlce subregion results from relatively good quality of labor resources, while the Ciechanów subregion – from good communication availability conditioned by the proximity of Warsaw and the international airport in Modlin.

44 INVESTMENT ATTRACTIVENESS OF VOIVODSHIPS AND SUBREGIONS IN POLAND 2016
Population 617 144 **Surface area 5763 **Average gross remuneration 3667 **Registered unemployment rate 17,6 *Number of students in higher education institutions per 1,000 inhabitants
16 **
Investment attractivenessIndustry Average
Services Average
High-tech Lowest
subregions
Population 331 741 *Surface area 3351 *Average gross remuneration 4468 ***Registered unemployment rate 13,1 *Number of students in higher education institutions per 1,000 inhabitants
19 **
Investment attractivenessIndustry Lowest
Services Lowest
High-tech High
Radom subregion
Płock subregion
Ostrołęka subregion
Ciechanów subregion
Population 343 728 *Surface area 5256 **Average gross remuneration 3417 **Registered unemployment rate 14 *Number of students in higher education institutions per 1,000 inhabitants
10 **
Investment attractivenessIndustry Lowest
Services Lowest
High-tech Low
Population 388 078 **Surface area 6504 ***Average gross remuneration 3587 **Registered unemployment rate 12,6 *Number of students in higher education institutions per 1,000 inhabitants
2 *
Investment attractivenessIndustry Low
Services Lowest
High-tech Lowest
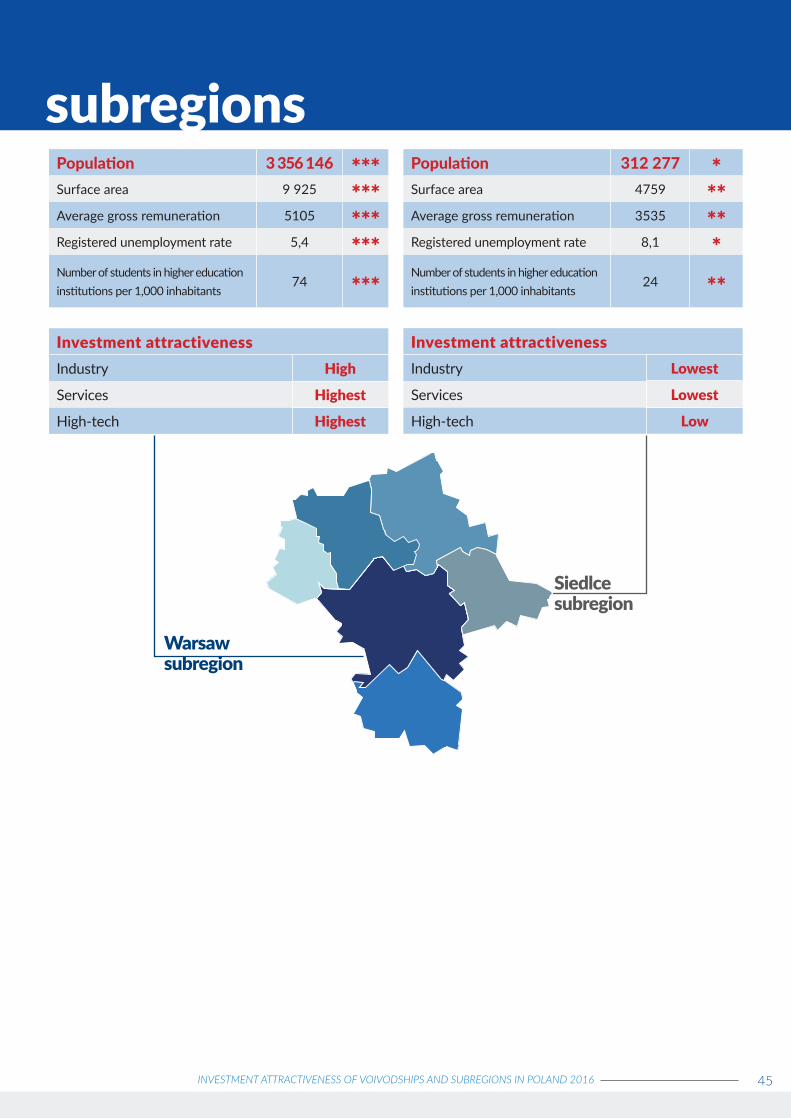
INVESTMENT ATTRACTIVENESS OF VOIVODSHIPS AND SUBREGIONS IN POLAND 2016 45
subregions
Warsaw subregion
Siedlce subregion
Population 312 277 *Surface area 4759 **Average gross remuneration 3535 **Registered unemployment rate 8,1 *Number of students in higher education institutions per 1,000 inhabitants
24 **
Investment attractivenessIndustry Lowest
Services Lowest
High-tech Low
Population 3 356 146 ***Surface area 9 925 ***Average gross remuneration 5105 ***Registered unemployment rate 5,4 ***Number of students in higher education institutions per 1,000 inhabitants
74 ***
Investment attractivenessIndustry High
Services Highest
High-tech Highest
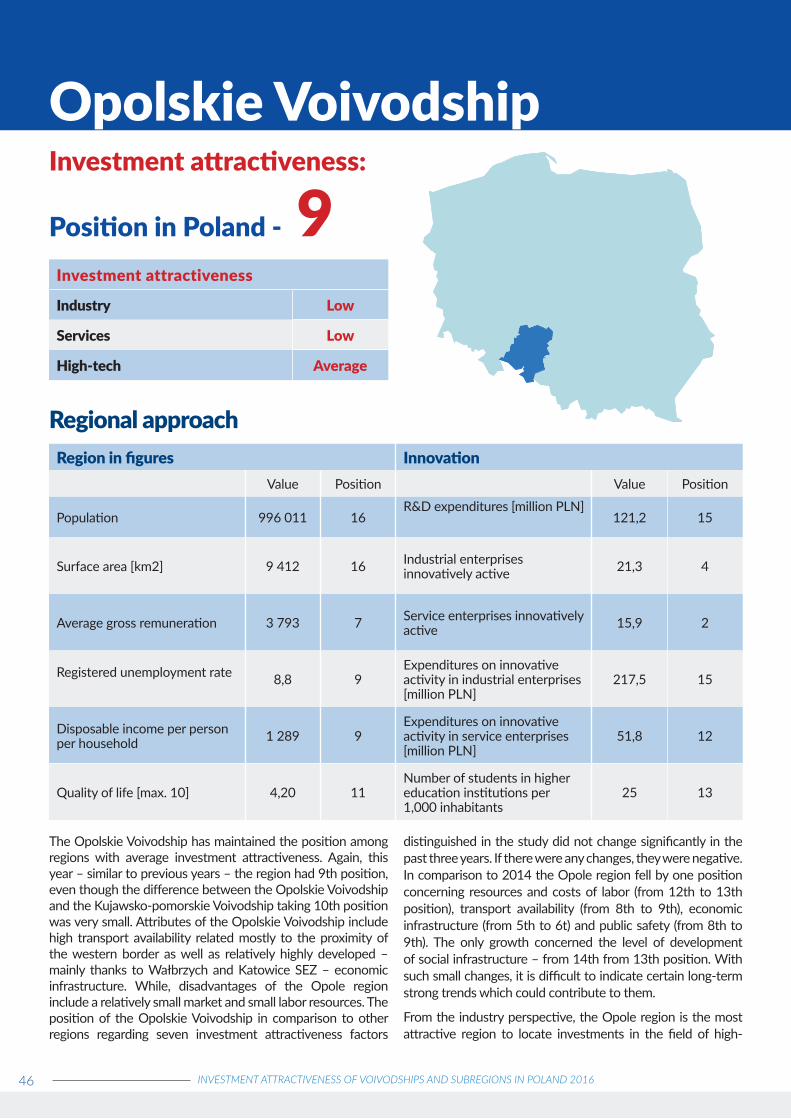
46 INVESTMENT ATTRACTIVENESS OF VOIVODSHIPS AND SUBREGIONS IN POLAND 2016
Opolskie VoivodshipInvestment attractiveness:
Position in Poland - 9Investment attractiveness
Industry Low
Services Low
High-tech Average
Regional approachRegion in figures Innovation
Value Position Value Position
Population 996 011 16R&D expenditures [million PLN]
121,2 15
Surface area [km2] 9 412 16 Industrial enterprises innovatively active 21,3 4
Average gross remuneration 3 793 7 Service enterprises innovatively active 15,9 2
Registered unemployment rate 8,8 9Expenditures on innovative activity in industrial enterprises [million PLN]
217,5 15
Disposable income per person per household 1 289 9
Expenditures on innovative activity in service enterprises [million PLN]
51,8 12
Quality of life [max. 10] 4,20 11Number of students in higher education institutions per 1,000 inhabitants
25 13
The Opolskie Voivodship has maintained the position among regions with average investment attractiveness. Again, this year – similar to previous years – the region had 9th position, even though the difference between the Opolskie Voivodship and the Kujawsko-pomorskie Voivodship taking 10th position was very small. Attributes of the Opolskie Voivodship include high transport availability related mostly to the proximity of the western border as well as relatively highly developed – mainly thanks to Wałbrzych and Katowice SEZ – economic infrastructure. While, disadvantages of the Opole region include a relatively small market and small labor resources. The position of the Opolskie Voivodship in comparison to other regions regarding seven investment attractiveness factors
distinguished in the study did not change significantly in the past three years. If there were any changes, they were negative. In comparison to 2014 the Opole region fell by one position concerning resources and costs of labor (from 12th to 13th position), transport availability (from 8th to 9th), economic infrastructure (from 5th to 6t) and public safety (from 8th to 9th). The only growth concerned the level of development of social infrastructure – from 14th from 13th position. With such small changes, it is difficult to indicate certain long-term strong trends which could contribute to them.
From the industry perspective, the Opole region is the most attractive region to locate investments in the field of high-

INVESTMENT ATTRACTIVENESS OF VOIVODSHIPS AND SUBREGIONS IN POLAND 2016 47
tech activities. Concerning this, it has 9th position among voivodships – it is conditioned mainly by high density of business-related institutions and good effects of activities of special economic zones. A little low, but still average investment attractiveness of the Opolskie Voivodship concerns industrial
Chart: Factors of investment attractiveness of the Opolskie Voivodship in 2016
Source: IBNGR
-2,00 -1,50 -1,00 -0,50 0,00 0,50 1,00 1,50 2,00
Labor resources and costs
Activity towards investors
Transport availability
Market
Economic infrastructure
Social infrastructure
Public safety
Chart: Change in the position of the Opolskie Voivodship in comparison to other regions in 2014-2016
Source: IBNGR
-1
0
1
Laborresources and
costs
Activitytowardsinvestors
Transportavailability
Market Economicinfrastructure
Socialinfrastructure
Public safety
Foreign investments and regional specializations
Number of foreigninvestors in 2015: 83
Chart: Industry structure of foreign investments
Intelligent specializations:
Chemical technologiesSustainable construction and wood technologiesMachinery and metal industry technologiesEnergy industry technologies (including RES, improving energy efficiency);Agri-food technologies
machinery and metal industry
28
food industry 9
construction 8
chemistry 4
wood and furniture 7
production and sale of means of
transport 5
sale 6
rubber and plastic products
7
others 9
and service activities. The largest attribute of the Opole region regarding both types of investments is functioning of special economic zones, including a relatively large supply of available investment areas in the zones, while concerning service – also high density of business-related institutions.

48 INVESTMENT ATTRACTIVENESS OF VOIVODSHIPS AND SUBREGIONS IN POLAND 2016
In 2015 in the Opolskie Voivodship 83 foreign inve-stors invested more than 1 million USD. Based on the industry structure of foreign investors, concentration in the machinery and metal industry (28 investors) can be indicated. Enterprises within this industry constitute 1/3 of the discussed group. Simultaneous-ly, this area of investors’ activities is directly related to the intelligent specialization of the region – tech-nologies of the machinery and metal industry. Other enterprises with foreign capital are characterized by equal dispersion and it is difficult to indicate the con-centration area. It is worth paying attention to the fact that among enterprises with foreign capital the-re are 15 enterprises which strengthen the intelligent specialization – sustainable construction and wood technologies. Other enterprises with foreign capital, which are consistent with intelligent specializations of the region, due to their small number, do not play an important role from the perspective of supporting development of these specializations.
Subregional approachConcerning investment attractiveness for industrial, service and high-tech activities, the Opole subregion is among subregions with high investment attractiveness, while the Nysa subregion – with average investment attractiveness. Strengths of the Opole subregion in the context of locating industrial investments include: dynamic operations of SEZ (Katowice and Wałbrzych), including large supply of available investment areas in SEZ as well as good communication availability conditioned mostly by the proximity of the western border. Competitiveness of
the Nysa subregion concerning location of industrial investments is affected mainly by relatively low costs of labor, high supply of unemployed people who can find work at newly-established plants as well as large supply of available investment areas in SEZ.
The main advantages of the Opole subregion in the context of investment attractiveness for service activities are related to significant institutional market capacity, large supply of available investment areas in SEZ, a well-developed business-related institution sector and above average productivity of the service sector. Advantages of the Nysa subregion results mostly from large supply of available investment areas in SEZ, a relatively well-developed business-related sector as well as – what is essential – relatively low costs of labor.
The largest disproportion between the two analyzed subregions concerns investment attractiveness for high-tech activities. The Opole subregion has 19th position among subregions, while the Nysa subregion – 34th. Strengths of the first one are: a high level of development of economic infrastructure (mainly thanks to the well-developed business-related institution sector), rather high institutional market capacity as well as average quality of labor resources and the level of development of local economy. An advantage of the Nysa subregion is only a high level of local economic infrastructure, including mostly the relatively well-developed business-related institution sector.

INVESTMENT ATTRACTIVENESS OF VOIVODSHIPS AND SUBREGIONS IN POLAND 2016 49
subregions
Opole subregionNysa subregion
Population 375 841 *Surface area 4093 **Average gross remuneration 3420 **Registered unemployment rate 12,3 *Number of students in higher education institutions per 1,000 inhabitants
7 **
Investment attractivenessIndustry Average
Services Average
High-tech Average
Population 620 170 **Surface area 5319 **Average gross remuneration 3942 ***Registered unemployment rate 7,1 ***Number of students in higher education institutions per 1,000 inhabitants
36 ***
Investment attractivenessIndustry High
Services High
High-tech High

50 INVESTMENT ATTRACTIVENESS OF VOIVODSHIPS AND SUBREGIONS IN POLAND 2016
Podkarpackie VoivodshipInvestment attractiveness:
Position in Poland - 12Investment attractiveness
Industry High
Services High
High-tech Low
Regional approachRegion in figures Innovation
Value Position Value Position
Population 2 127 657 9R&D expenditures [million PLN]
6 946,1 7
Surface area [km2] 17 846 11 Industrial enterprises innovatively active 20,2 6
Average gross remuneration 3 528 15 Service enterprises innovatively active 15,8 6
Registered unemployment rate 11,4 14Expenditures on innovative activity in industrial enterprises [million PLN]
4177,9 6
Disposable income per person per household 1 082 16
Expenditures on innovative activity in service enterprises [million PLN]
8350,6 8
Quality of life [max. 10] 4,50 5Number of students in higher education institutions per 1,000 inhabitants
51 12
The Podkarpackie Voivodship, even though its investment attractiveness in the country is not high or even average, is a region which is most distinguished positively among all voivodships of eastern Poland. Similar to 2014 and 2015, also this year it has 12th position among all Polish regions. Its largest attribute, which does not translate into investment attractiveness, is the highest level of public safety in Poland. All other factors of investment attractiveness taken into account in this study have values below average in the case of the Podkarpackie Voivodship. Among them we can distinguish only second lowest costs of labor in Poland which may constitute encouragement for technologically low- or medium-advanced industrial companies. In comparison to 2014 the position of the
Podkarpackie Voivodship - regarding the seven analyzed factors of investment attractiveness -did not change significantly in comparison to other regions. If there were any changes, they were positive and they concerned resources and costs of labor (from 7th to 6th), the size of the market (from 13th to 12th), the level of development of economic infrastructure (from 10th to 9th) and the level of development of social infrastructure (from 11th to 10th). The only decrease was observed in the field of activity of the voivodship towards investors (from 12th to 13th). Despite, as it seems, generally positive social and economic effects in the region, it is still quite far behind the Lubuskie Voivodship. The difference has increased this year.

INVESTMENT ATTRACTIVENESS OF VOIVODSHIPS AND SUBREGIONS IN POLAND 2016 51
From the industry perspective, the Podkarpackie Voivodship – despite a low position in the general comparison of investment attractiveness of regions – is a relatively attractive place to locate investments in the field of industrial and service activities. In both cases, it has high - sixth - position among other voivodships. The largest attribute of the region concerning location of industrial investments are low costs of labor which compensate for the lowest transport availability of the voivodship from the perspective of investors from sector II. The distance from the western border and – in particular – from sea
Chart: Factors of investment attractiveness of the Podkarpackie Voivodship in 2016
Source: IBNGR
-2,00 -1,50 -1,00 -0,50 0,00 0,50 1,00 1,50 2,00
Labor resources and costs
Activity towards investors
Transport availability
Market
Economic infrastructure
Social infrastructure
Public safety
Chart: Change in the position of the Podkarpackie Voivodship in comparison to other regions in 2014-2016
Source: IBNGR
-1
0
1
Laborresources and
costs
Activitytowardsinvestors
Transportavailability
Market Economicinfrastructure
Socialinfrastructure
Public safety
Foreign investments and regional specializations
Number of foreigninvestors in 2015: 49
Chart: Industry structure of foreign investments
Intelligent specializations:
Aviation and Space (leading)
Quality of life (leading)
Information and telecommunication (supporting)
machinery and metal industry
15
wood and furniture 7
aerospace industry 5
rubber and plastic products
5
food industry 3
production and sale of means of transport
3
sale 3
others 8
ports is significant. A low level of remuneration can also constitute encouragement for companies from the industry of relatively simple services. A barrier for more advanced services may be relatively small resources of well-qualified employees. The Podkarpackie Voivodship is definitely least attractive to locate high-tech activities. It has 11th position among regions and its attributes are mainly soft: high quality of natural environment as well as the highest level of safety in Poland. However, on their own they will not be able to attract investors from this industry to the region.

52 INVESTMENT ATTRACTIVENESS OF VOIVODSHIPS AND SUBREGIONS IN POLAND 2016
In 2015 in the Podkarpackie Voivodship 49 foreign in-vestors invested more than 1 million USD. The analysis of the industry structure of foreign investors indicated concentration in the machinery and metal industry (15 investors). In other industries, foreign capital was lo-cated in 3-7 entities which shows large dispersion. In the industry structure of enterprises with a share of foreign capital, it is worth paying attention to the fact that practically only the aviation industry (5 investors) strengthens the leading intelligent specialization of aviation and space. Other enterprises with foreign ca-pital do not impact the dynamics of development of in-telligent specializations in the Podkarpackie Voivodship significantly.
Subregional approachTwo among subregions in the Podkarpackie Voivodship can be included in the group of areas characterized by high investment attractiveness for industrial activities. It is the Rzeszów subregion (14th position among all subregions) and the Tarnobrzeg subregion (16th). Both subregions are characterized by high availability of labor resources, quite well-developed economic infrastructure (especially the Rzeszów subregion due to large supply of available investment areas in SEZ – mainly EURO-PARK Mielec) and a beneficial structure of local economy. An advantage of the Rzeszów subregion is average, but significantly higher than in the case of the Tarnobrzeg subregion, transport availability, while clearly lower costs of labor constitute an attribute of the second one. Two other subregions of the Podkarpackie Voivodship – Krosno and Przemyśl – are characterized by low investment attractiveness from the perspective of industrial investors. It results mainly from their peripheral location and relatively low labor resources. Disadvantages cannot be compensated for by one of the lowest level of remuneration in the country.
Significantly smaller interregional disproportions are observed regarding investment attractiveness for service activities. The Rzeszów subregion is the leader which took 10th position among all Polish subregions. Its strengths mostly include high supply and high quality of labor resources, rather high institutional market capacity, relatively good communication availability (conditioned mostly by the presence of the international airport – Rzeszów-Jasionka) and a rather high level of
development of economic infrastructure consisting of the relatively well-developed business-related institution sector and large supply of available investment areas in SEZ. Subregions of Krosno and Przemyśl have their positions in the low twenties of areas which are most attractive from the perspective of investments in the field of service activities. This relatively high position results mainly from low costs of labor as well as a set of indirect factors, including most of all high quality of natural environment as well as a very low level of crime. The last subregion – Tarnobrzeg – takes 25th position, i.e. just after the Przemyśl subregion. Its competitiveness results from costs of labor (average level), and mainly from relatively high institutional market capacity. The subregion is also characterized by incomparably worse condition of natural environment and a slightly lower level of public safety than in the Przemyśl and Krosno subregions.
The only subregion of the Podkarpackie Voivodship with high investment attractiveness for high-tech activities is the Rzeszów subregion. It takes 11th position in the country in this context. This position results mainly from high quality of labor resources and high institutional market capacity. It is also characterized by well-developed economic infrastructure, mainly due to the business-related institution sector and rather high supply of available investment areas in SEZ. Its attributes also include indirect factors, such as a high level of public safety, rather well-developed social infrastructure and relatively good condition of natural environment. They can play an important role in the location of investments in the sector of high-tech activities. Other subregions of the Podkarpackie Voivodship are characterized by average (Krosno) or low (Przemyśl, Tarnobrzeg) attractiveness towards investors from the high-tech industry. A slightly higher position of the Krosno subregion results mainly from slightly higher quality of labor resources which in the other two subregions must be assessed as low. The factor which has a negative impact on all these subregions is very low transport availability – mostly concerning the distance to the western border and Warsaw. These disadvantages cannot be compensated for by benefits related to the low level of crime and high quality of natural environment which are typical for the Krosno and Przemyśl subregions.

INVESTMENT ATTRACTIVENESS OF VOIVODSHIPS AND SUBREGIONS IN POLAND 2016 53
Population 631 560 **Surface area 3552 *Average gross remuneration 3809 **Registered unemployment rate 10,5 **Number of students in higher education institutions per 1,000 inhabitants
70 ***
Investment attractivenessIndustry High
Services Highest
High-tech Highest
subregionsPopulation 617 908 **Surface area 4464 **Average gross remuneration 3462 **Registered unemployment rate 10,4 **Number of students in higher education institutions per 1,000 inhabitants
5 *
Investment attractivenessIndustry High
Services Average
High-tech Low
Rzeszów subregion
Tarnobrzeg subregion
Przemyśl subregion
Krosno subregion
Population 484 241 **Surface area 5538 **Average gross remuneration 3238 *Registered unemployment rate 11,5 **Number of students in higher education institutions per 1,000 inhabitants
8 **
Investment attractivenessIndustry Low
Services High
High-tech Average
Population 393 948 **Surface area 4292 **Average gross remuneration 3384 **Registered unemployment rate 14,4 *Number of students in higher education institutions per 1,000 inhabitants
13 **
Investment attractivenessIndustry Low
Services High
High-tech Low

54 INVESTMENT ATTRACTIVENESS OF VOIVODSHIPS AND SUBREGIONS IN POLAND 2016
Podlaskie VoivodshipInvestment attractiveness:
Position in Poland - 16Investment attractiveness
Industry Lowest
Services Lowest
High-tech Lowest
Regional approachRegion in figures Innovation
Value Position Value Position
Population 1 188 800 14R&D expenditures [million PLN]
300,7 11
Surface area [km2] 20 187 6 Industrial enterprises innovatively active 19,4 7
Average gross remuneration 3 647 11 Service enterprises innovatively active 11,3 10
Registered unemployment rate 10,5 11Expenditures on innovative activity in industrial enterprises [million PLN]
248,7 14
Disposable income per person per household 1 258 12
Expenditures on innovative activity in service enterprises [million PLN]
21,3 14
Quality of life [max. 10] 4,60 3Number of students in higher education institutions per 1,000 inhabitants
30 9
The Podlaskie Voivodship is one of the least attractive Polish regions regarding investment attractiveness. Similar to previous years, also in this year’s study it is the last voivodship among all voivodships. There is nothing indicating that it may change soon. On the contrary – the difference which divides Podlaskie from the second last region in the classification seems to grow in each subsequent year. Actually, the only attribute of the region is a high level of public safety. Concerning other factors of investment attractiveness
– in particular direct factors, such as communication availability and resources and costs of labor – the Podlaskie region is usually the last one. In comparison to previous three years, mainly thanks to relatively good effects of functioning of the Suwałki SEZ concerning new workplaces, the Podlaskie Voivodship managed to take over the Świętokrzyskie Voivodship and it takes 15th position among regions concerning the level of development of economic infrastructure. Thanks to road investments and a significantly shorter time to

INVESTMENT ATTRACTIVENESS OF VOIVODSHIPS AND SUBREGIONS IN POLAND 2016 55
get from Olsztyn to Warsaw, the Warmińsko-mazurskie Voivodship took over Podlaskie so that it has the last position in the comparison of regions with the highest transport availability. In comparison to 2014 the region also fell from 4th to 3rd position among voivodships with the highest level of public safety.
Chart: Factors of investment attractiveness of the Podlaskie Voivodship in 2016
Source: IBNGR
-2,00 -1,50 -1,00 -0,50 0,00 0,50 1,00 1,50 2,00
Labor resources and costs
Activity towards investors
Transport availability
Market
Economic infrastructure
Social infrastructure
Public safety
Chart: Change in the position of the Podlaskie Voivodship in comparison to other regions in 2014-2016
Source: IBNGR
-1
0
1
Laborresources and
costs
Activitytowardsinvestors
Transportavailability
Market Economicinfrastructure
Socialinfrastructure
Public safety
Foreign investments and regional specializations
Number of foreigninvestors in 2015: 5
Chart: Industry structure of foreign investments
Intelligent specializations:
Agri-food industry
Metal and machinery, boatyard industry
Medical sector and life sciences
Eco-innovation and environmental sciences and sectors related to them
food industry 1
wood and furniture
1
ICT 1
medicine 1
sale 1
rubber and plastic products
2
From the industry perspective, Podlaskie is characterized by very low investment attractiveness concerning industrial, service and high-tech activities. Concerning the last two comparisons, it takes the last position among voivodships, while in the case of industry, mainly thanks to low costs of labor in Poland, it takes over the Warmińsko-mazurskie and Mazowieckie Voivodships.

56 INVESTMENT ATTRACTIVENESS OF VOIVODSHIPS AND SUBREGIONS IN POLAND 2016
In 2015 in the Podlaskie Voivodship only 5 foreign in-vestors invested more than 1 million USD. Based on the industry structure of foreign investors, it is not po-ssible to indicate specialization in any sector. Due to a small number of the studied group, we cannot speak of strengthening of any identified intelligent specializa-tions. In the industry structure, there are enterprises which are consistent with intelligent specializations identified in the region, such as the medical sector and agri-food industry.
Subregional approachAll subregions of the Podlaskie Voivodship are characterized by low (Białystok) or very low investment attractiveness (Łomża, Suwałki) for industrial activities. Their shortages concern all most important location factors – availability of labor resources, transport availability, the level of development of economic infrastructure. Even though the entire region is located peripherally, low costs of labor do not constitute its attribute – as they remain at the average level.
Concerning service activities, the Białystok subregion is characterized by average investment attractiveness. Among all Polish subregions it takes 27th position. Its attributes are high social activity of the residents, the above average level of entrepreneurship and above average quality of labor resources. The largest disadvantage is low transport availability related mostly to a large distance from Białystok to the closest international airports – Warsaw Chopin and Modlin. Other two subregions are among three least attractive subregions concerning investments in service activities. Such a low position results mostly from small labor resources and their low quality, low institutional market capacity as well as very low transport availability.
None of the subregions of the Podlaskie Voivodship is attractive to locate high-tech investments. The Białystok subregion which is highest on the list takes only 46th position. Investors are mostly discouraged by the lowest transport availability in Poland conditioned mainly by the lack of access to an international airport, low institutional market capacity and low – apart from the Białystok subregion – quality of labor resources.

INVESTMENT ATTRACTIVENESS OF VOIVODSHIPS AND SUBREGIONS IN POLAND 2016 57
Population 274 912 *Surface area 6237 ***Average gross remuneration 3584 **Registered unemployment rate 11,1 **Number of students in higher education institutions per 1,000 inhabitants
6 **
Investment attractivenessIndustry Lowest
Services Lowest
High-tech Lowest
subregions
Suwałki subregion
Łomża subregion
Białystok subregion
Population 510 873 **Surface area 5132 **Average gross remuneration 3724 **Registered unemployment rate 10,8 **Number of students in higher education institutions per 1,000 inhabitants
59 ***
Investment attractivenessIndustry Low
Services Average
High-tech Low
Population 403 015 **Surface area 8818 ***Average gross remuneration 3557 **Registered unemployment rate 9,7 **Number of students in higher education institutions per 1,000 inhabitants
9 **
Investment attractivenessIndustry Lowest
Services Lowest
High-tech Lowest

58 INVESTMENT ATTRACTIVENESS OF VOIVODSHIPS AND SUBREGIONS IN POLAND 2016
Pomorskie VoivodshipInvestment attractiveness:
Position in Poland - 8Investment attractiveness
Industry Low
Services Average
High-tech High
Regional approachRegion in figures Innovation
Value Position Value Position
Population 2 307 710 7R&D expenditures [million PLN]
1 156,1 6
Surface area [km2] 19 947 8 Industrial enterprises innovatively active 17 10
Average gross remuneration 4204,24 4 Service enterprises innovatively active 9 13
Registered unemployment rate 7,3 5Expenditures on innovative activity in industrial enterprises [million PLN]
1327,2 8
Disposable income per person per household 1 472 6
Expenditures on innovative activity in service enterprises [million PLN]
590,4 5
Quality of life [max. 10] 4,3 2Number of students in higher education institutions per 1,000 inhabitants
41 4
The Pomorskie Voivodship takes rather low position in this year’s comparison – as for its potential – it has eighth position concerning investment attractiveness of all the regions. It is the second subsequent year that it observes a fall – in 2015 it had seventh position and in 2014 – sixth position. It seems that the fall should be explained mostly by a decrease in local market capacity. Disposable income per person per household increased in comparison to the last year’s edition of the study by only 0.3%, which shows the third lowest dynamics in comparison to all voivodships. However, income itself was the sixth highest among regions, while last year it was third, and two years ago – second. Despite all that, the Pomeranian market is still on one of the highest positions in Poland and definitely it constitutes an attribute of the region. Also, fourth highest activity towards investors among voivodships should be appreciated as well
as well-developed social infrastructure, although it decides about investment attractiveness of the region to a small extent. Weaknesses of Pomorskie are low – in comparison to other regions – effects of operations of SEZ (both Słupsk and Pomarania) which additionally do not offer large supply of areas for new investments and – due to its geographic location – poor transport availability. Additionally, mainly due to a low level of crime detection, the Pomorskie Voivodship is characterized by one of the lowest levels of public safety. Reasons of the decrease in general investment attractiveness of the Pomorskie Voivodship are well reflected in the fall observed in 2014 in Pomorskie in comparison to other regions concerning the market size (from 3rd to 5th position), activity towards investors (from 3rd to 4th position) and the level of development of economic infrastructure (from 9th to 10th position). The only growth was

INVESTMENT ATTRACTIVENESS OF VOIVODSHIPS AND SUBREGIONS IN POLAND 2016 59
observed concerning resources and costs of labor (from 9th to 8th position).
From the industry perspective, the Pomorskie Voivodship is most attractive regarding location of investments in the field of high-tech activities. Considering this, it has 5th position among all voivodships. It results mainly from “hard” factors such as high quality of labor resources, a well-developed business-related institution sector and relatively high institutional market capacity, and from “soft” factors, i.e. very good condition of natural environment and very well-developed social infrastructure. Pomorskie has
Chart: Factors of investment attractiveness of the Pomorskie Voivodship in 2016
Source: IBNGR
-2,00 -1,50 -1,00 -0,50 0,00 0,50 1,00 1,50 2,00
Labor resources and costs
Activity towards investors
Transport availability
Market
Economic infrastructure
Social infrastructure
Public safety
Chart: Change in the position of the Pomorskie Voivodship in comparison to other regions in 2014-2016
Source: IBNGR
-2
-1
0
1
Laborresources and
costs
Activitytowardsinvestors
Transportavailability
Market Economicinfrastructure
Socialinfrastructure
Public safety
Foreign investments and regional specializations Number of foreign
investors in 2015: 93Chart: Industry structure of foreign investments
Intelligent specializations:
Offshore and port and logistic technologiesInteractive technologies in the information-saturated environmentTechnologies eco-effective in production, industry, distribution, energy and fuel consumption and in constructionMedical technologies in the field of lifestyle diseases and the aging period
machinery and metal industry
5 food industry 11
construction 11
electronics and electrics
10
ICT 13
sale 10
transport 6
business-related services
7
rubber and plastic products
4
others 16
above average – seventh – position concerning attractiveness to locate investments in the field of service activities. In this context, attributes of the region include mostly large and high quality of resource of labor as well as high investment expenditures of enterprises which confirm institutional market capacity. The Pomorskie Voivodship is least attractive from the perspective of industrial investors. Considering this, it has 11th position among all regions. This position could be higher, especially taking into account the proximity of sea ports, if it was not for low effects of the functioning of SEZ and low supply of available investment areas in the region.

60 INVESTMENT ATTRACTIVENESS OF VOIVODSHIPS AND SUBREGIONS IN POLAND 2016
In 2015 in the Pomorskie Voivodship 93 foreign inve-stors invested more than 1 million USD. Based on the industry structure of foreign investors specializations in the following fields can be indicated: ICT (13 investors), construction (11), food industry (11) and electronics and electrics (10). In total, they constitute nearly 1/2 of the discussed group. Simultaneously, ICT and construction sectors are related to two intelligent specializations of the Pomorskie Voivodship: interactive technologies in the information-saturated environment and offshore and port and logistic technologies. Other enterprises from the analyzed group are characterized by relatively large dispersion and it is difficult to indicate concerta-tion areas.
Subregional approachn Pomerania, the largest investment attractiveness for industrial activities is typical for the Tricity subregion which in the country should be assessed as average (31st position among all subregions). Its attributes include: high labor resources, good communication availability conditioned mainly by the presence of sea ports in Gdynia and Gdansk as well as A1 motorway, and high industry work efficiency. Factors blocking promotion of the Tricity and its surroundings to higher positions are very high costs of labor and very small supply of available investment areas in the Pomeranian SEZ. Other subregions of Pomorskie are characterized by low (Starogard) or very low (Słupsk, Chojnice) attractiveness. Strengths of the first of them include mostly high transport availability and above average industry work efficiency, while in the case of the other two, especially Chojnice, they are based on competitive costs of labor.
Significantly larger interregional disproportion concerns investment attractiveness for service activities. The Tricity subregion is characterized by very high attractiveness as it has seventh position among all subregions. Its attributes are high availability of qualified employees, very high institutional market capacity, high density of business-related institutions, high service sector work efficiency and high transport availability related mostly to the presence of the international airport Gdansk-Rębiechowo and A1 motorway significantly shortening the time to get to Warsaw. Attractiveness of the remaining subregions should be assessed as low (Starogard, Chojnice) and very low (Słupsk). An advantage of the first one is high transport availability, and of the second – very low level of remuneration; in the Słupsk subregions these attributes do not exist.
Concerning investment attractiveness for high-tech activities in the Pomorskie Voivodship, the highest position is taken by the Tricity subregion (6th position). Its attributes include mostly high quality of labor resource mostly conditioned by the presence of renown universities in Gdansk, very high institutional market capacity and high wok efficiency in sector II. Other advantages of the Tricity subregion are also “soft” location factors such as very well-developed social infrastructure and high quality of natural environment. They can encourage numerous high-tech employees to relocation. The subregion with average investment attractiveness for enterprises running high-tech activities is the Słupsk subregion which had 25th position. This rather good position results mainly from above average availability of highly qualified employees as well as indirect location factors such as well-developed social infrastructure and good condition of natural environment. The other two subregions are characterized by low (Starogard) or very low (Chojnice) attractiveness from the perspective of high-tech investments.

INVESTMENT ATTRACTIVENESS OF VOIVODSHIPS AND SUBREGIONS IN POLAND 2016 61
Population 225 138 *Surface area 4105 **Average gross remuneration 3190 *Registered unemployment rate 11,7 **Number of students in higher education institutions per 1,000 inhabitants
3 *
Investment attractivenessIndustry Lowest
Services Low
High-tech Lowest
subregions
Population 433 051 **Surface area 4102 **Average gross remuneration 3667 **Registered unemployment rate 9,6 **Number of students in higher education institutions per 1,000 inhabitants
3 *
Investment attractivenessIndustry Low
Services Low
High-tech Low
Chojnice subregion
Starogard subregion
Tricity subregion
Słupsk subregion
Population 335 603 *Surface area 5245 **Average gross remuneration 3488 **Registered unemployment rate 10,8 **Number of students in higher education institutions per 1,000 inhabitants
10 **
Investment attractivenessIndustry Lowest
Services Lowest
High-tech Average
Population 1 313 918 ***Surface area 4 858 **Average gross remuneration 4404 ***Registered unemployment rate 5,5 ***Number of students in higher education institutions per 1,000 inhabitants
69 ***
Investment attractivenessIndustry Average
Services Highest
High-tech Highest

62 INVESTMENT ATTRACTIVENESS OF VOIVODSHIPS AND SUBREGIONS IN POLAND 2016
Śląskie VoivodshipInvestment attractiveness:
Position in Poland - 1Investment attractiveness
Industry Highest
Services Highest
High-tech High
Regional approachRegion in figures Innovation
Value Position Value Position
Population 4 570 849 2R&D expenditures [million PLN]
1 352,2 3
Surface area [km2] 12 333 14 Industrial enterprises innovatively active 21,9 3
Average gross remuneration 4 221 2 Service enterprises innovatively active 12,9 5
Registered unemployment rate 6,7 2Expenditures on innovative activity in industrial enterprises [million PLN]
3467,6 2
Disposable income per person per household 1 421 4
Expenditures on innovative activity in service enterprises [million PLN]
732,9 2
Quality of life [max. 10] 4,2 11Number of students in higher education institutions per 1,000 inhabitants
28 10
The Śląskie Voivodship again managed to maintain the status of the region with the highest investment attractiveness. This results undoubtedly from the following factors: rich industrial traditions of the region, high degree of urbanization or dynamic operations of SEZ (mostly Katowice SEZ). Upper Śląskie is the leader concerning density of people working in industry, construction and services as well as the level of development of social infrastructure; it is characterized also by second large market among all voivodships; economic infrastructure and business-related institution sector are also very well-developed. The only significant disadvantage is the third lowest - in comparison to other regions – level of public safety. In the last three years, the Śląskie Voivodship in comparison
to other voivodships maintained or improved its position concerning particular factors of investment attractiveness. The most noticeable growth concerned activity of the region towards investors – in 2014 the Śląskie Voivodship had sixth position among voivodships, a year later – seventh position and currently it has second position. Such a significant growth may mainly result from the second highest among regions – after Dolnośląskie – number of location offers for new investments. Within the last three years in comparison to other regions, the position of the Śląskie Voivodship concerning the level of public safety slightly improved (from the second last to 14th position).

INVESTMENT ATTRACTIVENESS OF VOIVODSHIPS AND SUBREGIONS IN POLAND 2016 63
From the industry perspective, the Śląskie Voivodship is undoubtedly the best place in Poland to locate industrial investments. It leaves all other regions far behind mostly concerning labor resources. Its unquestionable position of the leader is not threatened by the second highest costs of labor among voivodships. Upper Śląskie has a smaller, but still clear advantage among other voivodships concerning the most attractive locations for service activities. It results mostly from
Chart: Factors of investment attractiveness of the Śląskie Voivodship in 2016
Source: IBNGR
-2,00 -1,50 -1,00 -0,50 0,00 0,50 1,00 1,50 2,00
Labor resources and costs
Activity towards investors
Transport availability
Market
Economic infrastructure
Social infrastructure
Public safety
Chart: Change in the position of the Śląskie Voivodship in comparison to other regions in 2014-2016
Source: IBNGR
0
1
2
3
4
Laborresources and
costs
Activitytowardsinvestors
Transportavailability
Market Economicinfrastructure
Socialinfrastructure
Public safety
Foreign investments and regional specializations
Number of foreigninvestors in 2015: 218
Chart: Industry structure of foreign investments
Intelligent specializations:
Power engineering
Medicine
Information and Communication Technologies
machinery and metal industry
50
food industry 6
construction 14
wood and furniture 7 electronics and
electrics 11
ICT 8 production and sale of
means of transport 33
non-metal products 4
environment 6
transport 9
business-related services
13
rubber and plastic products
14
textile industry 4
power engineering 4 sale
21
others 14
direct location factors, such as the size and quality of labor resources and institutional market capacity regarding which it has no equal. Concerning investments in the high-tech sector, the Śląskie region has fourth position. It is taken over by the following voivodships: Mazowieckie, Małopolskie and Dolnośląskie. This position of the Śląskie Voivodship results from worse quality of labor resources.

64 INVESTMENT ATTRACTIVENESS OF VOIVODSHIPS AND SUBREGIONS IN POLAND 2016
In 2015 in the Śląskie Voivodship 218 foreign investors invested more than 1 million USD. Based on the indu-stry structure of foreign investors, the following specia-lizations can be indicated: machinery and metal (50 in-vestors) and production and sale of means of transport (33). This concentration of areas of investors’ activities is not significant from the perspective of intelligent specializations. Other enterprises from the analyzed group are characterized by relatively large dispersion, but among them there are enterprises which are con-sistent with intelligent specializations identified in the region, such as ICT and electronics and electrics which strengthen the regional specialization - Information and Communication Technologies.
Subregional approachAll four subregions of the Śląskie Voivodship – which is unique in Poland – are characterized by very high investment attractiveness from the perspective of industrial activities. The voivodship and national leader is the Katowice subregion, while the vice leader – the Rybnik subregion. The Bielsko-Biała subregion takes fourth position in Poland, while the Częstochowa subregion – eighth position. Their attributes resulting from rich industrial traditions in the region are most of all very large labor resources, very well-developed economic infrastructure (in particular concerning the effects of functioning of Katowice SEZ). The largest disadvantage – being a derivative of a high degree of industrial development – are very high costs of labor, in particular in the subregions of Katowice, Rybnik and Bielsko-Biała. However, they should not constitute a significant problem from the perspective of investors who plan to run more advanced types of industrial activities as the benefits offered by the Śląskie Voivodship significantly exceed its negative features.
Concerning location of investments within service activities, three of four Silesian subregions are among subregions with the highest attractiveness – Katowice – fourth position, Rybnik – 11th position and Bielsko-Biała – 12th position. The Częstochowa subregion has
14th position. All these subregions are characterized by very large or large labor resources and very high or high quality of labor resources, very high or high institutional market capacity and a beneficial structure of economy. The highest position of the Katowice subregion – apart from the already listed features – results from the highest communication availability in the voivodship (to the capital city of the region and to the international airport Katowice-Pyrzowice), as well as the highest density of business-related institutions in the region. Similar to industry, the fundamental factor which may block simple service activities in Upper Śląskie is a very high or high level of remuneration in the Katowice, Rybnik and Bielsko-Biała subregion.
The largest, but still very small disproportions in investment attractiveness of the subregions of the Śląskie Voivodship concern attractiveness from the perspective of high-tech activities. The Katowice subregion takes the highest position in the region – eighth in the country. Its strengths are in particular high quality of labor resources, presence of renown universities and scientific and research centers, high density of business-related institutions, high communication availability and very high institutional market capacity. A factor discouraging high-tech companies from locating their businesses in the region – mainly from the perspective of employees’ relocation – can be the lowest quality of natural environment in Poland which may not be compensated for by the well-developed cultural sector. The remaining three subregions are among areas with high attractiveness – the Bielsko-Biała subregion has 13th position, Częstochowa subregion – 16th position and Rybnik subregion – 22nd position. Strengths of the first one are most of all high quality of labor resources, high institutional market capacity and beneficial effects of indirect location factors – well-developed social infrastructure and relatively high quality of natural environment – as for an area with industrial traditions. While the largest attribute of the Częstochowa subregion is high quality of labor resources and of the Rybnik subregion – very high institutional market capacity.

INVESTMENT ATTRACTIVENESS OF VOIVODSHIPS AND SUBREGIONS IN POLAND 2016 65
Population 636 246 **Surface area 1353 *Average gross remuneration 4491 ***Registered unemployment rate 6,9 ***Number of students in higher education institutions per 1,000 inhabitants
3 *
Investment attractivenessIndustry Highest
Services Highest
High-tech High
subregionsPopulation 2 748 423 ***Surface area 5 577 **Average gross remuneration 4302 ***Registered unemployment rate 7 ***Number of students in higher education institutions per 1,000 inhabitants
36 ***
Investment attractivenessIndustry Highest
Services Highest
High-tech Highest
Rybnik subregion
Katowice subregion
Częstochowa subregion
Bielsko-Biała subregion
Population 665 328 ***Surface area 2354 *Average gross remuneration 3858 ***Registered unemployment rate 5,6 ***Number of students in higher education institutions per 1,000 inhabitants
17 **
Investment attractivenessIndustry Highest
Services Highest
High-tech High
Population 520 852 **Surface area 3049 *Average gross remuneration 3450 **Registered unemployment rate 8,3 **Number of students in higher education institutions per 1,000 inhabitants
29 **
Investment attractivenessIndustry Highest
Services High
High-tech High

66 INVESTMENT ATTRACTIVENESS OF VOIVODSHIPS AND SUBREGIONS IN POLAND 2016
Świętokrzyskie VoivodshipInvestment attractiveness:
Position in Poland - 13Investment attractiveness
Industry Lowest
Services Low
High-tech Lowest
Regional approachRegion in figures Innovation
Value Position Value Position
Population 1 257 179 13R&D expenditures [million PLN]
261,0 12
Surface area [km2] 11 711 15 Industrial enterprises innovatively active 14,8 16
Average gross remuneration 3 581 12 Service enterprises innovatively active 9,3 12
Registered unemployment rate 10,8 13Expenditures on innovative activity in industrial enterprises [million PLN]
195,6 16
Disposable income per person per household 1 203 15
Expenditures on innovative activity in service enterprises [million PLN]
53,3 11
Quality of life [max. 10] 4,0 15Number of students in higher education institutions per 1,000 inhabitants
21 15
The Świętokrzyskie Voivodship is in the group of five least attractive Polish regions regarding investments. This year it has 13th position and therefore, one position higher than last year and the same as two years ago. The only attractiveness factor regarding the Świętokrzyskie region is the above average level of public safety in Poland. However, it is not a factor which would have significance when selecting investment locations by investors. In this situation, real attributes of the voivodship are: one of the lowest levels of remuneration among voivodships which may attract low- and medium-advanced industrial activities and simple services as well as relatively short time to get to Warsaw and Śląskie. Disadvantages – which are in an overwhelming number – include the smaller market in the country, the lowest activity of the region towards
investors and a very low degree of development of economic infrastructure. In the past three years, in comparison to other voivodships, a significant fall was observed concerning the market size. In 2014 the Świętokrzyskie region had 12th position and currently – the last. It results from very low dynamics of growth of disposable income of households – the second low in the country – as well as a very low value of investment expenditures within national economy in the region. In comparison to 2014, the position of the Świętokrzyskie Voivodship in comparison to other voivodships slightly decreased concerning resources and costs of labor (from 8th to 9th) and the level of public safety (from 2nd to 3rd). A slight improvement in comparison to other voivodships was observed concerning the level of

INVESTMENT ATTRACTIVENESS OF VOIVODSHIPS AND SUBREGIONS IN POLAND 2016 67
development of economic infrastructure (from 15th to 14th) and social infrastructure (from 9th to 8th).
From the industry perspective, the Świętokrzyskie Voivodship is not attractive to locate investments regarding industrial, service or high-tech activities. Mainly thanks to low costs of labor and a high level of public safety, the Świętokrzyskie region had the highest – 12th – position concerning attractiveness for service activities. Concerning industrial and high-tech activities it took a lower position by one. In the case
Chart: Factors of investment attractiveness of the Świętokrzyskie Voivodship in 2016
Source: IBNGR
-2,00 -1,50 -1,00 -0,50 0,00 0,50 1,00 1,50 2,00
Labor resources and costs
Activity towards investors
Transport availability
Market
Economic infrastructure
Social infrastructure
Public safety
Chart: Change in the position of the Świętokrzyskie Voivodship in comparison to other regions in 2014-2016
Source: IBNGR
-4
-3
-2
-1
0
1
Laborresources and
costs
Activitytowardsinvestors
Transportavailability
Market Economicinfrastructure
Socialinfrastructure
Public safety
Foreign investments and regional specializations
Number of foreigninvestors in 2015: 25
Chart: Industry structure of foreign investments
Intelligent specializations:
Resource-efficient constructionMetal and casting industryModern agriculture and food processingHealth tourism and pro-health tourismInformation and Communication TechnologiesTrade fair and congress sectorSustainable energy development
machinery and metal industry
8
construction 4 power
engineering 3
chemistry 1
wood and furniture
1
electronics and electrics
1
sale 2
transport 1
business-related services
1
rubber and plastic products
2 glassware
1
of industrial activities, low costs of labor do not compensate for deficiencies within availability of workforce or poorly developed economic infrastructure. While in the context of investments in high-tech activities, relatively good indirect factors, such as a high level of public safety and high quality of natural environment will not be able to compensate for deficiencies related to the quality of personnel, institutional market capacity or a low level of development of economic infrastructure.

68 INVESTMENT ATTRACTIVENESS OF VOIVODSHIPS AND SUBREGIONS IN POLAND 2016
In 2015 in the Świętokrzyskie Voivodship only 25 foreign investors invested more than 1 million USD. Based on the industry structure of foreign investors, specialization within the machinery and metal industry (8 investors) can be in-dicated. It is an area of investors’ activities directly relating to intelligent specialization of the voivodship – metal and casting industry. Due to a limited number of enterprises with foreign capital, it is difficult to talk about significance of foreign investors in strengthening of this specialization. Other enterprises with foreign capital are characterized by significant dispersion which limits the possibility to affect specializations of the region.
Subregional approachThe Kielce subregion is characterized by average investment attractiveness from the perspective of industrial activities, while the Sandomierz-Jędrzejów subregion investment attractiveness is very low. The first one takes 30th position among all subregions and its fundamental attributes include above average density of people working in industry, rather competitive costs of labor and above average communication availability. The largest disadvantage is poorly developed economic infrastructure manifested by rather weak effects of functioning of Starachowice SEZ and small supply of available investment areas in the region. Development of industry in the Kielce subregion is also blocked by a very large share of protected areas in the subregion. The Sandomierz-Jędrzejów subregion is characterized by the fourth lowest position in Poland concerning attractiveness of locating industrial activities there. Its weaknesses are especially low supply of labor resources, a low degree of development of economic infrastructure as well as poor transport availability. These disadvantages cannot be compensated for sufficiently by a lower than
average level of remuneration.
Concerning investment attractiveness for service activities, the Kielce subregion has high position in the group of subregions. It results mainly from relatively high resource of well-qualified employees with an affordable level of remuneration. Good condition of natural environment is also meaningful. The largest disadvantage of the Kielce subregion seems to be poor transport availability, in particular concerning the distance from the closest international airport and from the western border. The Sandomierz-Jędrzejów subregion – similarly to the case of attractiveness for industrial investors – is among the subregions with the lowest attractiveness. It results mainly from very small labor resources and their rather low quality as well as very poorly developed economic infrastructure and low institutional market capacity.
Similarly to the case of services, interregional disproportion can be observed in the Świętokrzyskie Voivodship also regarding investment attractiveness within high-tech activities. Also here, the Kielce subregion is characterized by quite high attractiveness, and the Sandomierz-Jędrzejów subregion – very low. The largest attributes of the first one – as in the case of services – are high quality of labor resources and very high quality of natural environment. In the context of high-tech activities, there is one more soft factor – relatively well-developed social infrastructure. The greatest weakness of the subregion is undoubtedly – in comparison to other areas – the time needed to get to the closest international airport. The only advantage of the Sandomierz-Jędrzejów subregion is a high level of public safety. Concerning the remaining location factors – it usually takes lowest positions among subregions.

INVESTMENT ATTRACTIVENESS OF VOIVODSHIPS AND SUBREGIONS IN POLAND 2016 69
subregions
Sandomierz-Jędrzejów subregion
Kielce subregion
Population 770 396 ***Surface area 5031 **Average gross remuneration 3583 **Registered unemployment rate 12 **Number of students in higher education institutions per 1,000 inhabitants
34 ***
Investment attractivenessIndustry Average
Services High
High-tech High
Population 486 783 **Surface area 6680 ***Average gross remuneration 3575 **Registered unemployment rate 9,1 **Number of students in higher education institutions per 1,000 inhabitants
1 *
Investment attractivenessIndustry Lowest
Services Lowest
High-tech Lowest

70 INVESTMENT ATTRACTIVENESS OF VOIVODSHIPS AND SUBREGIONS IN POLAND 2016
Warmińsko-mazurskie VoivodshipInvestment attractiveness:
Position in Poland - 15Investment attractiveness
Industry Lowest
Services Lowest
High-tech Lowest
Regional approachRegion in figures Innovation
Value Position Value Position
Population 1 439 675 12R&D expenditures [million PLN]
154,3 14
Surface area [km2] 24 173 4 Industrial enterprises innovatively active 19,3 8
Average gross remuneration 3 495 16 Service enterprises innovatively active 4,7 16
Registered unemployment rate 13,7 16Expenditures on innovative activity in industrial enterprises [million PLN]
304 12
Disposable income per person per household 1 281 11
Expenditures on innovative activity in service enterprises [million PLN]
7 16
Quality of life [max. 10] 4,20 11Number of students in higher education institutions per 1,000 inhabitants
23 14
The Warmińsko-mazurskie Voivodship is among five regions located in the eastern part of Poland which are characterized by the lowest investment attractiveness. Last year the region had rather high as for its abilities – 13th – position; this year, it fell to the second last position. It results more from an improvement of some indicators in the Lubelskie and Świętokrzyskie regions rather than worsening of the situation in the voivodship itself. All three regions remain at a rather similar level. Apart from the level of public safety, all other six factors of investment attractiveness in the Warmińsko-mazurskie Voivodship are at lower than average level in Poland. The greatest attribute of the region – at least according to technologically low- and medium-advanced industry and simple services – includes the lowest costs of labor among all voivodships. While the greatest
disadvantages are the second smallest market and very low transport availability. In the last three years, the position of the voivodship in comparison to other voivodships concerning the analyzed factors of investment attractiveness was rather stable. Slight progress was observed concerning activity of the voivodship towards investors (from 11th to 10th position), transport availability (from the last to the second last position thanks to modernization of S7 express road and shorter time to get from Olsztyn to Warsaw and Tricity sea ports) as well as the market size (from the last to the second last). The position of the region regarding the level of development of economic infrastructure (from 12th to 13th) as well as the level of public safety (from 6th to 7th) slightly decreased.

INVESTMENT ATTRACTIVENESS OF VOIVODSHIPS AND SUBREGIONS IN POLAND 2016 71
From the industry perspective, the Warmińsko-mazurskie Voivodship is characterized by very low investment attractiveness from the perspective of industrial, service and high-tech activities. Concerning the first two types of activities, the only significant attribute includes very low costs of labor which for some types of economic activities may seem
Chart: Factors of investment attractiveness of the Warmińsko-mazurskie Voivodship in 2016
Source: IBNGR
Chart: Change in the position of the Warmińsko-mazurskie Voivodship in comparison to other regions in 2014-2016
Source: IBNGR
-1
0
1
Laborresources and
costs
Activitytowardsinvestors
Transportavailability
Market Economicinfrastructure
Socialinfrastructure
Public safety
Foreign investments and regional specializations
Number of foreigninvestors in 2015: 32
Chart: Industry structure of foreign investments
Intelligent specializations:
Economics of water
Wood and furniture
High quality food
machinery and metal industry
8 food industry
1
shipbuilding 1
textile industry 1
construction 2
wood and furniture 5
electronics and electrics
3
sale 2
tourism 1
business-related services
2
glassware 1
rubber and plastic products
5
sufficiently attractive. Concerning high-tech activities, this factor is not among the most important ones, and therefore, it is hard to expect that the region will attract investments in this sector soon. Relatively good values of indirect factors, such as the public safety level, social infrastructure and quality of natural environment (highest in the country) are not enough.
-2,00 -1,50 -1,00 -0,50 0,00 0,50 1,00 1,50 2,00
Labor resources and costs
Activity towards investors
Transport availability
Market
Economic infrastructure
Social infrastructure
Public safety
72 INVESTMENT ATTRACTIVENESS OF VOIVODSHIPS AND SUBREGIONS IN POLAND 2016
In 2015 in the Warmińsko-mazurskie Voivodship 32 foreign investors invested more than 1 million USD. Based on the industry structure of foreign investors, distinguishing sec-tors can be mentioned: machinery and metal (8 investors), wood and furniture (5) and rubber and plastic products (5). In total, they constitute more than ½ of the analyzed group of enterprises. Simultaneously, the wood and furniture sec-tor relates directly to the intelligent specialization of the region – wood and furniture. Other enterprises from the analyzed group are characterized by relatively large disper-sion, but it is possible to relate them to specializations of the region, such as tourism, food industry or construction of ships and boats. Due to a small number of these enter-prises, their impact on intelligent specializations of the re-gion is limited.
Subregional approachNone of the subregions of the Warmińsko-mazurskie Voivodship is especially attractive for investors from the industrial sector. The Elbląg and Olsztyn subregions are characterized by low attractiveness and the Ełk subregion – very low attractiveness. It results from low or very low labor resources and rather poorly developed economic infrastructure. The Elbląg and Ełk subregions are characterized by very poor transport availability, in particular to the western border and to the capital city of the voivodship, while in the Olsztyn subregion – it is poor. Possibilities of developing industrial activities are not positively affected by a high level of protection of natural environment. The only significant attribute are very low costs of labor in the Elbląg and Ełk subregions. In the Olsztyn subregion they are at an average level.
Attractiveness of the subregions of Warmińsko-mazurskie concerning investments in service activities is much better. It is particularly noticeable in the case of the Olsztyn subregion classified to the group of areas with high attractiveness (22nd position among all subregions). Its greatest attributes are related to a rather large size and high quality of labor resources, high transport availability (thanks to the small international airport Olsztyn-Masuria as well as above average road availability to Warsaw) and a well-developed sector of business-related institutions. In comparison to other Polish subregions within the area of which there is a big city, the Olsztyn subregion has a relatively low level of remuneration and high quality of natural environment. An area with average attractiveness for service activities is the Elbląg subregion, the greatest strength of which are low costs of labor and high quality of natural environment – which is much less significant from the perspective of an investor. The same factors are also the greatest attributes of the Ełk subregion which due to a
small supply of labor resources and very poor transport availability was classified as an area with low investment attractiveness for service activities.
The greatest interregional disproportion concerning investment attractiveness of the subregion is observed within high-tech activities. The Olsztyn subregion has very high position – as for its potential – 12th. It results from high quality of labor resources, high density of business-related institutions, above average transport availability as well as thanks to indirect factors significant from the perspective of investors in the high-tech sector, such as: good condition of natural environment and well-developed social infrastructure. The other two subregions are among areas with the lowest attractiveness. Their greatest strengths are soft factors related mostly to the quality of natural environment. However, it is rather unlikely, that thanks to them – concerning deficiencies of highly qualified employees and low communication availability – the subregions would attract companies operating in the high-tech sector.

INVESTMENT ATTRACTIVENESS OF VOIVODSHIPS AND SUBREGIONS IN POLAND 2016 73
Population 617 941 **Surface area 10329 ***Average gross remuneration 3730 **Registered unemployment rate 12,4 *Number of students in higher education institutions per 1,000 inhabitants
46 ***
Investment attractivenessIndustry Low
Services High
High-tech Highest
subregions
Olsztyn subregion
Ełk subregionElbląg subregion
Population 531 322 **Surface area 7497 ***Average gross remuneration 3290 *Registered unemployment rate 13,8 *Number of students in higher education institutions per 1,000 inhabitants
7 **
Investment attractivenessIndustry Low
Services Average
High-tech Lowest
Population 290 412 *Surface area 6347 ***Average gross remuneration 3267 *Registered unemployment rate 16,7 *Number of students in higher education institutions per 1,000 inhabitants
2 *
Investment attractivenessIndustry Lowest
Services Low
High-tech Lowest

74 INVESTMENT ATTRACTIVENESS OF VOIVODSHIPS AND SUBREGIONS IN POLAND 2016
Wielkopolskie VoivodshipInvestment attractiveness:
Position in Poland - 5Investment attractiveness
Industry Average
Services High
High-tech Average
Regional approachRegion in figures Innovation
Value Position Value Position
Population 3 475 323 3R&D expenditures [million PLN]
1 315,1 4
Surface area [km2] 29 826 2 Industrial enterprises innovatively active 15,6 15
Average gross remuneration 3 729 9 Service enterprises innovatively active 8,2 14
Registered unemployment rate 5,1 1Expenditures on innovative activity in industrial enterprises [million PLN]
2669,6 5
Disposable income per person per household 1 288 10
Expenditures on innovative activity in service enterprises [million PLN]
482,6 6
Quality of life [max. 10] 4,60 3Number of students in higher education institutions per 1,000 inhabitants
38 5
The Wielkopolskie Voivodship – similarly to previous years – had fifth position concerning investment attractiveness among other voivodships. Its distance from fourth position of Małopolskie – as in previous editions – remains clear. However, the advantage above sixth position – Zachodniopomorskie Voivodship – is even more significant. The largest attributes of the Wielkopolskie Voivodship are high transport availability – especially to the western border, but also to its capital city and the sea port in Szczecin – and high activity towards investors. Additionally, its high position results from broad labor resources and an affordable level of remuneration as well as highly developed economic infrastructure – mainly thanks to expo-exhibition activities. Weaknesses of the
voivodship include a relatively small – in comparison to the voivodship size – market which significantly results from relatively low disposable income per person per household. Mainly due to low dynamics of its growth, during the last three years the position of the Wielkopolskie Voivodship – concerning the market – fell in comparison to other regions by three positions (from 6th to 9th). A minimum fall by one position also concerned activity towards investors (from 5th to 6th position) and the level of development of social infrastructure (from 10th to 11th). In comparison to 2014, the position of Wielkopolskie slightly improved concerning the level of development of economic infrastructure (from 6th to 5th position).

INVESTMENT ATTRACTIVENESS OF VOIVODSHIPS AND SUBREGIONS IN POLAND 2016 75
From the industry perspective, Wielkopolskie is most attractive for investors operating within the service sector. It mostly results from high communication availability, not the highest costs of labor in comparison to other regions as well as high quality of labor resources. Concerning high-tech activities, it has seventh position in comparison to
Chart: Factors of investment attractiveness of the Wielkopolskie Voivodship in 2016
Source: IBNGR
-2,00 -1,50 -1,00 -0,50 0,00 0,50 1,00 1,50 2,00
Labor resources and costs
Activity towards investors
Transport availability
Market
Economic infrastructure
Social infrastructure
Public safety
Chart: Change in the position of the Wielkopolskie Voivodship in comparison to other regions in 2014-2016
Source: IBNGR
-3
-2
-1
0
1
Laborresources and
costs
Activitytowardsinvestors
Transportavailability
Market Economicinfrastructure
Socialinfrastructure
Public safety
Foreign investments and regional specializations
Number of foreigninvestors in 2015: 163
Chart: Industry structure of foreign investments
Intelligent specializations:
Bio raw materials and food for conscious consumers
Interiors of the future
Industry of the future
Development based on ICT
Specialized logistic processes
Modern medical technologies
machinery and metal industry
20
food industry 28
construction 8
wood and furniture 16
electronics and electrics
10
ICT 5
production and sale of means of
transport 8
sale 18
transport 9
business-related services
17
rubber and plastic products
11
others 13
other voivodship and in the case of industrial activities – eighth position. Barriers making it difficult to take a higher position, include an average level of development of economic infrastructure and relatively small added value per person working in industry and construction.

76 INVESTMENT ATTRACTIVENESS OF VOIVODSHIPS AND SUBREGIONS IN POLAND 2016
In 2015 in the Wielkopolskie Voivodship 163 foreign in-vestors invested more than 1 million USD. Based on the industry structure of foreign investors, concentration of in-vestors in several areas can be indicated: food industry (28 investors), machinery and metal (20), sales (18), business-related services (17) and wood and furniture (16). In total, they constitute more than a half of the discussed group. Simultaneously, some of them – especially food industry, business-related services and ICT – may be intensely re-lated to two intelligent specializations of the Wielkopol-skie Voivodship – bio raw materials and food for conscious consumers and industry of the future. Other enterprises from the analyzed group relate to intelligent specializations identified in the region in a limited extent.
Subregional approachThe Wielkopolskie Voivodship is characterized by interregional disproportions concerning attractiveness to locate industrial investments. In this context, the Poznań subregion has definitely the best position – seventh in the country. Its basic attributes are related to large labor resources as well as very high transport availability – in particular road availability to the western border and to the capital city of the voivodship and to the sea port in Szczecin. Another attribute is also high supply of available investment areas in Wałbrzych and Kostrzyn-Slubice SEZ. The only disadvantage – however only from the perspective of relatively simple industrial activities – are one of the highest costs of labor in Poland. Also, the Konin subregion is characterized by high attractiveness concerning industry. It had 19th position among all subregions. Its competitiveness is based on above average availability of labor resources and high transport availability (in particular road availability to the western border). Another attribute of this subregions is also above average supply of available investment areas in SEZ. An area with average investment attractiveness for industrial activities is the Kalisz subregion. Its attributes are relatively high supply of labor resources and dynamic functioning of SEZ (Łódź, Wałbrzych and Kamienna Góra). The other two subregions are characterized by low (Leszno) and very low (Piła) investment attractiveness from the perspective of sector II.
Similar interregional disproportions can be observed concerning investment attractiveness of the subregions for service activities. In this context, also the Poznań subregion has the highest position – fifth in the country. Its attributes are mostly related to very large resources of qualified workforce, very high density of business-related institutions, significant institutional market capacity and very high transport availability – both to
the international airport, the western border, Warsaw and the capital city of the region. The only factor which may limit attractiveness of the Poznań subregion for some types of simple service activities is a very high level of remuneration. The Konin subregion is also characterized by high investment attractiveness; it has 20th position among all subregions. Its strengths are most of all high transport availability and a competitive level of remuneration. Relatively low costs of labor also constitute an important factor shaping investment attractiveness of the Kalisz subregion which was included among regions with average attractiveness. The Leszno subregion and Piła subregion can be included among subregions with low and very low investment attractiveness for service activities. Their largest attribute concerns an affordable level of remuneration.
Larger disproportions inside the Wielkopolskie Voivodship concern investment attractiveness of subregions for high-tech activities. Similar to the case of industry and services, the regional leader is the Poznań subregion which had third position in the country. Its advantages include: very high quality of labor resources, presence of renown universities and science and research centers, very high density of business-related institutions, high institutional market capacity and very high transport availability. They also include indirect factors in the form of very well-developed social infrastructure and above average quality of natural environment. Two among the subregions of the Wielkopolskie Voivodship – Konin and Leszno – were classified as areas with average attractiveness. In the case of the first one, it results mainly from high transport availability, while in the case of the second one – average transport availability and slightly lower than average quality of labor resources. Two other regions – Kalisz and Piła – are among areas with low attractiveness from the perspective of investors from the high-tech sector.

INVESTMENT ATTRACTIVENESS OF VOIVODSHIPS AND SUBREGIONS IN POLAND 2016 77
Population 555 125 **Surface area 5996 **Average gross remuneration 3349 *Registered unemployment rate 4,9 ***Number of students in higher education institutions per 1,000 inhabitants
5 *
Investment attractivenessIndustry Low
Services Low
High-tech Average
subregionsPopulation 412 675 **Surface area 6459 ***Average gross remuneration 3438 **Registered unemployment rate 8 **Number of students in higher education institutions per 1,000 inhabitants
6 **
Investment attractivenessIndustry Lowest
Services Lowest
High-tech Low
Leszno subregion
Piła subregion
Konin subregion
Kalisz subregion
Population 671 623 ***Surface area 5784 **Average gross remuneration 3150 *Registered unemployment rate 4,5 ***Number of students in higher education institutions per 1,000 inhabitants
9 **
Investment attractivenessIndustry Average
Services Average
High-tech Low
Population 659 545 ***Surface area 6397 ***Average gross remuneration 3419 **Registered unemployment rate 9,4 **Number of students in higher education institutions per 1,000 inhabitants
6 **
Investment attractivenessIndustry High
Services High
High-tech Average
Population 1 176 355 ***Surface area 5 190 **Average gross remuneration 4165 ***Registered unemployment rate 3 ***Number of students in higher education institutions per 1,000 inhabitants
100 ***
Investment attractivenessIndustry Highest
Services Highest
High-tech Highest
Poznań subregion
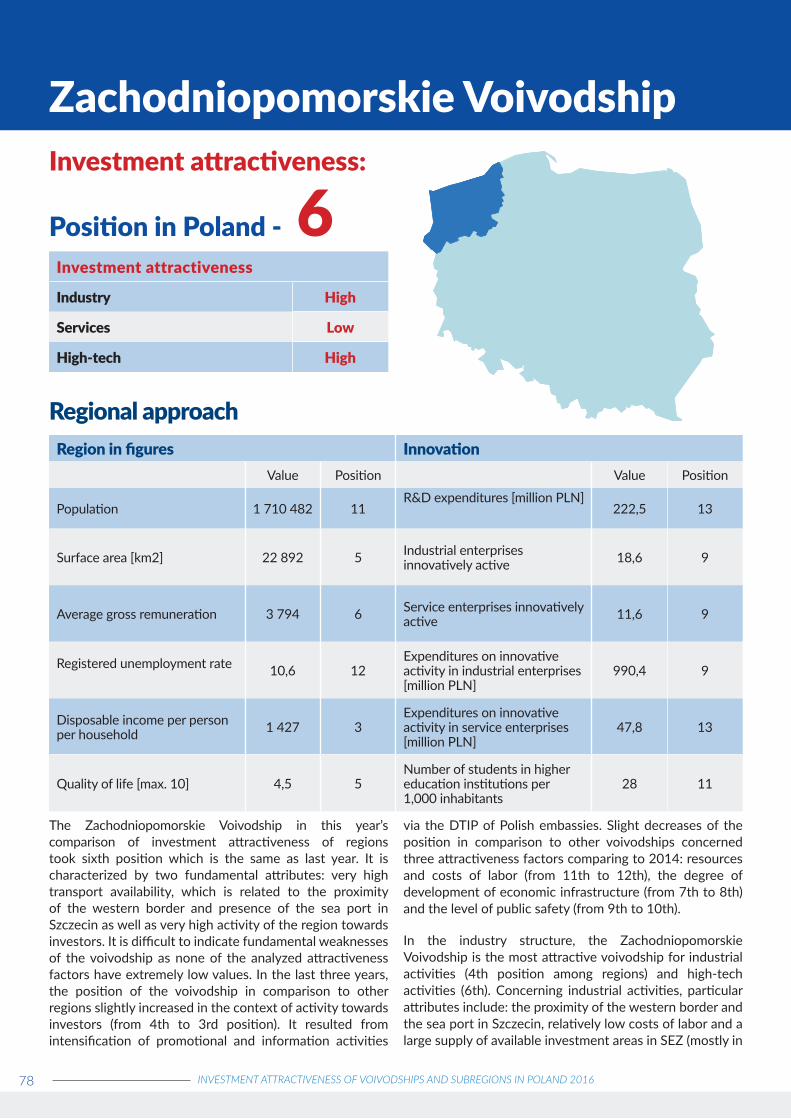
78 INVESTMENT ATTRACTIVENESS OF VOIVODSHIPS AND SUBREGIONS IN POLAND 2016
Zachodniopomorskie VoivodshipInvestment attractiveness:
Position in Poland - 6Investment attractiveness
Industry High
Services Low
High-tech High
Regional approachRegion in figures Innovation
Value Position Value Position
Population 1 710 482 11R&D expenditures [million PLN]
222,5 13
Surface area [km2] 22 892 5 Industrial enterprises innovatively active 18,6 9
Average gross remuneration 3 794 6 Service enterprises innovatively active 11,6 9
Registered unemployment rate 10,6 12Expenditures on innovative activity in industrial enterprises [million PLN]
990,4 9
Disposable income per person per household 1 427 3
Expenditures on innovative activity in service enterprises [million PLN]
47,8 13
Quality of life [max. 10] 4,5 5Number of students in higher education institutions per 1,000 inhabitants
28 11
The Zachodniopomorskie Voivodship in this year’s comparison of investment attractiveness of regions took sixth position which is the same as last year. It is characterized by two fundamental attributes: very high transport availability, which is related to the proximity of the western border and presence of the sea port in Szczecin as well as very high activity of the region towards investors. It is difficult to indicate fundamental weaknesses of the voivodship as none of the analyzed attractiveness factors have extremely low values. In the last three years, the position of the voivodship in comparison to other regions slightly increased in the context of activity towards investors (from 4th to 3rd position). It resulted from intensification of promotional and information activities
via the DTIP of Polish embassies. Slight decreases of the position in comparison to other voivodships concerned three attractiveness factors comparing to 2014: resources and costs of labor (from 11th to 12th), the degree of development of economic infrastructure (from 7th to 8th) and the level of public safety (from 9th to 10th).
In the industry structure, the Zachodniopomorskie Voivodship is the most attractive voivodship for industrial activities (4th position among regions) and high-tech activities (6th). Concerning industrial activities, particular attributes include: the proximity of the western border and the sea port in Szczecin, relatively low costs of labor and a large supply of available investment areas in SEZ (mostly in

INVESTMENT ATTRACTIVENESS OF VOIVODSHIPS AND SUBREGIONS IN POLAND 2016 79
Pomeranian and Słupsk SEZ). The last factor as well as soft location factors: very well-developed catering and hotel sector and very good condition of natural environment make Zachodniopomorskie an attractive region in the context of locating high-tech activities there. Concerning
Chart: Factors of investment attractiveness of the Zachodniopomorskie Voivodship in 2016
Source: IBNGR
-2,00 -1,50 -1,00 -0,50 0,00 0,50 1,00 1,50 2,00
Labor resources and costs
Activity towards investors
Transport availability
Market
Economic infrastructure
Social infrastructure
Public safety
Chart: Change in the position of the Zachodniopomorskie Voivodship in comparison to other regions in 2014-2016
Source: IBNGR
-1
0
1
Laborresources and
costs
Activitytowardsinvestors
Transportavailability
Market Economicinfrastructure
Socialinfrastructure
Public safety
Foreign investments and regional specializations
Number of foreigninvestors in 2015: 93
Chart: Industry structure of foreign investments
Intelligent specializations:
Large aquatic and terrestrial structuresAdvanced hardwareWood and furniture productsEnvironmentally friendly packagingChemical and material engineering productsModern agricultural and food processingMultimodal transport and logisticsProducts based on information technologies
machinery and metal industry
20
food industry 10
construction 6 chemistry
3
wood and furniture 4
electronics and electrics
7
ICT 6
production and sale of means of
transport 6
sale 6
transport 4
business-related services
10
rubber and plastic products
4
others 7
investments in service activities, the region has only 11th position among all voivodships. It results mostly from an insufficient size and quality of labor resources as well as rather low institutional market capacity.

80 INVESTMENT ATTRACTIVENESS OF VOIVODSHIPS AND SUBREGIONS IN POLAND 2016
In 2015 in the Zachodniopomorskie Voivodship 93 foreign investors invested more than 1 million USD. Based on the industry structure of foreign investors, specializations in the machinery and metal industry (20 investors), food indu-stry (10) and business-related sector (10) can be indicated. Enterprises with a share of foreign capital are characterized by relatively significant dispersion. Some areas of activities of foreign investors are related to intelligent specializations identified in the Zachodniopomorskie Voivodship – mo-dern agricultural and food processing, advanced hardware or large aquatic and terrestrial structures. A small number of these enterprises in the structure of entities in the re-gion should be taken into account as it limits their impact on strengthening specializations of the region.
Subregional approachThe Szczecin and Szczecinek-Pyrzyce subregions are included in the group of areas with high investment attractiveness for industrial activities. The first one had 15th position in Poland and the second - 22nd position. The fundamental attribute of the Szczecin subregion is very high transport availability – to the western border, to the sea port and to the capital city of the voivodship. Its strengths also include above average availability of investment areas in SEZ (mostly Kostrzyn-Slubice SEZ). A factor favoring development of industry in the subregion is also a very low share of protected areas. Competitiveness of the Szczecinek-Pyrzyce subregion from the perspective of industrial activities is based also on good transport availability and large surface area of available investment areas in SEZ, but in comparison to the Szczecin subregion, it also offers a low level of remuneration and high supply of unemployed people indicating insufficiency of workplaces in the subregion. An investor locating their activities here should not have problems finding people for the simplest and low-paid positions. The area with the lowest investment attractiveness for industrial activities in the Zachodniopomorskie Voivodship is the Koszalin subregion. In the country, it is among areas with average attractiveness. Its strengths include most of all: a large supply of available investment areas in SEZ and relatively low costs of labor. In comparison to the
other two subregion, it is characterized by clearly lower transport availability.
The most attractive area of the Zachodniopomorskie Voivodship from the perspective of service activities is the Szczecin subregion. Its attractiveness is high also in the country – it has 17th position among all subregions. This position results mainly from the size and quality of offered labor resources, very high communication availability (mainly thanks to the international airport Szczecin-Goleniow) and high density of business-related institutions. The two other subregions – Szczecinek-Pyrzyce and Koszalin – are among areas with average attractiveness from the perspective of services. An attribute of the first one are very low costs of labor, while of the second – above average size and quality of labor resources. Their weaknesses are mainly poor communication availability (in particular to Warsaw and the capital city of the region) as well as low institutional market capacity.
Greater interregional disproportions are visible regarding investment attractiveness of the Zachodniopomorskie Voivodship for high-tech activities. The Szczecin subregion is among the most attractive areas in this context – it takes 10th position in Poland. Its greatest attributes are very high transport availability (most of all for the western border) and high quality of labor resources and high density of business-related institutions. Also, first factors are important, such as very well-developed social infrastructure and above average quality of natural environment. The subregion with high attractiveness for high-tech activities is the Koszalin subregion which takes high 14th position in Poland. It results mostly from high quality of labor resources, well-developed economic infrastructure as well as a very high level of soft factors: the level of development of social infrastructure and quality of natural environment. A factor impeding development of high-tech activities in the subregion can be however low transport availability, in particular to the closest international airport and Warsaw. An area with low attractiveness from the perspective of high-tech investors is the Szczecinek-Pyrzyce subregion.

INVESTMENT ATTRACTIVENESS OF VOIVODSHIPS AND SUBREGIONS IN POLAND 2016 81
Population 918 159 ***Surface area 8 189 ***Average gross remuneration 4065 ***Registered unemployment rate 8,4 **Number of students in higher education institutions per 1,000 inhabitants
44 ***
Investment attractivenessIndustry High
Services High
High-tech Highest
subregions
Szczecin subregion
Szczecinek-Pyrzyce subregion
Koszalin subregion
Population 358 966 *Surface area 4364 **Average gross remuneration 3480 **Registered unemployment rate 11,3 **Number of students in higher education institutions per 1,000 inhabitants
21 **
Investment attractivenessIndustry Average
Services Average
High-tech High
Population 433 357 **Surface area 10339 ***Average gross remuneration 3339 *Registered unemployment rate 16,5 *Number of students in higher education institutions per 1,000 inhabitants
2 *
Investment attractivenessIndustry High
Services Average
High-tech Low

82 INVESTMENT ATTRACTIVENESS OF VOIVODSHIPS AND SUBREGIONS IN POLAND 2016
5. Scope and methods of researchare not identical.
Diversity and specificity of business activities shape various location preferences. Therefore, we cannot speak about absolute investment attractiveness of various areas. Thus, its assessment was conducted in three directions:
referring to subregions in the aspect of location factors for three most important types of business activities from the perspective of foreign investors: industrial, service and high-tech activities,
referring to voivodships in the aspect of location factors for three most important types of business activities from the perspective of foreign investors: industrial, service and high-tech activities,
referring to voivodships in the aspect of universal location factors.
The substantial scope of the elaboration is conditioned by:
the necessity to apply a wide spectrum of indicators describing particular location factors in as many details as possible,
the necessity to select various weights of particular location factors highlighting their significance for location of different investments.
Taking the listed conditions into account, several dozen variables constituting the basis to assess special diversity of particular location benefits (factors) were analyzed, such as: transport availability, costs of labor, size and quality of labor resources, market capacity, level of development of economic and social infrastructure, level of economic development, level
Table 1: Factors and their significance for investment attractiveness of subregions and voivodships
Source: prepared by IBNGR.
Subregions and voivodships according to categories Voivodships generally
Industry Services High-tech
Factors Weights (%)
Transport availability 20 10 20 20
Costs of labor 15 15 25
Size and quality of labor resources 40 25 30
Market capacity 20 10 15
Level of development of economic infrastructure 15 10 10 10
Level of development of social infrastructure 10 5
Level of economic development 2 5 5
Degree of protection and condition of natural environment 5 7 7
Level of public safety 3 8 8 5
Activity of regions towards investors 20
Total 100 100 100 100
5.1. Scope of research
The substantial scope of the report determines the term of investment attractiveness. It is understood as an ability to attract investment through offering a combination of location benefits possible to achieve during business activities. They result from specific features of the area in which business activity is being developed. These benefits are determined by location factors. Investment attractiveness is therefore affected by a set of location factors. Areas offering an optimal combination of location factors are attractive in the context of investments as they allow the risk of failure of a given investment to be reduced and a higher rate of capital return to be achieved by reduction of investment expenditures, ongoing costs of functioning of an enterprise as well as they facilitate increasing income.
In the report, investors’ optics were assumed which do not mean that conclusions from the report do not apply to actors of regional and local social and economic life. Knowledge of strengths and weaknesses of a given region as well as potential competition makes it easier to effectively create advantages in the field of investment attractiveness. Simultaneously, it should be highlighted that interests of a potential investor are not the only ones to be considered in development strategies. Therefore, conclusions from the report are important to shape the policy of regional and local development; however, they

INVESTMENT ATTRACTIVENESS OF VOIVODSHIPS AND SUBREGIONS IN POLAND 2016 83
Table 2: Źródła wskaźników - legendaSource: prepared by IBNGR.
Region in figures Innovation
Indicator name Value Date and source Indicator name Value Date and
source
Population - 2015 GUS Expenditures for research and development activities (R&D) mln zł 2015
GUS
Surface area km2 2015 GUS Industrial enterprises innovatively active %
2012-2014 GUS
Average gross remuneration zł 2015 GUS Service enterprises innovatively
active %2012-2014 GUS
Registered unemployment rate % IX 2016
GUSExpenditures on innovative activity in industrial enterprises mln zł 2014
GUS
Disposable income per person per household
zł 2015 GUS Expenditures on innovative activity in service enterprises mln zł 2014
GUS
Quality of life Scale 1-10 2015 OECD
Number of students in higher education institutions per 1,000 inhabitants
- 2015 GUS
of public safety, activity towards investors. Depending on the type of business activities, they were given various weights.
Spatial scope of the report covers Poland divided into:
16 voivodships,
60 subregions (formally there are 72, however for the needs of the report subregions – large cities, such as: Katowice, Kraków, Łódź, Poznań, Szczecin, Tricity, Warsaw, Wrocław, were combined with surrounding units, functionally related to the cities).
The time scope determines availability of possibly the latest data. Due to different publication inertia, depending on the type of data, in the report data from the following years was used:
2014 – referring to the size and structure of the added value, people working in industry, transport and other services as well as investment expenditures,
2015 – for most indicators from the public statistics system,
2016 – mainly in the case of transport availability, activity towards investors, unemployment, available areas in SEZ.
5.2. Source data and methods of research
In the report, quantitative data mainly from the public statistics system was used completed with data and information from other sources. Most of all data from the following sources was used:
Regional Data Bank of the Central Statistical Office,
data of the State Agency for Information and Foreign Investment (PAIiIZ),
data from SEZ managing entities,
information from the Departments of Trade and Investment Promotion (DTIP) of Polish embassies in countries with the largest share in foreign investments in Poland.
The method of assessing investment attractiveness remained unchanged. The procedure of pseudo-one-dimensional classification was used. Its application causes that assessment of attractiveness is relative. A reference point is an average value for a set of voivodships or subregions. Similarly to the previous edition of the report, in the assessment of activity of voivodships towards investors, the result of the certification of Regional Investor Service Centers (RISC) made by PAIiIZ in 2013 was used (it is conducted every three years, however at the moment of developing the report the results of certification from 2016 were not known yet).
A new element of this year’s edition of the study involves characteristics of each voivodship and its subregions. Preparing such characteristics, data presented in table 2 was used.
In the assessment of subregions, benchmarking was used – therefore, the markings in the form of “stars”. The more stars, the better the result obtained by a given subregion in comparison to other subregions. These markings were given as indicators to particular subregions for a result respectively in the group of:
25% best subregions in the country (***)
average (between the best and the worst subregions) (**)
25% worst subregions in the country (*)
Despite efforts of the authors, this elaboration does not exhaust all significant aspects of investment attractiveness. It results from unavailability of some quantitative data or difficulties in quantification and a fragmentary nature of qualitative data. Therefore, the obtained results can be interpreted, taking only the scope and specificity of the data used in the analysis into account.

84 INVESTMENT ATTRACTIVENESS OF VOIVODSHIPS AND SUBREGIONS IN POLAND 2016
6. Factors of investment attractiveness from the regional perspective
The analysis of the above listed aspects allowed both quantitative and qualitative assessment of labor resources. Depending on the type of economic activities, potential investors seek various feature of labor resources. In the case of production activities, employers mostly look for graduates of vocational schools, while service activities are more based on employees with high school or higher education.
6.3. Market capacityMarket capacity shapes investment attractiveness determining opportunities of the potential investor to sell goods and services on the regional market. The higher the market capacity, the more the potential benefits grow, and therefore the incurred investment expenditures will be returned sooner. High regional market capacity also allows the final costs of goods to be reduced by reduction of the costs of transport.
To assess investment attractiveness, the following elements of market capacity were determined: market size, wealth of households, investment expenditures of enterprises.
Depending on the type of economic activates, regional market capacity has various significance. The role of this factors is normally smaller in the case of industrial activates, products of which are distributed on numerous markets. While in the case of services sale of which takes place mainly on local markets and requires direct contact with customers, regional market capacity is significant.
6.4. Economic infrastructureThe impact of economic infrastructure on the level of investment attractiveness is related to improvement of the process of investment implementation and its further functioning. In the analysis of investment attractiveness, the following elements of infrastructure were considered:
density of business-related institutions, presence of scientific and research centers, number of expo and exhibition events, functioning of SEZ.
Particular elements play various roles in location of the analyzed types of business activities. In the case of production activities, presence of available investment areas within SEZ is important. While, high-tech activities are usually located in regions where scientific and research centers function.
6.5. Social infrastructureSocial infrastructure indirectly impacts the level of investment attractiveness by:
shaping beneficial living conditions, attracting immigrants, which strengthens the size and quality of labor resources, creating atmosphere of openness in exchanging opinions,
favoring creativity and innovation, facilitating organization of trainings, conferences,
meetings with customers.
6.1. Transport availabilityThe role of transport availability in shaping attractiveness is related to:
allowing and reduction of the costs of supplies of raw materials and components necessary in production, allowing and reduction of the costs of delivering the
final products to the recipients,, ensuring passenger transport conditions which allow
direct meetings with suppliers, associates, customers and advisors.
Assessment of transport attractiveness requires a reference point to be assumed in relation to which it is determined. For the needs of investment attractiveness, the following reference points were assumed:
location in relation to the western border, location of voivodships and subregions in relation to
Warsaw, location of subregions in relation to regional centers, location in relation to international airports (subregions)
taking their rank into account (voivodships), location in relation to large sea ports (Szczecin, Tricity).
Assuming the listed criteria, the directional structure of Polish international trade, the role of the capital city and voivodship cities as economic centers, markets and communication hubs were considered. Depending on the type of economic activities, particular elements of communication availability have different significance. For instance, for industrial activities road transport availability has fundamental significance as well as the level of development of the transport and logistics sector, while in the case of high-tech activities – presence of an airport is very important.
6.2. Labor resourcesLabor resources shape investment attractiveness allowing:
employment of sufficient staff employment of employees with required professional
skills and experience, employment of employees fulfilling expectations of
employers concerning personal traits (conscientiousness, responsibility, honesty, initiative), incurring costs of labor ensuring profitability of a given
investment. Assessing labor resources of voivodships and subregions, the following factors were considered:
number of the employed, number of the unemployed, number of vacancies, inflow of graduates of secondary schools and
universities, remuneration amounts.

INVESTMENT ATTRACTIVENESS OF VOIVODSHIPS AND SUBREGIONS IN POLAND 2016 85
Analyzing investment attractiveness, the following elements of social infrastructure were considered:
number and activity of cultural institutions, such as: theatres, cinemas, houses of culture, density of hotel and catering infrastructure.
Social infrastructure has significance for location of service activities in particular high-tech activities, as high-tech activities mostly depend on availability of high quality of human capital and social climate favoring innovation.
6.6. Level of economic developmentThe impact of the level of economic development and structure on investment attractiveness is related mostly to the occurrence of economic environment at the level of technical development suitable for investors, which allows cooperation regarding necessary services and supplies, ensuring optimal functioning of the investment. Analyzing the level of economic development concerning investment attractiveness, the following elements were considered:
work efficiency, share of non-agricultural activities in the economic
structure, presence of companies with foreign capital.
6.7. Condition of natural environmentThe condition of natural environment has three types of influences on shaping investment attractiveness:
existence of areas with significant attributes of natural environment, covered by legal protection, reduces possibilities to locate investments, a significant level of pollution creates financially
measurable losses in business activities of enterprises related to: costs of introducing pollution treatment systems, increased sick-leave absence, and in extreme cases – accelerates use of fixed assets (corrosion), a high level of pollution also limits quality of life
which negatively impacts the size and quality of labor resources.
For the needs of assessment of investment attractiveness, the following aspects of the condition of natural environment were considered:
surface area of areas which are legally protected, emission of pollutants into the atmosphere, emission of pollutants into surface water and
groundwater.The condition of natural environment differently impacts location of particular types of business activities. In the case of industry, occurrence of protected areas significantly narrows possibilities to locate investments. While, good condition of natural environment usually favors location of service or high-tech investments.
6.8. Level of public safetyThe impact of the level of public safety on investment attractiveness translates into financial results of the planned investment only to a small extent. A low level of public safety is related to increased expenses on security of property and
employees. The role of this factor in creating investment attractiveness is related to the sense of personal safety and responsibility for the closest associates or important contractors of the investor to a larger extent. Additionally, a low level of public safety:
may cause a decrease in the size and quality of labor resources as a result of migration caused by worsening of living conditions regarding the sense of safety, indicates occurrence of deficiencies of social capital;
a low level of social capital may impede the process of investment implementation and its further functioning, constitutes a sign of social pathologies or weaknesses
of the power system.To assess investment attractiveness, the following aspects of public safety were analyzed:
the level and structure of crime, the level of crime detection.
The level of public safety has more significance concerning the location of service and high-tech investments which are more dependent on quality of labor resources.
6.9. Activity of voivodships towards investorsActivity of voivodships towards investors is understood as an ability to create an image of a given region, its popularization as well as creating a good atmosphere for investments by local governments. This factor is the least measurable one, therefore its analysis is difficult and it involves only a fragment of a wide spectrum of marketing activities performed by regions. Local and regional governments apply various strategies and tools in this aspect – therefore, it is difficult to find elements allowing comparison. Taking these reservations into account, the following aspects of activity of voivodships were considered:
number of investment offers in the PAIiIZ base, the result of the certification of Regional Investor
Service Centers conducted by PAIiIZ, information and promotional activities towards
investors from the country of capital implemented using appropriate support provided to voivodships by Polish institutions abroad – the DTIP of Polish embassies.
Despite certain disadvantages of the assumed variables (particular voivodships use the analyzed manner of promotion with different intensity), they have a significant advantage in the form of a relatively consistent system of collecting information and therefore – their comparability. A common manner of operating is functioning of Regional Investor Service Centers. They are established within structures of Marshall’s offices or as local government entities created by a given voivodship government, sometimes with participation of other local governments or specialized departments appointed by them. The formula, scope and intensity of their operations are individualized to a certain extent. An example of the assessment of activity of voivodships towards investors illustrates well the fundamental principles, which needs to be taken into account, analyzing the presented results – they represent attractiveness measured applying a certain set of indicators and only in the context of this set of variables, the results can be interpreted.

86 INVESTMENT ATTRACTIVENESS OF VOIVODSHIPS AND SUBREGIONS IN POLAND 2016 INVESTMENT ATTRACTIVENESS OF VOIVODSHIPS AND SUBREGIONS IN POLAND 2016 87
7. Aneks
Voivodship Transport availability
Resources and costs of labor Market Economic
infrastructureSocial infrastructure Public safety Activity towards
investorsInvestment attractiveness of voivodships
Value Rank Value Rank Value Rank Value Rank Value Rank Value Rank Value Rank Value Rank
Weights 20 25 15 10 5 5 20
1 Śląskie 0,22 7 1,37 1 1,38 2 0,79 2 2,13 1 ‒0,65 14 0,79 2 0,903 1
2 Dolnośląskie 0,44 5 0,04 5 0,59 3 1,45 1 0,84 3 ‒1,46 16 1,37 1 0,573 2
3 Mazowieckie 0,67 1 ‒0,15 10 2,02 1 0,56 3 0,38 4 ‒0,96 15 0,60 5 0,544 3
4 Małopolskie 0,04 10 0,55 2 0,47 4 0,39 4 1,99 2 0,02 8 ‒0,07 8 0,341 4
5 Wielkopolskie 0,56 2 0,21 3 ‒0,04 9 0,15 5 ‒0,50 11 0,35 5 0,52 6 0,271 5
6 Zachodniopomorskie 0,47 3 ‒0,25 12 ‒0,02 8 ‒0,11 8 ‒0,02 6 ‒0,19 10 0,76 3 0,160 6
7 Łódzkie 0,35 6 0,07 4 0,09 7 ‒0,09 7 ‒0,36 9 ‒0,37 11 0,28 7 0,111 7
8 Pomorskie ‒0,22 11 ‒0,08 8 0,43 5 ‒0,27 10 0,20 5 ‒0,63 13 0,74 4 0,099 8
9 Opolskie 0,13 9 ‒0,27 13 ‒0,47 10 0,08 6 ‒0,70 13 0,01 9 ‒0,22 9 ‒0,182 9
10 Kujawsko-pomorskie 0,15 8 ‒0,02 7 ‒0,51 11 ‒0,64 16 ‒0,23 7 0,25 6 ‒0,35 11 ‒0,184 10
11 Lubuskie 0,46 4 ‒0,19 11 0,19 6 ‒0,30 11 ‒0,72 14 ‒0,58 12 ‒0,82 14 ‒0,187 11
12 Podkarpackie ‒0,71 14 ‒0,02 6 ‒0,58 12 ‒0,18 9 ‒0,45 10 1,47 1 ‒0,69 13 ‒0,339 12
13 Świętokrzyskie ‒0,23 12 ‒0,14 9 ‒1,05 16 ‒0,51 14 ‒0,29 8 0,79 3 ‒1,01 16 ‒0,466 13
14 Lubelskie ‒0,64 13 ‒0,35 15 ‒0,76 13 ‒0,37 12 ‒0,91 16 1,05 2 ‒0,68 12 ‒0,496 14
15 Warmińsko-mazurskie ‒0,81 15 ‒0,31 14 ‒0,90 15 ‒0,39 13 ‒0,57 12 0,13 7 ‒0,35 10 ‒0,507 15
16 Podlaskie ‒0,88 16 ‒0,46 16 ‒0,83 14 ‒0,55 15 ‒0,79 15 0,78 4 ‒0,85 15 ‒0,641 16
Table 1: Investment attractiveness of voivodships in 2016Source: prepared by IBNGR.

88 INVESTMENT ATTRACTIVENESS OF VOIVODSHIPS AND SUBREGIONS IN POLAND 2016 INVESTMENT ATTRACTIVENESS OF VOIVODSHIPS AND SUBREGIONS IN POLAND 2016 89
VoivodshipSynthetic indicator value 2012
Position in the ranking 2012
Synthetic indicator value 2013
Position in the ranking 2013
Synthetic indicator value 2014
Position in the ranking 2014
Synthetic indicator value 2015
Position in the ranking 2015
Synthetic indicator value 2016
Position in the ranking 2016
Change of the positon 2016‒2015
Śląskie 0,86 1 0,85 1 0,85 1 0,85 1 0,9 1 0
Dolnośląskie 0,46 3 0,50 2 0,46 3 0,46 3 0,57 2 1
Mazowieckie 0,66 2 0,46 3 0,55 2 0,51 2 0,54 3 ‒1
Małopolskie 0,26 5 0,34 4 0,39 4 0,41 4 0,34 4 0
Wielkopolskie 0,33 4 0,32 5 0,32 5 0,30 5 0,27 5 0
Zachodniopomorskie 0,18 6 0,18 7 0,12 7 0,19 6 0,16 6 0
Łódzkie 0,08 8 0,07 8 0,10 8 0,11 8 0,11 7 1
Pomorskie 0,12 7 0,21 6 0,18 6 0,14 7 0,1 8 ‒1
Opolskie ‒0,19 10 ‒0,09 9 ‒0,11 9 ‒0,12 9 ‒0,18 9 0
Kujawsko-pomorskie ‒0,09 9 ‒0,17 10 ‒0,17 10 ‒0,14 10 ‒0,18 10 0
Lubuskie ‒0,21 11 ‒0,23 11 ‒0,25 11 ‒0,25 11 ‒0,19 11 0
Podkarpackie ‒0,42 12 ‒0,40 12 ‒0,36 12 ‒0,34 12 ‒0,34 12 0
Świętokrzyskie ‒0,52 15 ‒0,45 14 ‒0,39 13 ‒0,48 14 ‒0,47 13 1
Lubelskie ‒0,46 13 ‒0,52 15 ‒0,55 15 ‒0,52 15 ‒0,5 14 1
Warmińsko-mazurskie ‒0,48 14 ‒0,44 13 ‒0,52 13 ‒0,47 13 ‒0,5 15 ‒2
Podlaskie ‒0,58 16 ‒0,63 16 ‒0,61 16 ‒0,63 16 ‒0,64 16 0
Table 2: Changes in investment attractiveness of voivodships in 2012–2016Source: prepared by IBNGR.

90 INVESTMENT ATTRACTIVENESS OF VOIVODSHIPS AND SUBREGIONS IN POLAND 2016 INVESTMENT ATTRACTIVENESS OF VOIVODSHIPS AND SUBREGIONS IN POLAND 2016 91
Voivodship Transport availability Costs of labor Labor resources Economic
infrastructureLevel of economic development
Degree of protection of natural environment
Level of public safety
Investment attractiveness of voivodships
Value Rank Value Rank Value Rank Value Rank Value Rank Value Rank Value Rank Value Rank
Weights 20 15 40 15 2 5 3
1 Śląskie 0,02 7 -0,95 15 2,99 1 0,91 2 1,02 3 0,87 4 -0,65 14 1,238 1
2 Dolnośląskie -0,03 8 -0,82 14 0,17 3 2,15 1 1,14 2 1,15 1 -1,46 16 0,297 2
3 Łódzkie 0,06 6 0,04 10 0,14 4 0,24 4 -0,13 6 1,07 2 -0,37 11 0,146 3
4 Zachodniopomorskie 1,05 1 0,36 7 -0,63 14 0,10 5 -0,14 7 0,92 3 -0,19 10 0,068 4
5 Małopolskie -0,18 9 -0,49 11 0,71 2 -0,29 10 0,32 4 -1,48 15 0,02 8 0,066 5
6 Podkarpackie -0,31 12 0,90 3 -0,05 7 0,03 6 -0,39 11 -0,86 13 1,47 1 0,050 6
7 Kujawsko-Pomorskie 0,42 3 0,93 2 -0,15 8 -0,90 16 -0,55 13 0,14 9 0,25 6 0,031 7
8 Wielkopolskie 0,29 5 -0,50 12 0,00 6 -0,02 8 -0,23 10 0,15 8 0,35 5 -0,009 8
9 Lubuskie 1,00 2 0,31 8 -0,56 13 0,02 7 -0,19 9 -0,40 12 -0,58 12 -0,014 9
10 Opolskie -0,48 14 0,05 9 -0,35 11 0,67 3 -0,14 8 0,49 6 0,01 9 -0,104 10
11 Pomorskie 0,40 4 -0,71 13 -0,16 9 -0,89 15 0,14 5 0,07 11 -0,63 13 -0,238 11
12 Lubelskie -0,49 15 0,38 6 -0,54 12 -0,31 11 -0,74 14 0,83 5 1,05 2 -0,245 12
13 Świętokrzyskie -0,29 10 0,71 4 -0,26 10 -0,67 14 -0,53 12 -2,40 16 0,79 3 -0,263 13
14 Podlaskie -0,32 13 0,56 5 -0,67 16 -0,23 9 -1,00 15 0,14 10 0,78 4 -0,273 14
15 Warmińsko-Mazurskie -0,85 16 1,35 1 -0,63 15 -0,40 12 -1,01 16 14 14 0,13 7 -0,346 15
16 Mazowieckie -0,30 11 -2,12 16 0,00 5 -0,41 13 2,43 1 7 7 -0,96 15 -0,402 16
Table 3: Investment attractiveness of voivodships for industrial activities in 2016Source: prepared by IBNGR.

92 INVESTMENT ATTRACTIVENESS OF VOIVODSHIPS AND SUBREGIONS IN POLAND 2016 INVESTMENT ATTRACTIVENESS OF VOIVODSHIPS AND SUBREGIONS IN POLAND 2016 93
Table 4: Investment attractiveness of voivodships for service activities in 2016Source: prepared by IBNGR.
Voivodship Transport availability Costs of labor Institutional
market capacitySize and quality of labor resources
Economic infrastructure
Level of economic development
Quality of natural environment
Level of public safety
Investment attractiveness of voivodships
Value Rank Value Rank Value Rank Value Rank Value Rank Value Rank Value Rank Value Rank Value Rank
Weights 10 15 20 25 10 5 7 8
1 Śląskie 0,18 4 -0,92 15 2,90 1 1,37 1 0,48 4 0,76 2 -1,15 16 -0,65 14 0,757 1
2 Mazowieckie 2,21 1 -2,59 16 1,24 2 1,18 3 0,96 2 1,98 1 -0,05 10 -0,96 15 0,490 2
3 Małopolskie 0,10 6 -0,30 12 0,54 4 1,30 2 -0,19 10 0,49 4 0,10 7 0,02 8 0,411 3
4 Dolnośląskie 0,25 2 -0,84 14 0,76 3 0,40 4 2,04 1 0,73 3 -0,02 8 -1,46 16 0,273 4
5 Wielkopolskie 0,25 3 -0,09 11 -0,01 7 -0,05 7 -0,01 9 -0,02 8 -0,08 13 0,35 5 0,017 5
6 Podkarpackie -0,68 16 0,86 3 -0,44 10 -0,31 9 -0,65 12 0,16 6 0,44 3 1,47 1 -0,014 6
7 Pomorskie -0,03 7 -0,70 13 0,13 6 0,10 5 0,06 7 0,38 5 0,53 2 -0,63 13 -0,045 7
8 Łódzkie 0,17 5 0,10 10 0,13 5 -0,02 6 -0,30 11 -0,22 10 -0,53 14 -0,37 11 -0,053 8
9 Kujawsko-Pomorskie -0,10 8 0,86 2 -0,28 9 -0,39 11 -0,67 13 -0,62 14 -0,03 9 0,25 6 -0,115 9
10 Opolskie -0,24 11 0,10 9 -0,20 8 -0,56 13 0,57 3 -0,05 9 -0,07 12 0,01 9 -0,138 10
11 Zachodniopomorskie -0,23 10 0,26 8 -0,69 12 -0,30 8 0,18 6 0,16 7 0,31 6 -0,19 10 -0,166 11
12 Świętokrzyskie -0,27 12 0,70 4 -0,67 11 -0,42 12 -1,18 16 -0,37 11 0,31 5 0,79 3 -0,214 12
13 Warmińsko-Mazurskie -0,54 14 1,12 1 -0,91 15 -0,64 14 0,02 8 -1,01 15 0,71 1 0,13 7 -0,218 13
14 Lubuskie -0,12 9 0,52 6 -0,78 14 -0,64 15 0,20 5 -0,56 12 0,39 4 -0,58 12 -0,279 14
15 Lubelskie -0,38 13 0,39 7 -0,78 13 -0,37 10 -0,82 15 -0,60 13 -0,81 15 1,05 2 -0,313 15
16 Podlaskie -0,56 15 0,54 5 -0,93 16 -0,65 16 -0,70 14 -1,21 16 -0,06 11 0,78 4 -0,394 16

94 INVESTMENT ATTRACTIVENESS OF VOIVODSHIPS AND SUBREGIONS IN POLAND 2016 INVESTMENT ATTRACTIVENESS OF VOIVODSHIPS AND SUBREGIONS IN POLAND 2016 95
Table 5: Investment attractiveness of voivodships for high-tech activities in 2016Source: prepared by IBNGR.
Voivodship Transport availability Institutional market capacity
Quality of labor resources
Economic infrastructure
Level of economic development
Quality of natural environment Social infrastructure Level of public safety
Investment attractiveness of voivodships
Value Rank Value Rank Value Rank Value Rank Value Rank Value Rank Value Rank Value Rank Value Rank
Weights 20 10 30 10 5 7 10 8
1 Mazowieckie 2,09 1 1,24 2 1,09 2 1,19 2 1,74 1 -0,05 10 0,24 6 -0,96 15 1,019 1
2 Małopolskie 0,13 5 0,54 4 1,91 1 -0,17 10 0,42 4 0,10 7 0,67 4 0,02 8 0,733 2
3 Dolnośląskie 0,31 2 0,76 3 0,65 3 2,02 1 1,44 2 -0,02 8 0,90 3 -1,46 16 0,580 3
4 Śląskie 0,21 4 2,90 1 0,57 4 0,41 4 0,85 3 -1,15 16 0,31 5 -0,65 14 0,483 4
5 Pomorskie -0,03 8 0,13 6 0,38 5 0,22 6 0,30 5 0,53 2 1,08 2 -0,63 13 0,254 5
6 Zachodniopomorskie -0,06 9 -0,69 12 -0,07 7 0,19 7 -0,06 8 0,31 6 1,62 1 -0,19 10 0,085 6
7 Wielkopolskie 0,29 3 -0,01 7 -0,04 6 -0,01 9 -0,38 12 -0,08 13 -0,09 8 0,35 5 0,037 7
8 Łódzkie 0,10 6 0,13 5 -0,38 10 -0,39 11 -0,09 9 -0,53 14 -0,20 10 -0,37 11 -0,210 8
9 Opolskie -0,18 11 -0,20 8 -0,44 11 0,55 3 0,03 7 -0,07 12 -1,14 16 0,01 9 -0,248 9
10 Kujawsko-Pomorskie -0,11 10 -0,28 9 -0,38 9 -0,63 12 -0,53 13 -0,03 9 -0,19 9 0,25 6 -0,255 10
11 Podkarpackie -0,66 16 -0,44 10 -0,44 12 -0,77 13 0,09 6 0,44 3 -0,50 12 1,47 1 -0,283 11
12 Lubuskie 0,00 7 -0,78 14 -0,63 14 0,23 5 -0,12 10 0,39 4 -0,88 15 -0,58 12 -0,359 12
13 Świętokrzyskie -0,34 12 -0,67 11 -0,44 13 -1,27 16 -0,35 11 0,31 5 -0,43 11 0,79 3 -0,372 13
14 Warmińsko-Mazurskie -0,62 14 -0,91 15 -0,64 15 0,10 8 -1,21 15 0,71 1 -0,09 7 0,13 7 -0,409 14
15 Lubelskie -0,47 13 -0,78 13 -0,26 8 -0,91 15 -0,79 14 -0,81 15 -0,66 14 1,05 2 -0,420 15
16 Podlaskie -0,65 15 -0,93 16 -0,86 16 -0,77 14 -1,34 16 -0,06 11 -0,64 13 0,78 4 -0,633 16

96 INVESTMENT ATTRACTIVENESS OF VOIVODSHIPS AND SUBREGIONS IN POLAND 2016 INVESTMENT ATTRACTIVENESS OF VOIVODSHIPS AND SUBREGIONS IN POLAND 2016 97
Subregion Transport availability Costs of labor Labor resources Economic infrastructure
Level of economic development
Degree of protection of natural environment
Level of public safety
Investment attractiveness of voivodships
Value Rank Value Rank Value Rank Value Rank Value Rank Value Rank Value Rank Value Rank
Weights 20 15 40 15 2 5 3
1 Katowicki 0,53 8 -1,26 53 3,37 1 1,43 4 0,90 6 1,04 7 -1,46 55 1,505 1
2 Rybnicki 0,16 23 -1,54 56 3,06 2 0,75 6 0,42 11 0,28 27 -0,05 38 1,158 2
3 Łódzki 0,47 10 -0,40 45 2,32 3 0,36 13 0,76 9 0,76 16 -1,53 57 1,024 3
4 Bielski -0,11 35 -0,81 52 1,67 4 0,57 8 0,49 10 -0,41 44 -0,40 44 0,588 4
5 Oświęcimski -0,08 34 0,02 36 1,18 6 -0,15 33 -0,02 22 0,86 11 0,11 33 0,483 5
6 Wrocławski 0,58 6 -1,38 55 0,28 12 2,90 1 0,83 8 0,90 10 -2,30 60 0,448 6
7 Poznański 0,85 5 -1,54 57 0,91 8 0,35 16 1,02 5 0,84 13 -1,48 56 0,373 7
8 Częstochowski -0,06 31 0,09 33 0,49 11 0,35 14 -0,08 26 0,78 15 0,45 20 0,303 8
9 Krakowski 0,31 17 -1,36 54 1,19 5 -0,15 32 1,07 4 -0,16 37 -1,05 53 0,294 9
10 Bydgosko-toruński 0,55 7 -0,64 46 0,90 9 -0,65 50 0,27 15 -0,22 38 -0,65 48 0,250 10
11 Jeleniogórski -0,14 37 0,12 31 -0,32 31 2,17 2 0,30 14 1,21 5 -0,96 52 0,226 11
12 Inowrocławski 0,99 3 1,31 3 -0,42 37 -0,74 53 -0,41 44 1,29 3 0,29 29 0,181 12
13 Wałbrzyski 0,13 25 0,21 28 0,04 19 0,50 10 0,01 21 0,45 24 -0,30 42 0,162 13
14 Rzeszowski 0,10 27 -0,15 43 0,23 14 0,33 17 0,11 19 -0,26 40 0,60 14 0,149 14
15 Szczeciński 1,50 1 -0,76 49 -0,38 36 0,21 18 0,31 13 1,30 2 -0,83 49 0,113 15
16 Tarnobrzeski -0,53 51 0,32 23 0,19 15 0,04 22 -0,02 23 1,23 4 0,83 9 0,112 16
17 Zielonogórski 0,99 4 -0,03 39 -0,45 39 0,69 7 0,16 17 0,16 29 -0,85 50 0,102 17
18 Opolski 0,38 13 -0,75 48 -0,20 24 1,52 3 0,13 18 0,02 33 -0,49 45 0,101 18
19 Koniński 0,39 11 0,26 24 -0,17 23 0,16 20 -0,44 46 0,15 30 0,88 8 0,098 19
20 Legnicko-głogowski 0,47 9 -1,99 59 0,23 13 1,22 5 1,71 3 0,49 23 -1,72 59 0,080 20
21 Sieradzki 0,36 15 0,43 17 -0,35 32 0,10 21 -0,69 55 0,55 22 0,49 19 0,041 21
22 Szczecinecko-pyrzycki 0,25 19 1,23 4 -0,70 60 0,48 11 -0,57 50 -0,06 35 0,14 32 0,016 22
23 Włocławski 0,13 26 1,45 1 -0,37 35 -0,76 55 -0,17 30 0,80 14 -0,59 47 0,002 23
24 Warszawski 0,18 20 -2,58 60 0,97 7 -0,22 36 3,35 1 -0,38 43 -1,69 58 0,000 24
25 Skierniewicki 0,28 18 0,26 25 -0,45 38 0,17 19 -0,37 40 0,91 9 0,39 21 -0,011 25
26 Piotrkowski 0,17 21 -0,78 51 -0,16 22 0,40 12 0,36 12 0,86 12 0,32 28 -0,027 26
27 Nyski -0,11 36 0,61 14 -0,54 44 0,50 9 -0,30 34 0,74 17 0,09 34 -0,037 27
28 Gorzowski 1,38 2 -0,10 42 -0,56 50 -0,09 28 -0,15 29 -0,95 52 -0,96 51 -0,057 28
29 Radomski -0,30 43 0,90 8 -0,27 27 -0,42 45 -0,37 42 0,39 25 0,39 22 -0,070 29
30 Kielecki 0,13 24 0,35 21 0,10 16 -0,34 44 -0,08 25 -2,85 8 0,02 37 -0,078 30
Table 6: Investment attractiveness of subregions for industrial activities in 2016Source: prepared by IBNGR.

98 INVESTMENT ATTRACTIVENESS OF VOIVODSHIPS AND SUBREGIONS IN POLAND 2016 INVESTMENT ATTRACTIVENESS OF VOIVODSHIPS AND SUBREGIONS IN POLAND 2016 99
Voivodship Transport availability Costs of labor Labor resources Economic
infrastructureLevel of economic development
Degree of protection of natural environment
Level of public safety
Investment attractiveness of voivodships
Value Rank Value Rank Value Rank Value Rank Value Rank Value Rank Value Rank Value Rank
Weights 20 15 40 15 2 5 3
31 Trójmiejski 0,36 14 -1,58 58 0,61 10 -0,75 54 0,84 7 -0,55 49 -1,30 54 -0,084 31
32 Koszaliński -0,19 38 0,41 20 -0,50 43 0,35 15 -0,03 24 1,12 6 -0,49 46 -0,085 32
33 Grudziądzki -0,06 33 0,94 6 -0,31 30 -0,71 51 -0,54 49 -0,23 39 0,91 7 -0,098 33
34 Nowotarski -0,37 47 0,26 26 0,06 17 -0,27 39 -0,14 28 -1,54 55 0,52 17 -0,114 34
35 Kaliski -0,32 44 0,06 35 -0,12 21 -0,04 25 -0,37 41 -0,42 45 0,56 16 -0,122 35
36 Lubelski -0,25 42 -0,70 47 0,06 18 -0,13 30 0,20 16 0,64 19 -0,25 40 -0,123 36
37 Starogardzki 0,38 12 -0,06 41 -0,27 28 -0,72 52 0,03 20 0,32 26 -0,29 41 -0,139 37
38 Białostocki -0,01 29 0,01 38 -0,36 33 -0,14 31 -0,12 27 0,17 28 0,20 31 -0,154 38
39 Puławski -0,06 32 0,20 29 -0,45 40 -0,16 34 -0,35 37 0,10 31 1,03 3 -0,157 39
40 Ostrołęcki -0,23 41 0,41 18 -0,57 51 -0,23 38 -0,72 57 1,81 1 0,37 26 -0,158 40
41 Leszczyński 0,04 28 -0,17 44 -0,36 34 -0,27 40 -0,34 36 0,01 34 1,18 2 -0,175 41
42 Przemyski -0,58 53 0,91 7 -0,45 41 -0,20 35 -0,38 43 -0,82 50 1,28 1 -0,201 42
43 Świecki 0,35 16 0,71 13 -0,55 46 -0,82 58 -0,18 32 -1,56 56 0,82 10 -0,223 43
44 Krośnieński -0,68 56 0,77 11 -0,27 29 -0,06 26 -0,36 39 -2,36 58 1,00 6 -0,235 44
45 Elbląski -0,59 54 0,97 5 -0,46 42 -0,45 46 -0,47 47 -0,52 48 -0,15 39 -0,265 45
46 Chełmsko-zamojski -0,82 57 0,57 15 -0,62 55 0,02 23 -0,67 54 0,59 21 1,02 5 -0,278 46
47 Nowosądecki -1,04 59 0,55 16 -0,02 20 -0,30 42 -0,25 33 -2,17 57 0,38 25 -0,280 47
48 Olsztyński -0,20 39 0,19 30 -0,57 52 -0,04 24 -0,18 31 -0,51 46 -0,32 43 -0,282 48
49 Ciechanowski -0,40 49 0,82 10 -0,54 45 -0,55 49 -0,72 58 -0,52 47 0,38 24 -0,284 49
50 Słupski -0,36 45 0,34 22 -0,56 48 -0,46 47 -0,35 38 0,60 20 0,04 36 -0,288 50
51 Pilski 0,16 22 0,07 34 -0,56 49 -0,80 56 -0,53 48 -0,09 36 0,81 11 -0,291 51
52 Chojnicki -0,21 40 0,86 9 -0,61 54 -0,82 57 -0,64 53 -0,35 41 0,51 18 -0,295 52
53 Tarnowski -0,57 52 0,41 19 -0,24 25 -0,28 41 -0,42 45 -2,50 59 0,39 23 -0,312 53
54 Łomżyński -0,47 50 0,11 32 -0,69 59 -0,10 29 -0,75 59 0,65 18 0,75 12 -0,328 54
55 Siedlecki -0,38 48 -0,05 40 -0,60 53 -0,31 43 -0,59 51 0,08 32 0,63 13 -0,359 55
56 Płocki -0,03 30 -0,76 50 -0,26 26 -1,32 59 1,94 2 -0,35 42 0,33 27 -0,390 56
57 Sandomiersko-jędrzejowski -0,36 46 0,01 37 -0,55 47 -0,54 48 -0,32 35 -1,03 53 0,58 15 -0,414 57
58 Bialski -0,61 55 0,71 12 -0,68 58 -1,32 59 -0,76 60 1,00 8 1,02 4 -0,421 58
59 Suwalski -0,89 58 0,24 27 -0,68 57 -0,08 27 -0,63 52 -0,83 51 0,27 30 -0,471 59
60 Ełcki -1,60 60 1,35 2 -0,66 56 -0,23 37 -0,71 56 -1,50 54 0,07 35 -0,504 60
Table 6 cd: Investment attractiveness of subregions for industrial activities in 2016Source: prepared by IBNGR.

100 INVESTMENT ATTRACTIVENESS OF VOIVODSHIPS AND SUBREGIONS IN POLAND 2016 INVESTMENT ATTRACTIVENESS OF VOIVODSHIPS AND SUBREGIONS IN POLAND 2016 101
Table 7: Investment attractiveness of subregions for service activities in 2016Source: prepared by IBNGR.
Subregion Transport availability Costs of labor Institutional market capacity
Size and quality of labor resources
Economic infrastructure
Level of economic development
Quality of natural environment Level of public safety
Investment attractiveness of subregions
Value Rank Value Rank Value Rank Value Rank Value Rank Value Rank Value Rank Value Rank Value Rank
Weights 10 15 20 25 10 5 7 8
1 Warszawski 1,23 1 -2,99 60 3,88 1 2,63 1 1,48 3 3,47 1 0,52 11 -1,69 58 1,331 1
2 Łódzki 1,12 2 -0,43 45 2,03 4 2,27 3 0,61 14 0,58 11 0,24 23 -1,53 57 1,003 2
3 Krakowski 0,64 10 -1,30 52 1,49 6 2,47 2 0,82 10 0,71 7 0,02 35 -1,05 53 0,820 3
4 Katowicki 0,88 6 -1,39 56 3,29 2 1,37 5 1,25 5 0,76 6 -1,60 60 -1,46 55 0,813 4
5 Poznański 1,10 3 -1,37 55 1,48 7 1,51 4 1,17 6 1,30 2 0,24 22 -1,48 56 0,660 5
6 Wrocławski 1,03 4 -1,35 54 1,20 8 1,01 8 2,62 1 0,98 5 0,11 32 -2,30 60 0,528 6
7 Trójmiejski 0,58 14 -1,67 57 1,54 5 1,21 6 0,64 13 1,01 4 0,63 7 -1,30 54 0,475 7
8 Bydgosko-toruński 0,82 7 -0,51 46 0,63 12 1,08 7 0,39 17 0,28 19 0,45 14 -0,65 48 0,434 8
9 Rzeszowski 0,47 16 -0,25 44 0,17 14 0,45 10 0,47 16 0,55 12 0,34 17 0,60 14 0,302 9
10 Lubelski 0,66 9 -0,78 49 0,27 13 0,84 9 0,28 19 0,20 23 -0,04 37 -0,25 40 0,228 10
11 Rybnicki 0,40 19 -1,75 58 2,34 3 0,09 16 0,27 20 0,35 17 -1,55 59 -0,05 38 0,201 11
12 Bielski 0,06 29 -0,64 47 0,72 11 0,35 11 0,23 22 0,60 10 0,24 21 -0,40 44 0,178 12
13 Oświęcimski 0,26 25 0,21 32 0,74 10 -0,09 18 -0,41 35 0,46 13 -0,83 57 0,11 33 0,117 13
14 Częstochowski 0,32 22 0,28 29 -0,06 20 0,14 14 -0,10 28 0,18 25 -0,30 42 0,45 20 0,111 14
15 Kielecki -0,26 38 0,26 31 -0,31 28 0,12 15 -0,28 31 0,26 20 1,03 1 0,02 37 0,038 15
16 Wałbrzyski -0,19 35 0,10 37 -0,22 26 -0,26 27 1,42 4 0,40 15 0,17 26 -0,30 42 0,037 16
17 Szczeciński 0,94 5 -0,86 50 -0,12 22 0,17 13 0,68 11 0,64 9 0,02 34 -0,83 49 0,020 17
18 Opolski 0,28 24 -0,71 48 0,13 16 -0,21 24 1,17 7 0,39 16 0,14 29 -0,49 45 0,003 18
19 Tarnowski -0,16 34 0,44 20 -0,07 21 -0,24 25 -0,53 41 0,23 21 0,21 24 0,52 17 -0,011 19
20 Koniński 0,43 18 0,41 22 -0,16 23 -0,33 34 -0,26 29 -0,34 39 -0,74 56 0,88 8 -0,035 20
21 Krośnieński -0,56 50 0,87 8 -0,67 50 -0,20 23 -0,54 42 -0,31 37 0,91 2 1,00 6 -0,035 21
22 Olsztyński 0,58 13 0,01 41 -0,66 49 -0,11 19 0,60 15 -0,27 36 0,58 9 -0,32 43 -0,038 22
23 Jeleniogórski -0,61 52 0,18 34 -0,30 27 -0,25 26 1,66 2 0,68 8 -0,24 41 -0,96 52 -0,050 23
24 Przemyski -0,40 46 0,77 10 -0,69 52 -0,28 30 -0,50 39 -0,32 38 0,67 6 1,28 1 -0,050 24
25 Tarnobrzeski -0,32 41 0,39 24 -0,01 18 -0,34 36 -0,45 37 0,21 22 -0,32 43 0,83 9 -0,050 25
26 Nyski -0,03 33 0,58 18 -0,59 40 -0,43 43 0,67 12 -0,18 33 -0,13 39 0,09 34 -0,084 26
27 Białostocki -0,99 55 -0,08 43 -0,47 33 0,18 12 0,18 24 0,09 26 0,48 12 0,20 31 -0,089 27
28 Szczecinecko-pyrzycki -0,33 44 0,98 4 -0,80 60 -0,38 38 0,22 23 -0,37 40 0,41 16 0,14 32 -0,099 28
29 Kaliski -0,32 40 0,62 17 -0,32 29 -0,42 42 -0,37 34 -0,14 32 0,10 33 0,56 16 -0,102 29
30 Inowrocławski 0,59 12 1,16 1 -0,42 32 -0,54 56 -0,63 45 -0,84 53 -0,55 50 0,29 29 -0,105 30

102 INVESTMENT ATTRACTIVENESS OF VOIVODSHIPS AND SUBREGIONS IN POLAND 2016 INVESTMENT ATTRACTIVENESS OF VOIVODSHIPS AND SUBREGIONS IN POLAND 2016 103
Table 7 cd: Investment attractiveness of subregions for service activities in 2016Source: prepared by IBNGR.
Subregion Transport availability Costs of labor Institutional market capacity
Size and quality of labor resources
Economic infrastructure
Level of economic development
Quality of natural environment Level of public safety
Investment attractiveness of subregions
Value Rank Value Rank Value Rank Value Rank Value Rank Value Rank Value Rank Value Rank Value Rank
Weights 10 15 20 25 10 5 7 8
31 Radomski 0,05 30 0,44 21 -0,20 25 -0,27 29 -0,71 50 -0,08 31 -0,40 46 0,39 22 -0,108 31
32 Elbląski -0,38 45 0,91 7 -0,55 38 -0,43 45 0,12 26 -0,44 45 0,46 13 -0,15 39 -0,110 32
33 Grudziądzki -0,02 32 0,94 6 -0,49 35 -0,57 58 -0,67 47 -0,48 46 0,14 31 0,91 7 -0,111 33
34 Koszaliński -1,08 58 0,41 23 -0,56 39 0,05 17 0,35 18 0,31 18 0,21 25 -0,49 46 -0,120 34
35 Skierniewicki 0,54 15 0,46 19 -0,37 30 -0,44 47 -0,33 33 -0,37 41 -0,63 53 0,39 21 -0,127 35
36 Włocławski 0,18 28 1,12 3 -0,04 19 -0,40 40 -0,91 57 -0,63 49 -0,62 52 -0,59 47 -0,134 36
37 Sieradzki 0,62 11 0,69 12 -0,65 48 -0,33 35 -0,71 52 -0,40 42 -0,53 49 0,49 19 -0,136 37
38 Nowosądecki -1,05 56 0,82 9 -0,48 34 -0,19 21 -0,71 51 0,04 28 0,31 18 0,38 25 -0,140 38
39 Leszczyński -0,24 37 0,27 30 -0,40 31 -0,49 50 -0,60 44 -0,07 30 0,15 28 1,18 2 -0,144 39
40 Zielonogórski 0,01 31 0,06 40 -0,54 36 -0,26 28 0,83 9 -0,25 35 0,14 30 -0,85 50 -0,150 40
41 Nowotarski -0,87 54 0,67 15 -0,61 42 -0,15 20 -0,98 58 0,05 27 0,75 4 0,39 23 -0,158 41
42 Świecki 0,34 20 0,68 14 -0,68 51 -0,60 60 -0,82 56 -0,69 52 0,55 10 0,82 10 -0,162 42
43 Puławski 0,46 17 0,34 26 -0,61 41 -0,43 44 -0,72 54 0,01 29 -0,66 54 1,03 3 -0,169 43
44 Gorzowski 0,32 21 0,09 39 -0,61 44 -0,33 33 0,25 21 -0,43 44 0,72 5 -0,96 51 -0,181 44
45 Starogardzki 0,26 26 -0,04 42 -0,18 24 -0,52 53 -0,28 30 0,18 24 -0,02 36 -0,29 41 -0,190 45
46 Chojnicki -0,50 49 0,98 5 -0,72 54 -0,51 52 -0,67 48 -0,63 50 0,59 8 0,51 18 -0,191 46
47 Ełcki -1,56 59 1,13 2 -0,78 58 -0,39 39 0,14 25 -0,88 54 0,88 3 0,07 35 -0,202 47
48 Piotrkowski 0,69 8 -0,89 51 0,13 15 -0,46 49 -0,31 32 -0,24 34 -0,74 55 0,32 28 -0,220 48
49 Ciechanowski 0,29 23 0,69 13 -0,63 45 -0,52 54 -0,64 46 -0,90 55 -0,35 45 0,38 24 -0,226 49
50 Płocki 0,23 27 -1,33 53 0,12 17 -0,29 31 -0,72 53 1,05 3 -0,12 38 0,33 27 -0,228 50
51 Chełmsko-zamojski -0,32 42 0,65 16 -0,78 57 -0,41 41 -0,58 43 -0,60 48 -0,55 51 1,02 5 -0,238 51
52 Słupski -1,06 57 0,36 25 -0,61 43 -0,31 32 -0,06 27 -0,40 43 0,43 15 0,04 36 -0,243 52
53 Legnicko-głogowski -0,33 43 -2,50 59 1,00 9 -0,19 22 1,06 8 0,45 14 0,26 20 -1,72 59 -0,247 53
54 Siedlecki -0,23 36 0,11 36 -0,54 37 -0,36 37 -0,51 40 -1,13 60 -0,23 40 0,63 13 -0,278 54
55 Pilski -0,43 47 0,29 27 -0,65 47 -0,58 59 -0,46 38 -0,91 57 0,27 19 0,81 11 -0,283 55
56 Bialski -0,84 53 0,70 11 -0,79 59 -0,44 48 -1,08 59 -0,66 51 -0,50 48 1,02 4 -0,343 56
57 Sandomiersko-jędrzejowski -0,30 39 0,10 38 -0,63 46 -0,44 46 -1,13 60 -0,56 47 -0,33 44 0,58 15 -0,368 57
58 Łomżyński -0,59 51 0,17 35 -0,73 55 -0,55 57 -0,70 49 -0,91 56 -0,46 47 0,75 12 -0,404 58
59 Ostrołęcki -0,46 48 0,29 28 -0,70 53 -0,49 51 -0,78 55 -0,94 58 -1,08 58 0,37 26 -0,438 59
60 Suwalski -1,95 60 0,20 33 -0,74 56 -0,52 55 -0,44 36 -1,02 59 0,16 27 0,27 30 -0,506 60

104 INVESTMENT ATTRACTIVENESS OF VOIVODSHIPS AND SUBREGIONS IN POLAND 2016 INVESTMENT ATTRACTIVENESS OF VOIVODSHIPS AND SUBREGIONS IN POLAND 2016 105
Table 8: Investment attractiveness of subregions for high-tech activities in 2016Source: prepared by IBNGR.
Subregion Transport availability Institutional market capacity
Quality of labor resources
Economic infrastructure
Level of economic development
Quality of natural environment Social infrastructure Level of public safety
Investment attractiveness of subregions
Value Rank Value Rank Value Rank Value Rank Value Rank Value Rank Value Rank Value Rank Value Rank
Weights 20 10 30 10 5 7 10 8
1 Warszawski 1,10 2 3,88 1 2,15 2 1,76 2 1,31 3 0,52 11 0,65 12 -1,69 58 1,461 1
2 Krakowski 0,52 13 1,49 6 2,96 1 0,98 9 0,69 9 0,02 35 0,83 9 -1,05 53 1,274 2
3 Poznański 1,12 1 1,48 7 1,77 3 1,31 5 0,72 6 0,24 22 1,25 5 -1,48 56 1,093 3
4 Łódzki 1,02 5 2,03 4 1,75 4 0,65 15 0,48 14 0,24 23 0,66 11 -1,53 57 0,982 4
5 Wrocławski 1,04 3 1,20 8 1,43 5 2,58 1 0,73 5 0,11 32 0,93 7 -2,30 60 0,968 5
6 Trójmiejski 0,41 16 1,54 5 1,37 6 0,87 10 0,82 4 0,63 7 1,36 3 -1,30 54 0,853 6
7 Bydgosko-toruński 0,74 7 0,63 12 1,24 7 0,57 16 0,39 19 0,45 14 0,83 8 -0,65 48 0,723 7
8 Katowicki 0,81 6 3,29 2 0,60 9 1,22 6 0,70 7 -1,60 60 0,41 15 -1,46 55 0,639 8
9 Lubelski 0,41 17 0,27 13 1,17 8 0,35 18 0,47 15 -0,04 37 0,17 19 -0,25 40 0,512 9
10 Szczeciński 1,03 4 -0,12 22 0,41 11 0,76 12 0,49 12 0,02 34 1,32 4 -0,83 49 0,484 10
11 Rzeszowski 0,28 25 0,17 14 0,59 10 0,50 17 0,48 13 0,34 17 0,38 16 0,60 14 0,432 11
12 Olsztyński 0,33 21 -0,66 49 0,20 13 0,71 13 -0,03 30 0,58 9 0,82 10 -0,32 43 0,226 12
13 Bielski 0,04 30 0,72 11 0,14 14 0,17 25 0,43 16 0,24 21 0,52 14 -0,40 44 0,196 13
14 Koszaliński -0,76 52 -0,56 39 0,35 12 0,35 19 0,07 28 0,21 25 2,34 1 -0,49 46 0,143 14
15 Wałbrzyski -0,01 32 -0,22 26 -0,19 26 1,58 3 0,28 22 0,17 26 0,38 17 -0,30 42 0,119 15
16 Częstochowski 0,32 22 -0,06 20 0,12 15 -0,18 28 0,13 26 -0,30 42 0,03 22 0,45 20 0,102 16
17 Legnicko-głogowski -0,06 37 1,00 9 -0,34 38 1,03 8 2,49 2 0,26 20 0,01 26 -1,72 59 0,096 17
18 Płocki 0,45 14 0,12 17 -0,26 33 -0,62 43 2,69 1 -0,12 38 -0,20 27 0,33 27 0,095 18
19 Opolski 0,10 28 0,13 16 -0,01 20 1,11 7 0,36 21 0,14 29 -0,38 34 -0,49 45 0,090 19
20 Jeleniogórski -0,28 44 -0,30 27 -0,25 31 1,58 4 0,63 11 -0,24 41 0,55 13 -0,96 52 -0,010 20
21 Oświęcimski 0,38 18 0,74 10 -0,20 27 -0,45 36 0,41 18 -0,83 57 -0,44 35 0,11 33 -0,025 21
22 Rybnicki 0,38 19 2,34 3 -0,85 58 0,19 24 0,69 8 -1,55 59 -0,22 29 -0,05 38 -0,028 22
23 Kielecki -0,71 51 -0,31 28 0,11 16 -0,27 30 0,25 24 1,03 1 0,11 20 0,02 37 -0,069 23
24 Zielonogórski -0,04 33 -0,54 36 0,00 19 0,85 11 0,42 17 0,14 30 -0,60 52 -0,85 50 -0,075 24
25 Słupski -0,82 55 -0,61 43 0,02 18 0,01 27 -0,27 38 0,43 15 0,99 6 0,04 36 -0,098 25
26 Inowrocławski 0,58 10 -0,42 32 -0,03 21 -0,61 42 -0,49 45 -0,55 50 -0,74 59 0,29 29 -0,110 26
27 Skierniewicki 0,56 11 -0,37 30 -0,20 28 -0,41 33 -0,48 44 -0,63 53 -0,52 44 0,39 21 -0,116 27
28 Tarnowski -0,13 39 -0,07 21 -0,12 24 -0,57 41 0,17 25 0,21 24 -0,57 50 0,52 17 -0,118 28
29 Gorzowski 0,34 20 -0,61 44 -0,46 46 0,31 20 -0,06 32 0,72 5 0,02 24 -0,96 51 -0,129 29
30 Puławski 0,31 23 -0,61 41 -0,14 25 -0,82 53 -0,28 39 -0,66 54 -0,34 31 1,03 3 -0,132 30

106 INVESTMENT ATTRACTIVENESS OF VOIVODSHIPS AND SUBREGIONS IN POLAND 2016 INVESTMENT ATTRACTIVENESS OF VOIVODSHIPS AND SUBREGIONS IN POLAND 2016 107
Table 8 cd: Investment attractiveness of subregions for high-tech activities in 2016Source: prepared by IBNGR.
Subregion Transport availability Institutional market capacity
Quality of labor resources
Economic infrastructure
Level of economic development
Quality of natural environment Social infrastructure Level of public safety
Investment attractiveness of subregions
Value Rank Value Rank Value Rank Value Rank Value Rank Value Rank Value Rank Value Rank Value Rank
Weights 20 10 30 10 5 7 10 8
31 Nowotarski -0,79 53 -0,61 42 -0,22 29 -1,10 59 -0,22 36 0,75 4 1,92 2 0,39 23 -0,132 31
32 Piotrkowski 0,66 8 0,13 15 -0,77 56 -0,42 34 0,68 10 -0,74 55 -0,20 28 0,32 28 -0,139 32
33 Leszczyński -0,06 36 -0,40 31 -0,23 30 -0,66 46 -0,36 41 0,15 28 -0,61 54 1,18 2 -0,161 33
34 Nyski 0,01 31 -0,59 40 -0,32 36 0,70 14 -0,26 37 -0,13 39 -0,68 57 0,09 34 -0,167 34
35 Koniński 0,55 12 -0,16 23 -0,60 53 -0,33 31 -0,55 47 -0,74 56 -0,53 47 0,88 8 -0,182 35
36 Krośnieński -0,63 50 -0,67 50 -0,28 34 -0,62 44 -0,05 31 0,91 2 0,05 21 1,00 6 -0,194 36
37 Siedlecki -0,22 42 -0,54 37 -0,10 23 -0,54 39 -1,07 56 -0,23 40 0,03 23 0,63 13 -0,198 37
38 Starogardzki 0,21 26 -0,18 24 -0,48 48 -0,20 29 0,28 23 -0,02 36 -0,58 51 -0,29 41 -0,210 38
39 Sieradzki 0,65 9 -0,65 48 -0,33 37 -0,85 55 -0,89 52 -0,53 49 -0,77 60 0,49 19 -0,239 39
40 Kaliski -0,12 38 -0,32 29 -0,43 44 -0,43 35 -0,33 40 0,10 33 -0,46 37 0,56 16 -0,240 40
41 Szczecinecko-pyrzycki -0,04 34 -0,80 60 -0,41 43 0,17 26 -0,74 51 0,41 16 -0,57 49 0,14 32 -0,249 41
42 Nowosądecki -0,97 57 -0,48 34 -0,08 22 -0,78 51 0,03 29 0,31 18 0,37 18 0,38 25 -0,252 42
43 Pilski -0,13 40 -0,65 47 -0,36 39 -0,41 32 -0,70 49 0,27 19 -0,64 55 0,81 11 -0,256 43
44 Przemyski -0,50 49 -0,69 52 -0,37 40 -0,55 40 -0,21 35 0,67 6 -0,65 56 1,28 1 -0,261 44
45 Ciechanowski 0,41 15 -0,63 45 -0,29 35 -0,66 47 -1,33 60 -0,35 45 -0,69 58 0,38 24 -0,262 45
46 Białostocki -1,64 59 -0,47 33 0,09 17 0,23 21 0,10 27 0,48 12 0,01 25 0,20 31 -0,272 46
47 Tarnobrzeski -0,38 46 -0,01 18 -0,52 49 -0,53 38 0,36 20 -0,32 43 -0,60 53 0,83 9 -0,283 47
48 Włocławski 0,17 27 -0,04 19 -0,39 41 -0,94 57 -0,12 33 -0,62 52 -0,27 30 -0,59 47 -0,303 48
49 Chojnicki -0,17 41 -0,72 54 -0,48 47 -0,65 45 -0,72 50 0,59 8 -0,53 46 0,51 18 -0,321 49
50 Radomski 0,08 29 -0,20 25 -0,61 54 -0,75 50 -0,51 46 -0,40 46 -0,44 36 0,39 22 -0,328 50
51 Świecki 0,31 24 -0,68 51 -1,00 60 -0,82 54 -0,21 34 0,55 10 -0,38 33 0,82 10 -0,331 51
52 Elbląski -0,28 43 -0,55 38 -0,67 55 0,22 22 -0,44 43 0,46 13 -0,52 45 -0,15 39 -0,345 52
53 Grudziądzki -0,05 35 -0,49 35 -0,80 57 -0,66 48 -0,63 48 0,14 31 -0,51 43 0,91 7 -0,363 53
54 Chełmsko-zamojski -0,47 48 -0,78 57 -0,43 45 -0,68 49 -0,91 53 -0,55 51 -0,46 38 1,02 5 -0,417 54
55 Sandomiersko-jędrzejowski -0,42 47 -0,63 46 -0,41 42 -1,23 60 -0,37 42 -0,33 44 -0,49 42 0,58 15 -0,436 55
56 Ełcki -1,47 58 -0,78 58 -0,26 32 0,20 23 -0,93 54 0,88 3 -0,46 39 0,07 35 -0,455 56
57 Ostrołęcki -0,32 45 -0,70 53 -0,52 50 -0,87 56 -1,30 59 -1,08 58 -0,48 41 0,37 26 -0,537 57
58 Łomżyński -0,84 56 -0,73 55 -0,58 52 -0,80 52 -1,21 58 -0,46 47 -0,47 40 0,75 12 -0,572 58
59 Bialski -0,80 54 -0,79 59 -0,95 59 -1,05 58 -1,11 57 -0,50 48 -0,57 48 1,02 4 -0,695 59
60 Suwalski -2,20 60 -0,74 56 -0,54 51 -0,50 37 -1,00 55 0,16 27 -0,37 32 0,27 30 -0,780 60

108 INVESTMENT ATTRACTIVENESS OF VOIVODSHIPS AND SUBREGIONS IN POLAND 2016
ISBN: 978-83-7615-132-8