investment and loan borrowings report held as at 31 august
TRANSCRIPT

3750th Council Meeting - 27 September 2021 Agenda Page 1 of 51
8.8. Investment and Loan Borrowings Report held as at 31 August 2021
AUTHOR: Asif Ali, Manager Financial Services
ENDORSED BY: Margaret Palmer, Director Corporate Services
ATTACHMENTS: 1. North Sydney Council Monthly Report August 2021 [8.8.1 - 20 pages]2. North Sydney Council Reporting Pack August 2021 [8.8.2 - 24 pages]
PURPOSE:
The report provides details of the performance of Council’s investment portfolio and borrowing limits for the period ending 31 August 2021.
EXECUTIVE SUMMARY:
Investment Portfolio:
The Investment portfolio (excluding cash balances) held as at 31 August 2021 had a market value of $89.0 million, with an annualised return of 1.33% for the year to date, 1.30% above the reportable BBSW Bank Bill Index of 0.03%.
Cash deposits at call total $44.7 million much of which is rates paid in advance. Steps were taken in August to invest and reduce the cash deposit at call balance before end of August 2021. Recommendations were sought from our investment advisors who advised to establish a new Cash Management Accelerator Account with the Macquarie Bank that will generate interest income of 0.40% p.a. for balances up to $10 million and 0.20% p.a. on every dollar above $10 million. Council staff lodged the account opening application documents with the Macquarie bank on 23 August 2021. It was expected that the new account setup will take about 2 to 3 business days but unfortunately, the new account setup with the bank has proven to be a lengthy and convoluted process as the bank took almost 4 weeks with the account being activated only on 21 September 2021. A Cash balance transfer to the Macquarie Cash Management Accelerator Account was completed by the Council staff on the same day bringing the cash deposit at call total to $23 million as at 21 September 2021.
The investment portfolio is managed to ensure liquidity to meet operational requirements and to fund outflows to major project. Cashflow being monitored and assessed on an on-going basis.
The actual returns for cash and investments for the year to date as at 31 August 2021 were $198,724 which was $15,391 more than the year-to-date budgeted estimate. The medium-longer term outlook for financial markets indicate that the RBA’s official cash rate will remain unchanged at its emergency level of 0.10% until its objectives of full employment and inflation are reached and that rate rises are not expected until at least 2024.
3750th Council Meeting - 27 September 2021 Agenda Page 2 of 51
Historically, returns on cash (i.e. "at call" accounts) and short-term investments have been quite strong. However, with the low official cash rate, market variability in monthly returns may mean the short to medium term investment returns could be flat or potentially slightly negative. The capacity for Council staff to invest in a manner that meets liquidity requirements whilst achieving the "enhanced" benchmark returns (as detailed in the Investment Policy) is increasingly limited. However, the best available returns are still actively sought when surplus funds are invested.
Borrowings:
Council entered into a fixed interest loan of $9.5 million with quarterly interest and principal payments on 31 July 2018. The principal outstanding as at 31 August 2021 is $7,037,040.24. Council has made provision for future borrowings of $31 million to assist in the funding to complete the redevelopment of North Sydney Olympic Pool.
FINANCIAL IMPLICATIONS:
Council’s total investment portfolio performance for the financial year to date is 1.30% above the benchmark (1.33% against 0.03%). The actual returns for cash and investments for the year to date as at 31 August 2021 were $198,724 which was $15,391 more than the year-to-date budgeted estimate.
The budgeted investment returns over the medium term needs to reflect the current low interest rate environment which is likely to continue over the next financial years.
Investment returns will continue to be monitored and reported to ensure the estimate is consistent with the actual returns.
RECOMMENDATION:1. THAT the report on Investments and Loan Borrowings held as at 31 August 2021 be received.

3750th Council Meeting - 27 September 2021 Agenda Page 3 of 51
LINK TO COMMUNITY STRATEGIC PLAN
The relationship with the Community Strategic Plan is as follows:
5. Our Civic Leadership5.1 Council leads the strategic direction of North Sydney
BACKGROUND
The Responsible Accounting Officer must provide Council with a monthly report detailing all funds:
a. Invested under Section 625 of the Local Government Act 1993. This report must include certification that the investments have been made in accordance with the Act and the Regulations made thereunder, the revised Investment Order issued by the Minister for Local Government and Council’s Financial Investment Policy.
b. Borrowed under Section 624 of the Local Government Act. This report must comply with the borrowings Order issued by the Minister for Local Government and Council’s Debt Management Policy.
CONSULTATION REQUIREMENTSCommunity engagement is not required.
DETAILInvestment PortfolioThe following table provides details of the performance of Council’s investment portfolio (excluding cash deposits) against the benchmark for the month of August 2021 and annualised for the year to date as at 31 August 2021 (including investments which have matured prior to 31 August 2021).
August 2021 Annualised YTD as at31 August 2021
Actual Return 0.11% 1.33%Benchmark 0.00% 0.03%Variance 0.11% 1.30%
The portfolio performance continues to be driven by the handful of the longer-dated deposits that were locked-in prior to the current interest rate cuts, as well as the FRNs locked in at attractive margins.
Asset Type Market Value as at31 August 2021
Portfolio Breakdown as at 31 August 2021
Term Deposits $68,000,000.00 50.86%Cash $44,700,089.97 33.43%Fixed Bonds $9,000,000.00 6.73%FRTD $6,000,000.00 4.49%Floating Rate Notes (FRN’s) $5,997,720.05 4.49%

3750th Council Meeting - 27 September 2021 Agenda Page 4 of 51
$133,697,810.02 100.00%
Council’s average duration of term deposits which comprise approximately half of the investment portfolio is approximately 601 days, thus reducing the exposure to declining interest rates experienced with investment renewals.
Investment returns continue to exceed the indicative benchmark (BBSW Bank Bill Index). All funds have been invested in accordance with the Act and the Regulations made thereunder and with Council’s Financial Investment Policy. Further, Council’s investment portfolio complies with the revised Investment Order issued by the Minister for Local Government, which places restrictions on the type of investments permitted. These restrictions have placed greater emphasis on obtaining competitive investment options and the need for sound investment advice from Council’s independent advisor.
Council continues to seek independent advice for all investments and is actively managing the portfolio to ensure that returns are maximised taking into account diversification and risk. A complete analysis of the performance is covered in the Monthly Investment Report prepared by Council’s Investment advisor. (refer attachment 1)
The actual investment returns for the year to date as at 31 August 2021 have been reviewed and are $15,391 more than the year-to-date budgeted estimate.
Summary of Returns from Investments (includes Fair Value adjustments):
Year Original Annual Budget
Revised Annual Budget
YTD Budget (August)
YTD/Annual Actual (August)
YTD/Annual Actual FV
adjustments (August)
YTD Budget to
Actual Variance (August)
2021/22 $1,100,000 $1,100,000 $183,333 $195,663 $3,061 $15,3912020/21 $1,350,000 $1,350,000 $1,222,664 $93,735 -$33,601
TDs 51%
Cash 33%
Fixed Bonds 7%
FRTD 4%
FRN’s 4%
TDs
Cash
Fixed Bonds
FRTD
FRN’s
Portfolio Breakdown as at 31 August 2021
3750th Council Meeting - 27 September 2021 Agenda Page 5 of 51
Year Original Annual Budget
Revised Annual Budget
YTD Budget (August)
YTD/Annual Actual (August)
YTD/Annual Actual FV
adjustments (August)
YTD Budget to
Actual Variance (August)
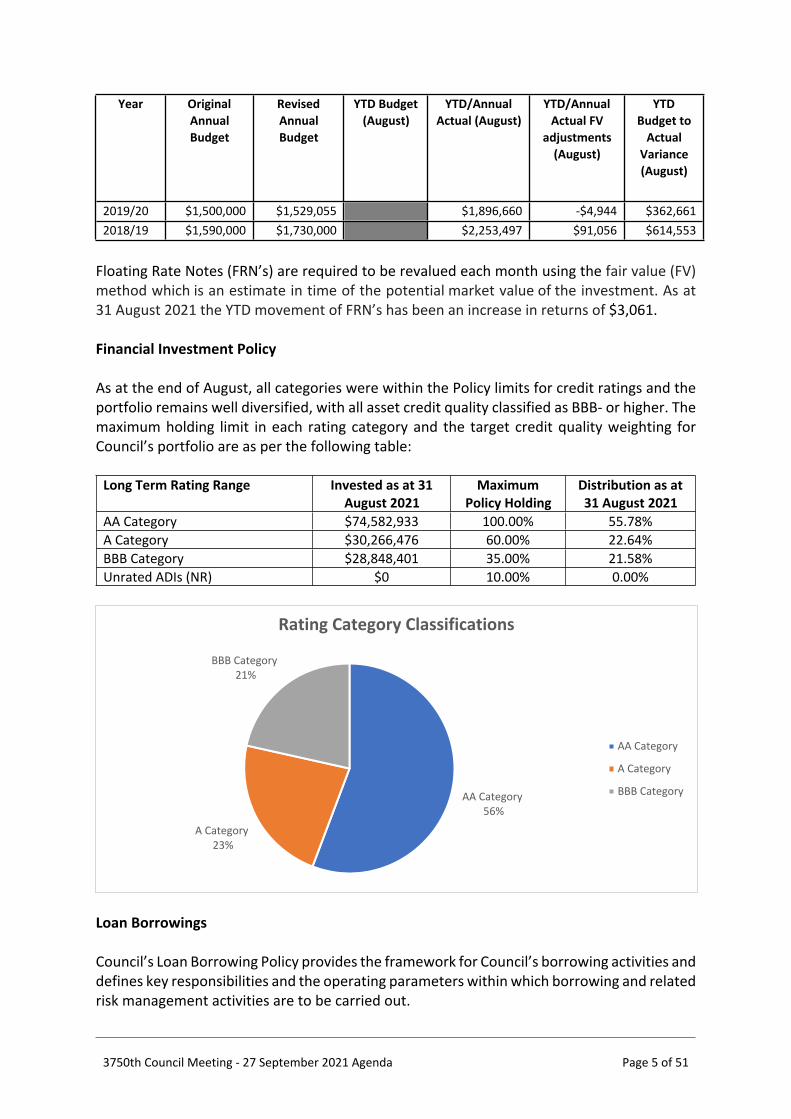
2019/20 $1,500,000 $1,529,055 $1,896,660 -$4,944 $362,6612018/19 $1,590,000 $1,730,000 $2,253,497 $91,056 $614,553
Floating Rate Notes (FRN’s) are required to be revalued each month using the fair value (FV) method which is an estimate in time of the potential market value of the investment. As at 31 August 2021 the YTD movement of FRN’s has been an increase in returns of $3,061. Financial Investment Policy
As at the end of August, all categories were within the Policy limits for credit ratings and the portfolio remains well diversified, with all asset credit quality classified as BBB- or higher. The maximum holding limit in each rating category and the target credit quality weighting for Council’s portfolio are as per the following table:
Long Term Rating Range Invested as at 31 August 2021
Maximum Policy Holding
Distribution as at 31 August 2021
AA Category $74,582,933 100.00% 55.78%A Category $30,266,476 60.00% 22.64%BBB Category $28,848,401 35.00% 21.58%Unrated ADIs (NR) $0 10.00% 0.00%
Loan Borrowings
Council’s Loan Borrowing Policy provides the framework for Council’s borrowing activities and defines key responsibilities and the operating parameters within which borrowing and related risk management activities are to be carried out.
AA Category 56%
A Category 23%
BBB Category 21%
AA Category
A Category
BBB Category
Rating Category Classifications
3750th Council Meeting - 27 September 2021 Agenda Page 6 of 51
The Policy’s objective is to control Council’s exposure to movements in interest rates through the application of fixed, floating or a combination of both in order to maintain its risk averse strategy.
Loan borrowing will be undertaken in line with the following principles:
a) That the capital cost of infrastructure be recognised over the period during which the benefits will be enjoyed.
b) That loan funds are a resource to fund the replacement and upgrading of existing infrastructure and fund the creation of new infrastructure.
c) That loan funds will be limited to: acquisition or enhancement of income producing assets. construction and/or upgrading of buildings; and infrastructure assets that have a life expectancy of greater than 10 years.
The current Debt Facility is as follows:
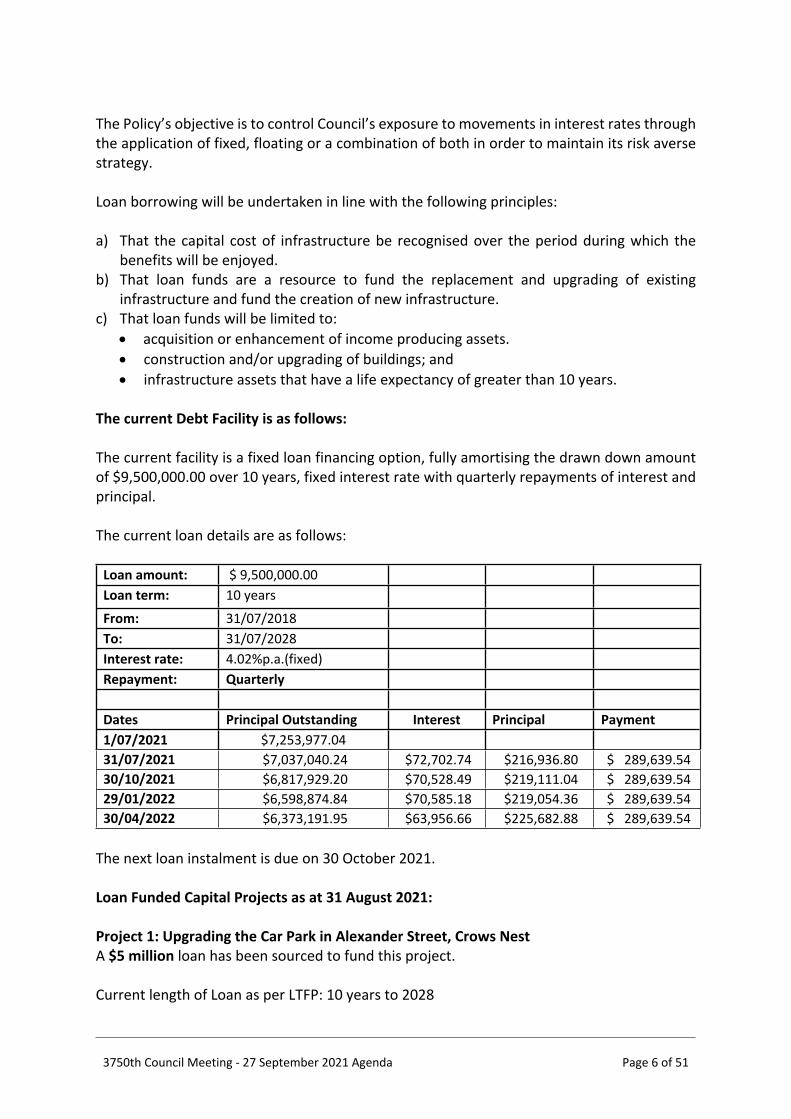
The current facility is a fixed loan financing option, fully amortising the drawn down amount of $9,500,000.00 over 10 years, fixed interest rate with quarterly repayments of interest and principal.
The current loan details are as follows:
Loan amount: $ 9,500,000.00 Loan term: 10 years
From: 31/07/2018To: 31/07/2028Interest rate: 4.02%p.a.(fixed)Repayment: Quarterly
Dates Principal Outstanding Interest Principal Payment1/07/2021 $7,253,977.0431/07/2021 $7,037,040.24 $72,702.74 $216,936.80 $ 289,639.54 30/10/2021 $6,817,929.20 $70,528.49 $219,111.04 $ 289,639.54 29/01/2022 $6,598,874.84 $70,585.18 $219,054.36 $ 289,639.54 30/04/2022 $6,373,191.95 $63,956.66 $225,682.88 $ 289,639.54
The next loan instalment is due on 30 October 2021.
Loan Funded Capital Projects as at 31 August 2021:
Project 1: Upgrading the Car Park in Alexander Street, Crows NestA $5 million loan has been sourced to fund this project.
Current length of Loan as per LTFP: 10 years to 2028

3750th Council Meeting - 27 September 2021 Agenda Page 7 of 51
Project 2: Upgrading of On-Street Parking Management SystemA $4.5 million loan has been sourced to fund this project.
Current length of Loan as per LTFP: 10 years to 2028
Future Borrowings
Council has made provision for future borrowings of $31 million to assist in the funding to complete the redevelopment of North Sydney Olympic Pool. As per Council’s Resolution of the 28 September 2020 meeting, prior to accessing these funds, comparative loan rates will be obtained from TCorp and the major banks to ensure market competitiveness. This process and timeframe will be presented to the next MANEX meeting, subsequent to this in line with an approved timetable, funds will be negotiated. Following negotiations, a report will be presented to Council before finalising the loan option for financing the NSOP complex redevelopment.
Imperium Markets Pty Ltd ABN: 87 616 579 527 Authorised Representative of Libertas Financial Planning Pty Ltd AFSL 429 718 Phone: +61 2 9053 2987 Email: [email protected] Level 9 Suite 02, 3 Spring Street, Sydney NSW 2000
Monthly Investment Report
August 2021
Attachment 8.8.1 North Sydney Council Monthly Report August 2021
3750th Council Meeting - 27 September 2021 Agenda Page 8 of 51
Monthly Investment Report: August 2021 Page 2
Impact of COVID-19 to Council’s Portfolio
COVID-19 has adversely impacted financial markets, which in turn, has also affected Council’s
investment portfolio. We provide a quick summary in this section.
With regards to financial markets, shares (equities) experienced a significant correction in March 2020
but have continued to surpass their all-time highs due to the unprecedented global fiscal and
monetary policy support. The RBA cut rates to record lows on 3rd November 2020 to 0.10%,
consistent with most global central banks resetting their official rates back to emergency levels.
Despite the Delta variant causing a surge in global infections and imposing further lockdowns
(including Australia), equity markets have continued their rally over the course of 2021, focusing on
the accelerated vaccine rollout and gradual easing of restrictions. Longer-term bond yields have fallen
sharply since the start of the calendar year, with the market pushing back on expectations of global
central banks tightening in the immediate future.
With regards to the medium-longer term outlook for financial markets, of importance is the RBA’s
outlook and expectations for the Australian economy. They would like to see the following three
economic indicators improve before they even consider increasing interest rates:
1. The unemployment rate to drop to around 4.0% (currently sitting at 4.6% and masked by a
drop in the participation rate), noting it has not been below 4.5% since 2008;
2. “Until actual (underlying) inflation is sustainably within the 2-3% target range” (it has not been
within their target band for the past 5 years); and
3. Wage growth to surpass +3% (it has not been above this level for the past 8 years).
The RBA’s base case (forecast) suggests conditions for a rate rise “will not be met until 2024”.
The largest impact to Council’s investment portfolio is with regards to its largest exposure being assets
held in bank term deposits (fixed and floating), which accounts for around ~55% of Council’s total
investment. The biggest risk that Council faces over the medium-longer term in this environment is
not the potential loss of capital (given all the banks are well capitalised and regulated by APRA), but
the rapid loss of interest income as interest rates have plummeted.
Council’s term deposit portfolio was yielding 1.38% p.a. at month-end, with a weighted average
duration of around 601 days or ~1½ years. This average duration will provide some income
protection against the low interest rate environment over the next 12 months. As existing deposits
mature however, they will inevitably be reinvested at much lower prevailing rates.
Given official rates have fallen to record lows, Council is likely to see a rapid decline in interest
income over future financial years. Its budgeted income over the medium-longer term needs to be
revised to reflect the low interest rate environment. Returns between 0.40%-0.80% p.a. may
potentially be the “norm” over the next few financial years, especially if rolling the majority of
surplus funds for terms less than 2-3 years. Yields may in fact be lower if electing to invest for terms
under 12 months.
Attachment 8.8.1 North Sydney Council Monthly Report August 2021
3750th Council Meeting - 27 September 2021 Agenda Page 9 of 51

Monthly Investment Report: August 2021 Page 3
Council’s Portfolio & Compliance Asset Allocation
As at the end of August 2021, the portfolio was mainly directed to fixed and floating rate term deposits
(55.35%). The remaining portfolio is directed to FRNs (4.49%), fixed bonds (6.73%) and overnight cash
accounts (33.43%).
With the RBA cutting interest rates in November 2020 to 0.10%, the priority should be to lock in any
remaining attractive medium-longer dated fixed deposits or fixed bonds that may still be available
to address reinvestment risk as margins continue to compress.
Term to Maturity
Overall, the portfolio remains lightly diversified from a maturity perspective. Around 28% of assets is
directed to medium-term assets (2-5 years), which is sensible in this low rate environment. There is
still high capacity to invest in the medium-term horizon, with approximately $29m at month-end.
The 3-12 month allocation is marginally below the minimum requirement of 20%, but this is more than
offset by the high balance held in the 0-3 month horizon, indicating very high liquidity.
Where liquidity permits, we recommend new surplus funds be directed to 2-5 year horizons given this
is where the most attractive value can be found. We suggest this be allocated to any remaining
attractive fixed term deposits or fixed bonds to address reinvestment risk.
Attachment 8.8.1 North Sydney Council Monthly Report August 2021
3750th Council Meeting - 27 September 2021 Agenda Page 10 of 51
Monthly Investment Report: August 2021 Page 4
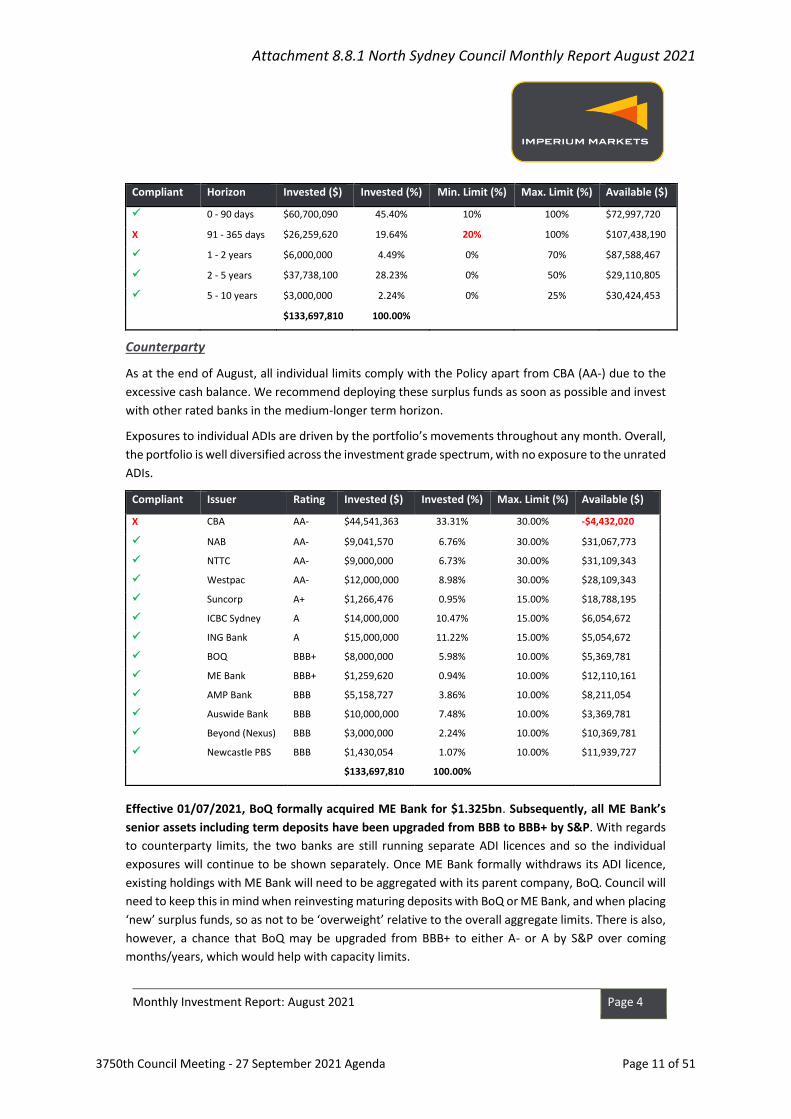
Compliant Horizon Invested ($) Invested (%) Min. Limit (%) Max. Limit (%) Available ($)
✓ 0 - 90 days $60,700,090 45.40% 10% 100% $72,997,720
X 91 - 365 days $26,259,620 19.64% 20% 100% $107,438,190
✓ 1 - 2 years $6,000,000 4.49% 0% 70% $87,588,467
✓ 2 - 5 years $37,738,100 28.23% 0% 50% $29,110,805
✓ 5 - 10 years $3,000,000 2.24% 0% 25% $30,424,453
$133,697,810 100.00%
Counterparty
As at the end of August, all individual limits comply with the Policy apart from CBA (AA-) due to the
excessive cash balance. We recommend deploying these surplus funds as soon as possible and invest
with other rated banks in the medium-longer term horizon.
Exposures to individual ADIs are driven by the portfolio’s movements throughout any month. Overall,
the portfolio is well diversified across the investment grade spectrum, with no exposure to the unrated
ADIs.
Compliant Issuer Rating Invested ($) Invested (%) Max. Limit (%) Available ($)
X CBA AA- $44,541,363 33.31% 30.00% -$4,432,020
✓ NAB AA- $9,041,570 6.76% 30.00% $31,067,773
✓ NTTC AA- $9,000,000 6.73% 30.00% $31,109,343
✓ Westpac AA- $12,000,000 8.98% 30.00% $28,109,343
✓ Suncorp A+ $1,266,476 0.95% 15.00% $18,788,195
✓ ICBC Sydney A $14,000,000 10.47% 15.00% $6,054,672
✓ ING Bank A $15,000,000 11.22% 15.00% $5,054,672
✓ BOQ BBB+ $8,000,000 5.98% 10.00% $5,369,781
✓ ME Bank BBB+ $1,259,620 0.94% 10.00% $12,110,161
✓ AMP Bank BBB $5,158,727 3.86% 10.00% $8,211,054
✓ Auswide Bank BBB $10,000,000 7.48% 10.00% $3,369,781
✓ Beyond (Nexus) BBB $3,000,000 2.24% 10.00% $10,369,781
✓ Newcastle PBS BBB $1,430,054 1.07% 10.00% $11,939,727
$133,697,810 100.00%
Effective 01/07/2021, BoQ formally acquired ME Bank for $1.325bn. Subsequently, all ME Bank’s
senior assets including term deposits have been upgraded from BBB to BBB+ by S&P. With regards
to counterparty limits, the two banks are still running separate ADI licences and so the individual
exposures will continue to be shown separately. Once ME Bank formally withdraws its ADI licence,
existing holdings with ME Bank will need to be aggregated with its parent company, BoQ. Council will
need to keep this in mind when reinvesting maturing deposits with BoQ or ME Bank, and when placing
‘new’ surplus funds, so as not to be ‘overweight’ relative to the overall aggregate limits. There is also,
however, a chance that BoQ may be upgraded from BBB+ to either A- or A by S&P over coming
months/years, which would help with capacity limits.
Attachment 8.8.1 North Sydney Council Monthly Report August 2021
3750th Council Meeting - 27 September 2021 Agenda Page 11 of 51

Monthly Investment Report: August 2021 Page 5
We remain supportive of the regional and unrated ADI sector (and have been even throughout the
GFC period). They continue to remain solid, incorporate strong balance sheets, while exhibiting high
levels of capital – typically, much higher compared to the higher rated ADIs. Some unrated ADIs have
up to 25-40% more capital than the domestic major banks, and well above the Basel III requirements.
APRA’s Chairman affirmed that the banks had satisfactorily moved towards an ‘unquestionably strong’
capital position and that bank’s stress testing contingency plans were now far better positioned that
was previously the case years ago. RBA Governor Lowe has commented that they have not seen any
signs of stress in the financial system and that unlike during the GFC, the banks now have cash, are
well capitalised and are acting as “shock absorbers” in the current crisis.
Overall, the lower rated ADIs (BBB and unrated) are generally now in a better financial position then
they have been historically (see the Capital Ratio figure below). We believe that deposit investments
with the lower rated ADIs should be continued going forward, particularly when they offer ‘above
market’ specials. Not only would it diversify the investment portfolio and reduce credit risk, it would
also improve the portfolio’s overall returns.
In the current environment of high regulation and scrutiny, all domestic ADIs continue to carry high
levels of capital, particularly amongst the lower (“BBB”) and unrated ADIs. There is minimal (if any)
probability of any ADI defaulting on their deposits going forward – this was stress tested during the
GFC. APRA’s mandate is to “protect depositors” and provide “financial stability”.
The biggest single risk that depositors face in the current low interest rate environment is not capital
or credit risk, but reinvestment risk. Interest rates are now at their effective lower bound of 0.10%.
Attachment 8.8.1 North Sydney Council Monthly Report August 2021
3750th Council Meeting - 27 September 2021 Agenda Page 12 of 51

Monthly Investment Report: August 2021 Page 6
Credit Quality
The portfolio remains well diversified from a credit ratings perspective, with all assets classified as
investment grade (rated BBB- or higher).
From a ratings perspective, the BBB (and unrated) banks now generally dominate the number of ADIs
issuing deposits within the investment grade space.
However, given most banks are fully liquid during the current pandemic, most of the “BBB” rated and
Unrated ADIs are currently not seeking wholesale funding. As such, in the interim, we could see a shift
towards a larger proportion of assets being directed towards the higher rated ADIs given the lack of
appetite amongst the lower rated ADIs.
As at the end of August 2021, all categories were within the Policy limits:
Compliant Credit Rating Invested ($) Invested (%) Max. Limit (%) Available ($)
✓ AA Category $74,582,933 55.78% 100% $59,114,877
✓ A Category $30,266,476 22.64% 60% $49,952,210
✓ BBB Category $28,848,401 21.58% 35% $17,945,833
✓ Unrated ADIs $0 0.00% 10% $13,369,781
$133,697,810 100.00%
Attachment 8.8.1 North Sydney Council Monthly Report August 2021
3750th Council Meeting - 27 September 2021 Agenda Page 13 of 51
Monthly Investment Report: August 2021 Page 7
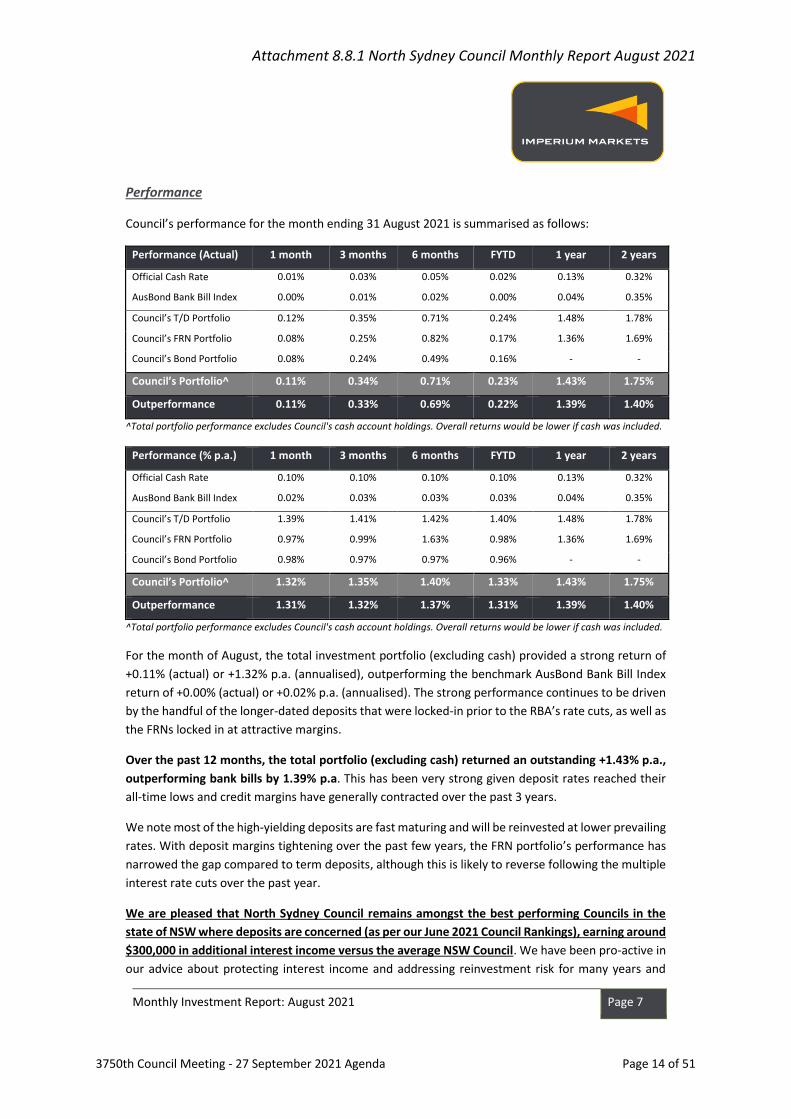
Performance
Council’s performance for the month ending 31 August 2021 is summarised as follows:
Performance (Actual) 1 month 3 months 6 months FYTD 1 year 2 years
Official Cash Rate 0.01% 0.03% 0.05% 0.02% 0.13% 0.32%
AusBond Bank Bill Index 0.00% 0.01% 0.02% 0.00% 0.04% 0.35%
Council’s T/D Portfolio 0.12% 0.35% 0.71% 0.24% 1.48% 1.78%
Council’s FRN Portfolio 0.08% 0.25% 0.82% 0.17% 1.36% 1.69%
Council’s Bond Portfolio 0.08% 0.24% 0.49% 0.16% - -
Council’s Portfolio^ 0.11% 0.34% 0.71% 0.23% 1.43% 1.75%
Outperformance 0.11% 0.33% 0.69% 0.22% 1.39% 1.40%
^Total portfolio performance excludes Council's cash account holdings. Overall returns would be lower if cash was included.
Performance (% p.a.) 1 month 3 months 6 months FYTD 1 year 2 years
Official Cash Rate 0.10% 0.10% 0.10% 0.10% 0.13% 0.32%
AusBond Bank Bill Index 0.02% 0.03% 0.03% 0.03% 0.04% 0.35%
Council’s T/D Portfolio 1.39% 1.41% 1.42% 1.40% 1.48% 1.78%
Council’s FRN Portfolio 0.97% 0.99% 1.63% 0.98% 1.36% 1.69%
Council’s Bond Portfolio 0.98% 0.97% 0.97% 0.96% - -
Council’s Portfolio^ 1.32% 1.35% 1.40% 1.33% 1.43% 1.75%
Outperformance 1.31% 1.32% 1.37% 1.31% 1.39% 1.40%
^Total portfolio performance excludes Council's cash account holdings. Overall returns would be lower if cash was included.
For the month of August, the total investment portfolio (excluding cash) provided a strong return of
+0.11% (actual) or +1.32% p.a. (annualised), outperforming the benchmark AusBond Bank Bill Index
return of +0.00% (actual) or +0.02% p.a. (annualised). The strong performance continues to be driven
by the handful of the longer-dated deposits that were locked-in prior to the RBA’s rate cuts, as well as
the FRNs locked in at attractive margins.
Over the past 12 months, the total portfolio (excluding cash) returned an outstanding +1.43% p.a.,
outperforming bank bills by 1.39% p.a. This has been very strong given deposit rates reached their
all-time lows and credit margins have generally contracted over the past 3 years.
We note most of the high-yielding deposits are fast maturing and will be reinvested at lower prevailing
rates. With deposit margins tightening over the past few years, the FRN portfolio’s performance has
narrowed the gap compared to term deposits, although this is likely to reverse following the multiple
interest rate cuts over the past year.
We are pleased that North Sydney Council remains amongst the best performing Councils in the
state of NSW where deposits are concerned (as per our June 2021 Council Rankings), earning around
$300,000 in additional interest income versus the average NSW Council. We have been pro-active in
our advice about protecting interest income and addressing reinvestment risk for many years and
Attachment 8.8.1 North Sydney Council Monthly Report August 2021
3750th Council Meeting - 27 September 2021 Agenda Page 14 of 51
Monthly Investment Report: August 2021 Page 8
encouraged to maintain a long duration position. This is now reflected by the high performance of the
investment portfolio. Of the 29 individual deposits North Sydney Council held, 14 are still yielding
higher than 1.50% p.a. That is, around half of the outstanding deposits held are currently earning more
than the highest rate available in the market from any rated bank out to 5 years.
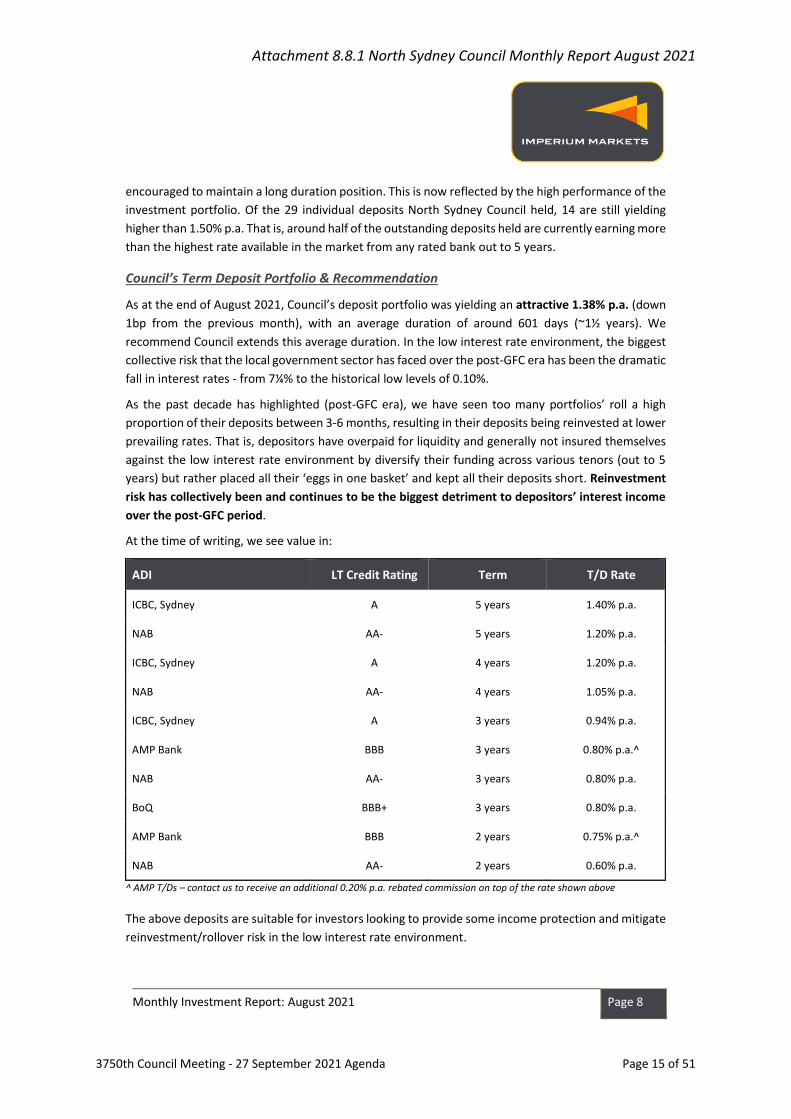
Council’s Term Deposit Portfolio & Recommendation
As at the end of August 2021, Council’s deposit portfolio was yielding an attractive 1.38% p.a. (down
1bp from the previous month), with an average duration of around 601 days (~1½ years). We
recommend Council extends this average duration. In the low interest rate environment, the biggest
collective risk that the local government sector has faced over the post-GFC era has been the dramatic
fall in interest rates - from 7¼% to the historical low levels of 0.10%.
As the past decade has highlighted (post-GFC era), we have seen too many portfolios’ roll a high
proportion of their deposits between 3-6 months, resulting in their deposits being reinvested at lower
prevailing rates. That is, depositors have overpaid for liquidity and generally not insured themselves
against the low interest rate environment by diversify their funding across various tenors (out to 5
years) but rather placed all their ‘eggs in one basket’ and kept all their deposits short. Reinvestment
risk has collectively been and continues to be the biggest detriment to depositors’ interest income
over the post-GFC period.
At the time of writing, we see value in:
ADI LT Credit Rating Term T/D Rate
ICBC, Sydney A 5 years 1.40% p.a.
NAB AA- 5 years 1.20% p.a.
ICBC, Sydney A 4 years 1.20% p.a.
NAB AA- 4 years 1.05% p.a.
ICBC, Sydney A 3 years 0.94% p.a.
AMP Bank BBB 3 years 0.80% p.a.^
NAB AA- 3 years 0.80% p.a.
BoQ BBB+ 3 years 0.80% p.a.
AMP Bank BBB 2 years 0.75% p.a.^
NAB AA- 2 years 0.60% p.a.
^ AMP T/Ds – contact us to receive an additional 0.20% p.a. rebated commission on top of the rate shown above
The above deposits are suitable for investors looking to provide some income protection and mitigate
reinvestment/rollover risk in the low interest rate environment.
Attachment 8.8.1 North Sydney Council Monthly Report August 2021
3750th Council Meeting - 27 September 2021 Agenda Page 15 of 51
Monthly Investment Report: August 2021 Page 9
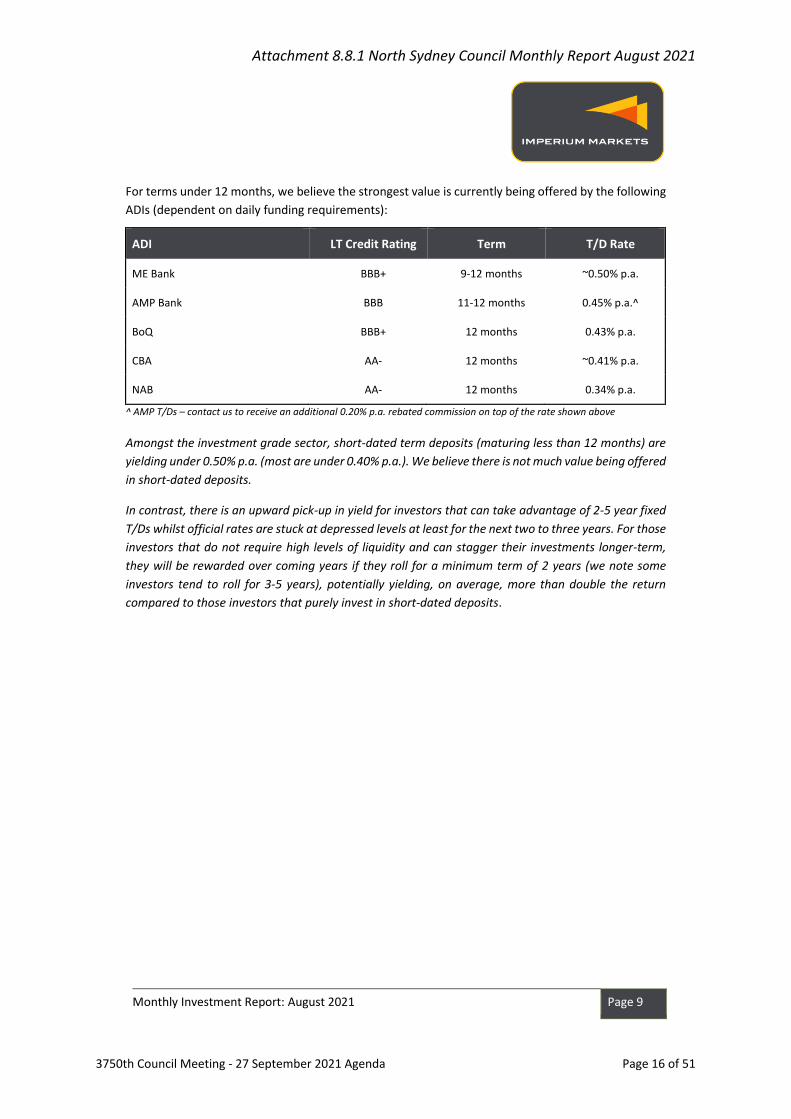
For terms under 12 months, we believe the strongest value is currently being offered by the following
ADIs (dependent on daily funding requirements):
ADI LT Credit Rating Term T/D Rate
ME Bank BBB+ 9-12 months ~0.50% p.a.
AMP Bank BBB 11-12 months 0.45% p.a.^
BoQ BBB+ 12 months 0.43% p.a.
CBA AA- 12 months ~0.41% p.a.
NAB AA- 12 months 0.34% p.a.
^ AMP T/Ds – contact us to receive an additional 0.20% p.a. rebated commission on top of the rate shown above
Amongst the investment grade sector, short-dated term deposits (maturing less than 12 months) are
yielding under 0.50% p.a. (most are under 0.40% p.a.). We believe there is not much value being offered
in short-dated deposits.
In contrast, there is an upward pick-up in yield for investors that can take advantage of 2-5 year fixed
T/Ds whilst official rates are stuck at depressed levels at least for the next two to three years. For those
investors that do not require high levels of liquidity and can stagger their investments longer-term,
they will be rewarded over coming years if they roll for a minimum term of 2 years (we note some
investors tend to roll for 3-5 years), potentially yielding, on average, more than double the return
compared to those investors that purely invest in short-dated deposits.
Attachment 8.8.1 North Sydney Council Monthly Report August 2021
3750th Council Meeting - 27 September 2021 Agenda Page 16 of 51
Monthly Investment Report: August 2021 Page 10
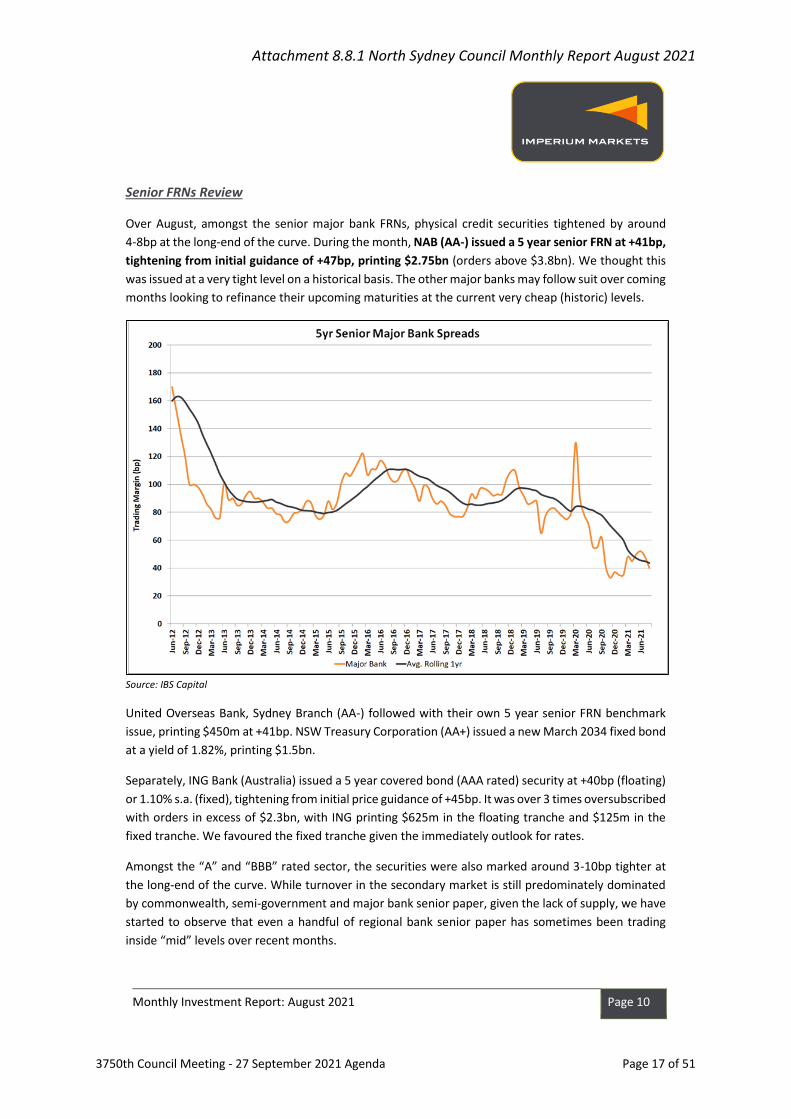
Senior FRNs Review
Over August, amongst the senior major bank FRNs, physical credit securities tightened by around
4-8bp at the long-end of the curve. During the month, NAB (AA-) issued a 5 year senior FRN at +41bp,
tightening from initial guidance of +47bp, printing $2.75bn (orders above $3.8bn). We thought this
was issued at a very tight level on a historical basis. The other major banks may follow suit over coming
months looking to refinance their upcoming maturities at the current very cheap (historic) levels.
Source: IBS Capital
United Overseas Bank, Sydney Branch (AA-) followed with their own 5 year senior FRN benchmark
issue, printing $450m at +41bp. NSW Treasury Corporation (AA+) issued a new March 2034 fixed bond
at a yield of 1.82%, printing $1.5bn.
Separately, ING Bank (Australia) issued a 5 year covered bond (AAA rated) security at +40bp (floating)
or 1.10% s.a. (fixed), tightening from initial price guidance of +45bp. It was over 3 times oversubscribed
with orders in excess of $2.3bn, with ING printing $625m in the floating tranche and $125m in the
fixed tranche. We favoured the fixed tranche given the immediately outlook for rates.
Amongst the “A” and “BBB” rated sector, the securities were also marked around 3-10bp tighter at
the long-end of the curve. While turnover in the secondary market is still predominately dominated
by commonwealth, semi-government and major bank senior paper, given the lack of supply, we have
started to observe that even a handful of regional bank senior paper has sometimes been trading
inside “mid” levels over recent months.
Attachment 8.8.1 North Sydney Council Monthly Report August 2021
3750th Council Meeting - 27 September 2021 Agenda Page 17 of 51
Monthly Investment Report: August 2021 Page 11
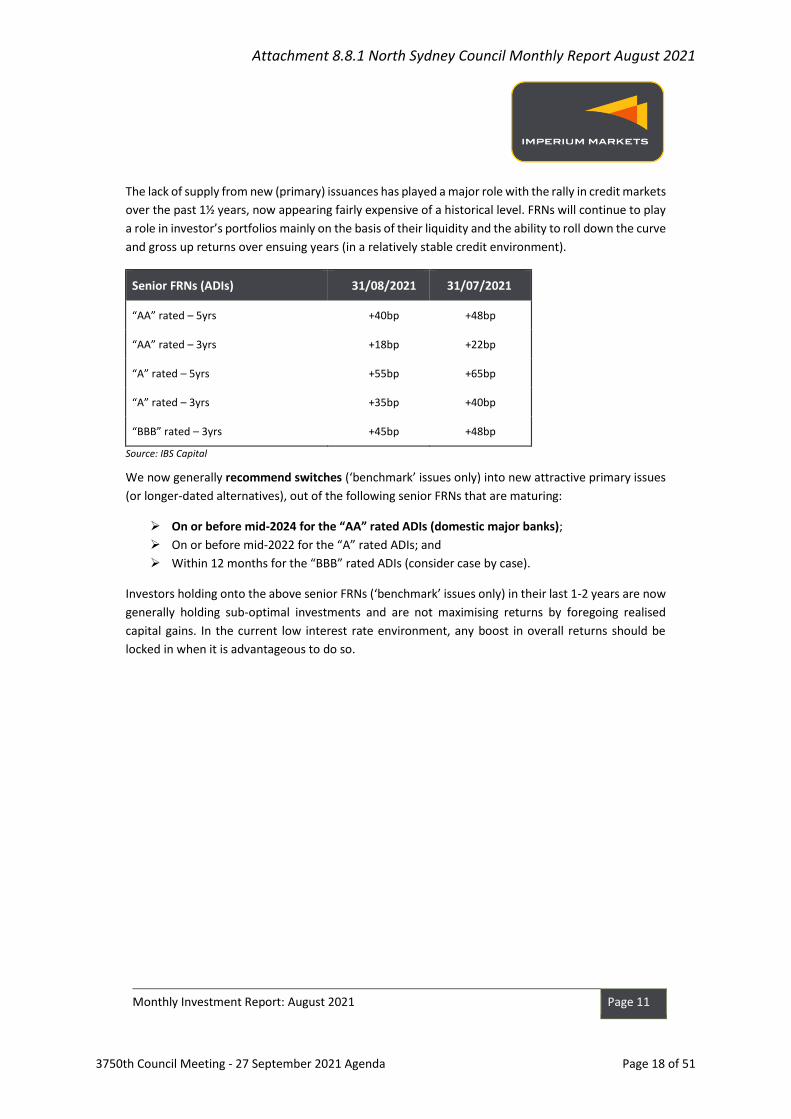
The lack of supply from new (primary) issuances has played a major role with the rally in credit markets
over the past 1½ years, now appearing fairly expensive of a historical level. FRNs will continue to play
a role in investor’s portfolios mainly on the basis of their liquidity and the ability to roll down the curve
and gross up returns over ensuing years (in a relatively stable credit environment).
Senior FRNs (ADIs) 31/08/2021 31/07/2021
“AA” rated – 5yrs +40bp +48bp
“AA” rated – 3yrs +18bp +22bp
“A” rated – 5yrs +55bp +65bp
“A” rated – 3yrs +35bp +40bp
“BBB” rated – 3yrs +45bp +48bp
Source: IBS Capital
We now generally recommend switches (‘benchmark’ issues only) into new attractive primary issues
(or longer-dated alternatives), out of the following senior FRNs that are maturing:
➢ On or before mid-2024 for the “AA” rated ADIs (domestic major banks);
➢ On or before mid-2022 for the “A” rated ADIs; and
➢ Within 12 months for the “BBB” rated ADIs (consider case by case).
Investors holding onto the above senior FRNs (‘benchmark’ issues only) in their last 1-2 years are now
generally holding sub-optimal investments and are not maximising returns by foregoing realised
capital gains. In the current low interest rate environment, any boost in overall returns should be
locked in when it is advantageous to do so.
Attachment 8.8.1 North Sydney Council Monthly Report August 2021
3750th Council Meeting - 27 September 2021 Agenda Page 18 of 51
Monthly Investment Report: August 2021 Page 12
Council’s Senior FRNs Sale/Switch Recommendations
Over the next few months, we recommend Council sells out of the following FRNs given yielding a low
rate of return, if held to maturity (less than 0.3% p.a.):
• $1.25m ME Bank (BBB) FRN maturing 18/07/2022 (ISIN: AU3FN0048948) – trading margin at
+11.0bp or capital price of $100.75 (capital gain ~$9,600);
• $2.00m NAB (AA-) FRN maturing 19/06/2024 (ISIN: AU3FN0048724) – trading margin at
+18.0bp or capital price of $102.07 (capital gain ~$41,500).
The above sales would result in capital gains totalling $51,100. Council can easily switch into a higher
yielding complying asset which is returning much higher than 0.30% p.a., namely 2-5 year fixed term
deposits or fixed bonds.
Senior Bonds
During October 2020, Council placed two parcels of $3m (totalling $6m) with the Northern Territory
Treasury Corporation (NTTC), locking in yields of 0.90% p.a. and 1.00% p.a. for a 4 and 5 year term
respectively. In August 2021, it placed another $3m parcel with NTTC (AA-), locking in a yield of 1.50%
p.a. for a 5 year term.
Council received the full rebated commission of 0.25% on the total face value of investments (i.e. $9m
x 0.25% = $22,500) as it was introduced by Imperium Markets. We believe this was prudent given the
low rate environment.
The NTTC bonds are a ‘retail’ offering and not ‘wholesale’ issuances. Given the lack of liquidity and
high penalty costs if they were to be sold/redeemed prior to the maturity date, they are considered
to be a hold-to-maturity investment and will be marked at par value ($100.00) throughout the term
of investment.
Attachment 8.8.1 North Sydney Council Monthly Report August 2021
3750th Council Meeting - 27 September 2021 Agenda Page 19 of 51

Monthly Investment Report: August 2021 Page 13
Senior Bonds - Northern Territory Treasury Corporation (NTTC)
We are aware of the following senior retail bond offering from Northern Territory Treasury
Corporation (NTTC) effective 30th August 2021:
Maturity Date Rate % p.a.^ Interest Paid
15/12/2022 0.40% Annually
15/12/2023 0.60% Annually
15/12/2024 0.90% Semi-Annually
15/12/2025 1.10% Semi-Annually
15/12/2026 1.40% Semi-Annually
^^The rates offered in the above table can be reviewed and changed at any time from Treasury. The rate for broker sponsored
applications will be dropped by 0.20% p.a. effective 1 October 2020.
Any investor interested in this product should avoid placing through the broker channel and contact
Imperium Markets to receive the full commission of 0.25% (plus GST) on the face value of the
investment, in the form of an additional rebate. If placed through the brokers, they are likely to keep
the 0.25% commission (on the face value of the investment).
Overview Description
Issuer Northern Territory Government
Credit Rating Aa3 (Moody's), which is AA- equivalent (S&P)
Type Fixed senior (retail) bonds
Program Territory Bonds Issue 111
Date for applications 01/07/2021 – 30/11/2021
Liquidity Weekly redemptions available, subject to the prevailing market rate and administration costs^^
^^ Note given this is a retail bond offering (min. parcel size of $5,000), for wholesale investors, we would not consider this to
be a liquid investment (the largest redemptions to date have only been $200-$300k).
The product should be viewed as a hold-to-maturity product, noting there are significant penalty costs
including admin fees, the prevailing market interest rate, and factors in any associate commissions
that were previously paid. Given the longer-term outlook for official interest rates, any investor with
capacity should consider placing a small parcel (up to $5m) in the 15/12/2024, 15/12/2025 and
15/12/2026 maturities through Imperium Markets to receive an effectively higher rate, once
factoring in the rebated commission.
Attachment 8.8.1 North Sydney Council Monthly Report August 2021
3750th Council Meeting - 27 September 2021 Agenda Page 20 of 51

Monthly Investment Report: August 2021 Page 14
Economic Commentary International Market
US Fed Chair Powell distanced the subject of Fed rate hikes from decisions about potentially tapering
QE bond purchases later this year. Positive risk sentiment continued in financial markets as Powell
indicated there would be stricter tests for any potential rate hikes, while remaining dovish on inflation.
Global equity markets subsequently rallied again, setting new highs across various regions, with the
focus primarily on vaccination targets and the easing of restrictions in those jurisdictions that still
apply various forms of lockdowns. Across the US, the S&P 500 Index gained +2.90%, while the
tech-heavy NASDAQ Index surged another +4.00%. Equities also gained across Europe’s main indices,
with gains led by Germany’s DAX (+1.87%), UK’s FTSE (+1.24%) and France’s CAC (+1.02%).
The FDA granted full approval to the Covid-19 vaccine made by Pfizer Inc. and BioNTech which
should increase confidence on the vaccine’s safety and effectiveness.
US Federal Chair Powell hinted that the central bank will likely begin to withdraw some of its
easy-money policies before year-end (QE bond purchases of US$120bn per month) but unlikely to
move on official rates anytime soon.
Momentum appears to be building again for the US fiscal packages which includes the US$1 trillion
infrastructure package and the US$3.5 trillion framework by the end of September.
US core inflation moderated in July at +0.3% m/m vs. +0.4% expected (the annual rate was +4.3%
y/y). Much of the re-opening pressure has now abated with certain measures of inflation back to their
pre-pandemic levels.
The US unemployment rate fell to 4.4% in July with 943,000 jobs added during the month.
Canada’s Q2 GDP figures came in very much weaker than expected at -0.25% q/q or -1.1% on an
annualised basis.
Eurozone’s GDP came in better than expected at +2%, driven by the strength in the Euro-periphery,
with Portugal at +4.9%, Spain +2.8% and Italy +2.7%, against +0.9% for France and +1.5% for Germany.
RBNZ Governor Adrian Orr indicated that their overnight cash rate would likely have been raised in
August after meeting its targets on inflation and employment, however the latest outbreak of
Covid-19 and subsequent lockdown halted that decision.
The MSCI World ex-Aus Index rose +2.38% for the month of August:
Index 1m 3m 1yr 3yr 5yr 10yr
S&P 500 Index +2.90% +7.58% +29.21% +15.95% +15.81% +14.01%
MSCI World ex-AUS +2.38% +5.73% +28.04% +13.20% +12.98% +10.26%
S&P ASX 200 Accum. Index +2.50% +5.97% +28.15% +9.87% +10.94% +10.31%
Source: S&P, MSCI
Attachment 8.8.1 North Sydney Council Monthly Report August 2021
3750th Council Meeting - 27 September 2021 Agenda Page 21 of 51
Monthly Investment Report: August 2021 Page 15
Domestic Market
In its meeting in August, the RBA surprised markets by sticking to its taper plans of reducing
purchases to $4bn from $5bn a week starting from early September, despite the protracted
lockdowns in NSW and VIC. Snap lockdowns were also experienced across several other states.
RBA Governor Lowe Dr Lowe commented on the path of future rate hikes: “it will not be enough for
inflation to just sneak across the 2% line for a quarter or two. We want to see inflation well within
the target band and be confident that it will stay there”.
There appears to be a significant way before wage growth lifts above the RBA’s target of 3% y/y. There
were only modest signs of recovery in private sector wages amid tighter labour markets prior to the
current lockdowns, with public sector wage restraint currently a significant drag on overall wages
growth. The Wage Price Index (WPI) rose just +0.4% q/q and +1.7% y/y in the June quarter.
Headline employment rose +2k to a record high 13.2m to remain 1.2% above pre-pandemic February
2020 levels. Employment in NSW declined broadly as expected, down -36k or -0.9% in the month, but
was offset by gains elsewhere, notably in Victoria. The unemployment rate fell 0.3% to 4.6% in July,
mainly attributed to a 1.0% decline in the participation rate. The underemployment rate rose 0.4%
to 8.3%.
PM Morrison is trying to pressure states into sticking with the re-opening hurdles of 70% and 80%
adult vaccination – those hurdles being reachable by October and November respectively.
Residential building approvals fell -6.7% m/m in June, the third consecutive month of declines,
following a -7.6% fall in May and a -5.0% April. Meanwhile, Australian dwelling price rose +1.6% m/m
and +16.1% y/y in July.
The trade surplus increased by $1.2bn to a record high of $10.5bn in June, driven by an increase in
goods exports (+4% m/m to $38.2bn), with both rural (+7% m/m to $4.7bn) and non-rural goods (+2%
m/m to $31.4bn) increasing.
Retail sales fell in line with expectations, down -2.7% m/m in July. The decline in the month was driven
by a sharp fall in NSW (-8.9% m/m) with Greater Sydney having been in lockdown since June 26.
The Australian dollar fell -0.62%, finishing the month at US73.35 cents (from US73.81 cents the
previous month).
Credit Market
The main global credit indices tightened again over August in the risk-on environment. The indices
now trade back to their levels experienced in late 2020:
Index August 2021 July 2021
CDX North American 5yr CDS 46bp 50bp
iTraxx Europe 5yr CDS 45bp 47bp
iTraxx Australia 5yr CDS 58bp 63bp
Source: Markit
Attachment 8.8.1 North Sydney Council Monthly Report August 2021
3750th Council Meeting - 27 September 2021 Agenda Page 22 of 51

Monthly Investment Report: August 2021 Page 16
Fixed Interest Review Benchmark Index Returns
Index August 2021 July 2021
Bloomberg AusBond Bank Bill Index (0+YR) +0.00% +0.00%
Bloomberg AusBond Composite Bond Index (0+YR) +0.09% +1.76%
Bloomberg AusBond Credit FRN Index (0+YR) +0.05% +0.11%
Bloomberg AusBond Credit Index (0+YR) +0.06% +1.00%
Bloomberg AusBond Treasury Index (0+YR) +0.20% +2.01%
Bloomberg AusBond Inflation Gov’t Index (0+YR) -0.43% +2.70%
Source: Bloomberg
Other Key Rates
Index August 2021 July 2021
RBA Official Cash Rate 0.10% 0.10%
90 Day (3 month) BBSW Rate 0.01% 0.02%
3yr Australian Government Bonds 0.15% 0.13%
10yr Australian Government Bonds 1.12% 1.14%
US Fed Funds Rate 0.00%-0.25% 0.00%-0.25%
10yr US Treasury Bonds 1.30% 1.24%
Source: RBA, AFMA, US Department of Treasury
Attachment 8.8.1 North Sydney Council Monthly Report August 2021
3750th Council Meeting - 27 September 2021 Agenda Page 23 of 51
Monthly Investment Report: August 2021 Page 17
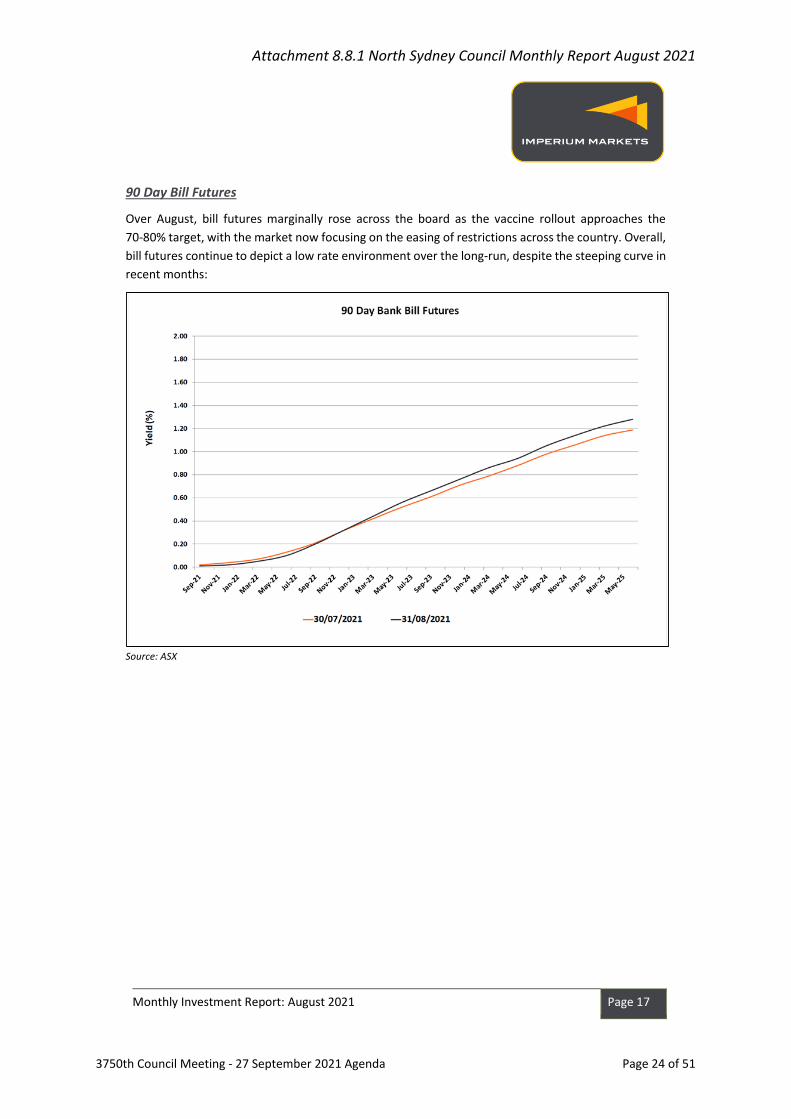
90 Day Bill Futures
Over August, bill futures marginally rose across the board as the vaccine rollout approaches the
70-80% target, with the market now focusing on the easing of restrictions across the country. Overall,
bill futures continue to depict a low rate environment over the long-run, despite the steeping curve in
recent months:
Source: ASX
Attachment 8.8.1 North Sydney Council Monthly Report August 2021
3750th Council Meeting - 27 September 2021 Agenda Page 24 of 51
Monthly Investment Report: August 2021 Page 18
Fixed Interest Outlook
Delta variant concerns have persisted, resulting in global bond yields to drift significantly lower over
recent months. US Federal Reserve Chairman Powell reiterated that a decision to taper off the Fed’s
US$120bn in monthly asset purchases does not mean it will be raising interest rates at the same time,
whilst reiterating their view that rising inflationary pressures will largely prove ‘transitory’. In late
August, the first US Fed hike was only fully priced by around March 2023.
In Australia, sporadic outbreaks are likely to be controlled via short‑lived restrictions until the
vaccination rate lifts substantially, with a target set at 70-80%. The RBA has factored in these snap
lockdowns as part of their economic projections. Conceivably, the RBA’s base case scenario does not
see rate hikes until 2024 (conditions for an official rate rise “will not be met until 2024”), while their
upside scenario is consistent with rate hikes in 2023, dependent on the flow of ongoing economic
data.
They would like to see the following three economic indicators improve before they even consider
increasing interest rates:
1. The unemployment rate to drop to around 4% (currently at 4.6% but masked by a significant
drop in the participation rate), and noting it has not been below 4.5% since 2008;
2. “Until actual (underlying) inflation is sustainably within the 2-3% target range” (it has not been
within their target band for the past 5 years); and
3. Wage growth to surpass +3% (it has not been above this level for the past 8 years).
Governor Lowe has remained relatively dovish with his comments, indicating an earlier rate hike
prior to 2024 would require “strong, unequivocal evidence that the pick-up in the economy is
translating into wages growth and inflation is sustainably higher”.
He has commented on the path of future rate hikes: “it will not be enough for inflation to just sneak
across the 2% line for a quarter or two. We want to see inflation well within the target band and be
confident that it will stay there”.
The domestic bond market continues to suggest a prolonged low period of interest rates. Over the
month, yields fell around 2bp at the long-end of the curve:
Attachment 8.8.1 North Sydney Council Monthly Report August 2021
3750th Council Meeting - 27 September 2021 Agenda Page 25 of 51

Monthly Investment Report: August 2021 Page 19
Source: AFMA, ASX, RBA
The market continues to factor in the possibility of a rate hike up to 25bp by the end of 2022,
dependent on the speed of the recovery once the vaccination target is met and restrictions are
eased:
Source: ASX
Attachment 8.8.1 North Sydney Council Monthly Report August 2021
3750th Council Meeting - 27 September 2021 Agenda Page 26 of 51
Monthly Investment Report: August 2021 Page 20
Disclaimer Imperium Markets provides fixed income investment advisory services and a financial market platform through which clients and fixed
income product providers may transact with each other.
The information in this document is intended solely for your use. The information and recommendations constitute judgements as of the
date of this report and do not consider your individual investment objectives and adopted policy mandate.
Imperium Markets monitors the entire fixed income investible universe and recommends the best rate available to us, regardless of whether
a product provider uses our market platform. You are responsible for deciding whether our recommendations are appropriate for your
particular investment needs, objectives and financial situation and for implementing your decisions. You may use our platform to transact
with your chosen product providers.
Imperium Markets charges a flat fee for our investment advice. Any commissions received are rebated to clients in full. If you choose a
product provider who uses our market platform, the product provider pays us 1bp p.a. funding fee of the value of the investments
transacted.
Attachment 8.8.1 North Sydney Council Monthly Report August 2021
3750th Council Meeting - 27 September 2021 Agenda Page 27 of 51

Investment Report01/08/2021 to 31/08/2021
Attachment 8.8.2 North Sydney Council Reporting Pack August 2021
3750th Council Meeting - 27 September 2021 Agenda Page 28 of 51
Page 2 / 24
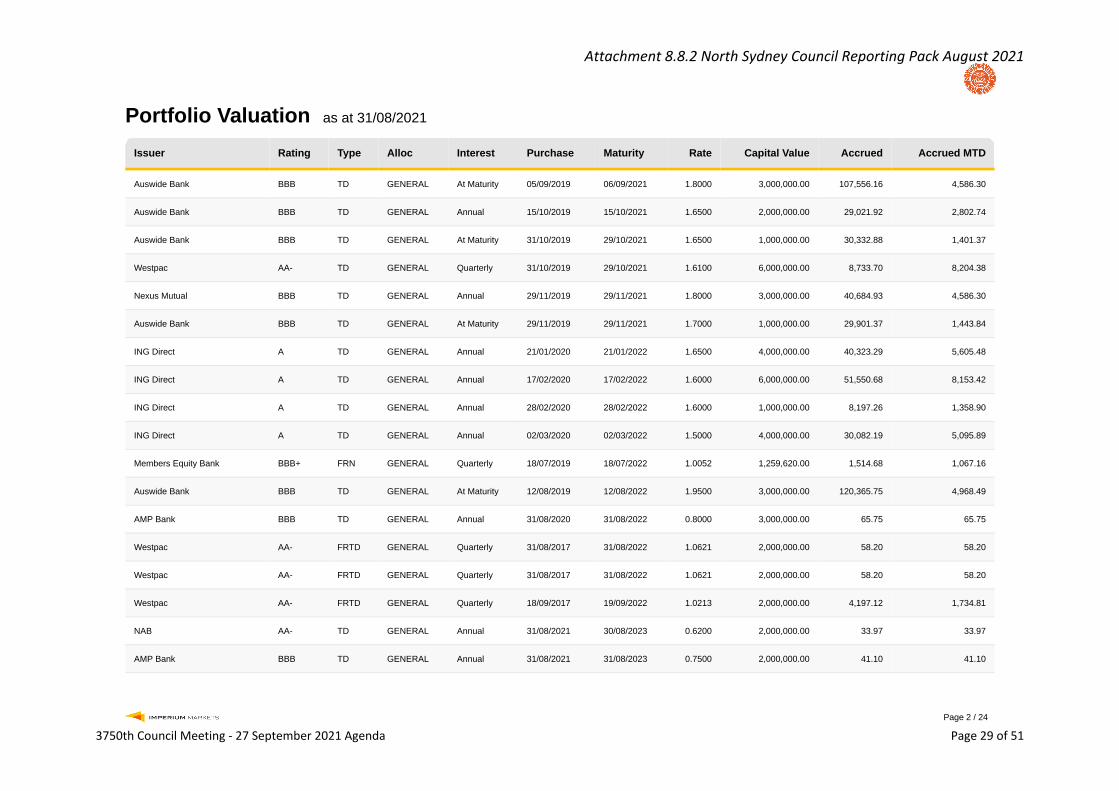
Portfolio Valuation as at 31/08/2021
Issuer Rating Type Alloc Interest Purchase Maturity Rate Capital Value Accrued Accrued MTD
Auswide Bank BBB TD GENERAL At Maturity 05/09/2019 06/09/2021 1.8000 3,000,000.00 107,556.16 4,586.30
Auswide Bank BBB TD GENERAL Annual 15/10/2019 15/10/2021 1.6500 2,000,000.00 29,021.92 2,802.74
Auswide Bank BBB TD GENERAL At Maturity 31/10/2019 29/10/2021 1.6500 1,000,000.00 30,332.88 1,401.37
Westpac AA- TD GENERAL Quarterly 31/10/2019 29/10/2021 1.6100 6,000,000.00 8,733.70 8,204.38
Nexus Mutual BBB TD GENERAL Annual 29/11/2019 29/11/2021 1.8000 3,000,000.00 40,684.93 4,586.30
Auswide Bank BBB TD GENERAL At Maturity 29/11/2019 29/11/2021 1.7000 1,000,000.00 29,901.37 1,443.84
ING Direct A TD GENERAL Annual 21/01/2020 21/01/2022 1.6500 4,000,000.00 40,323.29 5,605.48
ING Direct A TD GENERAL Annual 17/02/2020 17/02/2022 1.6000 6,000,000.00 51,550.68 8,153.42
ING Direct A TD GENERAL Annual 28/02/2020 28/02/2022 1.6000 1,000,000.00 8,197.26 1,358.90
ING Direct A TD GENERAL Annual 02/03/2020 02/03/2022 1.5000 4,000,000.00 30,082.19 5,095.89
Members Equity Bank BBB+ FRN GENERAL Quarterly 18/07/2019 18/07/2022 1.0052 1,259,620.00 1,514.68 1,067.16
Auswide Bank BBB TD GENERAL At Maturity 12/08/2019 12/08/2022 1.9500 3,000,000.00 120,365.75 4,968.49
AMP Bank BBB TD GENERAL Annual 31/08/2020 31/08/2022 0.8000 3,000,000.00 65.75 65.75
Westpac AA- FRTD GENERAL Quarterly 31/08/2017 31/08/2022 1.0621 2,000,000.00 58.20 58.20
Westpac AA- FRTD GENERAL Quarterly 31/08/2017 31/08/2022 1.0621 2,000,000.00 58.20 58.20
Westpac AA- FRTD GENERAL Quarterly 18/09/2017 19/09/2022 1.0213 2,000,000.00 4,197.12 1,734.81
NAB AA- TD GENERAL Annual 31/08/2021 30/08/2023 0.6200 2,000,000.00 33.97 33.97
AMP Bank BBB TD GENERAL Annual 31/08/2021 31/08/2023 0.7500 2,000,000.00 41.10 41.10
Attachment 8.8.2 North Sydney Council Reporting Pack August 2021
3750th Council Meeting - 27 September 2021 Agenda Page 29 of 51
Page 3 / 24
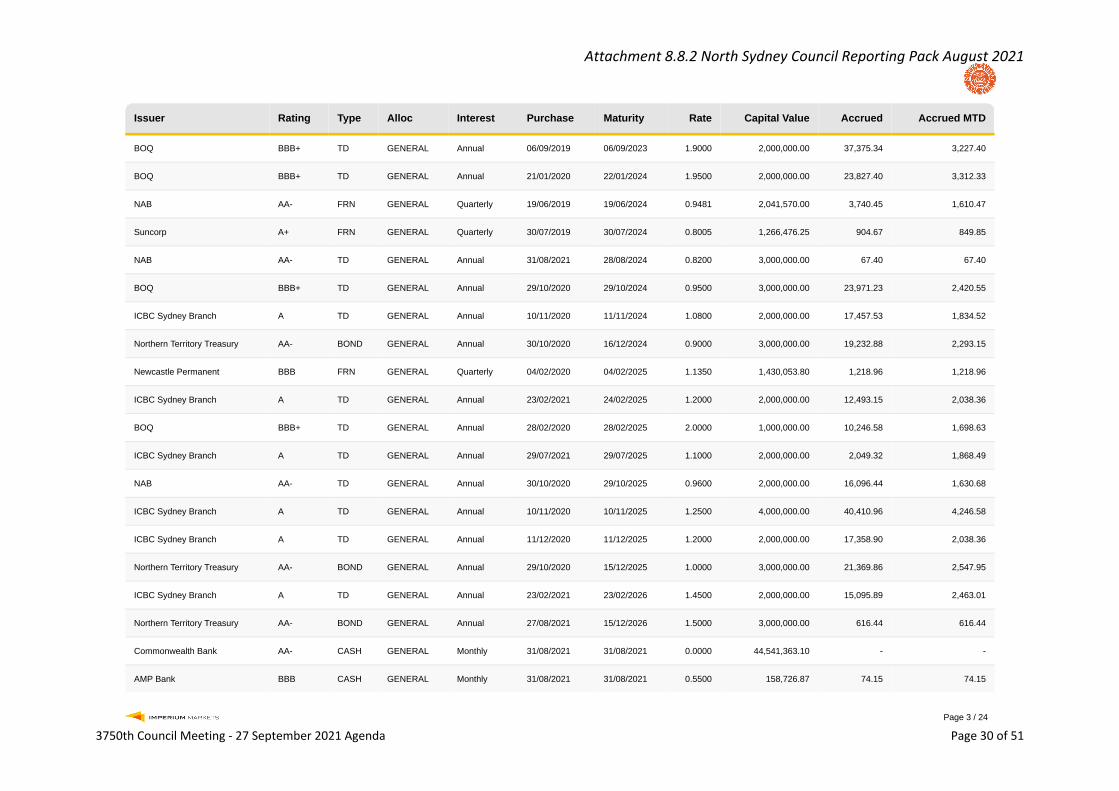
Issuer Rating Type Alloc Interest Purchase Maturity Rate Capital Value Accrued Accrued MTD
BOQ BBB+ TD GENERAL Annual 06/09/2019 06/09/2023 1.9000 2,000,000.00 37,375.34 3,227.40
BOQ BBB+ TD GENERAL Annual 21/01/2020 22/01/2024 1.9500 2,000,000.00 23,827.40 3,312.33
NAB AA- FRN GENERAL Quarterly 19/06/2019 19/06/2024 0.9481 2,041,570.00 3,740.45 1,610.47
Suncorp A+ FRN GENERAL Quarterly 30/07/2019 30/07/2024 0.8005 1,266,476.25 904.67 849.85
NAB AA- TD GENERAL Annual 31/08/2021 28/08/2024 0.8200 3,000,000.00 67.40 67.40
BOQ BBB+ TD GENERAL Annual 29/10/2020 29/10/2024 0.9500 3,000,000.00 23,971.23 2,420.55
ICBC Sydney Branch A TD GENERAL Annual 10/11/2020 11/11/2024 1.0800 2,000,000.00 17,457.53 1,834.52
Northern Territory Treasury AA- BOND GENERAL Annual 30/10/2020 16/12/2024 0.9000 3,000,000.00 19,232.88 2,293.15
Newcastle Permanent BBB FRN GENERAL Quarterly 04/02/2020 04/02/2025 1.1350 1,430,053.80 1,218.96 1,218.96
ICBC Sydney Branch A TD GENERAL Annual 23/02/2021 24/02/2025 1.2000 2,000,000.00 12,493.15 2,038.36
BOQ BBB+ TD GENERAL Annual 28/02/2020 28/02/2025 2.0000 1,000,000.00 10,246.58 1,698.63
ICBC Sydney Branch A TD GENERAL Annual 29/07/2021 29/07/2025 1.1000 2,000,000.00 2,049.32 1,868.49
NAB AA- TD GENERAL Annual 30/10/2020 29/10/2025 0.9600 2,000,000.00 16,096.44 1,630.68
ICBC Sydney Branch A TD GENERAL Annual 10/11/2020 10/11/2025 1.2500 4,000,000.00 40,410.96 4,246.58
ICBC Sydney Branch A TD GENERAL Annual 11/12/2020 11/12/2025 1.2000 2,000,000.00 17,358.90 2,038.36
Northern Territory Treasury AA- BOND GENERAL Annual 29/10/2020 15/12/2025 1.0000 3,000,000.00 21,369.86 2,547.95
ICBC Sydney Branch A TD GENERAL Annual 23/02/2021 23/02/2026 1.4500 2,000,000.00 15,095.89 2,463.01
Northern Territory Treasury AA- BOND GENERAL Annual 27/08/2021 15/12/2026 1.5000 3,000,000.00 616.44 616.44
Commonwealth Bank AA- CASH GENERAL Monthly 31/08/2021 31/08/2021 0.0000 44,541,363.10 - -
AMP Bank BBB CASH GENERAL Monthly 31/08/2021 31/08/2021 0.5500 158,726.87 74.15 74.15
Attachment 8.8.2 North Sydney Council Reporting Pack August 2021
3750th Council Meeting - 27 September 2021 Agenda Page 30 of 51
Page 4 / 24
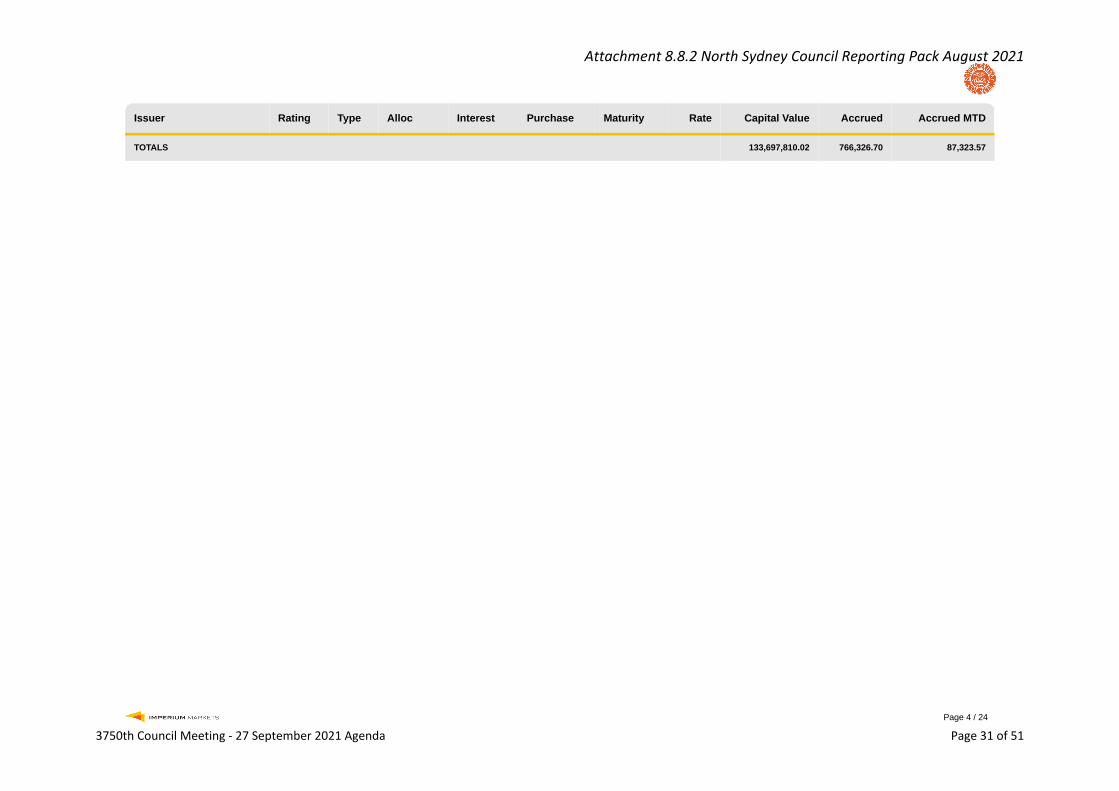
Issuer Rating Type Alloc Interest Purchase Maturity Rate Capital Value Accrued Accrued MTD
TOTALS 133,697,810.02 766,326.70 87,323.57
Attachment 8.8.2 North Sydney Council Reporting Pack August 2021
3750th Council Meeting - 27 September 2021 Agenda Page 31 of 51
Page 5 / 24
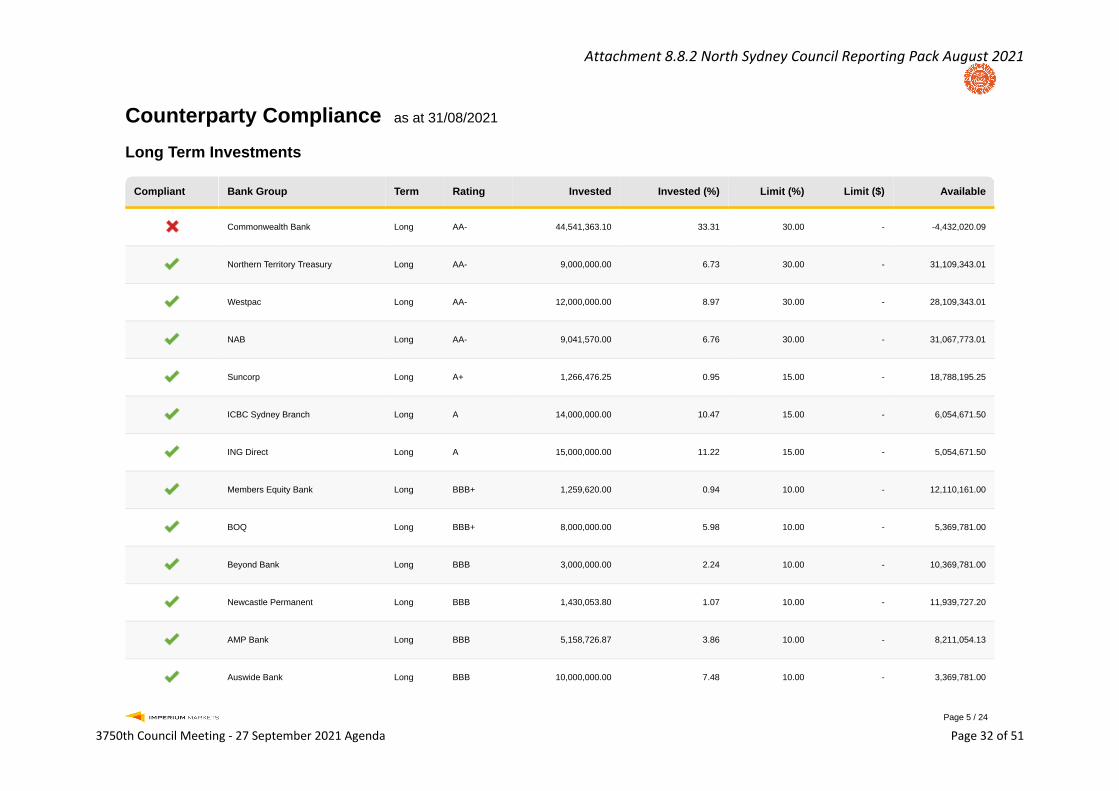
Counterparty Compliance as at 31/08/2021
Long Term Investments
Compliant Bank Group Term Rating Invested Invested (%) Limit (%) Limit ($) Available
Commonwealth Bank Long AA- 44,541,363.10 33.31 30.00 - -4,432,020.09
Northern Territory Treasury Long AA- 9,000,000.00 6.73 30.00 - 31,109,343.01
Westpac Long AA- 12,000,000.00 8.97 30.00 - 28,109,343.01
NAB Long AA- 9,041,570.00 6.76 30.00 - 31,067,773.01
Suncorp Long A+ 1,266,476.25 0.95 15.00 - 18,788,195.25
ICBC Sydney Branch Long A 14,000,000.00 10.47 15.00 - 6,054,671.50
ING Direct Long A 15,000,000.00 11.22 15.00 - 5,054,671.50
Members Equity Bank Long BBB+ 1,259,620.00 0.94 10.00 - 12,110,161.00
BOQ Long BBB+ 8,000,000.00 5.98 10.00 - 5,369,781.00
Beyond Bank Long BBB 3,000,000.00 2.24 10.00 - 10,369,781.00
Newcastle Permanent Long BBB 1,430,053.80 1.07 10.00 - 11,939,727.20
AMP Bank Long BBB 5,158,726.87 3.86 10.00 - 8,211,054.13
Auswide Bank Long BBB 10,000,000.00 7.48 10.00 - 3,369,781.00
Attachment 8.8.2 North Sydney Council Reporting Pack August 2021
3750th Council Meeting - 27 September 2021 Agenda Page 32 of 51

Page 6 / 24
Compliant Bank Group Term Rating Invested Invested (%) Limit (%) Limit ($) Available
TOTALS 133,697,810.02 100.00
Attachment 8.8.2 North Sydney Council Reporting Pack August 2021
3750th Council Meeting - 27 September 2021 Agenda Page 33 of 51
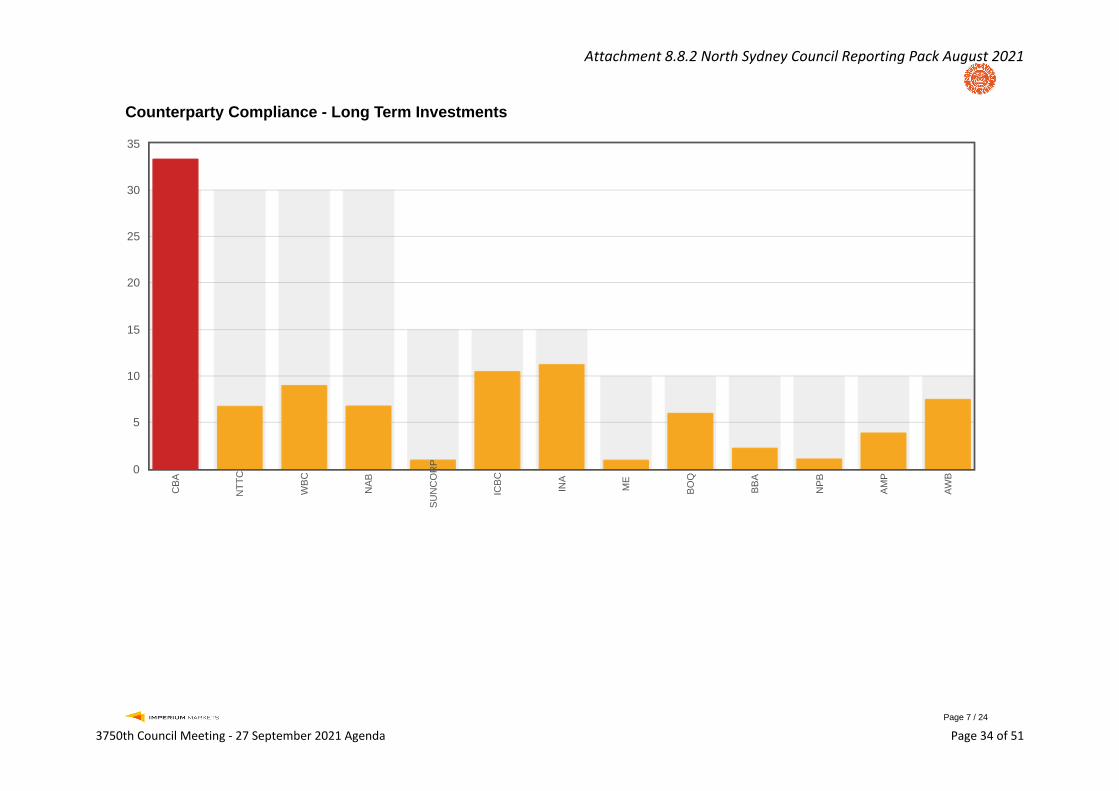
Page 7 / 24
Counterparty Compliance - Long Term Investments
CB
A
NT
TC
WB
C
NA
B
SU
NC
OR
P
ICB
C
INA
ME
BO
Q
BB
A
NP
B
AM
P
AW
B
0
5
10
15
20
25
30
35
Attachment 8.8.2 North Sydney Council Reporting Pack August 2021
3750th Council Meeting - 27 September 2021 Agenda Page 34 of 51

Page 8 / 24
Credit Quality Compliance as at 31/08/2021
Long Term Investments
Compliant Rating Invested ($) Invested (%) Limit (%) Available
AA 74,582,933.10 55.78 100.00 59,114,876.92
A 30,266,476.25 22.64 60.00 49,952,209.76
BBB 28,848,400.67 21.58 35.00 17,945,832.84
TOTALS 133,697,810.02 100.00
Credit Quality Compliance - Long Term Investments
AA A BBB0
20
40
60
80
100
120
Attachment 8.8.2 North Sydney Council Reporting Pack August 2021
3750th Council Meeting - 27 September 2021 Agenda Page 35 of 51

Page 9 / 24
Maturity Compliance as at 31/08/2021
Compliant Term Invested Invested (%) Min Limit (%) Max Limit (%) Available
0 - 90 days 60,700,089.97 45.40 10.00 100.00 72,997,720.05
91 - 365 days 26,259,620.00 19.64 20.00 100.00 107,438,190.02
1 - 2 years 6,000,000.00 4.49 0.00 70.00 87,588,467.01
2 - 5 years 37,738,100.05 28.23 0.00 50.00 29,110,804.96
5 - 10 years 3,000,000.00 2.24 0.00 25.00 30,424,452.51
TOTALS 133,697,810.02 100.00
Maturity Compliance
0 - 90 days 91 - 365 days 1 - 2 years 2 - 5 years 5 - 10 years0
20
40
60
80
100
120
Attachment 8.8.2 North Sydney Council Reporting Pack August 2021
3750th Council Meeting - 27 September 2021 Agenda Page 36 of 51
Page 10 / 24
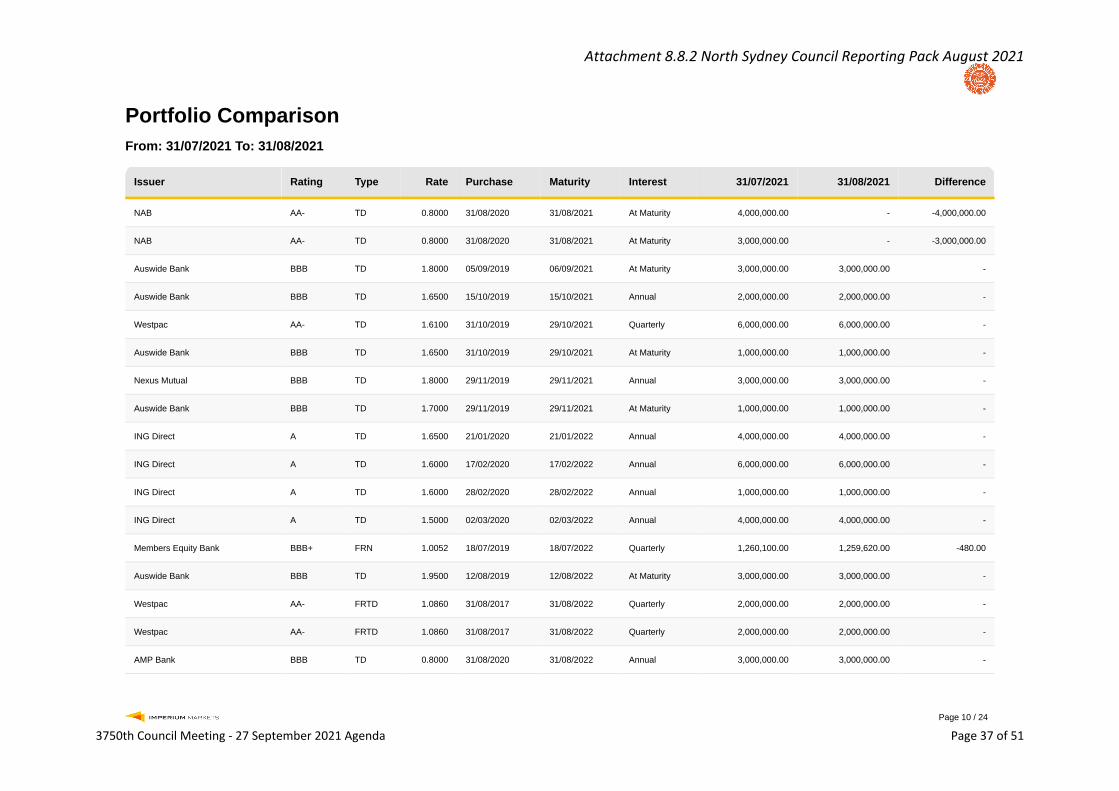
Portfolio ComparisonFrom: 31/07/2021 To: 31/08/2021
Issuer Rating Type Rate Purchase Maturity Interest 31/07/2021 31/08/2021 Difference
NAB AA- TD 0.8000 31/08/2020 31/08/2021 At Maturity 4,000,000.00 - -4,000,000.00
NAB AA- TD 0.8000 31/08/2020 31/08/2021 At Maturity 3,000,000.00 - -3,000,000.00
Auswide Bank BBB TD 1.8000 05/09/2019 06/09/2021 At Maturity 3,000,000.00 3,000,000.00 -
Auswide Bank BBB TD 1.6500 15/10/2019 15/10/2021 Annual 2,000,000.00 2,000,000.00 -
Westpac AA- TD 1.6100 31/10/2019 29/10/2021 Quarterly 6,000,000.00 6,000,000.00 -
Auswide Bank BBB TD 1.6500 31/10/2019 29/10/2021 At Maturity 1,000,000.00 1,000,000.00 -
Nexus Mutual BBB TD 1.8000 29/11/2019 29/11/2021 Annual 3,000,000.00 3,000,000.00 -
Auswide Bank BBB TD 1.7000 29/11/2019 29/11/2021 At Maturity 1,000,000.00 1,000,000.00 -
ING Direct A TD 1.6500 21/01/2020 21/01/2022 Annual 4,000,000.00 4,000,000.00 -
ING Direct A TD 1.6000 17/02/2020 17/02/2022 Annual 6,000,000.00 6,000,000.00 -
ING Direct A TD 1.6000 28/02/2020 28/02/2022 Annual 1,000,000.00 1,000,000.00 -
ING Direct A TD 1.5000 02/03/2020 02/03/2022 Annual 4,000,000.00 4,000,000.00 -
Members Equity Bank BBB+ FRN 1.0052 18/07/2019 18/07/2022 Quarterly 1,260,100.00 1,259,620.00 -480.00
Auswide Bank BBB TD 1.9500 12/08/2019 12/08/2022 At Maturity 3,000,000.00 3,000,000.00 -
Westpac AA- FRTD 1.0860 31/08/2017 31/08/2022 Quarterly 2,000,000.00 2,000,000.00 -
Westpac AA- FRTD 1.0860 31/08/2017 31/08/2022 Quarterly 2,000,000.00 2,000,000.00 -
AMP Bank BBB TD 0.8000 31/08/2020 31/08/2022 Annual 3,000,000.00 3,000,000.00 -
Attachment 8.8.2 North Sydney Council Reporting Pack August 2021
3750th Council Meeting - 27 September 2021 Agenda Page 37 of 51
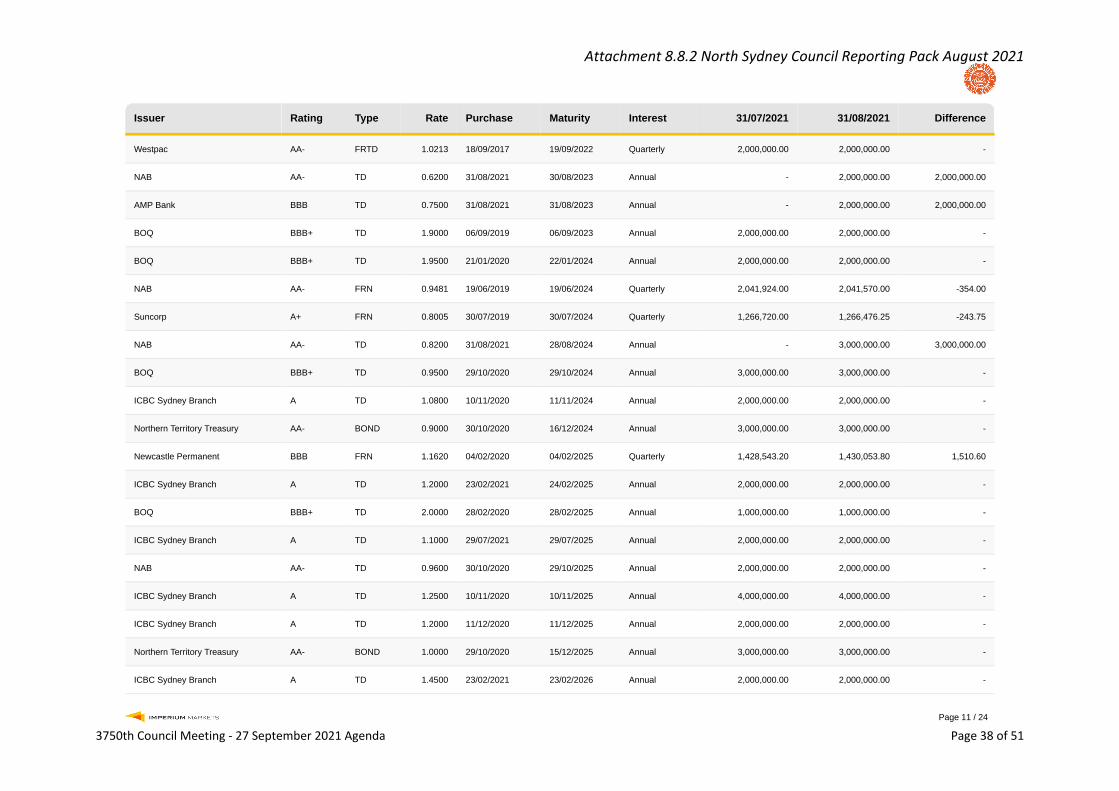
Page 11 / 24
Issuer Rating Type Rate Purchase Maturity Interest 31/07/2021 31/08/2021 Difference
Westpac AA- FRTD 1.0213 18/09/2017 19/09/2022 Quarterly 2,000,000.00 2,000,000.00 -
NAB AA- TD 0.6200 31/08/2021 30/08/2023 Annual - 2,000,000.00 2,000,000.00
AMP Bank BBB TD 0.7500 31/08/2021 31/08/2023 Annual - 2,000,000.00 2,000,000.00
BOQ BBB+ TD 1.9000 06/09/2019 06/09/2023 Annual 2,000,000.00 2,000,000.00 -
BOQ BBB+ TD 1.9500 21/01/2020 22/01/2024 Annual 2,000,000.00 2,000,000.00 -
NAB AA- FRN 0.9481 19/06/2019 19/06/2024 Quarterly 2,041,924.00 2,041,570.00 -354.00
Suncorp A+ FRN 0.8005 30/07/2019 30/07/2024 Quarterly 1,266,720.00 1,266,476.25 -243.75
NAB AA- TD 0.8200 31/08/2021 28/08/2024 Annual - 3,000,000.00 3,000,000.00
BOQ BBB+ TD 0.9500 29/10/2020 29/10/2024 Annual 3,000,000.00 3,000,000.00 -
ICBC Sydney Branch A TD 1.0800 10/11/2020 11/11/2024 Annual 2,000,000.00 2,000,000.00 -
Northern Territory Treasury AA- BOND 0.9000 30/10/2020 16/12/2024 Annual 3,000,000.00 3,000,000.00 -
Newcastle Permanent BBB FRN 1.1620 04/02/2020 04/02/2025 Quarterly 1,428,543.20 1,430,053.80 1,510.60
ICBC Sydney Branch A TD 1.2000 23/02/2021 24/02/2025 Annual 2,000,000.00 2,000,000.00 -
BOQ BBB+ TD 2.0000 28/02/2020 28/02/2025 Annual 1,000,000.00 1,000,000.00 -
ICBC Sydney Branch A TD 1.1000 29/07/2021 29/07/2025 Annual 2,000,000.00 2,000,000.00 -
NAB AA- TD 0.9600 30/10/2020 29/10/2025 Annual 2,000,000.00 2,000,000.00 -
ICBC Sydney Branch A TD 1.2500 10/11/2020 10/11/2025 Annual 4,000,000.00 4,000,000.00 -
ICBC Sydney Branch A TD 1.2000 11/12/2020 11/12/2025 Annual 2,000,000.00 2,000,000.00 -
Northern Territory Treasury AA- BOND 1.0000 29/10/2020 15/12/2025 Annual 3,000,000.00 3,000,000.00 -
ICBC Sydney Branch A TD 1.4500 23/02/2021 23/02/2026 Annual 2,000,000.00 2,000,000.00 -
Attachment 8.8.2 North Sydney Council Reporting Pack August 2021
3750th Council Meeting - 27 September 2021 Agenda Page 38 of 51

Page 12 / 24
Issuer Rating Type Rate Purchase Maturity Interest 31/07/2021 31/08/2021 Difference
Northern Territory Treasury AA- BOND 1.5000 27/08/2021 15/12/2026 Annual - 3,000,000.00 3,000,000.00
AMP Bank BBB CASH 0.5500 31/07/2021 31/07/2021 Monthly 158,726.87 158,726.87 -
Commonwealth Bank AA- CASH 0.0000 31/07/2021 31/07/2021 Monthly 32,257,164.89 44,541,363.10 12,284,198.21
TOTALS 118,413,178.96 133,697,810.02 15,284,631.06
Attachment 8.8.2 North Sydney Council Reporting Pack August 2021
3750th Council Meeting - 27 September 2021 Agenda Page 39 of 51

Page 13 / 24
Trades in PeriodFrom: 01/08/2021 To: 31/08/2021
New Trades
Issuer Rating Type Alloc Interest Purchase Maturity Rate Value Ref
Northern Territory Treasury AA- BOND GENERAL Annual 27/08/2021 15/12/2026 1.5000 3,000,000.00
NAB AA- TD GENERAL Annual 31/08/2021 28/08/2024 0.8200 3,000,000.00
NAB AA- TD GENERAL Annual 31/08/2021 30/08/2023 0.6200 2,000,000.00
AMP Bank BBB TD GENERAL Annual 31/08/2021 31/08/2023 0.7500 2,000,000.00
TOTALS 10,000,000.00
Attachment 8.8.2 North Sydney Council Reporting Pack August 2021
3750th Council Meeting - 27 September 2021 Agenda Page 40 of 51
Page 14 / 24
Sell Trades
Issuer Rating Type Alloc Interest Purchase Maturity Sell Rate Value Ref
No entries for this item
Attachment 8.8.2 North Sydney Council Reporting Pack August 2021
3750th Council Meeting - 27 September 2021 Agenda Page 41 of 51
Page 15 / 24
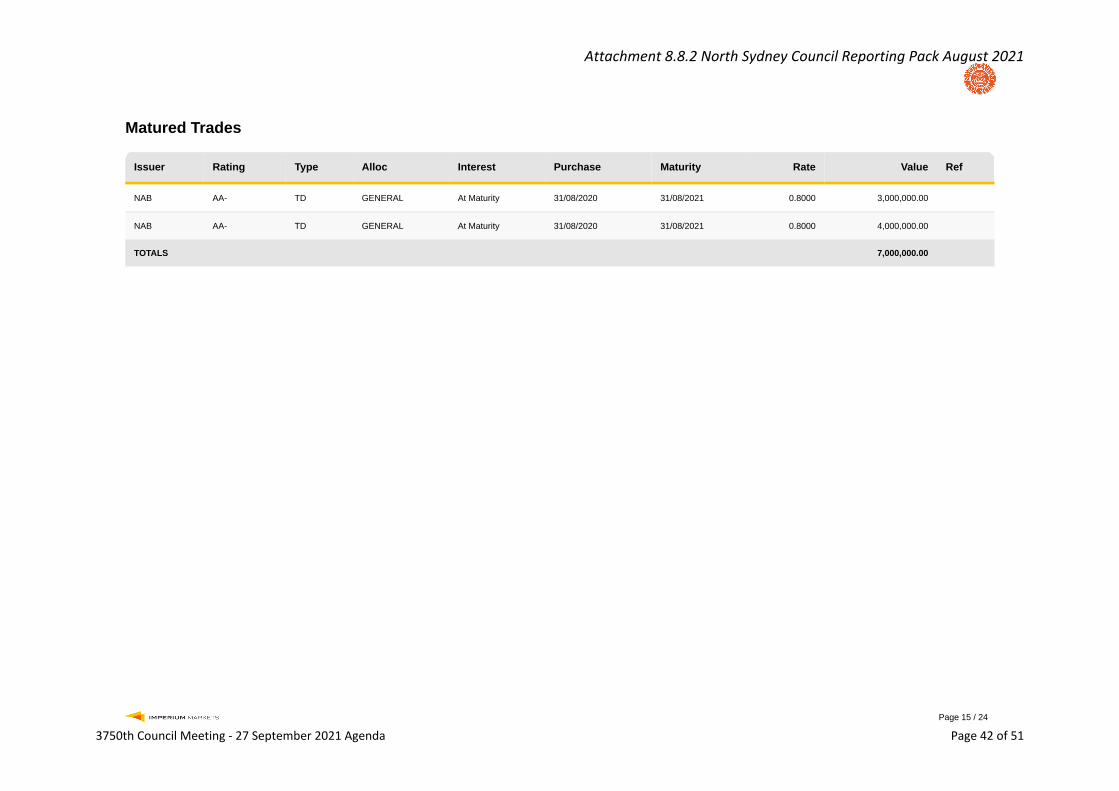
Matured Trades
Issuer Rating Type Alloc Interest Purchase Maturity Rate Value Ref
NAB AA- TD GENERAL At Maturity 31/08/2020 31/08/2021 0.8000 3,000,000.00
NAB AA- TD GENERAL At Maturity 31/08/2020 31/08/2021 0.8000 4,000,000.00
TOTALS 7,000,000.00
Attachment 8.8.2 North Sydney Council Reporting Pack August 2021
3750th Council Meeting - 27 September 2021 Agenda Page 42 of 51
Page 16 / 24
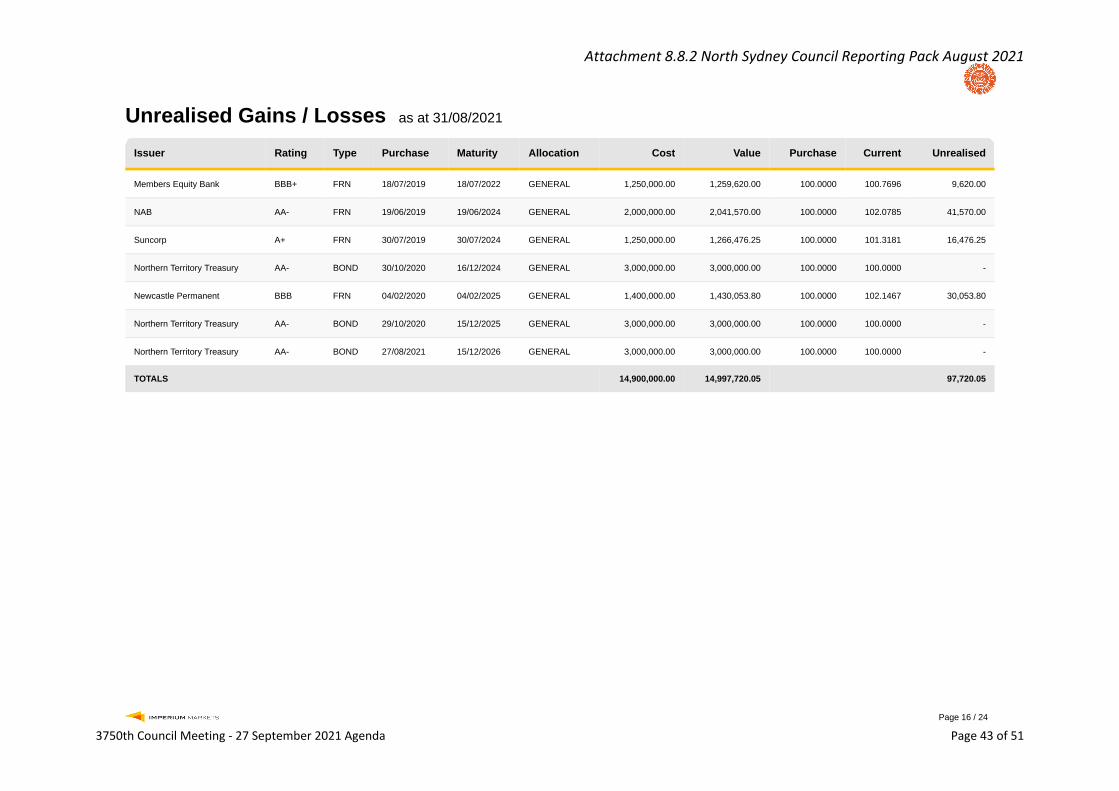
Unrealised Gains / Losses as at 31/08/2021
Issuer Rating Type Purchase Maturity Allocation Cost Value Purchase Current Unrealised
Members Equity Bank BBB+ FRN 18/07/2019 18/07/2022 GENERAL 1,250,000.00 1,259,620.00 100.0000 100.7696 9,620.00
NAB AA- FRN 19/06/2019 19/06/2024 GENERAL 2,000,000.00 2,041,570.00 100.0000 102.0785 41,570.00
Suncorp A+ FRN 30/07/2019 30/07/2024 GENERAL 1,250,000.00 1,266,476.25 100.0000 101.3181 16,476.25
Northern Territory Treasury AA- BOND 30/10/2020 16/12/2024 GENERAL 3,000,000.00 3,000,000.00 100.0000 100.0000 -
Newcastle Permanent BBB FRN 04/02/2020 04/02/2025 GENERAL 1,400,000.00 1,430,053.80 100.0000 102.1467 30,053.80
Northern Territory Treasury AA- BOND 29/10/2020 15/12/2025 GENERAL 3,000,000.00 3,000,000.00 100.0000 100.0000 -
Northern Territory Treasury AA- BOND 27/08/2021 15/12/2026 GENERAL 3,000,000.00 3,000,000.00 100.0000 100.0000 -
TOTALS 14,900,000.00 14,997,720.05 97,720.05
Attachment 8.8.2 North Sydney Council Reporting Pack August 2021
3750th Council Meeting - 27 September 2021 Agenda Page 43 of 51

Page 17 / 24
Realised Gains / LossesFrom: 01/08/2021 To: 31/08/2021
Issuer Rating Type Purchase Maturity Sale Cost Current Purchase Sale Realised Type
No entries for this item
Attachment 8.8.2 North Sydney Council Reporting Pack August 2021
3750th Council Meeting - 27 September 2021 Agenda Page 44 of 51
Page 18 / 24
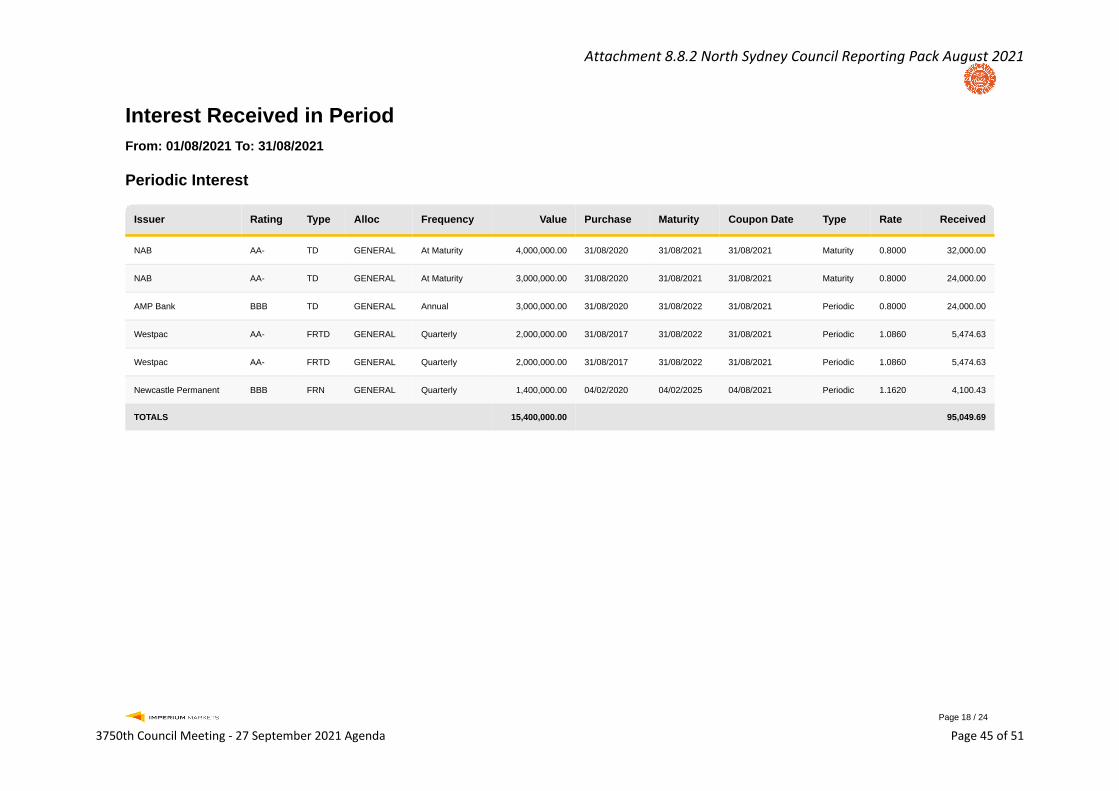
Interest Received in PeriodFrom: 01/08/2021 To: 31/08/2021
Periodic Interest
Issuer Rating Type Alloc Frequency Value Purchase Maturity Coupon Date Type Rate Received
NAB AA- TD GENERAL At Maturity 4,000,000.00 31/08/2020 31/08/2021 31/08/2021 Maturity 0.8000 32,000.00
NAB AA- TD GENERAL At Maturity 3,000,000.00 31/08/2020 31/08/2021 31/08/2021 Maturity 0.8000 24,000.00
AMP Bank BBB TD GENERAL Annual 3,000,000.00 31/08/2020 31/08/2022 31/08/2021 Periodic 0.8000 24,000.00
Westpac AA- FRTD GENERAL Quarterly 2,000,000.00 31/08/2017 31/08/2022 31/08/2021 Periodic 1.0860 5,474.63
Westpac AA- FRTD GENERAL Quarterly 2,000,000.00 31/08/2017 31/08/2022 31/08/2021 Periodic 1.0860 5,474.63
Newcastle Permanent BBB FRN GENERAL Quarterly 1,400,000.00 04/02/2020 04/02/2025 04/08/2021 Periodic 1.1620 4,100.43
TOTALS 15,400,000.00 95,049.69
Attachment 8.8.2 North Sydney Council Reporting Pack August 2021
3750th Council Meeting - 27 September 2021 Agenda Page 45 of 51
Page 19 / 24
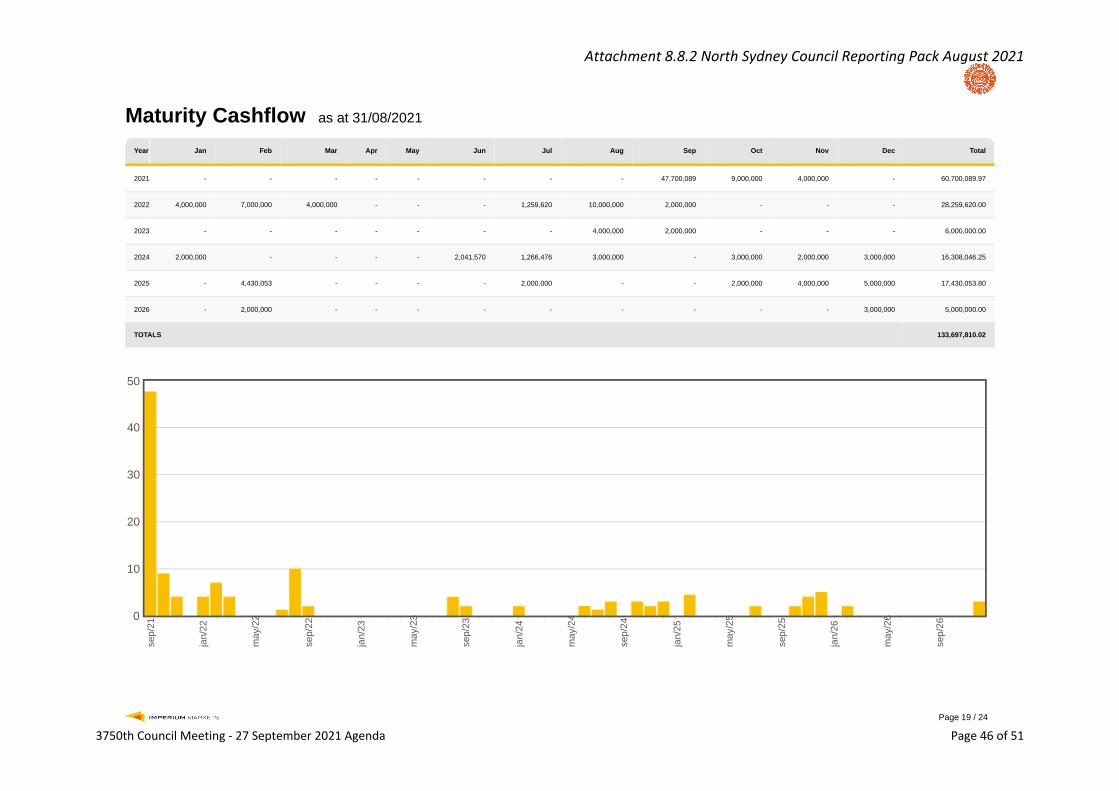
Maturity Cashflow as at 31/08/2021
Year Jan Feb Mar Apr May Jun Jul Aug Sep Oct Nov Dec Total
2021 - - - - - - - - 47,700,089 9,000,000 4,000,000 - 60,700,089.97
2022 4,000,000 7,000,000 4,000,000 - - - 1,259,620 10,000,000 2,000,000 - - - 28,259,620.00
2023 - - - - - - - 4,000,000 2,000,000 - - - 6,000,000.00
2024 2,000,000 - - - - 2,041,570 1,266,476 3,000,000 - 3,000,000 2,000,000 3,000,000 16,308,046.25
2025 - 4,430,053 - - - - 2,000,000 - - 2,000,000 4,000,000 5,000,000 17,430,053.80
2026 - 2,000,000 - - - - - - - - - 3,000,000 5,000,000.00
TOTALS 133,697,810.02
sep/
21
jan/
22
may
/22
sep/
22
jan/
23
may
/23
sep/
23
jan/
24
may
/24
sep/
24
jan/
25
may
/25
sep/
25
jan/
26
may
/26
sep/
26
0
10
20
30
40
50
Attachment 8.8.2 North Sydney Council Reporting Pack August 2021
3750th Council Meeting - 27 September 2021 Agenda Page 46 of 51
Page 20 / 24
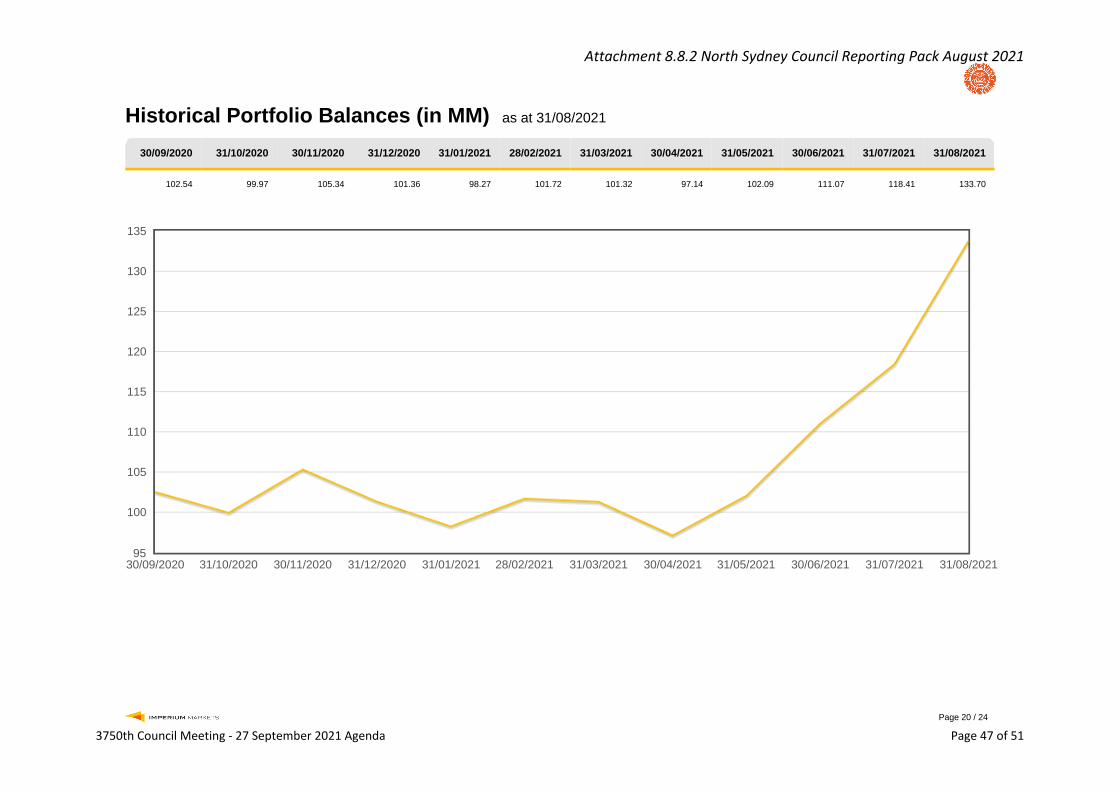
Historical Portfolio Balances (in MM) as at 31/08/2021
30/09/2020 31/10/2020 30/11/2020 31/12/2020 31/01/2021 28/02/2021 31/03/2021 30/04/2021 31/05/2021 30/06/2021 31/07/2021 31/08/2021
102.54 99.97 105.34 101.36 98.27 101.72 101.32 97.14 102.09 111.07 118.41 133.70
30/09/2020 31/10/2020 30/11/2020 31/12/2020 31/01/2021 28/02/2021 31/03/2021 30/04/2021 31/05/2021 30/06/2021 31/07/2021 31/08/202195
100
105
110
115
120
125
130
135
Attachment 8.8.2 North Sydney Council Reporting Pack August 2021
3750th Council Meeting - 27 September 2021 Agenda Page 47 of 51
Page 21 / 24
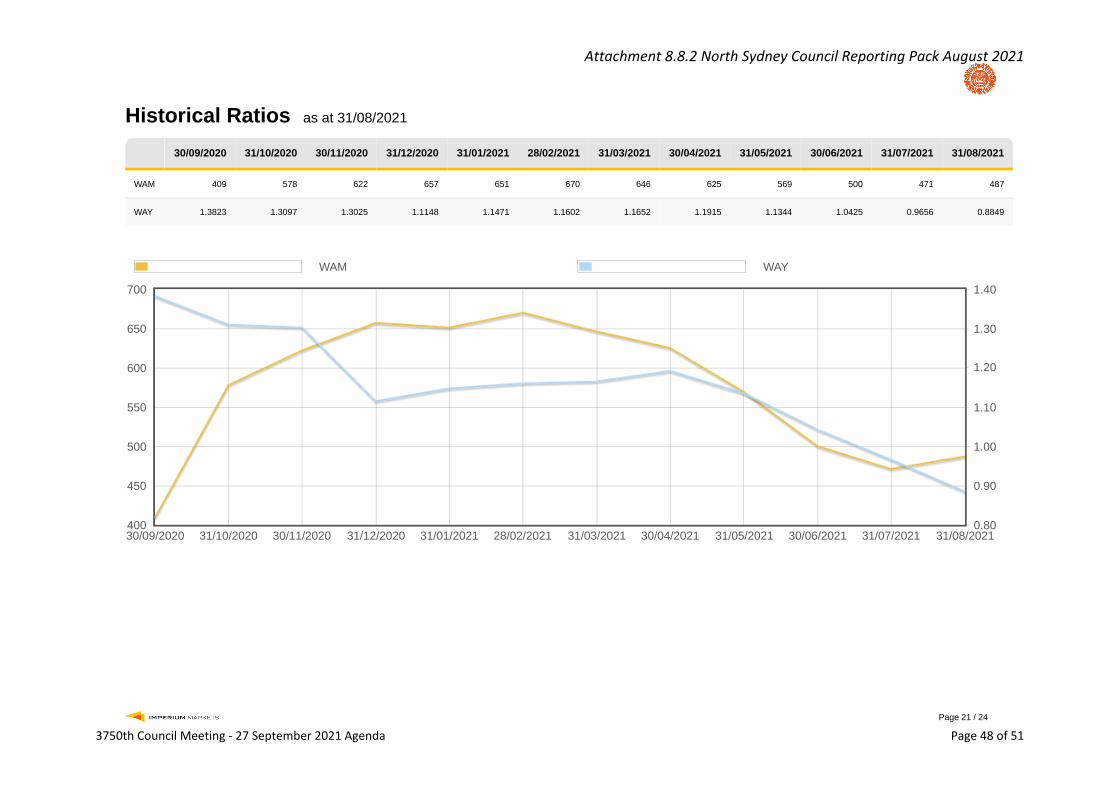
Historical Ratios as at 31/08/2021
30/09/2020 31/10/2020 30/11/2020 31/12/2020 31/01/2021 28/02/2021 31/03/2021 30/04/2021 31/05/2021 30/06/2021 31/07/2021 31/08/2021
WAM 409 578 622 657 651 670 646 625 569 500 471 487
WAY 1.3823 1.3097 1.3025 1.1148 1.1471 1.1602 1.1652 1.1915 1.1344 1.0425 0.9656 0.8849
WAM WAY
30/09/2020 31/10/2020 30/11/2020 31/12/2020 31/01/2021 28/02/2021 31/03/2021 30/04/2021 31/05/2021 30/06/2021 31/07/2021 31/08/2021400
450
500
550
600
650
700
0.80
0.90
1.00
1.10
1.20
1.30
1.40
Attachment 8.8.2 North Sydney Council Reporting Pack August 2021
3750th Council Meeting - 27 September 2021 Agenda Page 48 of 51
Page 22 / 24
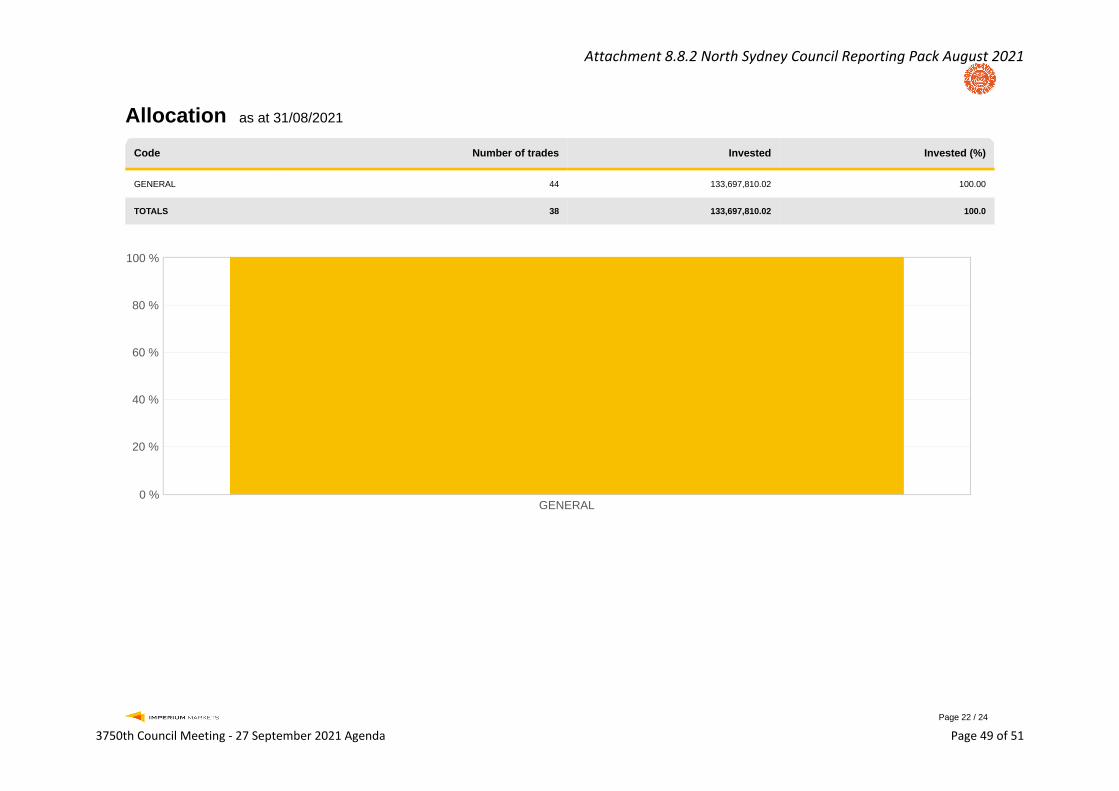
Allocation as at 31/08/2021
Code Number of trades Invested Invested (%)
GENERAL 44 133,697,810.02 100.00
TOTALS 38 133,697,810.02 100.0
GENERAL0 %
20 %
40 %
60 %
80 %
100 %
Attachment 8.8.2 North Sydney Council Reporting Pack August 2021
3750th Council Meeting - 27 September 2021 Agenda Page 49 of 51
Page 23 / 24
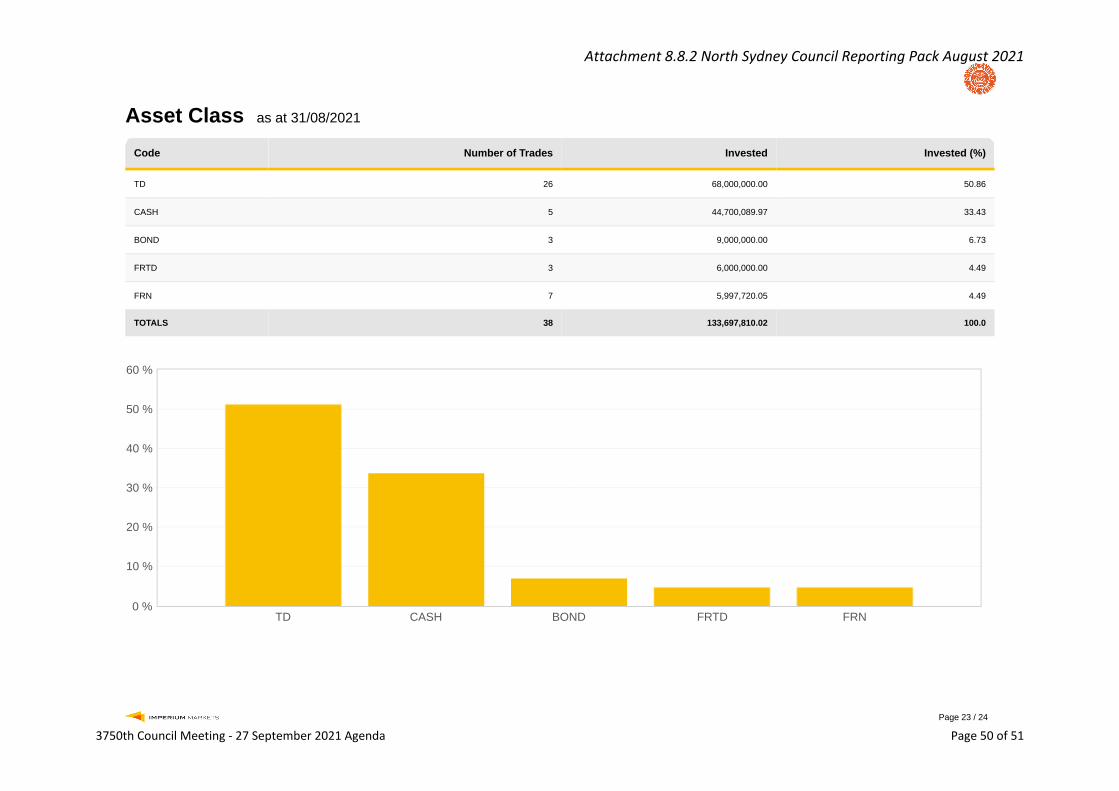
Asset Class as at 31/08/2021
Code Number of Trades Invested Invested (%)
TD 26 68,000,000.00 50.86
CASH 5 44,700,089.97 33.43
BOND 3 9,000,000.00 6.73
FRTD 3 6,000,000.00 4.49
FRN 7 5,997,720.05 4.49
TOTALS 38 133,697,810.02 100.0
TD CASH BOND FRTD FRN0 %
10 %
20 %
30 %
40 %
50 %
60 %
Attachment 8.8.2 North Sydney Council Reporting Pack August 2021
3750th Council Meeting - 27 September 2021 Agenda Page 50 of 51

Page 24 / 24
ADIs funding fossil fuels as at 31/08/2021
Number of Trades Invested Invested (%)
Not funding fossil fuels 18 39,956,150.05 29.9
Funding fossil fuels 26 93,741,659.97 70.1
Not Funding 30%
Funding 70%
Attachment 8.8.2 North Sydney Council Reporting Pack August 2021
3750th Council Meeting - 27 September 2021 Agenda Page 51 of 51