investment adviser’s letter to shareholders annual report€¦ · ·...
TRANSCRIPT
TWEEDY, BROWNE FUND INC.
This booklet consists of two separate documents:
INVESTMENT ADVISER’S LETTERTO SHAREHOLDERS
ANNUAL REPORT
Tweedy, Browne Global Value Fund (TBGVX)Tweedy, Browne Global Value Fund II – Currency Unhedged (TBCUX)
Tweedy, Browne Value Fund (TWEBX)Tweedy, Browne Worldwide High Dividend Yield Value Fund (TBHDX)
March 31, 2017

TWEEDY, BROWNE FUND INC.
Investment Adviser’s Letter to Shareholders . . . . . . . . . . . . . . . . . . . . . . . . . . . . . . . . . . . . . . I-1
Annual Report . . . . . . . . . . . . . . . . . . . . . . . . . . . . . . . . . . . . . . . . . . . . . . . . . . . . . . . . . . . . . . II-1
Tweedy, Browne Fund Inc.Investment Adviser’s Note . . . . . . . . . . . . . . . . . . . . . . . . . . . . . . . . . . . . . . . . . . . . . . . . II-2Expense Information . . . . . . . . . . . . . . . . . . . . . . . . . . . . . . . . . . . . . . . . . . . . . . . . . . . . . II-6
Tweedy, Browne Global Value FundPortfolio Highlights . . . . . . . . . . . . . . . . . . . . . . . . . . . . . . . . . . . . . . . . . . . . . . . . . . . . . . II-7Perspective on Assessing Investment Results . . . . . . . . . . . . . . . . . . . . . . . . . . . . . . . . . . II-8Portfolio of Investments . . . . . . . . . . . . . . . . . . . . . . . . . . . . . . . . . . . . . . . . . . . . . . . . . . . II-9Sector Diversification . . . . . . . . . . . . . . . . . . . . . . . . . . . . . . . . . . . . . . . . . . . . . . . . . . . . II-11Portfolio Composition . . . . . . . . . . . . . . . . . . . . . . . . . . . . . . . . . . . . . . . . . . . . . . . . . . . . II-11Schedule of Forward Exchange Contracts . . . . . . . . . . . . . . . . . . . . . . . . . . . . . . . . . . . . . II-11
Tweedy, Browne Global Value Fund II – Currency UnhedgedPortfolio Highlights . . . . . . . . . . . . . . . . . . . . . . . . . . . . . . . . . . . . . . . . . . . . . . . . . . . . . . II-14Perspective on Assessing Investment Results . . . . . . . . . . . . . . . . . . . . . . . . . . . . . . . . . . II-15Portfolio of Investments . . . . . . . . . . . . . . . . . . . . . . . . . . . . . . . . . . . . . . . . . . . . . . . . . . . II-16Sector Diversification . . . . . . . . . . . . . . . . . . . . . . . . . . . . . . . . . . . . . . . . . . . . . . . . . . . . II-17Portfolio Composition . . . . . . . . . . . . . . . . . . . . . . . . . . . . . . . . . . . . . . . . . . . . . . . . . . . . II-17
Tweedy, Browne Value FundPortfolio Highlights . . . . . . . . . . . . . . . . . . . . . . . . . . . . . . . . . . . . . . . . . . . . . . . . . . . . . . II-18Perspective on Assessing Investment Results . . . . . . . . . . . . . . . . . . . . . . . . . . . . . . . . . . II-19Portfolio of Investments . . . . . . . . . . . . . . . . . . . . . . . . . . . . . . . . . . . . . . . . . . . . . . . . . . . II-20Sector Diversification . . . . . . . . . . . . . . . . . . . . . . . . . . . . . . . . . . . . . . . . . . . . . . . . . . . . II-21Portfolio Composition . . . . . . . . . . . . . . . . . . . . . . . . . . . . . . . . . . . . . . . . . . . . . . . . . . . . II-21Schedule of Forward Exchange Contracts . . . . . . . . . . . . . . . . . . . . . . . . . . . . . . . . . . . . . II-21
Tweedy, Browne Worldwide High Dividend Yield Value FundPortfolio Highlights . . . . . . . . . . . . . . . . . . . . . . . . . . . . . . . . . . . . . . . . . . . . . . . . . . . . . . II-23Perspective on Assessing Investment Results . . . . . . . . . . . . . . . . . . . . . . . . . . . . . . . . . . II-24Portfolio of Investments . . . . . . . . . . . . . . . . . . . . . . . . . . . . . . . . . . . . . . . . . . . . . . . . . . . II-25Sector Diversification . . . . . . . . . . . . . . . . . . . . . . . . . . . . . . . . . . . . . . . . . . . . . . . . . . . . II-26Portfolio Composition . . . . . . . . . . . . . . . . . . . . . . . . . . . . . . . . . . . . . . . . . . . . . . . . . . . . II-26
Tweedy, Browne Fund Inc.Statements of Assets and Liabilities . . . . . . . . . . . . . . . . . . . . . . . . . . . . . . . . . . . . . . . . . II-27Statements of Operations . . . . . . . . . . . . . . . . . . . . . . . . . . . . . . . . . . . . . . . . . . . . . . . . . . II-28Statements of Changes in Net Assets . . . . . . . . . . . . . . . . . . . . . . . . . . . . . . . . . . . . . . . . II-29Financial Highlights . . . . . . . . . . . . . . . . . . . . . . . . . . . . . . . . . . . . . . . . . . . . . . . . . . . . . . II-31Notes to Financial Statements . . . . . . . . . . . . . . . . . . . . . . . . . . . . . . . . . . . . . . . . . . . . . . II-33Report of PricewaterhouseCoopers LLP, Independent Registered Public Accounting
Firm . . . . . . . . . . . . . . . . . . . . . . . . . . . . . . . . . . . . . . . . . . . . . . . . . . . . . . . . . . . . . . . . II-42Other Information . . . . . . . . . . . . . . . . . . . . . . . . . . . . . . . . . . . . . . . . . . . . . . . . . . . . . . . II-43Investment in the Fund by Managing Directors and Employees
of the Investment Adviser . . . . . . . . . . . . . . . . . . . . . . . . . . . . . . . . . . . . . . . . . . . . . . . II-43

TWEEDY, BROWNE FUND INC.
Investment Team
Olivier Berlage
Jay Hill, CFA
Dave Krasne, CFA Elliot H. Larner Sean McDonald, CFA
Amelia KohFrank H. Hawrylak, CFA
Andrew EwertRoger R. de BreeWilliam H. Browne*
Thomas H. Shrager* John D. Spears* Robert Q. Wyckoff, Jr.*
* Managing Director

This page left blank intentionally.

TWEEDY, BROWNE FUND INC.
Investment Adviser’s Letter to Shareholders
Out of clutter, find simplicity. From discord, find harmony. Inthe middle of difficulty lies opportunity.
– Albert Einstein
There is little doubt that valuation as a metric for guidinginvestment decision making has taken a back seat to otherfactors over the past several years. Explanations for this areplentiful, many of which we have mentioned in past letters. Aby no means complete list would include Central Bank bondbuying (remember quantitative easing) driving down interestrates to previously unheard of levels, which in turn increasedthe appeal of common stocks, a path both the European andJapanese central banks are continuing down to this day; over$2 trillion in stock buy backs in the U.S. alone over the pastfive years; Wall Street’s seemingly preternaturally optimisticdisposition; the massive shift of fund flows into passive indexvehicles which by design are nearly 100% invested, creatingsignificant incremental demand for equities; and theexplosion in data and the algorithms designed to exploit it,which, in our opinion, reduce the element of uncertaintyperhaps contributing to some of the “fast paced” investmentdecision making prevalent in markets today.
We are coming to the view that the availability andimmediacy of data may have reached the threshold ofdiminishing returns. It is not a given that more datanecessarily results in better judgment, and it just might play topeoples’ biases, which muddies decision making and leads todistortions in valuations. For example, the largest exchange-traded fund today, the SPDR S&P 500 ETF with assets ofapproximately $240 billion, has had daily turnover in itsshares that routinely approximates 5 – 10% of total sharesoutstanding. That translates into 100% plus turnover in itsshares every month. Perhaps this is the result of betteravailability of data and everyone is winning, but we are notyet convinced. People, including investors (who are rumoredto be grounded in numbers by their nature), have cognitivebiases, particularly when it comes to the prospect of making orlosing money; and the bias towards chasing short-term resultsmay well be at work in the turnover data of this ETF (whichwe have chosen only as a proxy for the point we are trying tomake). The history in markets has been for biases andsentiment to change, often in dramatic and unpredictableways. Currently, it would appear that the bias of the averageinvestor is towards being in the market despite a host ofgrowing risks, not the least of which is high valuations. Again,only as a proxy for the point we hope to make, the Vanguard500 Index Fund with $310 billion in assets has an averageprice/earnings ratio as of March 31, 2017 of 24x according toBloomberg, which equates to roughly a 4% earnings yield. Wehave much more to say on the active/passive topic later in ourletter.
As you know by now, we are in the business of owningbusinesses through the stock market when we believe thevaluations are supported by some fairly simple math andwhere we can feel reasonably confident (but never certain)
about future business prospects. In an industry such as ourswhere two to three years is a lifetime, life can sometimes feelvery short; and in an environment like the one we arecurrently in, characterized by investor confidence, we areoften among the performance laggards. But we have seen thisbefore, and the younger generation here at Tweedy will nodoubt see it again. The intellectual and emotional disciplinebuilt into this framework, coupled with the better probabilityof being right more often than wrong, remains, in our mind,persuasive.
Turning our attention to the most recent past, 2016proved to be a year of shock and awe in global politics and toa more limited degree in public equity markets. Who wouldhave guessed that the surprise decision by Great Britain towithdraw from the European Union would spark a rally inglobal equities that would gain considerable momentum afterthe unexpected election of Donald J. Trump, and continueunabated into the new year? Perhaps lightning really doeshave a tendency to strike twice. Once again, the pundits,pollsters and “bookies” got it completely wrong. Conventionalwisdom would have suggested that equity markets hatesurprises, but then again there is nothing conventional aboutwhat has been happening of late.
So how have we gotten to where we are today? Globalequity markets, which were off to a treacherous start at thebeginning of 2016, began to recover leading up to the periodjust before Brexit (June) when things got bumpy again. Therewas a good bit of volatility just before Brexit, and for a fewdays after, and then it was off to the races again as the marketsrecovered and pushed forward. Leading up to the election inNovember, markets seemed to be encouraged by the prospectof a Clinton victory and challenged by the prospect of aTrump victory. As with Brexit, the markets surprisinglysurged forward after Trump’s election, buoyed it seems by thepromise of fiscal stimulus to supplant the monetary largesse ofcentral bankers, which appeared to have run its course, atleast in the U.S. Some have suggested of late that the marketis merely climbing “a wall of worry,” or perhaps, as Jim Grantrecently suggested, “a wall of loathing.”
Whatever may be the case, in terms of investmentperformance, a relatively dismal first half of the 2016 calendaryear was followed by an aggressive move forward that hascontinued through March 31, 2017. As you would probablysuspect, given our value-based approach, most of our Funds(the Global Value Fund, Global Value Fund II and ValueFund) outperformed during the bumpier first half of the 2016calendar year, and each of our Funds underperformed duringthe second half, despite producing solid absolute returns.Global Value Fund, Global Value Fund II and the WorldwideHigh Dividend Yield Value Fund each outperformed theirbenchmark in the first quarter of 2017. All in all, even withthe markets’ fits and starts, our Funds made better thansatisfactory financial progress during the fiscal year whilecarrying cash reserves of between 9% and 15%.
I-1

What lies ahead for investors is anyone’s guess, anddespite the recent low levels of volatility as measured by theVIX (the Chicago Board Options Exchange Volatility Index),we have been heartened by the occasional bouts of volatilitywe’ve experienced in equity markets over the last 18 months,and the improvement, albeit marginal, in the opportunity setafforded to investors such as ourselves. That said, with thesurprising run-up in equity markets post the election,valuations, which were already high prior to the advance, forthe most part are now higher around the globe and, despitethe enthusiasm, one would have to concoct a set of“alternative facts” to conclude that there are a lot of bargainsto be found in public equity markets. Nevertheless,correlations have begun to break down, and when realityconfronts perception in the weeks and months ahead, wesuspect that the ride could once again get a bit bumpier,which has generally played into the hands of investors like us.In the interim, we intend to keep our noses to the grindstone,trying to ferret out under-valuation in what has been, in thevery near term, an increasingly difficult environment forbargain hunting – but an easier environment for selling stocksthat are trading at prices around or in excess of our estimatesof underlying business value.
Investment Performance
Presented below are the results of the Tweedy, BrowneFunds for various periods through March 31, 2017, withcomparisons to their respective benchmark indexes.
Period Ended3/31/17
Tweedy, BrowneGlobal Value Fund*
MSCI EAFEIndex
(Hedged to US$)(1)(2)†
MSCI EAFEIndex
(in US$)(1)(2)†
3 Months 6.79% 5.02% 7.25%
6 Months 8.75 12.64 6.48
1 Year 15.49 18.91 11.67
3 Years 3.62 7.43 0.50
5 Years 7.97 10.82 5.83
10 Years 4.32 2.73 1.05
15 Years 6.92 4.73 5.74
20 Years 8.37 5.29 4.62
Since Inception(6/15/93)(3) 9.44 6.02 5.09
Total Annual Fund Operating Expense Ratios as of 3/31/16 and 3/31/17 were 1.38%and 1.40%, respectively.††
Period Ended3/31/17
Tweedy, BrowneGlobal Value Fund II –Currency Unhedged*§
MSCI EAFEIndex
(in US$)(1)(2)†
3 Months 7.80% 7.25%
6 Months 6.94 6.48
1 Year 11.17 11.67
3 Years -0.42 0.50
5 Years 5.31 5.83
Since Inception(10/26/09)(3) 6.02 4.64
Total Annual Fund Operating Expense Ratios as of 3/31/16 and 3/31/17 were 1.40%and 1.42%, respectively.††
Period Ended3/31/17
Tweedy, BrowneValue Fund*§
MSCI WorldIndex
(Hedged to US$)(1)(5)†
S&P 500/MSCI WorldIndex(1)(4)(5)†¶
(Hedged to US$)
3 Months 4.66% 5.55% 5.55%
6 Months 8.87 10.69 10.69
1 Year 16.57 17.59 17.59
3 Years 3.37 8.55 8.55
5 Years 8.17 11.61 11.61
10 Years 5.23 4.90 4.90
15 Years 5.23 5.74 5.47
20 Years 6.88 6.36 6.63
Since Inception(12/8/93)(3) 8.34 7.40 8.26
Total Annual Fund Operating Expense Ratios as of 3/31/16 and 3/31/17 were 1.38%and 1.40%, respectively.††
¶ S&P 500 Index (12/8/93 – 12/31/06)/MSCI World Index (Hedged to US$) (1/1/07 –present)
Period Ended3/31/17
Tweedy, Browne WorldwideHigh Dividend
Yield Value Fund*§
MSCI WorldIndex(1)(5)
(in US$)†
3 Months 6.52% 6.38%
6 Months 7.54 8.35
1 Year 13.04 14.77
3 Years 0.18 5.52
5 Years 5.14 9.37
Since Inception(9/5/07)(3) 3.47 4.01
Total Annual Fund Operating Expense Ratios as of 3/31/16 and 3/31/17 were 1.38%and 1.40%, respectively.††
* The performance data shown represents past performance and isnot a guarantee of future results. Total return and principal valueof an investment will fluctuate so that an investor’s shares, whenredeemed, may be worth more or less than their original cost. Thereturns shown do not reflect the deduction of taxes that ashareholder would pay on Fund distributions or the redemption ofFund shares. Current performance may be lower or higher than theperformance data shown. Please visit www.tweedy.com to obtainperformance data that is current to the most recent month end, orto obtain after-tax performance information. Please refer tofootnotes 1 through 5 at the end of this letter for descriptions of theFunds’ indexes. Results are annualized for all periods greater thanone year.
† Investors cannot invest directly in an index, unlike an indexfund. Index returns are not adjusted to reflect the deductionof taxes that an investor would pay on distributions or the saleof securities comprising the index.
†† The Funds do not impose any front-end or deferred sales charges.However, the Global Value Fund, Global Value Fund II –Currency Unhedged and Worldwide High Dividend Yield ValueFund each impose a 2% redemption fee on redemption proceeds forredemptions or exchanges made less than 15 days after purchase.Performance data does not reflect the deduction of the redemptionfee, and, if reflected, the redemption fee would reduce anyperformance data quoted for periods of 14 days or less. The expenseratios shown above reflect the inclusion of acquired fund fees andexpenses (i.e., the fees and expenses attributable to investing cashbalances in money market funds) and may differ from those shownin the Funds’ financial statements.
I-2
§ The Global Value Fund II’s, the Value Fund’s and theWorldwide High Dividend Yield Value Fund’s performancedata shown would have been lower had certain fees andexpenses not been waived from October 26, 2009 throughDecember 31, 2014 (for the Global Value Fund II);December 8, 1993 through March 31, 1999 (for the ValueFund); and from September 5, 2007 through December 31,2013 (for the Worldwide High Dividend Yield Value Fund).
/ /
Our Fund Portfolios
Please note that individual companies discussed herein were held inone or more of our Funds during the fiscal year ended March 31,2017, but were not necessarily held in all four of our Funds. Referto footnote 6 at the end of the letter for the individual weightings ofthese companies in each Fund as of March 31, 2017.
Generally, when the ride gets a bit bumpy for equities as itdid last year, particularly in the first half of the calendar year,the steadier components of our Fund portfolios, i.e., consumerstaples and pharmaceuticals, have tended to produce the bestreturns; and such was briefly the case. But as the marketsregained their footing post-Brexit and gathered momentumafter the U.S. election, it was the more economicallysensitive, cyclical components of the Fund portfolios, i.e.,financials, industrials, and energy related holdings, that drovereturns. Diversification does have its strengths.
Some of our best returns in our Funds over the last yearwere produced by our bank and insurance holdings, driven inpart by prospects for less regulation by the new Trumpadministration, and for higher interest rates associated withfurther tightening by the Federal Reserve (the Fed). Higherinterest rates can lead to larger net interest margins for banksand generally better investment returns for our insuranceholdings, which in turn can lead to greater profitability. This,coupled with the possible relaxing of some of the Dodd-Frankregulations, was of particular benefit to the stock prices of ourU.S.-based banks, including Bank of New York Mellon andeven Wells Fargo, which rebounded in the face of its nearterm phantom account scandal. We also got a very nicerecovery in the prices of our two U.K.-based banks, StandardChartered and HSBC, which from a business mix perspectiveare overwhelmingly Asian banks. From its recent low onFebruary 11, 2016, Standard Chartered was up approximately97% through March 31, 2017. From all appearances, BillWinters and his new team at Standard Chartered have madereal strides toward returning the bank to a more profitablefooting. We also had strong returns in our two Singapore-based banks, DBS Group and United Overseas Bank, and inNational Bank of Canada. Despite these terrific returns overthe last year, our bank holdings for the most part remainreasonably valued, are well positioned in faster growing partsof the world, and, with the exception of Standard Chartered,currently pay us attractive dividend yields.
Much of the same held for our insurance holdings, whichadvanced very nicely during the year. Three of our long timeinsurance holdings, CNP Assurances, SCOR, and ZurichInsurance Group, delivered strong double-digit returns, as dida more recent holding, Canadian-based insurer and money
manager E-L Financial. Berkshire Hathaway, another longtime holding led by the “Oracle of Omaha,” continues todeliver excellent results. Despite the uncertainty associatedwith Warren Buffett’s and Charlie Munger’s succession, webelieve the fundamental value in Berkshire remains verystrong and solidly supports its current valuation withoutfactoring in much of a “Buffett premium.”
We were often asked over the past year why we had notchosen to invest in a number of eurozone banks, which on astatistical basis appeared to be quite cheap. Deutsche Bank,BNP Paribas, Societé Generale, Banco Santander and manyothers traded at times during the year at large discounts tobook value. No doubt this was partly due to uncertaintysurrounding Brexit, capital adequacy concerns, and pressureon profitability caused in part by the prospect for continuedlow to negative interest rates in Europe. While we took a hardlook at them, we simply felt we were not being adequatelycompensated for their associated risks, and relegated them toour “too hard” file. When investing in banks, which areinherently leveraged businesses, we tend to take aconservative approach. We like banks with financial strength,i.e., high equity-to-asset ratios, conservative loan growth,reliance on deposit-based financing, and multiple sources ofincome, including fee based income, that are trading at lowprices in relation to earnings and/or book value. While thestock prices of many of these banks appeared statisticallycheap when compared to book value, they did not meet anumber of the other tests. Some were undercapitalized, and/orhad aggressive loan growth; others relied on overnightwholesale loans for a good bit of their financing, and/or hadlower quality assets. While these statistically cheap banks mayturn out to be good performing investments, and they havecertainly rebounded of late, we just could not get comfortablewith them.
Our oil & gas related holdings also enjoyed strong priceperformance for the year as they rebounded aggressively withthe increase in oil prices; however, as we write, their shareprices have pulled back a bit with recent news regarding risingoil inventories and the resulting decline in oil prices. OPECannounced in late September that it would considerproduction cuts, which it, along with non-OPEC countrieslike Russia, ultimately agreed to in early December. Thishelped to fuel an increase in oil prices, which led to acontinuing rally in all of our oil & gas holdings includingHalliburton, MRC, Devon Energy, Royal Dutch and Total,among others. While there will no doubt be ongoing pricevolatility in our holdings as sentiment swings back and forthin the near term between concerns about high inventorylevels and growth in demand of over one million barrels a dayagainst a backdrop of relatively low excess capacity, webelieve the future for our oil & gas holdings continues to bepositive. This should particularly hold true should OPECcontinue to limit its production in an effort to balance oilmarkets. We are encouraged on this front by our suppositionthat the Saudis desire a constructive oil price environmentwhen they take their national oil company, Saudi Aramco,public in 2018.
There is also interesting evidence to suggest that throughtechnological advances, shale producers have been able to
I-3

significantly bring down their costs, allowing them to increasedrilling activity and well completions in what has been anextraordinarily challenging pricing environment. This couldmean that, even if oil prices continue to pull back a bit as theyear progresses, shale producers could still be able to be activein the oil patch. Both MRC and Halliburton feel their U.S.onshore businesses have bottomed, and are anticipatingsignificant increases in drilling activity in the year ahead.MRC gained considerable market share during the period ofdeclining oil prices as a number of its competitors went out ofbusiness, and also significantly reduced its net debt. There isno doubt that some, if not a good bit, of this positive outlookis already reflected in MRC’s and Halliburton’s current stockprices.
We also had nice returns during the year in several of ourconsumer (Diageo, Embotelladora Andina, Henkel, Unilever,British American Tobacco), industrial (AGCO, G4S,Ebara, BAE, Safran, Teleperformance) and health care(GlaxoSmithKline, Johnson & Johnson, Novartis, Roche)holdings, and in our sole mining company investment, copperminer Antofagasta, which rebounded nicely as copper pricesrose late in the year. It is also interesting and perhapssurprising to note that the most significant contribution to“local return” from a country in our portfolios came from theU.K. However, for our unhedged Funds, the Global ValueFund II and the Worldwide High Dividend Yield Value Fund,which are exposed to currency fluctuations, the collapsingBritish pound erased much of this return when translatedback into U.S. dollars. Political and economic cross currentsonce again led to volatility in a number of major currencies,including the British pound and the Japanese yen, amongothers, which had a significant impact on unhedged returns.On the other hand, the currency hedging policy of the GlobalValue Fund and the Value Fund protected their shareholdersfrom much of the return reduction occasioned by weakeningforeign currencies.
While most of the holdings in our Fund portfolios were upnicely for the year, there were a few that disappointed interms of their price performance. This included Verizon, thepremier U.S. wireless company; Pearson, the UK-basededucational publisher; and Coca-Cola Femsa, the Mexico-based Coca-Cola bottler. Despite having the highest qualitywireless network in the U.S., Verizon is facing near-termpricing pressure from two of its main competitors, Sprint andT-Mobile, and this has impacted its ability to meetexpectations in terms of earnings growth. That said, thecompany is trading a little over 12x 2017 estimated earningsper share, and currently paying us approximately a 5%dividend yield while we wait for value recognition in itsshares. We decided to sell our remaining shares of Pearsonduring the year as digital technology continues to disrupt theeducational publishing industry, and Coca-Cola Femsaremains a modest position in our Global Value Fund.
As you may have noticed over the last year or so, we havebeen building positions in several companies in South Korea,more specifically in the Korean car companies, HyundaiMotor and Kia, together with a position in Hyundai Mobis,an auto parts distributor that supplies both companies. In thenear term, the price performance of these companies has been
mixed, as growth has slowed in key markets, in part becausetheir product line has been somewhat out of fashion in thatthey have not had enough SUV choices during a period oflow oil prices. Kia’s stock price also appeared to be “trumped”by the company’s plans to expand production in Mexico forexport to the U.S. Korean equities over the last year also paida price in terms of increased volatility for the recent scandalsurrounding alleged payoffs made by “chaebol” leaders to afriend of the (now impeached and removed) South Koreanpresident, creating fears of political instability. As a result, wehave been able to get unusually attractive entry point pricesin these companies, paying less than six to seven timesearnings and approximately 60% of tangible book value forshares with dividend yields currently approaching 3%.Valuations like these cause us to “tremble with greed,”particularly since both companies are currently in the processof revamping their product line-up to include more SUVs.Furthermore, over the longer term, these companies havegained global market share as their quality and customersatisfaction ratings have soared, and they have the scale todevelop technology to compete if and when variousautonomous driving and electric applications take hold.Again, you never know, but these companies seem to us likereasonable bets in a diversified global or internationalportfolio.
More recently, we established a position in another SouthKorean company, LG Corp., which is a holding company thatowns interests in a group of chemical, cosmetics, telecom andelectronics businesses. There have been difficulties of late atseveral of its key affiliates. LG Electronics has had troubleswith its smart phone offerings; LG Chem is facing headwindsin the petrochemical cycle; and LG Household has issues toresolve with its cosmetics business in China. This, togetherwith retaliatory action by the Chinese government inresponse to South Korea’s agreement to work with the U.S. toestablish an anti-ballistic missile defense program, provided uswith a trading opportunity and what we feel is an attractiveentry price in LG Corp. Despite the near term uncertainty, webelieve the commercial issues are fixable and the politicalissues resolvable. At purchase, the shares were trading at ninetimes earnings, roughly 76% of book value and approximately60% of a conservative estimate of the company’s intrinsicvalue.
In addition to our recent investments in South Korea, wehave also established positions in a few Hong Kong-basedproperty related businesses, including a luxury hotel company,which owns the renowned Peninsula Hotel in Hong Kongamong a host of other properties around the world, and HangLung, a company that develops, owns and manages high-endshopping malls in Hong Kong and Mainland China. We weredrawn to Hang Lung in 2016 when its shares were beatendown by pessimism over a number of things, from adecelerating Chinese economy, to the anti-corruptioncrackdown in China that hurt demand for luxury goods, toincreased internet competition. Conservatively valuing thenet assets of the company using capitalization rates of betweenseven and eight percent, we arrived at a valuation that wasroughly double the price at which the shares were trading. It’snot as if the pessimism was without foundation, but in caseslike this where the share price becomes so untethered from
I-4
our estimate of intrinsic value, and the quality of thecompany’s management and assets appears to be sound, valueshould eventually win out. Even with no discernible near-term catalyst, time tends to be your friend.
We also built positions in several other companiesincluding Williams-Sonoma, a U.S.-based specialty retailerwith a significant on-line business; and Berendsen, a U.K.-based textile rental company. We purchased Williams-Sonoma (WSM) and Berendsen primarily for our highdividend yield strategy. WSM is a leading omni-channelspecialty retailer for home furnishings operating across eightdifferent brands, with the largest being Pottery Barn,Williams-Sonoma, and West Elm. WSM has one of thehighest e-commerce penetrations among retailers, and hashad solid margins in its direct-to-consumer business. Its strongbrands and huge customer database, which enables it to cross-market at a low cost, represent what we believe to besustainable competitive advantages, which have allowed it tocompound its intrinsic value, in our estimation, at over 8%for the last decade. At purchase it was trading at roughly a20% discount from our conservative estimate of its intrinsicvalue, had a dividend yield of approximately 3%, and anadditional 4% upside from prospective share repurchases, for atotal estimated shareholder yield of 7%.
Berendsen is a U.K.-based, but pan-European, textilerental business. The textile rental business is a business modelwe know well, having had a successful long-term investmentin UniFirst in the United States. Similar to many U.S.-baseduniform rental companies, Berendsen has high recurringrevenue, multi-year contracts, high customer renewal rates,no material customer concentration, and a good long-termrecord of compounding intrinsic value. It has maintained orincreased its dividend every year since 1990 and currentlyyields approximately 4% while maintaining a payout ratio ofroughly 50%. Moreover, insiders have recently been buyingthe stock. At purchase, Berendsen was trading atapproximately 13x current earnings and 11x enterprise value(“EV”) to earnings before interest, taxes and amortization(“EBITA”). Our purchase represented a discount of roughly15% from our conservative estimate of intrinsic value, basedupon observable real world acquisition multiples paid forsimilar businesses in Europe.
Finally, we recently made our first investment in adomestic Chinese company, Baidu, the dominant searchengine in China with an 80% market share, and nearly a 50%operating margin in search. Baidu’s highly profitable searchbusiness is currently being masked by several money-losingsubsidiaries. That, combined with concerns about recentslowing revenue growth (partly due to a medical scandal in2016, which impacted its search business) and some marketshare loss in online advertising to Tencent and Alibaba, hasgiven us an attractive pricing opportunity in its shares. Thatsaid, the company’s core search business has historicallyreported nearly 50% margins, relatively high barriers to entry,and should continue to benefit from the expanding Chineseonline advertising market, which is expected to grow at a20% rate annually. Based on conservative estimates of valuefor Baidu’s non-core businesses, we believe we are paying 9x2017 EBITA for their remaining core search engine
businesses. We believe this leaves significant upsideoptionality from the non-search businesses, several of whichare market leaders in important sectors such as online traveland online video.
With low interest rates around the world, and theperception that economic growth is on the rise, companies arebecoming more acquisitive. We are seeing this in our Fundportfolios. This is not surprising, as companies with firmfoundations of value often attract suitors or become buyers intheir own right. Unilever, Safran, and Akzo Nobel, threelong-term holdings, have become the subject of merger &acquisition activity over the last several months. Unilever andAkzo were both the recipients of buyout bids during the firstquarter of 2017; however, both rebuffed their suitors, KraftHeinz in the case of Unilever and PPG in the case of Akzo.We have spoken with the managements of both PPG andAkzo, encouraging them to continue to explore thepossibilities of a union, which we believe might lead to bettergrowth opportunities for the combined entity. To date, Akzohas refused to negotiate with PPG and, while the stock is up,it is trading well below the price offered by PPG. Both targets,Akzo and Unilever, have put forth new value enhancementstrategies in an effort to assuage their respective shareholders.
Safran, the French jet engine manufacturer and anotherof our core holdings, announced its intention to acquireZodiac, a French aerospace company that manufactures andsells safety systems and interior equipment such as seats,toilets, and galleys for aircraft. We feel this is an ill-advisedacquisition and have communicated our opinion directly tosenior management at the company. We believe the highprice that Safran is paying for this business, which hasrecently stumbled, would be better put to use in increasing itsdividend and opportunistically buying back its stock. We feelthat Safran should remain focused on its after-market partsbusiness, which we believe is an extraordinarily good business.
From time to time in these letters, we have brought toyour attention aspects of our value approach and processwhich we thought might be of interest. Below we examine theimpact of declining corporate tax rates and rising buy-outmultiples on calculations of intrinsic values and the discountswe apply thereto.
Lower Corporate Tax Rates and Implications forValuation
One of the primary ways we generate new investmentideas for further study is through the use of quantitativescreens that help us identify businesses which are statisticallycheap. We use a variety of different valuation screens,including price divided by book value per share (“P/B”), pricedivided by after-tax earnings per share (“P/E”), and EVdivided by earnings before interest and taxes (“EBIT”). Thereare advantages and disadvantages to every valuation ratio weuse to filter potential investment candidates. For instance, amajor disadvantage of the P/E ratio is that it does not allowfor a comparison of firms with significant differences in capitalstructure (i.e., debt leverage and cash on the balance sheet).Alternatively, while EV to EBIT does allow for comparison offirms with different capital structures, the ratio does not takeinto consideration differences in corporate tax rates. All
I-5

things being equal, a lower tax rate results in higher after-taxnet income (and free cash flow) for each dollar of EBIT. Thus,if given a choice between two identical companies in allrespects except for tax rate, we would choose the businesswith the lower tax rate.
Over the last decade, there has been a gradual globaltrend towards lower corporate tax rates, particularly inEurope. Political commentary in several countries suggeststhis trend will continue as governments seek to providestimuli for their local economies. For example, following theU.S. election, it appears that the federal U.S. corporateincome tax rate could be materially reduced from the currentrate of 35% to perhaps 15% or 20%. The U.K. has decided tolower corporate tax rates from 20% to 19%, beginning onApril 1, 2017. Italy has announced plans to cut the corporatetax rate from 27.5% to 24.0% in 2017. Thus, for theforeseeable future, corporate tax rates appear to be headinglower.
As corporate tax rates decline globally, we are puttingmore emphasis on screening for companies using a valuationmetric we call “owner earnings yield.” The owner earningsyield is calculated by dividing net operating profit after tax byenterprise value (NOPAT/EV). NOPAT is defined as EBIT ×(1 – effective tax rate). While no valuation metric is perfect,we believe that owner earnings yield allows us the ability tocompare companies with different capital structures (unlikeP/E) and different tax rates (unlike EV to EBIT).
Several years ago, one of our Managing Directors wouldroutinely calculate the owner earnings yield of each new ideaas a way to compare new idea candidates versus previous buydecisions. The “Happy Zone” in terms of an acceptablepurchase price was an owner earnings yield roughly between8% to 10%, which translates inversely into a debt free P/E ofbetween 12.5x and 10x per share. This after-tax yieldcompares very favorably to that available today in risk freeinstruments.
Of course, the efficacy of this technique will remainreliant on the sustainability of low corporate tax rates.Moreover, the owner earnings yield is just one of many toolswe use to help uncover potentially undervalued securities.
The Active versus Passive Debate Revisited
A number of additional voices have joined this debate inrecent months including Warren Buffett, perhaps the greatest“active” investor of all time. In his recent Berkshire Hathawayannual report, he postulated that getting an average returnnet of a very low fee is probably the best that the averageinvestor can expect, and a result that most active managerswould be unable to match or exceed net of their higher fees.He did acknowledge that he had met perhaps ten professionalinvestors over the years who were able to outperform the S&P500 net of their fees over the longer term, and no doubthundreds if not thousands of others he had not met that mayhave also added value, relative to the S&P 500. However, healso made the point that because outperformance breedsgrowth in assets under management, which can act as ananchor on future investment returns, the average investor’sbest bet was probably a low cost index fund.
While Warren Buffett’s point of view is shared by many,particularly in light of the underperformance of activemanagers in recent years, a number of other well knowninvestors have suggested a bubble might be brewing in passiveinvestment strategies, including so called “smart beta” (or“factor based”) strategies. After all, there is very little in theway of price discovery in passive index vehicles and newcontributions are allocated simply on the basis of the respectivemarket capitalizations of their constituent members. And yetthe money continues to pour in. For example, according toMorningstar, in 2016 approximately $340 billion flowed out ofU.S.-based actively managed funds, while nearly $505 billionflowed into U.S.-based passively managed vehicles. Many, ifnot most, of the underlying equity constituents of U.S.-basedpassively managed funds are now trading at high valuations.Seth Klarman, the highly respected hedge fund investor, in hisrecent annual investment letter pointed out that recentmassive flows into passive “market efficient” strategies hasironically resulted in price distortions and greater marketinefficiency that can be exploited by active investors. Even RobArnott, credited by many to be one of the founders of smartbeta investing, has recently warned of the inflated valuations ofsmart beta index and ETF vehicles, and has even launched anew dynamic multi-factor strategy that will “de-emphasize”more expensive factors.
In thinking more about the increasing popularity ofstatistical, factor based investing (smart beta), we arereminded of the reference Charlie Munger (Warren Buffett’spartner at Berkshire) has made in the past to the “man withthe hammer syndrome.” He referenced this syndrome in aspeech at the University of California in 2003 in support ofwhat he called the “fatal unconnectedness of academicdisciplines in economics.” The reference was apparently takenfrom a folk saying which suggested that a man with only ahammer views every problem as a nail. To quote Mungerdirectly from that speech:
Another version of this man with a hammer syndrome –this is terrible not only in economics, but practicallyeverywhere else, including business; it’s really terrible inbusiness – and that is you’ve got a complex system and itspews out a lot of wonderful numbers that enable you tomeasure some factors. But there are other factors that areterribly important. There’s no precise numbering whereyou can put to these factors. You know they’reimportant, you don’t have the numbers. Well practicallyeverybody just overweights the stuff that can benumbered, because it yields to the statistical techniquesthey’re taught in places like this, and doesn’t mix in thehard-to-measure stuff that may be more important. Thatis a mistake I’ve tried all my life to avoid, and I have noregrets for having done that.
Security analysis is a complex system if there ever wasone. In our view, it is not something that can be reduced to ahandful of numbers – rather it entails a multitude of inputs,both soft (qualitative) and hard (quantitative). As Mungerfurther cautioned in his speech, a craving for physics-like falseprecision does nothing but get you into trouble. As more andmore money flows into these factor based strategies, distortingvaluations, the efficacy of the factors can be compromised,
I-6
reducing the approach to something similar to a game of“whack-a-mole.” While we have great respect for some of thepurveyors of smart beta investing, we do not believe factorbased investing is the most comprehensive approach toconfronting the daunting complexity associated withinvestment decision-making. As Einstein said, “Everythingshould be made as simple as possible, but not simpler.”
For those of you interested in drilling down on this topic,we would refer you not only to Munger’s speech, but also to arecent CFA Institute study entitled “Facts about FormulaicValue Investing” in which U-Wen Kok, Jason Ribando andRichard Sloan found there was “little compelling evidencethat a strategy of buying US equities that seem underpriced inlight of simple fundamental-to-price ratios provides superiorinvestment performance.” Furthermore, they concluded that“quantitative investment strategies based on such ratios arenot good substitutes for value-investing strategies that use acomprehensive approach in identifying underpricedsecurities.”
We came across another interesting study in Februaryproduced by DALBAR, the well known financial servicesmarket research firm. DALBAR has found over the years thatinvestor behavior, reflected in decisions of “when and howmuch to invest or how much to withdraw from investments,”has a material long-term effect on the returns investorsactually earn. For example, investors have a different returnexperience depending on when they purchase and when theysell their interest in a fund. DALBAR’s calculation of“investor return” measures the average return experience ofall investors in a fund over a given period of time taking intoconsideration their comings and goings. Think of it as adollar-weighted return as opposed to a time-weighted return.Since emotion can drive many investors in and out of funds atinopportune times, these so called “investor returns” differgreatly among individuals and are, on average, invariablylower than the published real returns of mutual funds, be theyactively managed or passively managed.
Since there has been a significant shift toward passiveinvesting over the last 15 years, DALBAR decided to studythe “investor returns” of U.S. index funds as compared to the“investor returns” of actively managed funds over this period.What they found was interesting. While the “real returns” ofindex funds on average were found to exceed those of activelymanaged funds, the “investor returns” of actively managedfunds exceeded those of index funds over the 15-year periodending December 31, 2016. This led DALBAR to concludethat over longer time periods the historical performanceadvantage of passive investments is eroded by behavioralinfluences. For periods greater than 5 years, actively managedfunds produced investor returns that were superior to those ofindex funds. For periods shorter than 5 years, index funds hadthe advantage.
This should be somewhat reassuring to “active” financialadvisors who for one reason or another may have failed tooutperform index funds over long measurement periods. If youhave been able to keep your investors invested over time – welike to call it ‘keeping them on the bus’ – the DALBAR datawould suggest you may very well have provided yourshareholders with a return advantage that is significant when
compared to the return they would have receivedindependently coming and going from an index fund.
As we said in our semi-annual letter to shareholders backin the Fall of last year, an index beating record, particularly ifit is a long record, can lead to increases in wealth well beyondthat produced by indexes, due to the power of compoundarithmetic. The Global Value Fund, which is the largestsingle fund at Tweedy, Browne (approximately $9.6 billion),has produced an average annual return since its inceptionnearly 24 years ago that is 342 basis points (3.42%) greaterthan the returns of the MSCI EAFE Index (Hedged to USD)and 435 basis points (4.35%) better than the same indexunhedged. An investor investing $100,000 in the GlobalValue Fund at the time of its inception through March 31,2017 would have accumulated approximately $855,167,which is more than double the $402,351 that would havebeen accumulated from an investment in the hedged MSCIEAFE Index. (Of course, past performance does not guaranteefuture results and an investor cannot invest directly in anindex.)
While we have great admiration for people such as JackBogle and Warren Buffett, and perhaps would agree that, interms of “real” returns, active management is a loser’s gamefor most, it is not a loser’s game for all. In a recent interviewwith Bloomberg, Larry Fink, the founder and chairman ofBlackRock, expressed a similar sentiment:
I do subscribe to the belief that investing is no differentfrom baseball. Let’s say you have a thousand baseballplayers. The majority hit .250. We’ll have 45 who hit.300 and we’ll have 10 to 15 who can hit consistentlyover .300. I don’t believe investing is much different…
The records of many pure adherents to BenjaminGraham’s value based approach over the years are proof ofthis. At the end of the day, we are comfortable with what weown, the risks we are taking, and the long-term returns wehave produced for our shareholders, and this has allowed us tostay the course – which is perhaps the most important thingwhen it comes to building wealth. While there are noguarantees in the investment business, we remain optimisticand are “tied to the mast,” with over a billion dollars of ourown money – that of our current and retired managingdirectors, employees and their families – invested in portfolioscombined with or similar to those that our shareholders own,including over $200 million in our Funds.
Environment, Social, and Governance Considerations(ESG)
Many institutional clients, shareholders, and consultantsare increasingly inquiring about the extent to which ESGfactors play a role in our investment decision-making process.We suspect this is driven in large part by well intentioneddesires to incentivize ethical and responsible corporatebehavior and the good faith belief that these factors couldpositively impact performance over time.
While we applaud the spirit of ESG principles, as aninvestment adviser to a wide variety of clients, we feel that wemust remain primarily focused on producing attractive riskadjusted returns for our clients. Given the all encompassing
I-7
nature of our research process, corporate behavior, good orbad, is one of a plethora of factors examined when trying toassess the intrinsic value and future prospects of a potentialinvestment. To the extent that our research reveals that thelack of adherence to one or more ESG factors is likely toimpair the corporate business model and in turn futurevaluation prospects, that could become determinative in ourdecision to own or continue to hold the security.
While environmental and social concerns have playedless of a role in our process, our investment decision-makinghas from time to time over the years been significantlyimpacted by corporate governance concerns. While we haveno desire to become a so-called “activist manager,” we havenot hesitated to defend our shareholders’ interests whennecessary. This has involved issues such as responsible andintelligent capital allocation, management compensation,board composition, merger and acquisition activity and votingrestrictions, among others.
Looking Forward
It may be said, with some approximation to the truth,that investment is grounded on the past whereasspeculation looks primarily to the future, but thisstatement is far from complete. Both investment andspeculation must meet the test of the future; they aresubject to its vicissitudes and are judged by its verdict. Butwhat we have said about the analyst and the futureapplies equally well to the concept of investment. Forinvestment, the future is essentially something to beguarded against rather than be profited from. If the futurebrings improvement, so much the better; but investmentas such cannot be founded in any important degree uponthe expectation of improvement. Speculation, on theother hand, may always properly-and often soundly-derive its basis and its justification from prospectivedevelopments that differ from past performance.
– Benjamin Graham, Security Analysis
We are now, according to market observers, eight yearsinto what has been reported as the second longest stockmarket advance in history. The S&P 500 Index has morethan tripled from its lows in March of 2009. Equityvaluations, which were already high prior to the post electionadvance, for the most part, have climbed steadily higheraround the globe, and appear to be discounting anextraordinarily attractive environment for corporate earningspower going forward. With market indexes (S&P 500, EAFEand World) now trading north of 21x trailing earnings,investors are currently receiving roughly a 4.7% earnings yieldon the price they are paying for the market. In comparison, atriple A bond in the form of a 10-year U.S. Treasury notetoday yields approximately 2.3%, but that yield may very wellgo higher in the near term as the Fed continues the process of“normalizing” interest rates from the anomalistic low rates ofthe last several years. On the corporate side, a triple A ratedJohnson & Johnson 10-year bond today yields a little over3%. The differential between today’s equity earnings yield andrising risk free bond yields is not the kind of spread, or“margin of safety,” that Ben Graham would have found
enticing, nor does it suggest the kind of returns going forwardthat we have enjoyed during this bull run. If interest rates doindeed normalize in the next few years and P/Es remain attoday’s levels, this modest spread virtually disappears. AsGraham said years ago in his tome, Security Analysis,investors “are buying earnings power not much greater thanthe bond-interest rate, without the extra protection affordedby a prior claim.”
Speculation regarding growth in future earnings powerfueled by the expectation of government action to lowercorporate and personal income taxes, cut regulation, andincrease infrastructure spending may well turn out to be right,but it remains just that for the time being: speculation. Withthe increase in animal spirits unleashed since the election andthe run-up in equity prices, it would appear that the cork mayindeed be coming off the champagne bottle. For evidence ofthis, one would have to look no further than the recent publicoffering of Snap Inc. (SNAP), the company that ownsSnapchat, the popular social media application. At its $17offering price, SNAP was valued at $24 billion despite losingover $500 million last year. On its first day of trading, thestock closed up 44% from its initial offering price, closing at$24.48 for an end of day valuation greater than $34 billion.We, of course, had similar concerns about Facebook’svaluation when it went public years ago, and those concernshave, at least to date, been proven to be unwarranted with thebenefit of hindsight. It’s impossible to know whether SNAPwill enjoy a similar arc of financial success; however, we doknow that it does not fit within our price-driven investmentframework.
This increase in animal spirits has made bargain huntingchallenging. When we screen for new securities today usingvaluation metrics that we deem to be reasonable and reliable,we find the fewest number of qualifying stocks in over adecade, and those that show up as quantitatively attractiveare generally in industries with secular problems and highuncertainty such as retail (Amazon risk), publicly traded assetmanagers, auto parts, homebuilding, airlines, and preciousmetals.
The arguments for equities today invariably stress relativevaluations, and a cheery consensus regarding future growth incorporate earnings. You constantly hear that stocks are cheapwhen compared to low yielding bonds, and that buying stockswith some kind of dividend yield is better than owning cashreserves with little or no yield. And this despite the fact thatwhen considered on a P/E equivalent basis, stocks and bondstoday are trading at 21x and 40x their earnings, respectively.The acronym “TINA” (there is no alternative) is sometimesused to describe the rationale for the flight into equities.
In contrast to today’s relative thinking, we employ anabsolute valuation framework and have avoided thetemptation to stretch our valuation multiples in light ofartificially low interest rates, which we deem to be temporaryrather than permanent. We are perfectly happy to wait foropportunity, rather than purchase securities that, in our view,do not have an adequate “margin of safety.” All of that said,when it comes to market leadership, the screw does appear tobe turning, albeit ever so slowly, in our direction. We havehad several bouts of volatility over the last year and a half as
I-8
correlations have begun to break down, and investors appearto have developed a hair trigger mentality that can bespooked by an undesirable headline, earnings report, orchange in regulatory posture. This has allowed us to takeadvantage of buying opportunities and incrementally putsome of our cash reserves to work in existing holdings and afew new ideas. While your crystal ball is no doubt as good orbetter than ours, with the Federal Reserve charting a path foradditional interest rate increases and with inflationaryexpectations on the rise, we may be nearing an inflectionpoint in markets that could likely lead to additional volatilityin the weeks and months ahead; and if that does indeed bearout, we hope to take full advantage of the pricingopportunities that fall out from that turbulence. In theinterim, we remain comforted that on average the stocks inour Fund portfolios, while not cheap, appear to trade atreasonable business valuations given their growth prospectsand cash yields. In addition, our Fund portfolios are for themost part well diversified by issue, industry and country, andgenerally carry a healthy dollop of cash reserves that shouldallow us to take meaningful advantage of any inevitablebumps in the road.
Thank you for investing with us, and for your continuedconfidence. We work hard to earn and keep your trust, andwe believe it is critical to our mutual success.
Sincerely,
TWEEDY, BROWNE COMPANY LLC
William H. BrowneThomas H. ShragerJohn D. SpearsRobert Q. Wyckoff, Jr.Managing Directors
April 2017
Footnotes:(1) Indexes are unmanaged, and the figures for the indexes
shown include reinvestment of dividends and capital gainsdistributions and do not reflect any fees or expenses.Investors cannot invest directly in an index.
(2) MSCI EAFE Index is a free float-adjusted, marketcapitalization weighted index that is designed to measure theequity market performance of developed markets, excludingthe US and Canada. The MSCI EAFE Index (in US$)reflects the return of the MSCI EAFE Index for a US dollarinvestor. The MSCI EAFE Index (Hedged to US$)consists of the results of the MSCI EAFE Index hedged100% back into US dollars and accounts for interest ratedifferentials in forward currency exchange rates. Results forboth indexes are inclusive of dividends and net of foreignwithholding taxes.
(3) Inception dates for the Global Value Fund, Global ValueFund II – Currency Unhedged, Value Fund andWorldwide High Dividend Yield Value Fund are June 15,1993, October 26, 2009, December 8, 1993, and
September 5, 2007, respectively. Prior to 2004,information with respect to the MSCI EAFE and MSCIWorld Indexes used was available at month end only;therefore, the since-inception performance of the MSCIEAFE Indexes quoted for the Global Value Fund reflectsperformance from May 31, 1993, the closest month end tothe Global Value Fund’s inception date, and the sinceinception performance of the MSCI World Index quoted forthe Value Fund reflects performance from November 30,1993, the closest month end to the Value Fund’s inceptiondate.
(4) The S&P 500/MSCI World Index (Hedged to US$) is acombination of the S&P 500 Index and the MSCI WorldIndex (Hedged to US$), linked together by Tweedy,Browne Company, and represents the performance of theS&P 500 Index for the periods 12/8/93 – 12/31/06 and theperformance of the MSCI World Index (Hedged to US$),beginning 1/01/07 and thereafter. For the period from theFund’s inception through 2006, the Fund chose the S&P500 as its benchmark. Starting in mid-December 2006, theFund’s investment mandate changed from investing at least80% of its assets in US securities to investing no less thanapproximately 50% in U.S securities, and the Fund chosethe MSCI World Index (Hedged to US$) as its benchmarkstarting January 1, 2007. Effective July 29, 2013, theValue Fund removed the 50% requirement, and continuesto use the MSCI World Index (Hedged to US$) as itsbenchmark. The S&P 500 Index is a market capitalizationweighted index composed of 500 widely held common stocksthat assumes the reinvestment of dividends. The index isgenerally considered representative of US large capitalizationstocks.
(5) The MSCI World Index is a free float-adjusted marketcapitalization weighted index that is designed to measure theequity market performance of developed markets. TheMSCI World Index (in US$) reflects the return of thisindex for a US dollar investor. The MSCI World Index(Hedged to US$) consists of the results of the MSCI WorldIndex with its foreign currency exposure hedged 100% backinto US dollars. The index accounts for interest ratedifferentials in forward currency exchange rates. Results foreach index are inclusive of dividends and net of foreignwithholding taxes.
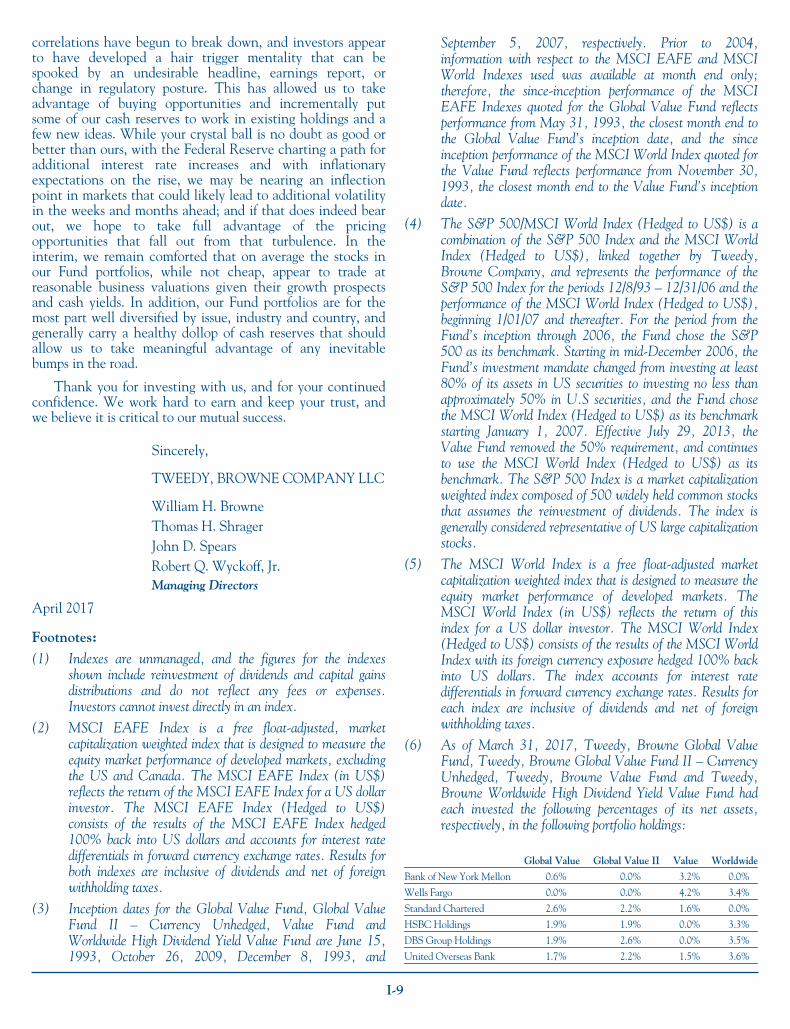
(6) As of March 31, 2017, Tweedy, Browne Global ValueFund, Tweedy, Browne Global Value Fund II – CurrencyUnhedged, Tweedy, Browne Value Fund and Tweedy,Browne Worldwide High Dividend Yield Value Fund hadeach invested the following percentages of its net assets,respectively, in the following portfolio holdings:
Global Value Global Value II Value Worldwide
Bank of New York Mellon 0.6% 0.0% 3.2% 0.0%
Wells Fargo 0.0% 0.0% 4.2% 3.4%
Standard Chartered 2.6% 2.2% 1.6% 0.0%
HSBC Holdings 1.9% 1.9% 0.0% 3.3%
DBS Group Holdings 1.9% 2.6% 0.0% 3.5%
United Overseas Bank 1.7% 2.2% 1.5% 3.6%
I-9

Global Value Global Value II Value Worldwide
National Bank of Canada 0.7% 0.0% 0.0% 0.0%
CNP Assurances 1.5% 1.1% 1.3% 1.2%
SCOR 2.4% 4.4% 0.0% 3.8%
Zurich Insurance Group 2.3% 2.0% 1.8% 4.2%
E-L Financial 0.6% 0.6% 0.0% 0.0%
Berkshire Hathaway 1.1% 0.0% 4.4% 0.0%
Halliburton 1.0% 1.0% 1.3% 0.0%
MRC Global 0.0% 0.0% 1.6% 0.0%
Devon Energy 0.5% 0.0% 0.0% 0.0%
Royal Dutch Shell 2.1% 1.4% 3.5% 4.4%
Total 2.5% 3.1% 3.6% 4.3%
Diageo 2.3% 2.8% 0.0% 4.6%
Embotelladora Andina 0.4% 1.0% 0.0% 0.0%
Henkel 2.3% 1.6% 1.6% 0.0%
Unilever 2.1% 2.3% 3.3% 0.0%
British American Tobacco 0.9% 0.0% 0.0% 0.0%
AGCO 0.4% 0.9% 0.0% 0.0%
G4S 1.8% 2.7% 0.0% 3.1%
Ebara 0.7% 1.0% 0.0% 0.0%
BAE Systems 1.1% 1.2% 0.0% 0.8%
Safran 3.4% 3.5% 0.0% 1.9%
Teleperformance 0.8% 0.9% 0.0% 0.0%
GlaxoSmithKline 2.6% 0.0% 0.0% 3.7%
Johnson & Johnson 1.1% 2.8% 2.8% 2.5%
Novartis 2.5% 3.4% 3.3% 3.8%
Roche Holding 2.9% 4.1% 3.5% 4.1%
Antofagasta 1.7% 0.0% 1.5% 0.0%
Verizon Communications 0.0% 0.0% 0.0% 3.7%
Pearson 0.0% 0.0% 0.0% 0.0%
Coca-Cola Femsa 0.4% 0.0% 0.0% 0.0%
Hyundai Motor 2.2% 2.2% 2.2% 0.0%
Kia Motors 1.4% 1.5% 1.5% 0.0%
Hyundai Mobis 0.5% 0.6% 0.0% 0.0%
LG Corp 0.5% 0.6% 0.6% 0.0%
Hang Lung Group 0.3% 0.0% 0.0% 0.0%
Williams-Sonoma 0.0% 0.0% 0.0% 1.2%
Berendsen 0.0% 0.0% 0.0% 0.8%
UniFirst 0.0% 0.0% 0.0% 0.0%
Baidu 1.4% 1.4% 1.5% 0.0%
Akzo Nobel 1.9% 1.3% 0.0% 0.0%
Mention of a specific security should not be considered arecommendation to buy or a solicitation to sell that security.Holdings are subject to change at any time.
The views expressed represent the opinions of Tweedy,Browne Company LLC as of the date of this letter, are notintended as a forecast or guarantee of future results, and aresubject to change without notice.
Current and future portfolio holdings are subject to risk.Investing in foreign securities involves additional risks beyondthe risks of investing in US securities markets. These risksinclude currency fluctuations; political uncertainty; differentaccounting and financial standards; different regulatoryenvironments; and different market and economic factors in
various non-US countries. In addition, the securities of small,less well known companies may be more volatile than those oflarger companies. Value investing involves the risk that themarket will not recognize a security’s intrinsic value for a longtime, or that a security thought to be undervalued mayactually be appropriately priced when purchased. Dividendsare not guaranteed, and a company currently paying dividendsmay cease paying dividends at any time. Diversification doesnot guarantee a profit and does not protect against a loss in adeclining market. Please refer to the Funds’ prospectus for adescription of risk factors associated with investments insecurities which may be held by the Funds.
Although the practice of hedging against currencyexchange rate changes utilized by the Tweedy, Browne GlobalValue Fund and Tweedy, Browne Value Fund reduces the riskof loss from exchange rate movements, it also reduces theability of the Funds to gain from favorable exchange ratemovements when the US dollar declines against thecurrencies in which the Funds’ investments are denominatedand in some interest rate environments may impose out-of-pocket costs on the Funds.
Stocks and bonds are subject to different risks. In general,stocks are subject to greater price fluctuations and volatilitythan bonds and can decline significantly in value in responseto adverse issuer, political, regulatory, market or economicdevelopments. Unlike stocks, if held to maturity, bondsgenerally offer to pay both a fixed rate of return and a fixedprincipal value. Bonds are subject to interest rate risk (asinterest rates rise bond prices generally fall), the risk of issuerdefault, issuer credit risk, and inflation risk, although U.S.Treasuries are backed by the full faith and credit of the U.S.Government.
Price/earnings (or P/E) ratio is a comparison of thecompany’s closing stock price and its trailing 12-monthearnings per share.
The Chicago Board Options Exchange (CBOE) VolatilityIndex (the VIX) shows the market’s expectation of 30-dayvolatility. It is constructed using the implied volatilities of awide range of S&P 500 index options.
This letter contains opinions and statements oninvestment techniques, economics, market conditions andother matters. There is no guarantee that these opinions andstatements will prove to be correct, and some of them areinherently speculative. None of them should be relied upon asstatements of fact.
Tweedy, Browne Global Value Fund, Tweedy, BrowneGlobal Value Fund II – Currency Unhedged, Tweedy,Browne Value Fund, and Tweedy, Browne Worldwide HighDividend Yield Value Fund are distributed by AMGDistributors, Inc., Member FINRA/SIPC.
This material must be preceded or accompanied by a prospectus forTweedy, Browne Fund Inc.
I-10

TWEEDY, BROWNE FUND INC.
Tweedy, Browne Global Value FundTweedy, Browne Global Value Fund II – Currency UnhedgedTweedy, Browne Value FundTweedy, Browne Worldwide High Dividend Yield Value Fund
ANNUAL REPORT
March 31, 2017
II-1

TWEEDY, BROWNE FUND INC.
Investment Adviser’s Note (Unaudited)
Investment Performance
Presented below are the results of the Tweedy, BrowneFunds for various periods through March 31, 2017, withcomparisons to their respective benchmark indexes.
Period Ended3/31/17
Tweedy, BrowneGlobal Value Fund*
MSCI EAFEIndex
(Hedged to US$)(1)(2)†
MSCI EAFEIndex
(in US$)(1)(2)†
3 Months 6.79% 5.02% 7.25%
6 Months 8.75 12.64 6.48
1 Year 15.49 18.91 11.67
3 Years 3.62 7.43 0.50
5 Years 7.97 10.82 5.83
10 Years 4.32 2.73 1.05
15 Years 6.92 4.73 5.74
20 Years 8.37 5.29 4.62
Since Inception(6/15/93)(3) 9.44 6.02 5.09
Total Annual Fund Operating Expense Ratios as of 3/31/16 and 3/31/17 were 1.38%and 1.40%, respectively.††
Period Ended3/31/17
Tweedy, BrowneGlobal Value Fund II –Currency Unhedged*§
MSCI EAFEIndex
(in US$)(1)(2)†
3 Months 7.80% 7.25%
6 Months 6.94 6.48
1 Year 11.17 11.67
3 Years -0.42 0.50
5 Years 5.31 5.83
Since Inception(10/26/09)(3) 6.02 4.64
Total Annual Fund Operating Expense Ratios as of 3/31/16 and 3/31/17 were 1.40%and 1.42%, respectively.††
Period Ended3/31/17
Tweedy, BrowneValue Fund*§
MSCI WorldIndex
(Hedged to US$)(1)(5)†
S&P 500/MSCI WorldIndex(1)(4)(5)†¶
(Hedged to US$)
3 Months 4.66% 5.55% 5.55%
6 Months 8.87 10.69 10.69
1 Year 16.57 17.59 17.59
3 Years 3.37 8.55 8.55
5 Years 8.17 11.61 11.61
10 Years 5.23 4.90 4.90
15 Years 5.23 5.74 5.47
20 Years 6.88 6.36 6.63
Since Inception(12/8/93)(3) 8.34 7.40 8.26
Total Annual Fund Operating Expense Ratios as of 3/31/16 and 3/31/17 were 1.38%and 1.40%, respectively.††
¶ S&P 500 Index (12/8/93 – 12/31/06)/MSCI World Index (Hedged to US$) (1/1/07 –present)
Period Ended3/31/17
Tweedy, Browne WorldwideHigh Dividend
Yield Value Fund*§
MSCI WorldIndex(1)(5)
(in US$)†
3 Months 6.52% 6.38%
6 Months 7.54 8.35
1 Year 13.04 14.77
3 Years 0.18 5.52
5 Years 5.14 9.37
Since Inception(9/5/07)(3) 3.47 4.01
Total Annual Fund Operating Expense Ratios as of 3/31/16 and 3/31/17 were 1.38%and 1.40%, respectively.††
* The performance data shown represents past performance and isnot a guarantee of future results. Total return and principal valueof an investment will fluctuate so that an investor’s shares, whenredeemed, may be worth more or less than their original cost. Thereturns shown do not reflect the deduction of taxes that ashareholder would pay on Fund distributions or the redemption ofFund shares. Current performance may be lower or higher than theperformance data shown. Please visit www.tweedy.com to obtainperformance data that is current to the most recent month end, orto obtain after-tax performance information. Please refer tofootnotes 1 through 5 at the end of this letter for descriptions of theFunds’ indexes. Results are annualized for all periods greater thanone year.
† Investors cannot invest directly in an index, unlike an indexfund. Index returns are not adjusted to reflect the deductionof taxes that an investor would pay on distributions or the saleof securities comprising the index.
†† The Funds do not impose any front-end or deferred sales charges.However, the Global Value Fund, Global Value Fund II –Currency Unhedged and Worldwide High Dividend Yield ValueFund each impose a 2% redemption fee on redemption proceeds forredemptions or exchanges made less than 15 days after purchase.Performance data does not reflect the deduction of the redemptionfee, and, if reflected, the redemption fee would reduce anyperformance data quoted for periods of 14 days or less. The expenseratios shown above reflect the inclusion of acquired fund fees andexpenses (i.e., the fees and expenses attributable to investing cashbalances in money market funds) and may differ from those shownin the Funds’ financial statements.
§ The Global Value Fund II’s, the Value Fund’s and theWorldwide High Dividend Yield Value Fund’s performancedata shown would have been lower had certain fees andexpenses not been waived from October 26, 2009 throughDecember 31, 2014 (for the Global Value Fund II);December 8, 1993 through March 31, 1999 (for the ValueFund); and from September 5, 2007 through December 31,2013 (for the Worldwide High Dividend Yield Value Fund).
II-2

/ /
Our Fund Portfolios
Please note that individual companies discussed herein were held inone or more of our Funds during the fiscal year ended March 31,2017, but were not necessarily held in all four of our Funds. Seethe attached Portfolios of Investments for the Funds’ holdings ineach of these companies as of March 31, 2017.
Generally, when the ride gets a bit bumpy for equities as itdid last year, particularly in the first half of the calendar year,the steadier components of our Fund portfolios, i.e., consumerstaples and pharmaceuticals, have tended to produce the bestreturns; and such was briefly the case. But as the marketsregained their footing post-Brexit and gathered momentumafter the U.S. election, it was the more economicallysensitive, cyclical components of the Fund portfolios, i.e.,financials, industrials, and energy related holdings, that drovereturns. Diversification does have its strengths.
Some of our best returns in our Funds over the last yearwere produced by our bank and insurance holdings, driven inpart by prospects for less regulation by the new Trumpadministration, and for higher interest rates associated withfurther tightening by the Federal Reserve (the Fed). Higherinterest rates can lead to larger net interest margins for banksand generally better investment returns for our insuranceholdings, which in turn can lead to greater profitability. This,coupled with the possible relaxing of some of the Dodd-Frankregulations, was of particular benefit to the stock prices of ourU.S.-based banks, including Bank of New York Mellon andeven Wells Fargo, which rebounded in the face of its nearterm phantom account scandal. We also got a very nicerecovery in the prices of our two U.K.-based banks, StandardChartered and HSBC, which from a business mix perspectiveare overwhelmingly Asian banks. From its recent low onFebruary 11, 2016, Standard Chartered was up approximately97% through March 31, 2017. From all appearances, BillWinters and his new team at Standard Chartered have madereal strides toward returning the bank to a more profitablefooting. We also had strong returns in our two Singapore-based banks, DBS Group and United Overseas Bank, and inNational Bank of Canada.
Much of the same held for our insurance holdings, whichadvanced very nicely during the year. Three of our long timeinsurance holdings, CNP Assurances, SCOR, and ZurichInsurance Group, delivered strong double-digit returns, as dida more recent holding, Canadian-based insurer and moneymanager E-L Financial. Berkshire Hathaway, another longtime holding led by the “Oracle of Omaha,” continues todeliver excellent results.
Our oil & gas related holdings also enjoyed strong priceperformance for the year as they rebounded aggressively withthe increase in oil prices; however, as we write, their shareprices have pulled back a bit with recent news regarding risingoil inventories and the resulting decline in oil prices. OPECannounced in late September that it would considerproduction cuts, which it, along with non-OPEC countrieslike Russia, ultimately agreed to in early December. Thishelped to fuel an increase in oil prices, which led to acontinuing rally in all of our oil & gas holdings includingHalliburton, MRC, Devon Energy, Royal Dutch and Total,among others.
We also had nice returns during the year in several of ourconsumer (Diageo, Embotelladora Andina, Henkel, Unilever,British American Tobacco), industrial (AGCO, G4S,Ebara, BAE, Safran, Teleperformance) and health care(GlaxoSmithKline, Johnson & Johnson, Novartis, Roche)holdings, and in our sole mining company investment, copperminer Antofagasta, which rebounded nicely as copper pricesrose late in the year. It is also interesting and perhapssurprising to note that the most significant contribution to“local return” from a country in our portfolios came from theU.K. However, for our unhedged Funds, the Global ValueFund II and the Worldwide High Dividend Yield Value Fund,which are exposed to currency fluctuations, the collapsingBritish pound erased much of this return when translatedback into U.S. dollars. Political and economic cross currentsonce again led to volatility in a number of major currencies,including the British pound and the Japanese yen, amongothers, which had a significant impact on unhedged returns.On the other hand, the currency hedging policy of the GlobalValue Fund and the Value Fund protected their shareholdersfrom much of the return reduction occasioned by weakeningforeign currencies.
While most of the holdings in our Fund portfolios were upnicely for the year, there were a few that disappointed interms of their price performance. This included Verizon, thepremier U.S. wireless company; Pearson, the UK-basededucational publisher; and Coca-Cola Femsa, the Mexico-based Coca-Cola bottler. Despite having the highest qualitywireless network in the U.S., Verizon is facing near-termpricing pressure from two of its main competitors, Sprint andT-Mobile, and this has impacted their ability to meetexpectations in terms of earnings growth. That said, thecompany is trading a little over 12x 2017 estimated earningsper share, and currently paying us approximately a 5%dividend yield while we wait for value recognition in itsshares. We decided to sell our remaining shares of Pearsonduring the year as digital technology continues to disrupt theeducational publishing industry, and Coca-Cola Femsaremains a modest position in our Global Value Fund.
Looking Forward
It may be said, with some approximation to the truth,that investment is grounded on the past whereasspeculation looks primarily to the future, but thisstatement is far from complete. Both investment andspeculation must meet the test of the future; they aresubject to its vicissitudes and are judged by its verdict. Butwhat we have said about the analyst and the futureapplies equally well to the concept of investment. Forinvestment, the future is essentially something to beguarded against rather than be profited from. If the futurebrings improvement, so much the better; but investmentas such cannot be founded in any important degree uponthe expectation of improvement. Speculation, on theother hand, may always properly-and often soundly-derive its basis and its justification from prospectivedevelopments that differ from past performance.
– Benjamin Graham, Security Analysis
We are now, according to market observers, eight yearsinto what has been reported as the second longest stockmarket advance in history. The S&P 500 Index has more
II-3

than tripled from its lows in March of 2009. Equityvaluations, which were already high prior to the post electionadvance, for the most part, have climbed steadily higheraround the globe, and appear to be discounting anextraordinarily attractive environment for corporate earningspower going forward. With market indexes (S&P 500, EAFEand World) now trading north of 21x trailing earnings,investors are currently receiving roughly a 4.7% earnings yieldon the price they are paying for the market. In comparison, atriple A bond in the form of a 10-year U.S. Treasury notetoday yields approximately 2.3%, but that yield may very wellgo higher in the near term as the Fed continues the process of“normalizing” interest rates from the anomalistic low rates ofthe last several years. On the corporate side, a triple A ratedJohnson & Johnson 10-year bond today yields a little over3%. The differential between today’s equity earnings yield andrising risk free bond yields is not the kind of spread, or“margin of safety,” that Ben Graham would have foundenticing, nor does it suggest the kind of returns going forwardthat we have enjoyed during this bull run. If interest rates doindeed normalize in the next few years and P/Es remain attoday’s levels, this modest spread virtually disappears. AsGraham said years ago in his tome, Security Analysis,investors “are buying earnings power not much greater thanthe bond-interest rate, without the extra protection affordedby a prior claim.”
Speculation regarding growth in future earnings powerfueled by the expectation of government action to lowercorporate and personal income taxes, cut regulation, andincrease infrastructure spending may well turn out to be right,but it remains just that for the time being: speculation. Withthe increase in animal spirits unleashed since the election andthe run-up in equity prices, it would appear that the cork mayindeed be coming off the champagne bottle. For evidence ofthis, one would have to look no further than the recent publicoffering of Snap Inc. (SNAP), the company that ownsSnapchat, the popular social media application. At its $17offering price, SNAP was valued at $24 billion despite losingover $500 million last year. On its first day of trading, thestock closed up 44% from its initial offering price, closing at$24.48 for an end of day valuation greater than $34 billion.We, of course, had similar concerns about Facebook’svaluation when it went public years ago, and those concernshave, at least to date, been proven to be unwarranted with thebenefit of hindsight. It’s impossible to know whether SNAPwill enjoy a similar arc of financial success; however, we doknow that it does not fit within our price-driven investmentframework.
This increase in animal spirits has made bargain huntingchallenging. When we screen for new securities today usingvaluation metrics that we deem to be reasonable and reliable,we find the fewest number of qualifying stocks in over adecade, and those that show up as quantitatively attractiveare generally in industries with secular problems and highuncertainty such as retail (Amazon risk), publicly traded assetmanagers, auto parts, homebuilding, airlines, and preciousmetals.
The arguments for equities today invariably stress relativevaluations, and a cheery consensus regarding future growth incorporate earnings. You constantly hear that stocks are cheapwhen compared to low yielding bonds, and that buying stocks
with some kind of dividend yield is better than owning cashreserves with little or no yield. And this despite the fact thatwhen considered on a P/E equivalent basis, stocks and bondstoday are trading at 21x and 40x their earnings, respectively.The acronym “TINA” (there is no alternative) is sometimesused to describe the rationale for the flight into equities.
In contrast to today’s relative thinking, we employ anabsolute valuation framework and have avoided thetemptation to stretch our valuation multiples in light ofartificially low interest rates, which we deem to be temporaryrather than permanent. We are perfectly happy to wait foropportunity, rather than purchase securities that, in our view,do not have an adequate “margin of safety.” All of that said,when it comes to market leadership, the screw does appear tobe turning, albeit ever so slowly, in our direction. We havehad several bouts of volatility over the last year and a half ascorrelations have begun to break down, and investors appearto have developed a hair trigger mentality that can bespooked by an undesirable headline, earnings report, orchange in regulatory posture. This has allowed us to takeadvantage of buying opportunities and incrementally putsome of our cash reserves to work in existing holdings and afew new ideas. While your crystal ball is no doubt as good orbetter than ours, with the Federal Reserve charting a path foradditional interest rate increases and with inflationaryexpectations on the rise, we may be nearing an inflectionpoint in markets that could likely lead to additional volatilityin the weeks and months ahead; and if that does indeed bearout, we hope to take full advantage of the pricingopportunities that fall out from that turbulence. In theinterim, we remain comforted that on average the stocks inour Fund portfolios, while not cheap, appear to trade atreasonable business valuations given their growth prospectsand cash yields. In addition, our Fund portfolios are for themost part well diversified by issue, industry and country, andgenerally carry a healthy dollop of cash reserves that shouldallow us to take meaningful advantage of any inevitablebumps in the road.
Thank you for investing with us, and for your continuedconfidence. We work hard to earn and keep your trust, andwe believe it is critical to our mutual success.
Sincerely,
TWEEDY, BROWNE COMPANY LLC
William H. BrowneThomas H. ShragerJohn D. SpearsRobert Q. Wyckoff, Jr.Managing Directors
April 2017
Footnotes:(1) Indexes are unmanaged, and the figures for the indexes
shown include reinvestment of dividends and capital gainsdistributions and do not reflect any fees or expenses.Investors cannot invest directly in an index.
(2) MSCI EAFE Index is a free float-adjusted, marketcapitalization weighted index that is designed to measure the
II-4

equity market performance of developed markets, excludingthe US and Canada. The MSCI EAFE Index (in US$)reflects the return of the MSCI EAFE Index for a US dollarinvestor. The MSCI EAFE Index (Hedged to US$)consists of the results of the MSCI EAFE Index hedged100% back into US dollars and accounts for interest ratedifferentials in forward currency exchange rates. Results forboth indexes are inclusive of dividends and net of foreignwithholding taxes.
(3) Inception dates for the Global Value Fund, Global ValueFund II – Currency Unhedged, Value Fund andWorldwide High Dividend Yield Value Fund are June 15,1993, October 26, 2009, December 8, 1993, andSeptember 5, 2007, respectively. Prior to 2004,information with respect to the MSCI EAFE and MSCIWorld Indexes used was available at month end only;therefore, the since-inception performance of the MSCIEAFE Indexes quoted for the Global Value Fund reflectsperformance from May 31, 1993, the closest month end tothe Global Value Fund’s inception date, and the sinceinception performance of the MSCI World Index quoted forthe Value Fund reflects performance from November 30,1993, the closest month end to the Value Fund’s inceptiondate.
(4) The S&P 500/MSCI World Index (Hedged to US$) is acombination of the S&P 500 Index and the MSCI WorldIndex (Hedged to US$), linked together by Tweedy,Browne Company, and represents the performance of theS&P 500 Index for the periods 12/8/93 – 12/31/06 and theperformance of the MSCI World Index (Hedged to US$),beginning 1/01/07 and thereafter. For the period from theFund’s inception through 2006, the Fund chose the S&P500 as its benchmark. Starting in mid-December 2006, theFund’s investment mandate changed from investing at least80% of its assets in US securities to investing no less thanapproximately 50% in U.S securities, and the Fund chosethe MSCI World Index (Hedged to US$) as its benchmarkstarting January 1, 2007. Effective July 29, 2013, theValue Fund removed the 50% requirement, and continuesto use the MSCI World Index (Hedged to US$) as itsbenchmark. The S&P 500 Index is a market capitalizationweighted index composed of 500 widely held common stocksthat assumes the reinvestment of dividends. The index isgenerally considered representative of US large capitalizationstocks.
(5) The MSCI World Index is a free float-adjusted marketcapitalization weighted index that is designed to measure theequity market performance of developed markets. TheMSCI World Index (in US$) reflects the return of thisindex for a US dollar investor. The MSCI World Index(Hedged to US$) consists of the results of the MSCI WorldIndex with its foreign currency exposure hedged 100% backinto US dollars. The index accounts for interest ratedifferentials in forward currency exchange rates. Results foreach index are inclusive of dividends and net of foreignwithholding taxes.
Mention of a specific security should not be considered arecommendation to buy or a solicitation to sell that security.Holdings are subject to change at any time.
The views expressed represent the opinions of Tweedy,Browne Company LLC as of the date of this letter, are notintended as a forecast or guarantee of future results, and aresubject to change without notice.
Current and future portfolio holdings are subject to risk.Investing in foreign securities involves additional risks beyondthe risks of investing in US securities markets. These risksinclude currency fluctuations; political uncertainty; differentaccounting and financial standards; different regulatoryenvironments; and different market and economic factors invarious non-US countries. In addition, the securities of small,less well known companies may be more volatile than those oflarger companies. Value investing involves the risk that themarket will not recognize a security’s intrinsic value for a longtime, or that a security thought to be undervalued mayactually be appropriately priced when purchased. Dividendsare not guaranteed, and a company currently paying dividendsmay cease paying dividends at any time. Diversification doesnot guarantee a profit and does not protect against a loss in adeclining market. Please refer to the Funds’ prospectus for adescription of risk factors associated with investments insecurities which may be held by the Funds.
Although the practice of hedging against currency exchangerate changes utilized by the Tweedy, Browne Global ValueFund and Tweedy, Browne Value Fund reduces the risk of lossfrom exchange rate movements, it also reduces the ability ofthe Funds to gain from favorable exchange rate movementswhen the US dollar declines against the currencies in whichthe Funds’ investments are denominated and in some interestrate environments may impose out-of-pocket costs on theFunds.
Stocks and bonds are subject to different risks. In general,stocks are subject to greater price fluctuations and volatilitythan bonds and can decline significantly in value in responseto adverse issuer, political, regulatory, market or economicdevelopments. Unlike stocks, if held to maturity, bondsgenerally offer to pay both a fixed rate of return and a fixedprincipal value. Bonds are subject to interest rate risk (asinterest rates rise bond prices generally fall), the risk of issuerdefault, issuer credit risk, and inflation risk, although U.S.Treasuries are backed by the full faith and credit of the U.S.Government.
Price/earnings (or P/E) ratio is a comparison of the company’sclosing stock price and its trailing 12-month earnings pershare.
Tweedy, Browne Global Value Fund, Tweedy, Browne GlobalValue Fund II – Currency Unhedged, Tweedy, Browne ValueFund, and Tweedy, Browne Worldwide High Dividend YieldValue Fund are distributed by AMG Distributors, Inc.,Member FINRA/SIPC.
This material must be preceded or accompanied by a prospectus forTweedy, Browne Fund Inc.
II-5
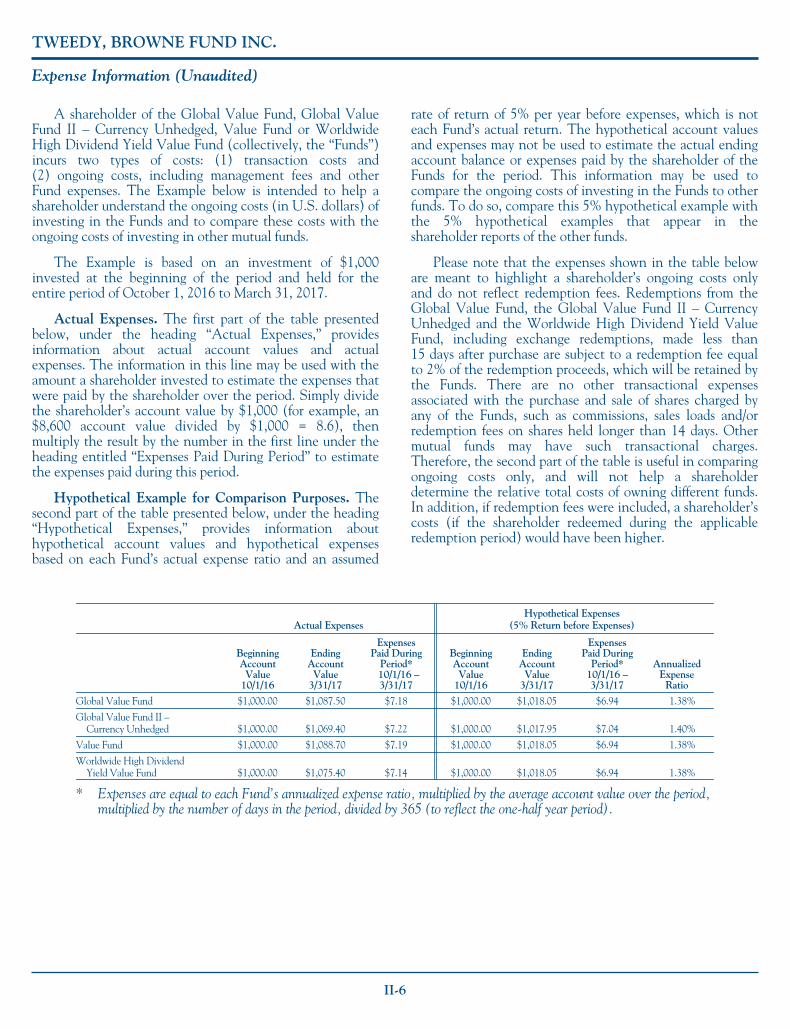
TWEEDY, BROWNE FUND INC.
Expense Information (Unaudited)
A shareholder of the Global Value Fund, Global ValueFund II – Currency Unhedged, Value Fund or WorldwideHigh Dividend Yield Value Fund (collectively, the “Funds”)incurs two types of costs: (1) transaction costs and(2) ongoing costs, including management fees and otherFund expenses. The Example below is intended to help ashareholder understand the ongoing costs (in U.S. dollars) ofinvesting in the Funds and to compare these costs with theongoing costs of investing in other mutual funds.
The Example is based on an investment of $1,000invested at the beginning of the period and held for theentire period of October 1, 2016 to March 31, 2017.
Actual Expenses. The first part of the table presentedbelow, under the heading “Actual Expenses,” providesinformation about actual account values and actualexpenses. The information in this line may be used with theamount a shareholder invested to estimate the expenses thatwere paid by the shareholder over the period. Simply dividethe shareholder’s account value by $1,000 (for example, an$8,600 account value divided by $1,000 = 8.6), thenmultiply the result by the number in the first line under theheading entitled “Expenses Paid During Period” to estimatethe expenses paid during this period.
Hypothetical Example for Comparison Purposes. Thesecond part of the table presented below, under the heading“Hypothetical Expenses,” provides information abouthypothetical account values and hypothetical expensesbased on each Fund’s actual expense ratio and an assumed
rate of return of 5% per year before expenses, which is noteach Fund’s actual return. The hypothetical account valuesand expenses may not be used to estimate the actual endingaccount balance or expenses paid by the shareholder of theFunds for the period. This information may be used tocompare the ongoing costs of investing in the Funds to otherfunds. To do so, compare this 5% hypothetical example withthe 5% hypothetical examples that appear in theshareholder reports of the other funds.
Please note that the expenses shown in the table beloware meant to highlight a shareholder’s ongoing costs onlyand do not reflect redemption fees. Redemptions from theGlobal Value Fund, the Global Value Fund II – CurrencyUnhedged and the Worldwide High Dividend Yield ValueFund, including exchange redemptions, made less than15 days after purchase are subject to a redemption fee equalto 2% of the redemption proceeds, which will be retained bythe Funds. There are no other transactional expensesassociated with the purchase and sale of shares charged byany of the Funds, such as commissions, sales loads and/orredemption fees on shares held longer than 14 days. Othermutual funds may have such transactional charges.Therefore, the second part of the table is useful in comparingongoing costs only, and will not help a shareholderdetermine the relative total costs of owning different funds.In addition, if redemption fees were included, a shareholder’scosts (if the shareholder redeemed during the applicableredemption period) would have been higher.
Actual ExpensesHypothetical Expenses
(5% Return before Expenses)
BeginningAccountValue
10/1/16
EndingAccountValue
3/31/17
ExpensesPaid During
Period*10/1/16 –3/31/17
BeginningAccountValue
10/1/16
EndingAccountValue
3/31/17
ExpensesPaid During
Period*10/1/16 –3/31/17
AnnualizedExpense
Ratio
Global Value Fund $1,000.00 $1,087.50 $7.18 $1,000.00 $1,018.05 $6.94 1.38%
Global Value Fund II –Currency Unhedged $1,000.00 $1,069.40 $7.22 $1,000.00 $1,017.95 $7.04 1.40%
Value Fund $1,000.00 $1,088.70 $7.19 $1,000.00 $1,018.05 $6.94 1.38%
Worldwide High DividendYield Value Fund $1,000.00 $1,075.40 $7.14 $1,000.00 $1,018.05 $6.94 1.38%
* Expenses are equal to each Fund’s annualized expense ratio, multiplied by the average account value over the period,multiplied by the number of days in the period, divided by 365 (to reflect the one-half year period).
II-6

Tweedy, BrowneGlobal Value FundPortfolio Highlights as of March 31, 2017 (Unaudited)
Hypothetical Illustration of $10,000 Invested inTweedy, Browne Global Value Fund vs.
MSCI EAFE Index(Hedged to US$ and in US$)
6/15/93 through 3/31/17
$10,000
$20,000
$30,000
$40,000
$50,000
$70,000
$60,000
$80,000
$90,000
$40,235
$32,672
$85,517Tweedy, Browne Global Value Fund
Mar
199
4Ju
n 19
93
Mar
199
5
Mar
199
6
Mar
199
7
Mar
199
8
Mar
199
9
Mar
200
0
Mar
200
1
Mar
200
2
Mar
200
3
Mar
200
4
Mar
200
5
Mar
200
6
Mar
200
7
Mar
200
8
Mar
200
9
Mar
201
0
Mar
201
1
Mar
201
2
Mar
201
5
Mar
201
6
Mar
201
7
Mar
201
4
Mar
201
3
MSCI EAFE Index (in US$)MSCI EAFE Index (Hedged to US$)
Average Annual Total Returns – For Periods Ended March 31, 2017
Tweedy, BrowneGlobal Value Fund
MSCI EAFEIndex (Hedged to US$)
MSCI EAFEIndex (in US$)
1 Year 15.49% 18.91% 11.67%
5 Years 7.97 10.82 5.83
10 Years 4.32 2.73 1.05
Since Inception(6/15/93) 9.44 6.02 5.09
Total Annual Fund Operating Expense Ratios as of 3/31/16 and 3/31/17 were 1.38% and 1.40%, respectively.
The preceding performance data represents past performance and is not a guarantee of future results. Total return and principal value of an investment will fluctuate so thatan investor’s shares, when redeemed, may be worth more or less than their original cost. The graph and table do not reflect the deduction of taxes that a shareholder wouldpay on Fund distributions or the redemption of Fund shares. Current performance may be lower or higher than the performance data shown. Results are annualized for allperiods greater than one year. Please visit www.tweedy.com to obtain performance data that is current to the most recent month end.
The Fund does not impose any front-end or deferred sales charges. However, the Fund imposes a 2% redemption fee on redemption proceeds for redemptions or exchangesmade less than 15 days after purchase. Performance data does not reflect the deduction of the redemption fee, and, if reflected, the redemption fee would reduce theperformance data quoted for periods of 14 days or less. The expense ratios shown above reflect the inclusion of acquired fund fees and expenses (i.e., the fees and expensesattributable to investing cash balances in money market funds) and may differ from those shown in the Fund’s financial statements.
The MSCI EAFE Index is a free float-adjusted market capitalization weighted index that is designed to measure the equity market performance of developed markets, excluding the U.S. andCanada. The MSCI EAFE Index (in US$) reflects the return of the MSCI EAFE Index for a U.S. dollar investor. The MSCI EAFE Index (Hedged to US$) consists of the results of theMSCI EAFE Index hedged 100% back into U.S. dollars and accounts for interest rate differentials in forward currency exchange rates. Results for each index are inclusive of dividends and net offoreign withholding taxes. The inception date for the Fund is June 15, 1993. Prior to 2004, information with respect to the MSCI EAFE indexes used was available at month end only; therefore,the closest month end to the Fund’s inception date, May 31, 1993, was used.
Indexes are unmanaged, and the figures for the indexes shown include reinvestment of dividends and capital gains distributions and do not reflect any fees or expenses. Investors cannot investdirectly in an index.
II-7

Tweedy, Browne Global Value Fund
Perspective on Assessing Investment Results (Unaudited)
March 31, 2017
In accordance with rules and guidelines set out by theUnited States Securities and Exchange Commission, we haveprovided a comparison of the historical investment results ofTweedy, Browne Global Value Fund to the results of theMSCI EAFE Index (hedged to US$) and the MSCI EAFEIndex (in US$) (non-U.S. currencies are unhedged).Although we believe this comparison may be useful, thehistorical results of the MSCI EAFE indexes in large measurerepresent the investment results of stocks that we do not own.Any portfolio that does not own exactly the same stocks inexactly the same proportions as the index to which theparticular portfolio is being compared is not likely to have thesame results as the index. The investment behavior of adiversified portfolio of undervalued stocks tends to becorrelated to the investment behavior of a broad index; i.e.,when the index is up, probably more than one-half of thestocks in the entire universe of public companies in all thecountries that are included in the same index will be up,albeit in greater or lesser percentages than the index.Similarly, when the index declines, probably more than one-half of the stocks in the entire universe of public companies inall the countries that are included in the index will be downin greater or lesser percentages than the index. But it is almosta mathematical truth that “different stocks equal differentresults.”
We believe that favorable or unfavorable historicalinvestment results in comparison to an index are notnecessarily predictive of future comparative investmentresults. In 1986, V. Eugene Shahan, a Columbia UniversityBusiness School alumnus and portfolio manager at U.S. Trust,wrote Are Short-Term Performance and Value InvestingMutually Exclusive? In this article, Mr. Shahan analyzed the
investment performance of seven money managers, aboutwhom Warren Buffett wrote in his article, The Superinvestorsof Graham and Doddsville. Over long periods of time, the sevenmanagers significantly outperformed the market as measuredby the Dow Jones Industrial Average (the DJIA) or theS&P 500 Index (the S&P 500) by between 7.7% and 16.5%annually. (The goal of most institutional money managers isto outperform the market by 2% to 3%.) However, for periodsranging from 13 years to 28 years, this group of managersunderperformed the market between 7.7% and 42% of theyears. Six of the seven investment managers underperformedthe market between 28% and 42% of the years. In today’senvironment, they would have lost many of their clientsduring their periods of underperformance. Longer term, itwould have been the wrong decision to fire any of thosemoney managers. In examining the seven long-terminvestment records, unfavorable investment results ascompared to either index did not predict the future favorablecomparative investment results that occurred, and favorableinvestment results in comparison to the DJIA or the S&P 500were not always followed by future favorable comparativeresults. Stretches of consecutive annual underperformanceranged from one to six years.
Mr. Shahan concluded:Unfortunately, there is no way to distinguish between apoor three-year stretch for a manager who will do wellover 15 years, from a poor three-year stretch for amanager who will continue to do poorly. Nor is there anyreason to believe that a manager who does well from theoutset cannot continue to do well, and consistently.
II-8

Tweedy, Browne Global Value Fund
Portfolio of InvestmentsMarch 31, 2017
SharesValue
(Note 2)
COMMON STOCKS—86.2%
Canada—1.2%90,300 E-L Financial Corp., Ltd. . . . . . . . . . . . . . . . . $55,453,605
1,500,000 National Bank of Canada . . . . . . . . . . . . . . . 62,805,084118,258,689
Chile—1.7%15,195,200 Antofagasta PLC . . . . . . . . . . . . . . . . . . . . . . 158,562,409
China—1.4%783,858 Baidu Inc., Sponsored ADR(a) . . . . . . . . . . . . 135,231,182
Czech Republic—0.0%(b)
2,800 Philip Morris CR a.s. . . . . . . . . . . . . . . . . . . . 1,503,824
France—11.6%760,360 Cie Generale des Etablissements Michelin . . . 92,587,983
7,135,610 CNP Assurances . . . . . . . . . . . . . . . . . . . . . . 145,616,9064,304,900 Safran SA . . . . . . . . . . . . . . . . . . . . . . . . . . . 322,440,4495,998,250 SCOR SE . . . . . . . . . . . . . . . . . . . . . . . . . . . 227,299,269
712,949 Teleperformance SA . . . . . . . . . . . . . . . . . . . 77,206,8484,782,031 Total SA . . . . . . . . . . . . . . . . . . . . . . . . . . . . 242,510,455
1,107,661,910
Germany—7.2%3,792,735 Axel Springer SE . . . . . . . . . . . . . . . . . . . . . . 210,006,6221,936,000 Henkel AG & Company, KGaA . . . . . . . . . . 215,658,684
652,000 Krones AG . . . . . . . . . . . . . . . . . . . . . . . . . . 73,326,20342,354 KSB AG . . . . . . . . . . . . . . . . . . . . . . . . . . . . 17,451,767
228,337 Linde AG . . . . . . . . . . . . . . . . . . . . . . . . . . . 38,122,513699,000 Muenchener Rueckversicherungs AG . . . . . . 137,113,062
691,678,851
Hong Kong—1.1%26,265,000 Emperor Entertainment Hotel Ltd. . . . . . . . . 6,049,5855,678,136 Great Eagle Holdings Ltd. . . . . . . . . . . . . . . . 26,704,7386,111,500 Hang Lung Group Ltd. . . . . . . . . . . . . . . . . . 26,069,128
15,525,711 Hongkong & Shanghai Hotels Ltd./The . . . . 18,219,711434,500 Jardine Strategic Holdings Ltd. . . . . . . . . . . . 18,249,00059,000 Miramar Hotel & Investment . . . . . . . . . . . . 126,784
11,264,000 Oriental Watch Holdings . . . . . . . . . . . . . . . 2,594,4232,561,000 Tai Cheung Holdings Ltd. . . . . . . . . . . . . . . . 2,326,534
100,339,903
Italy—0.6%144,268 Buzzi Unicem SpA . . . . . . . . . . . . . . . . . . . . 3,703,255
4,795,392 SOL SpA(c) . . . . . . . . . . . . . . . . . . . . . . . . . . 49,237,69052,940,945
Japan—1.6%2,126,200 Ebara Corporation . . . . . . . . . . . . . . . . . . . . . 69,359,5711,368,700 Honda Motor Company Ltd. . . . . . . . . . . . . . 41,160,493
73,800 Lintec Corporation . . . . . . . . . . . . . . . . . . . . 1,571,63669,100 Mandom Corporation . . . . . . . . . . . . . . . . . . 3,237,028
1,443,500 NGK Spark Plug Company Ltd. . . . . . . . . . . 32,955,793164,400 Nippon Kanzai Company Ltd. . . . . . . . . . . . . 2,649,757114,100 Shinko Shoji Company Ltd. 1,244,113
Undisclosed Securities(d) 2,015,194154,193,585
SharesValue
(Note 2)
Mexico—0.4%520,112 Coca-Cola Femsa SA de CV, Sponsored
ADR(e) . . . . . . . . . . . . . . . . . . . . . . . . . . . $37,292,030
Netherlands—7.3%2,136,174 Akzo Nobel NV . . . . . . . . . . . . . . . . . . . . . . 177,593,7253,160,000 Heineken Holding NV . . . . . . . . . . . . . . . . . 252,030,7607,534,860 Royal Dutch Shell PLC, Class A . . . . . . . . . . 198,370,620
345,000 Telegraaf Media Groep NV, CVA . . . . . . . . . 2,284,8221,378,910 Unilever NV, CVA . . . . . . . . . . . . . . . . . . . . 68,682,245
698,962,172
Norway—0.5%900,000 Schibsted ASA . . . . . . . . . . . . . . . . . . . . . . . 23,157,797900,000 Schibsted ASA, Class B . . . . . . . . . . . . . . . . 20,590,530
43,748,327
Singapore—3.5%12,787,454 DBS Group Holdings Ltd. . . . . . . . . . . . . . . . 177,539,97510,089,655 United Overseas Bank Ltd. . . . . . . . . . . . . . . 159,652,381
337,192,356
South Korea—4.7%150,900 Daegu Department Store Company Ltd. . . . . 1,767,674210,000 Hyundai Mobis Company Ltd. . . . . . . . . . . . 45,162,300
1,482,135 Hyundai Motor Company . . . . . . . . . . . . . . . 208,742,0753,919,300 Kia Motors Corporation . . . . . . . . . . . . . . . . 129,848,936
815,800 LG Corporation . . . . . . . . . . . . . . . . . . . . . . 51,210,909132,553 Samchully Company Ltd. . . . . . . . . . . . . . . . 12,682,796
Undisclosed Security(d) . . . . . . . . . . . . . . . . . 900,310450,315,000
Spain—1.0%7,400,000 Mediaset España Comunicacion SA . . . . . . . 95,649,058
Sweden—0.0%(b)
63,360 Cloetta AB, B Shares . . . . . . . . . . . . . . . . . . 251,217
Switzerland—13.4%2,272,160 ABB Ltd. . . . . . . . . . . . . . . . . . . . . . . . . . . . . 53,186,182
388,000 CIE Financiere Richemont AG . . . . . . . . . . . 30,700,435218,165 Coltene Holding AG(c) . . . . . . . . . . . . . . . . . 17,360,35053,000 Daetwyler Holding AG, Bearer . . . . . . . . . . . 8,175,433
3,582,515 Nestle SA, Registered . . . . . . . . . . . . . . . . . . 275,054,97680 Neue Zuercher Zeitung(a) . . . . . . . . . . . . . . . . 479,544
3,275,000 Novartis AG, Registered . . . . . . . . . . . . . . . . 243,265,14868,640 Phoenix Mecano AG(c) . . . . . . . . . . . . . . . . . 35,316,050
1,084,000 Roche Holding AG . . . . . . . . . . . . . . . . . . . . 277,024,027248,117 Siegfried Holding AG(c) . . . . . . . . . . . . . . . . . 65,378,749432,618 Tamedia AG . . . . . . . . . . . . . . . . . . . . . . . . . 66,559,940807,415 Zurich Insurance Group AG . . . . . . . . . . . . . 215,697,858
1,288,198,692
Taiwan—0.0%(b)
739,000 Lumax International Corp., Ltd. . . . . . . . . . . 1,324,927365,000 Thinking Electronic Industrial Company
Ltd. . . . . . . . . . . . . . . . . . . . . . . . . . . . . . . 805,9652,130,892
SEE NOTES TO FINANCIAL STATEMENTSII-9

Tweedy, Browne Global Value Fund
Portfolio of InvestmentsMarch 31, 2017
SharesValue
(Note 2)
Thailand—0.8%14,267,700 Bangkok Bank Public Company Ltd.,
NVDR . . . . . . . . . . . . . . . . . . . . . . . . . . . $75,360,860
United Kingdom—17.6%12,880,300 BAE Systems PLC . . . . . . . . . . . . . . . . . . . . . 103,482,4221,325,000 British American Tobacco PLC . . . . . . . . . . . 87,813,0825,424,025 Daily Mail & General Trust PLC, Class A . . . 48,833,9277,854,302 Diageo PLC . . . . . . . . . . . . . . . . . . . . . . . . . . 224,272,532
44,753,887 G4S PLC . . . . . . . . . . . . . . . . . . . . . . . . . . . . 170,294,32912,206,626 GlaxoSmithKline PLC . . . . . . . . . . . . . . . . . 253,303,02022,104,832 HSBC Holdings PLC . . . . . . . . . . . . . . . . . . 179,915,6591,111,325 Imperial Brands PLC . . . . . . . . . . . . . . . . . . . 53,738,1523,346,355 Provident Financial PLC . . . . . . . . . . . . . . . . 125,408,285
486,757 Shire PLC . . . . . . . . . . . . . . . . . . . . . . . . . . . 28,369,9646,803 Shire PLC, ADR . . . . . . . . . . . . . . . . . . . . . . 1,185,287
25,976,349 Standard Chartered PLC(a) . . . . . . . . . . . . . . 247,839,2704,891,800 TT Electronics PLC . . . . . . . . . . . . . . . . . . . 12,325,6892,725,044 Unilever PLC . . . . . . . . . . . . . . . . . . . . . . . . 134,240,047
Undisclosed Securities(d) . . . . . . . . . . . . . . . . 16,673,8781,687,695,543
United States—10.6%594,254 AGCO Corp . . . . . . . . . . . . . . . . . . . . . . . . . 35,762,20676,000 Alphabet Inc., Class A(a) . . . . . . . . . . . . . . . . 64,432,80076,208 Alphabet Inc., Class C(a) . . . . . . . . . . . . . . . . 63,219,10875,700 American National Insurance Company . . . . 8,934,871
412,200 Avnet, Inc. . . . . . . . . . . . . . . . . . . . . . . . . . . 18,862,2721,315,780 Bank of New York Mellon
Corporation/The . . . . . . . . . . . . . . . . . . . . 62,144,2891,055,212 Baxter International, Inc. . . . . . . . . . . . . . . . 54,723,294
436 Berkshire Hathaway Inc., Class A(a) . . . . . . . . 108,934,600301 Berkshire Hathaway Inc., Class B(a) . . . . . . . . 50,171
5,214,000 Cisco Systems, Inc. . . . . . . . . . . . . . . . . . . . . 176,233,200587,000 ConocoPhillips . . . . . . . . . . . . . . . . . . . . . . . 29,273,690
1,258,435 Devon Energy Corporation . . . . . . . . . . . . . . 52,501,9081,852,170 Halliburton Company . . . . . . . . . . . . . . . . . . 91,145,286
115,635 International Business Machines Corp . . . . . 20,136,679865,835 Johnson & Johnson . . . . . . . . . . . . . . . . . . . . 107,839,74933,225 NOW Inc.(a) . . . . . . . . . . . . . . . . . . . . . . . . . 563,496
882,900 Philip Morris International, Inc. . . . . . . . . . . 99,679,410293,500 Phillips 66 . . . . . . . . . . . . . . . . . . . . . . . . . . . 23,251,070
1,017,688,099
TOTAL COMMON STOCKS(Cost $5,733,170,360) . . . . . . . . . . . . . . . . 8,254,855,544
SharesValue
(Note 2)
PREFERRED STOCKS—0.6%
Chile—0.4%10,000,000 Embotelladora Andina SA . . . . . . . . . . . . . . $37,796,120
Croatia—0.1%166,388 Adris Grupa d.d. . . . . . . . . . . . . . . . . . . . . . . 11,254,935
Germany—0.1%279,000 Villeroy & Boch AG . . . . . . . . . . . . . . . . . . . 5,490,657
TOTAL PREFERRED STOCKS(Cost $36,208,137) . . . . . . . . . . . . . . . . . . . 54,541,712
REGISTERED INVESTMENT COMPANY—4.7%448,450,840 Dreyfus Treasury Securities Cash
Management – Institutional Shares(Cost $448,450,840) . . . . . . . . . . . . . . . . . 448,450,840
Face Value
U.S. TREASURY BILLS—7.5%$125,000,000 0.477(f) due 04/27/17(e) . . . . . . . . . . . . . . . . . . 124,957,615300,000,000 0.609(f) due 07/20/17 . . . . . . . . . . . . . . . . . . . 299,304,900300,000,000 0.645(f) due 08/17/17 . . . . . . . . . . . . . . . . . . . 299,106,300
TOTAL U.S. TREASURY BILLS(Cost $723,678,398) . . . . . . . . . . . . . . . . . . 723,368,815
TOTAL INVESTMENTS(Cost $6,941,507,735) . . . . . . . . . . . . . . . . . . 99.0% 9,481,216,911
UNREALIZED APPRECIATIONON FORWARD CONTRACTS (Net) . . . . . 1.0 94,881,530
OTHER ASSETSAND LIABILITIES (Net) . . . . . . . . . . . . . . . 0.0(b) 3,572,000
NET ASSETS . . . . . . . . . . . . . . . . . . . . . . . . . . . 100.0% $9,579,670,441
(a) Non-income producing security.(b) Amount represents less than 0.1% of net assets.(c) “Affiliated company” as defined by the Investment Company Act of 1940. See Note 4.(d) Represents an issuer, a generally smaller capitalization issuer, where disclosure may be
disadvantageous to the Fund’s accumulation or disposition program.(e) This security has been segregated to cover certain open forward contracts. At March 31,
2017, liquid assets totaling $162,249,645 have been segregated to cover such openforward contracts.
(f) Rate represents annualized yield at date of purchase.
Abbreviations:ADR — American Depositary ReceiptCVA — Certificaaten van aandelen (Share Certificates)
NVDR — Non Voting Depository Receipt
SEE NOTES TO FINANCIAL STATEMENTSII-10

Tweedy, Browne Global Value Fund
Sector Diversification (Unaudited)March 31, 2017
Sector DiversificationPercentage ofNet Assets
COMMON STOCKS:Pharmaceuticals, Biotechnology & Life Sciences . . . . . . . . . . . . . . . . 10.2%Banks . . . . . . . . . . . . . . . . . . . . . . . . . . . . . . . . . . . . . . . . . . . . . . . . . 9.4Insurance . . . . . . . . . . . . . . . . . . . . . . . . . . . . . . . . . . . . . . . . . . . . . . 9.4Capital Goods . . . . . . . . . . . . . . . . . . . . . . . . . . . . . . . . . . . . . . . . . . 7.9Energy . . . . . . . . . . . . . . . . . . . . . . . . . . . . . . . . . . . . . . . . . . . . . . . . 6.7Automobiles & Components . . . . . . . . . . . . . . . . . . . . . . . . . . . . . . . 5.7Beverage . . . . . . . . . . . . . . . . . . . . . . . . . . . . . . . . . . . . . . . . . . . . . . 5.4Food . . . . . . . . . . . . . . . . . . . . . . . . . . . . . . . . . . . . . . . . . . . . . . . . . . 5.0Media . . . . . . . . . . . . . . . . . . . . . . . . . . . . . . . . . . . . . . . . . . . . . . . . . 4.9Materials . . . . . . . . . . . . . . . . . . . . . . . . . . . . . . . . . . . . . . . . . . . . . . 4.5Commercial Services & Supplies . . . . . . . . . . . . . . . . . . . . . . . . . . . . 2.6Tobacco . . . . . . . . . . . . . . . . . . . . . . . . . . . . . . . . . . . . . . . . . . . . . . . 2.5Technology Hardware & Equipment . . . . . . . . . . . . . . . . . . . . . . . . . 2.4Household & Personal Products . . . . . . . . . . . . . . . . . . . . . . . . . . . . . 2.3Diversified Financials . . . . . . . . . . . . . . . . . . . . . . . . . . . . . . . . . . . . . 1.9Software & Services . . . . . . . . . . . . . . . . . . . . . . . . . . . . . . . . . . . . . . 1.6Internet Software & Services . . . . . . . . . . . . . . . . . . . . . . . . . . . . . . . 1.3Health Care Equipment & Services . . . . . . . . . . . . . . . . . . . . . . . . . . 0.8Real Estate . . . . . . . . . . . . . . . . . . . . . . . . . . . . . . . . . . . . . . . . . . . . . 0.6Consumer Durables & Apparel . . . . . . . . . . . . . . . . . . . . . . . . . . . . . . 0.3Consumer Services . . . . . . . . . . . . . . . . . . . . . . . . . . . . . . . . . . . . . . . 0.3Retailing . . . . . . . . . . . . . . . . . . . . . . . . . . . . . . . . . . . . . . . . . . . . . . 0.2Electronic Equipment & Instruments . . . . . . . . . . . . . . . . . . . . . . . . . 0.2Utilities . . . . . . . . . . . . . . . . . . . . . . . . . . . . . . . . . . . . . . . . . . . . . . . 0.1
Total Common Stocks . . . . . . . . . . . . . . . . . . . . . . . . . . . . . . . . . . . 86.2Preferred Stocks . . . . . . . . . . . . . . . . . . . . . . . . . . . . . . . . . . . . . . . . 0.6Registered Investment Company . . . . . . . . . . . . . . . . . . . . . . . . . . . 4.7U.S. Treasury Bills . . . . . . . . . . . . . . . . . . . . . . . . . . . . . . . . . . . . . . 7.5Unrealized Appreciation on Forward Contracts (Net) . . . . . . . . . . . 1.0Other Assets and Liabilities (Net) . . . . . . . . . . . . . . . . . . . . . . . . . . 0.0(a)
Net Assets . . . . . . . . . . . . . . . . . . . . . . . . . . . . . . . . . . . . . . . . . . . . . 100.0%
(a) Amount represents less than 0.1% of net assets
Portfolio Composition (Unaudited)March 31, 2017
Money Market Funds, Money Market Funds, Treasury Bills andTreasury Bills andOther Assets andOther Assets andLiabilities (Net)Liabilities (Net)(b)(b) 13% 13%
Switzerland 13%Switzerland 13%
United Kingdom 18%United Kingdom 18%
Netherlands 7%Netherlands 7% United States 11%nited States 11%
France 12%rance 12%
Singapore 4%Singapore 4%
(b)(b) Includes Unrealized Appreciation on Forward Contracts (Net) Includes Unrealized Appreciation on Forward Contracts (Net)
(a)(a) "Other Countries" include Canada, Chile, China, Croatia, Czech Republic, "Other Countries" include Canada, Chile, China, Croatia, Czech Republic, Hong Kong, Italy, Japan, Mexico, Norway, Spain, Sweden, Taiwan andHong Kong, Italy, Japan, Mexico, Norway, Spain, Sweden, Taiwan and Thailand Thailand
South Korea 5%South Korea 5%
Germany 7%Germany 7%
OthertherCountriesCountries(a)(a) 10% 10%
Schedule of Forward Exchange ContractsMarch 31, 2017
ContractsCounter-
partyContract
Value DateContract Value onOrigination Date
Value 03/31/17(Note 2)
UnrealizedAppreciation
(Depreciation)
FORWARD EXCHANGE CONTRACTS TO BUY(a)
7,000,000,000 Chilean Peso . . . . . . . . . . . . . . . . . . . . . . . . . . . . . . . . . . . . . . . . SSB 4/17/17 $10,883,085 $10,564,159 $(318,926)40,000,000,000 South Korean Won . . . . . . . . . . . . . . . . . . . . . . . . . . . . . . . . . . . JPM 5/2/17 34,998,687 35,783,699 785,01235,000,000,000 South Korean Won . . . . . . . . . . . . . . . . . . . . . . . . . . . . . . . . . . . JPM 5/31/17 30,633,042 31,319,910 686,86835,000,000,000 South Korean Won . . . . . . . . . . . . . . . . . . . . . . . . . . . . . . . . . . . SSB 6/8/17 30,701,754 31,322,900 621,14625,000,000,000 South Korean Won . . . . . . . . . . . . . . . . . . . . . . . . . . . . . . . . . . . SSB 8/23/17 21,956,789 22,399,383 442,59440,000,000,000 South Korean Won . . . . . . . . . . . . . . . . . . . . . . . . . . . . . . . . . . . SSB 8/28/17 35,133,948 35,841,980 708,032
TOTAL . . . . . . . . . . . . . . . . . . . . . . . . . . . . . . . . . . . . . . . . . . . . . . . . . . . . . . . . . . . $164,307,305 $167,232,031 $2,924,726
FORWARD EXCHANGE CONTRACTS TO SELL(a)
45,000,000 Canadian Dollar . . . . . . . . . . . . . . . . . . . . . . . . . . . . . . . . . . . . . NTC 8/17/17 $(34,559,398) $(33,809,663) $749,7358,000,000 Canadian Dollar . . . . . . . . . . . . . . . . . . . . . . . . . . . . . . . . . . . . . NTC 8/28/17 (6,196,027) (6,011,590) 184,437
22,000,000 Canadian Dollar . . . . . . . . . . . . . . . . . . . . . . . . . . . . . . . . . . . . . NTC 9/21/17 (16,714,912) (16,537,772) 177,14035,000,000 Canadian Dollar . . . . . . . . . . . . . . . . . . . . . . . . . . . . . . . . . . . . . NTC 12/13/17 (26,422,473) (26,348,327) 74,14627,000,000 Canadian Dollar . . . . . . . . . . . . . . . . . . . . . . . . . . . . . . . . . . . . . SSB 12/18/17 (20,597,794) (20,327,664) 270,130
7,000,000,000 Chilean Peso . . . . . . . . . . . . . . . . . . . . . . . . . . . . . . . . . . . . . . . . SSB 4/17/17 (9,903,792) (10,564,159) (660,367)15,000,000,000 Chilean Peso . . . . . . . . . . . . . . . . . . . . . . . . . . . . . . . . . . . . . . . . SSB 12/07/17 (21,629,416) (22,399,952) (770,536)7,000,000,000 Chilean Peso . . . . . . . . . . . . . . . . . . . . . . . . . . . . . . . . . . . . . . . . SSB 3/2/18 (10,667,480) (10,409,895) 257,585
564,000,000 Chinese Yuan . . . . . . . . . . . . . . . . . . . . . . . . . . . . . . . . . . . . . . . BNY 3/5/18 (79,954,636) (80,044,280) (89,644)375,000,000 Chinese Yuan . . . . . . . . . . . . . . . . . . . . . . . . . . . . . . . . . . . . . . . JPM 3/26/18 (52,861,945) (53,121,414) (259,469)55,000,000 European Union Euro . . . . . . . . . . . . . . . . . . . . . . . . . . . . . . . . . SSB 4/17/17 (63,547,825) (58,870,017) 4,677,808
SEE NOTES TO FINANCIAL STATEMENTSII-11
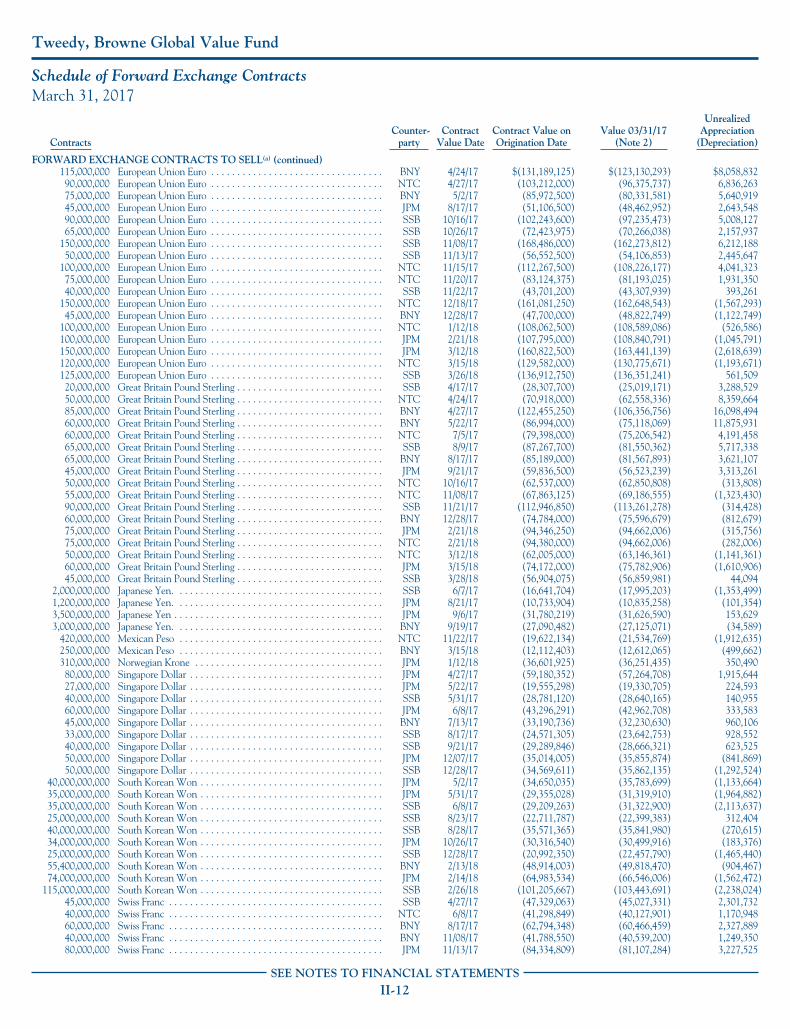
Tweedy, Browne Global Value Fund
Schedule of Forward Exchange ContractsMarch 31, 2017
ContractsCounter-
partyContract
Value DateContract Value onOrigination Date
Value 03/31/17(Note 2)
UnrealizedAppreciation
(Depreciation)
FORWARD EXCHANGE CONTRACTS TO SELL(a) (continued)115,000,000 European Union Euro . . . . . . . . . . . . . . . . . . . . . . . . . . . . . . . . . BNY 4/24/17 $(131,189,125) $(123,130,293) $8,058,83290,000,000 European Union Euro . . . . . . . . . . . . . . . . . . . . . . . . . . . . . . . . . NTC 4/27/17 (103,212,000) (96,375,737) 6,836,26375,000,000 European Union Euro . . . . . . . . . . . . . . . . . . . . . . . . . . . . . . . . . BNY 5/2/17 (85,972,500) (80,331,581) 5,640,91945,000,000 European Union Euro . . . . . . . . . . . . . . . . . . . . . . . . . . . . . . . . . JPM 8/17/17 (51,106,500) (48,462,952) 2,643,54890,000,000 European Union Euro . . . . . . . . . . . . . . . . . . . . . . . . . . . . . . . . . SSB 10/16/17 (102,243,600) (97,235,473) 5,008,12765,000,000 European Union Euro . . . . . . . . . . . . . . . . . . . . . . . . . . . . . . . . . SSB 10/26/17 (72,423,975) (70,266,038) 2,157,937
150,000,000 European Union Euro . . . . . . . . . . . . . . . . . . . . . . . . . . . . . . . . . SSB 11/08/17 (168,486,000) (162,273,812) 6,212,18850,000,000 European Union Euro . . . . . . . . . . . . . . . . . . . . . . . . . . . . . . . . . SSB 11/13/17 (56,552,500) (54,106,853) 2,445,647
100,000,000 European Union Euro . . . . . . . . . . . . . . . . . . . . . . . . . . . . . . . . . NTC 11/15/17 (112,267,500) (108,226,177) 4,041,32375,000,000 European Union Euro . . . . . . . . . . . . . . . . . . . . . . . . . . . . . . . . . NTC 11/20/17 (83,124,375) (81,193,025) 1,931,35040,000,000 European Union Euro . . . . . . . . . . . . . . . . . . . . . . . . . . . . . . . . . SSB 11/22/17 (43,701,200) (43,307,939) 393,261
150,000,000 European Union Euro . . . . . . . . . . . . . . . . . . . . . . . . . . . . . . . . . NTC 12/18/17 (161,081,250) (162,648,543) (1,567,293)45,000,000 European Union Euro . . . . . . . . . . . . . . . . . . . . . . . . . . . . . . . . . BNY 12/28/17 (47,700,000) (48,822,749) (1,122,749)
100,000,000 European Union Euro . . . . . . . . . . . . . . . . . . . . . . . . . . . . . . . . . NTC 1/12/18 (108,062,500) (108,589,086) (526,586)100,000,000 European Union Euro . . . . . . . . . . . . . . . . . . . . . . . . . . . . . . . . . JPM 2/21/18 (107,795,000) (108,840,791) (1,045,791)150,000,000 European Union Euro . . . . . . . . . . . . . . . . . . . . . . . . . . . . . . . . . JPM 3/12/18 (160,822,500) (163,441,139) (2,618,639)120,000,000 European Union Euro . . . . . . . . . . . . . . . . . . . . . . . . . . . . . . . . . NTC 3/15/18 (129,582,000) (130,775,671) (1,193,671)125,000,000 European Union Euro . . . . . . . . . . . . . . . . . . . . . . . . . . . . . . . . . SSB 3/26/18 (136,912,750) (136,351,241) 561,50920,000,000 Great Britain Pound Sterling . . . . . . . . . . . . . . . . . . . . . . . . . . . . SSB 4/17/17 (28,307,700) (25,019,171) 3,288,52950,000,000 Great Britain Pound Sterling . . . . . . . . . . . . . . . . . . . . . . . . . . . . NTC 4/24/17 (70,918,000) (62,558,336) 8,359,66485,000,000 Great Britain Pound Sterling . . . . . . . . . . . . . . . . . . . . . . . . . . . . BNY 4/27/17 (122,455,250) (106,356,756) 16,098,49460,000,000 Great Britain Pound Sterling . . . . . . . . . . . . . . . . . . . . . . . . . . . . BNY 5/22/17 (86,994,000) (75,118,069) 11,875,93160,000,000 Great Britain Pound Sterling . . . . . . . . . . . . . . . . . . . . . . . . . . . . NTC 7/5/17 (79,398,000) (75,206,542) 4,191,45865,000,000 Great Britain Pound Sterling . . . . . . . . . . . . . . . . . . . . . . . . . . . . SSB 8/9/17 (87,267,700) (81,550,362) 5,717,33865,000,000 Great Britain Pound Sterling . . . . . . . . . . . . . . . . . . . . . . . . . . . . BNY 8/17/17 (85,189,000) (81,567,893) 3,621,10745,000,000 Great Britain Pound Sterling . . . . . . . . . . . . . . . . . . . . . . . . . . . . JPM 9/21/17 (59,836,500) (56,523,239) 3,313,26150,000,000 Great Britain Pound Sterling . . . . . . . . . . . . . . . . . . . . . . . . . . . . NTC 10/16/17 (62,537,000) (62,850,808) (313,808)55,000,000 Great Britain Pound Sterling . . . . . . . . . . . . . . . . . . . . . . . . . . . . NTC 11/08/17 (67,863,125) (69,186,555) (1,323,430)90,000,000 Great Britain Pound Sterling . . . . . . . . . . . . . . . . . . . . . . . . . . . . SSB 11/21/17 (112,946,850) (113,261,278) (314,428)60,000,000 Great Britain Pound Sterling . . . . . . . . . . . . . . . . . . . . . . . . . . . . BNY 12/28/17 (74,784,000) (75,596,679) (812,679)75,000,000 Great Britain Pound Sterling . . . . . . . . . . . . . . . . . . . . . . . . . . . . JPM 2/21/18 (94,346,250) (94,662,006) (315,756)75,000,000 Great Britain Pound Sterling . . . . . . . . . . . . . . . . . . . . . . . . . . . . NTC 2/21/18 (94,380,000) (94,662,006) (282,006)50,000,000 Great Britain Pound Sterling . . . . . . . . . . . . . . . . . . . . . . . . . . . . NTC 3/12/18 (62,005,000) (63,146,361) (1,141,361)60,000,000 Great Britain Pound Sterling . . . . . . . . . . . . . . . . . . . . . . . . . . . . JPM 3/15/18 (74,172,000) (75,782,906) (1,610,906)45,000,000 Great Britain Pound Sterling . . . . . . . . . . . . . . . . . . . . . . . . . . . . SSB 3/28/18 (56,904,075) (56,859,981) 44,094
2,000,000,000 Japanese Yen. . . . . . . . . . . . . . . . . . . . . . . . . . . . . . . . . . . . . . . . SSB 6/7/17 (16,641,704) (17,995,203) (1,353,499)1,200,000,000 Japanese Yen. . . . . . . . . . . . . . . . . . . . . . . . . . . . . . . . . . . . . . . . JPM 8/21/17 (10,733,904) (10,835,258) (101,354)3,500,000,000 Japanese Yen . . . . . . . . . . . . . . . . . . . . . . . . . . . . . . . . . . . . . . . . JPM 9/6/17 (31,780,219) (31,626,590) 153,6293,000,000,000 Japanese Yen. . . . . . . . . . . . . . . . . . . . . . . . . . . . . . . . . . . . . . . . BNY 9/19/17 (27,090,482) (27,125,071) (34,589)
420,000,000 Mexican Peso . . . . . . . . . . . . . . . . . . . . . . . . . . . . . . . . . . . . . . . NTC 11/22/17 (19,622,134) (21,534,769) (1,912,635)250,000,000 Mexican Peso . . . . . . . . . . . . . . . . . . . . . . . . . . . . . . . . . . . . . . . BNY 3/15/18 (12,112,403) (12,612,065) (499,662)310,000,000 Norwegian Krone . . . . . . . . . . . . . . . . . . . . . . . . . . . . . . . . . . . . JPM 1/12/18 (36,601,925) (36,251,435) 350,49080,000,000 Singapore Dollar . . . . . . . . . . . . . . . . . . . . . . . . . . . . . . . . . . . . . JPM 4/27/17 (59,180,352) (57,264,708) 1,915,64427,000,000 Singapore Dollar . . . . . . . . . . . . . . . . . . . . . . . . . . . . . . . . . . . . . JPM 5/22/17 (19,555,298) (19,330,705) 224,59340,000,000 Singapore Dollar . . . . . . . . . . . . . . . . . . . . . . . . . . . . . . . . . . . . . SSB 5/31/17 (28,781,120) (28,640,165) 140,95560,000,000 Singapore Dollar . . . . . . . . . . . . . . . . . . . . . . . . . . . . . . . . . . . . . JPM 6/8/17 (43,296,291) (42,962,708) 333,58345,000,000 Singapore Dollar . . . . . . . . . . . . . . . . . . . . . . . . . . . . . . . . . . . . . BNY 7/13/17 (33,190,736) (32,230,630) 960,10633,000,000 Singapore Dollar . . . . . . . . . . . . . . . . . . . . . . . . . . . . . . . . . . . . . SSB 8/17/17 (24,571,305) (23,642,753) 928,55240,000,000 Singapore Dollar . . . . . . . . . . . . . . . . . . . . . . . . . . . . . . . . . . . . . SSB 9/21/17 (29,289,846) (28,666,321) 623,52550,000,000 Singapore Dollar . . . . . . . . . . . . . . . . . . . . . . . . . . . . . . . . . . . . . JPM 12/07/17 (35,014,005) (35,855,874) (841,869)50,000,000 Singapore Dollar . . . . . . . . . . . . . . . . . . . . . . . . . . . . . . . . . . . . . SSB 12/28/17 (34,569,611) (35,862,135) (1,292,524)
40,000,000,000 South Korean Won . . . . . . . . . . . . . . . . . . . . . . . . . . . . . . . . . . . JPM 5/2/17 (34,650,035) (35,783,699) (1,133,664)35,000,000,000 South Korean Won . . . . . . . . . . . . . . . . . . . . . . . . . . . . . . . . . . . JPM 5/31/17 (29,355,028) (31,319,910) (1,964,882)35,000,000,000 South Korean Won . . . . . . . . . . . . . . . . . . . . . . . . . . . . . . . . . . . SSB 6/8/17 (29,209,263) (31,322,900) (2,113,637)25,000,000,000 South Korean Won . . . . . . . . . . . . . . . . . . . . . . . . . . . . . . . . . . . SSB 8/23/17 (22,711,787) (22,399,383) 312,40440,000,000,000 South Korean Won . . . . . . . . . . . . . . . . . . . . . . . . . . . . . . . . . . . SSB 8/28/17 (35,571,365) (35,841,980) (270,615)34,000,000,000 South Korean Won . . . . . . . . . . . . . . . . . . . . . . . . . . . . . . . . . . . JPM 10/26/17 (30,316,540) (30,499,916) (183,376)25,000,000,000 South Korean Won . . . . . . . . . . . . . . . . . . . . . . . . . . . . . . . . . . . SSB 12/28/17 (20,992,350) (22,457,790) (1,465,440)55,400,000,000 South Korean Won . . . . . . . . . . . . . . . . . . . . . . . . . . . . . . . . . . . BNY 2/13/18 (48,914,003) (49,818,470) (904,467)74,000,000,000 South Korean Won . . . . . . . . . . . . . . . . . . . . . . . . . . . . . . . . . . . JPM 2/14/18 (64,983,534) (66,546,006) (1,562,472)
115,000,000,000 South Korean Won . . . . . . . . . . . . . . . . . . . . . . . . . . . . . . . . . . . SSB 2/26/18 (101,205,667) (103,443,691) (2,238,024)45,000,000 Swiss Franc . . . . . . . . . . . . . . . . . . . . . . . . . . . . . . . . . . . . . . . . . SSB 4/27/17 (47,329,063) (45,027,331) 2,301,73240,000,000 Swiss Franc . . . . . . . . . . . . . . . . . . . . . . . . . . . . . . . . . . . . . . . . . NTC 6/8/17 (41,298,849) (40,127,901) 1,170,94860,000,000 Swiss Franc . . . . . . . . . . . . . . . . . . . . . . . . . . . . . . . . . . . . . . . . . BNY 8/17/17 (62,794,348) (60,466,459) 2,327,88940,000,000 Swiss Franc . . . . . . . . . . . . . . . . . . . . . . . . . . . . . . . . . . . . . . . . . BNY 11/08/17 (41,788,550) (40,539,200) 1,249,35080,000,000 Swiss Franc . . . . . . . . . . . . . . . . . . . . . . . . . . . . . . . . . . . . . . . . . JPM 11/13/17 (84,334,809) (81,107,284) 3,227,525
SEE NOTES TO FINANCIAL STATEMENTSII-12

Tweedy, Browne Global Value Fund
Schedule of Forward Exchange ContractsMarch 31, 2017
ContractsCounter-
partyContract
Value DateContract Value onOrigination Date
Value 03/31/17(Note 2)
UnrealizedAppreciation
(Depreciation)
FORWARD EXCHANGE CONTRACTS TO SELL(a) (continued)100,000,000 Swiss Franc . . . . . . . . . . . . . . . . . . . . . . . . . . . . . . . . . . . . . . . . . BNY 11/15/17 $(104,799,832) $(101,398,553) $3,401,27980,000,000 Swiss Franc . . . . . . . . . . . . . . . . . . . . . . . . . . . . . . . . . . . . . . . . . SSB 11/20/17 (82,826,024) (81,147,755) 1,678,26970,000,000 Swiss Franc . . . . . . . . . . . . . . . . . . . . . . . . . . . . . . . . . . . . . . . . . JPM 11/22/17 (71,501,532) (71,014,409) 487,12365,000,000 Swiss Franc . . . . . . . . . . . . . . . . . . . . . . . . . . . . . . . . . . . . . . . . . JPM 12/13/17 (65,957,706) (66,040,825) (83,119)50,000,000 Swiss Franc . . . . . . . . . . . . . . . . . . . . . . . . . . . . . . . . . . . . . . . . . BNY 12/18/17 (50,289,921) (50,818,777) (528,856)
100,000,000 Swiss Franc . . . . . . . . . . . . . . . . . . . . . . . . . . . . . . . . . . . . . . . . . BNY 3/12/18 (101,224,820) (102,251,034) (1,026,214)100,000,000 Swiss Franc . . . . . . . . . . . . . . . . . . . . . . . . . . . . . . . . . . . . . . . . . NTC 3/15/18 (101,332,523) (102,273,081) (940,558)65,000,000 Swiss Franc . . . . . . . . . . . . . . . . . . . . . . . . . . . . . . . . . . . . . . . . . NTC 3/26/18 (66,810,566) (66,554,036) 256,530
650,000,000 Thailand Baht . . . . . . . . . . . . . . . . . . . . . . . . . . . . . . . . . . . . . . . JPM 5/16/17 (18,197,088) (18,908,319) (711,231)850,000,000 Thailand Baht . . . . . . . . . . . . . . . . . . . . . . . . . . . . . . . . . . . . . . . BNY 6/5/17 (23,617,672) (24,722,718) (1,105,046)500,000,000 Thailand Baht . . . . . . . . . . . . . . . . . . . . . . . . . . . . . . . . . . . . . . . JPM 6/13/17 (14,048,890) (14,542,549) (493,659)400,000,000 Thailand Baht . . . . . . . . . . . . . . . . . . . . . . . . . . . . . . . . . . . . . . . BNY 8/28/17 (11,444,921) (11,633,493) (188,572)
TOTAL . . . . . . . . . . . . . . . . . . . . . . . . . . . . . . . . . . . . . . . . . . . . . . . . . . . . . . . . . . . $(5,395,133,444) $(5,303,176,640) $91,956,804
Unrealized Appreciation on Forward Contracts (Net). . . . . . . . . . . . . . . . . . . . . . . . $94,881,530
(a) Primary risk exposure being hedged against is currency risk.
Counterparty Abbreviations:BNY — The Bank of New York MellonJPM — JPMorgan Chase Bank NA
NTC — Northern Trust CompanySSB — State Street Bank and Trust Company
SEE NOTES TO FINANCIAL STATEMENTSII-13

Tweedy, BrowneGlobal Value Fund II – Currency UnhedgedPortfolio Highlights as of March 31, 2017 (Unaudited)
Hypothetical Illustration of $10,000 Invested inTweedy, Browne Global Value Fund II – Currency Unhedged vs.
MSCI EAFE Index (in US$)10/26/09 through 3/31/17
$10,000
$11,000
$12,000
Mar
201
7
$16,000
$13,000
$9,000
$17,000
$15,000
$14,000
$15,438
$14,013
Tweedy, Browne Global Value Fund II - Currency UnhedgedMSCI EAFE Index (in US$)
Oct
200
9
Sep
2011
Sep
2016
Mar
201
6
Sep
2015
Mar
201
5
Mar
201
4
Sep
2013
Sep
2014
Mar
201
3
Sep
2012
Sep
2010
Mar
201
0
Mar
201
2
Mar
201
1
Average Annual Total Returns – For Periods Ended March 31, 2017
Tweedy, BrowneGlobal Value Fund II –
Currency UnhedgedMSCI EAFE
Index (in US$)
1 Year 11.17% 11.67%5 Years 5.31 5.83Since Inception(10/26/09) 6.02 4.64Total Annual Fund Operating Expense Ratios as of 3/31/16 and 3/31/17 were 1.40% and 1.42%, respectively.
The preceding performance data represents past performance and is not a guarantee of future results. Total return and principal value of an investment will fluctuate so thatan investor’s shares, when redeemed, may be worth more or less than their original cost. The graph and table do not reflect the deduction of taxes that a shareholder wouldpay on Fund distributions or the redemption of Fund shares. Current performance may be lower or higher than the performance data shown. Results are annualized for allperiods greater than one year. Please visit www.tweedy.com to obtain performance data that is current to the most recent month end.
The Fund does not impose any front-end or deferred sales charges. However, the Fund imposes a 2% redemption fee on redemption proceeds for redemptions or exchangesmade less than 15 days after purchase. Performance data does not reflect the deduction of the redemption fee, and, if reflected, the redemption fee would reduce theperformance data quoted for periods of 14 days or less. The expense ratios shown above reflect the inclusion of acquired fund fees and expenses (i.e., the fees and expensesattributable to investing cash balances in money market funds) and may differ from those shown in the Fund’s financial statements.
The Global Value Fund II – Currency Unhedged’s performance data shown above would have been lower had fees and expenses not been waived and/or reimbursed from October 26, 2009through December 31, 2014.
The MSCI EAFE Index is a free float-adjusted market capitalization weighted index that is designed to measure the equity market performance of developed markets, excluding the U.S. andCanada. The MSCI EAFE Index (in US$) reflects the return of the MSCI EAFE Index for a U.S. dollar investor. Results for each index are inclusive of dividends and net of foreign withholdingtaxes.
Indexes are unmanaged, and the figures for the index shown include reinvestment of dividends and capital gains distributions and do not reflect any fees or expenses. Investors cannot invest directlyin an index.
II-14

Tweedy, Browne Global Value Fund II – Currency Unhedged
Perspective On Assessing Investment Results (Unaudited)
March 31, 2017
In accordance with rules and guidelines set out by theUnited States Securities and Exchange Commission, we haveprovided a comparison of the historical investment results ofTweedy, Browne Global Value Fund II – Currency Unhedgedto the results of the MSCI EAFE Index (in US$). Althoughwe believe this comparison may be useful, the historicalresults of the MSCI EAFE Index (in US$) in large measurerepresent the investment results of stocks that we do not own.Any portfolio that does not own exactly the same stocks inexactly the same proportions as the index to which theparticular portfolio is being compared is not likely to have thesame results as the index. The investment behavior of adiversified portfolio of undervalued stocks tends to becorrelated to the investment behavior of a broad index; i.e.,when the index is up, probably more than one-half of thestocks in the entire universe of public companies in all thecountries that are included in the same index will be up,albeit in greater or lesser percentages than the index.Similarly, when the index declines, probably more than one-half of the stocks in the entire universe of public companies inall the countries that are included in the index will be downin greater or lesser percentages than the index. But it is almosta mathematical truth that “different stocks equal differentresults.”
We believe that favorable or unfavorable historicalinvestment results in comparison to an index are notnecessarily predictive of future comparative investmentresults. In 1986, V. Eugene Shahan, a Columbia UniversityBusiness School alumnus and portfolio manager at U.S. Trust,wrote Are Short-Term Performance and Value InvestingMutually Exclusive? In this article, Mr. Shahan analyzed the
investment performance of seven money managers, aboutwhom Warren Buffett wrote in his article, The Superinvestorsof Graham and Doddsville. Over long periods of time, the sevenmanagers significantly outperformed the market as measuredby the Dow Jones Industrial Average (the DJIA) or theS&P 500 Index (the S&P 500) by between 7.7% and 16.5%annually. (The goal of most institutional money managers isto outperform the market by 2% to 3%.) However, for periodsranging from 13 years to 28 years, this group of managersunderperformed the market between 7.7% and 42% of theyears. Six of the seven investment managers underperformedthe market between 28% and 42% of the years. In today’senvironment, they would have lost many of their clientsduring their periods of underperformance. Longer term, itwould have been the wrong decision to fire any of thosemoney managers. In examining the seven long-terminvestment records, unfavorable investment results ascompared to either index did not predict the future favorablecomparative investment results that occurred, and favorableinvestment results in comparison to the DJIA or the S&P 500were not always followed by future favorable comparativeresults. Stretches of consecutive annual underperformanceranged from one to six years.
Mr. Shahan concluded:Unfortunately, there is no way to distinguish between apoor three-year stretch for a manager who will do wellover 15 years, from a poor three-year stretch for amanager who will continue to do poorly. Nor is there anyreason to believe that a manager who does well from theoutset cannot continue to do well, and consistently.
II-15

Tweedy, Browne Global Value Fund II – Currency Unhedged
Portfolio of InvestmentsMarch 31, 2017
SharesValue
(Note 2)
COMMON STOCKS—84.6%
Canada—0.6%3,500 E-L Financial Corp., Ltd. . . . . . . . . . . . . . . . . . . $2,149,365
China—1.4%29,386 Baidu Inc., Sponsored ADR(a) . . . . . . . . . . . . . . 5,069,673
France—13.2%194,310 CNP Assurances . . . . . . . . . . . . . . . . . . . . . . . . 3,965,298167,400 Safran SA . . . . . . . . . . . . . . . . . . . . . . . . . . . . . 12,538,394414,885 SCOR SE . . . . . . . . . . . . . . . . . . . . . . . . . . . . . 15,721,76229,680 Teleperformance SA . . . . . . . . . . . . . . . . . . . . . 3,214,114
218,433 Total SA . . . . . . . . . . . . . . . . . . . . . . . . . . . . . . 11,077,36246,516,930
Germany—8.3%177,000 Axel Springer SE . . . . . . . . . . . . . . . . . . . . . . . . 9,800,62550,800 Henkel AG & Company, KGaA . . . . . . . . . . . . 5,658,81326,726 Krones AG . . . . . . . . . . . . . . . . . . . . . . . . . . . . 3,005,70029,038 Muenchener Rueckversicherungs AG . . . . . . . . 5,695,97936,984 Siemens AG . . . . . . . . . . . . . . . . . . . . . . . . . . . 5,079,035
29,240,152
Hong Kong—1.5%4,870,000 Emperor Entertainment Hotel Ltd. . . . . . . . . . . 1,121,701
316,349 Great Eagle Holdings Ltd. . . . . . . . . . . . . . . . . . 1,487,81520,587 Jardine Strategic Holdings Ltd. . . . . . . . . . . . . . 864,654
109,796 Miramar Hotel & Investment . . . . . . . . . . . . . . 235,9384,448,000 Oriental Watch Holdings . . . . . . . . . . . . . . . . . 1,024,502
655,000 Tai Cheung Holdings Ltd. . . . . . . . . . . . . . . . . . 595,0335,329,643
Italy—1.0%113,408 Buzzi Unicem SpA . . . . . . . . . . . . . . . . . . . . . . 2,911,10166,455 SOL SpA . . . . . . . . . . . . . . . . . . . . . . . . . . . . . 682,341
3,593,442
Japan—2.1%110,200 Ebara Corporation . . . . . . . . . . . . . . . . . . . . . . . 3,594,87661,700 Lintec Corporation . . . . . . . . . . . . . . . . . . . . . . 1,313,95683,600 NGK Spark Plug Company Ltd. . . . . . . . . . . . . 1,908,628
Undisclosed Securities(b) . . . . . . . . . . . . . . . . . . 619,4207,436,880
Netherlands—6.3%54,850 Akzo Nobel NV . . . . . . . . . . . . . . . . . . . . . . . . 4,560,02929,000 Heineken Holding NV . . . . . . . . . . . . . . . . . . . 2,312,94129,400 Heineken NV . . . . . . . . . . . . . . . . . . . . . . . . . . 2,509,300
181,407 Royal Dutch Shell PLC, Class A . . . . . . . . . . . . 4,775,911161,712 Unilever NV, CVA . . . . . . . . . . . . . . . . . . . . . . 8,054,727
22,212,908
Singapore—4.8%657,813 DBS Group Holdings Ltd. . . . . . . . . . . . . . . . . . 9,133,022488,670 United Overseas Bank Ltd. . . . . . . . . . . . . . . . . 7,732,408
16,865,430
South Korea—5.3%10,245 Hyundai Mobis Company Ltd. . . . . . . . . . . . . . 2,203,27556,125 Hyundai Motor Company . . . . . . . . . . . . . . . . . 7,904,576
SharesValue
(Note 2)
South Korea (continued)164,700 Kia Motors Corporation . . . . . . . . . . . . . . . . . $5,456,61732,000 LG Corporation . . . . . . . . . . . . . . . . . . . . . . . 2,008,76313,800 Samchully Company Ltd. . . . . . . . . . . . . . . . . 1,320,397
18,893,628
Switzerland—14.8%157,355 ABB Ltd. . . . . . . . . . . . . . . . . . . . . . . . . . . . . 3,683,32817,047 Coltene Holding AG . . . . . . . . . . . . . . . . . . . 1,356,505
142,100 Nestle SA, Registered . . . . . . . . . . . . . . . . . . . 10,910,020161,339 Novartis AG, Registered . . . . . . . . . . . . . . . . . 11,984,170
5,015 Phoenix Mecano AG . . . . . . . . . . . . . . . . . . . 2,580,27456,300 Roche Holding AG . . . . . . . . . . . . . . . . . . . . . 14,387,872
665 Tamedia AG . . . . . . . . . . . . . . . . . . . . . . . . . . 102,31326,799 Zurich Insurance Group AG . . . . . . . . . . . . . . 7,159,251
52,163,733
Thailand—1.8%1,220,100 Bangkok Bank Public Company Ltd.,
NVDR . . . . . . . . . . . . . . . . . . . . . . . . . . . . 6,444,471
United Kingdom—13.8%547,600 BAE Systems PLC . . . . . . . . . . . . . . . . . . . . . . 4,399,507238,503 Daily Mail & General Trust PLC, Class A . . . 2,147,305344,873 Diageo PLC . . . . . . . . . . . . . . . . . . . . . . . . . . 9,847,538
2,477,190 G4S PLC . . . . . . . . . . . . . . . . . . . . . . . . . . . . 9,426,0285,174 GlaxoSmithKline PLC . . . . . . . . . . . . . . . . . . 107,367
821,432 HSBC Holdings PLC . . . . . . . . . . . . . . . . . . . 6,685,800116,639 Imperial Brands PLC . . . . . . . . . . . . . . . . . . . . 5,640,082
5,082 Shire PLC . . . . . . . . . . . . . . . . . . . . . . . . . . . . 296,197831,653 Standard Chartered PLC(a) . . . . . . . . . . . . . . . 7,934,767144,469 TT Electronics PLC . . . . . . . . . . . . . . . . . . . . 364,013
Undisclosed Securities(b) . . . . . . . . . . . . . . . . . 1,945,71748,794,321
United States—9.7%53,840 AGCO Corp . . . . . . . . . . . . . . . . . . . . . . . . . . 3,240,09089,387 Avnet, Inc. . . . . . . . . . . . . . . . . . . . . . . . . . . . 4,090,349
212,500 Cisco Systems, Inc. . . . . . . . . . . . . . . . . . . . . . 7,182,50029,399 ConocoPhillips . . . . . . . . . . . . . . . . . . . . . . . . 1,466,12870,900 Halliburton Company . . . . . . . . . . . . . . . . . . . 3,488,98978,600 Johnson & Johnson . . . . . . . . . . . . . . . . . . . . . 9,789,63036,100 MasterCard, Inc., Class A . . . . . . . . . . . . . . . . 4,060,16714,700 Phillips 66 . . . . . . . . . . . . . . . . . . . . . . . . . . . . 1,164,534
34,482,387
TOTAL COMMON STOCKS(Cost $245,227,964) . . . . . . . . . . . . . . . . . . 299,192,963
SEE NOTES TO FINANCIAL STATEMENTSII-16
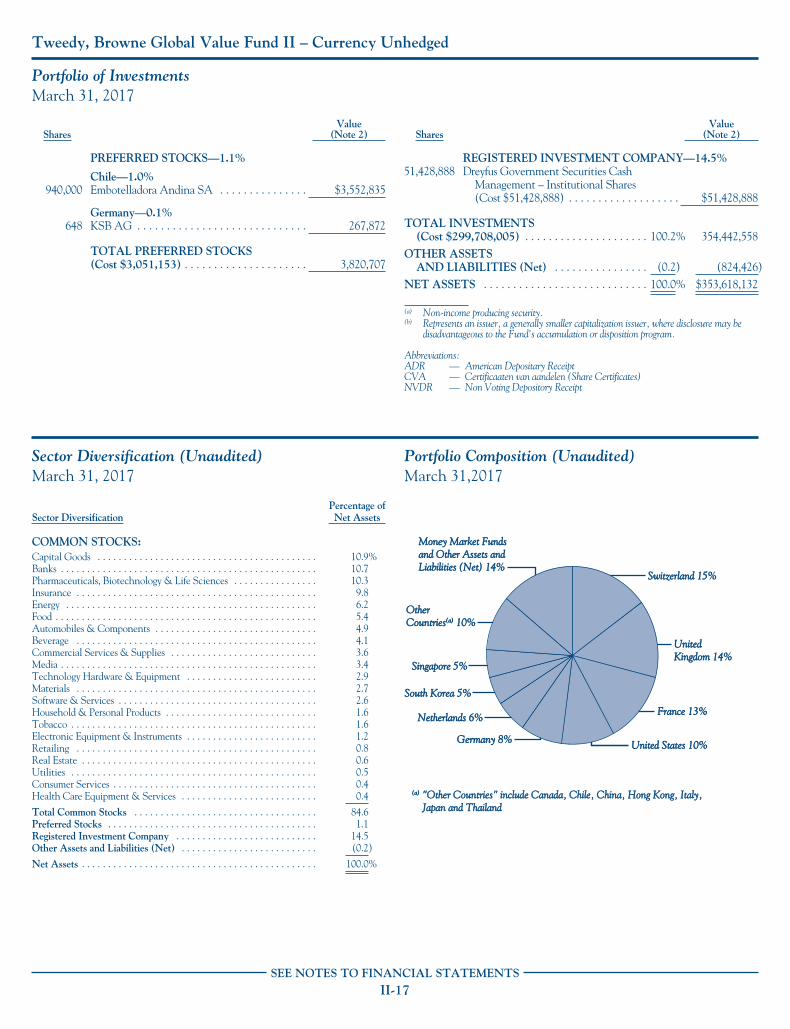
Tweedy, Browne Global Value Fund II – Currency Unhedged
Portfolio of InvestmentsMarch 31, 2017
SharesValue
(Note 2)
PREFERRED STOCKS—1.1%
Chile—1.0%940,000 Embotelladora Andina SA . . . . . . . . . . . . . . . $3,552,835
Germany—0.1%648 KSB AG . . . . . . . . . . . . . . . . . . . . . . . . . . . . . 267,872
TOTAL PREFERRED STOCKS(Cost $3,051,153) . . . . . . . . . . . . . . . . . . . . . 3,820,707
SharesValue
(Note 2)
REGISTERED INVESTMENT COMPANY—14.5%51,428,888 Dreyfus Government Securities Cash
Management – Institutional Shares(Cost $51,428,888) . . . . . . . . . . . . . . . . . . . $51,428,888
TOTAL INVESTMENTS(Cost $299,708,005) . . . . . . . . . . . . . . . . . . . . . 100.2% 354,442,558
OTHER ASSETSAND LIABILITIES (Net) . . . . . . . . . . . . . . . . (0.2) (824,426)
NET ASSETS . . . . . . . . . . . . . . . . . . . . . . . . . . . . 100.0% $353,618,132
(a) Non-income producing security.(b) Represents an issuer, a generally smaller capitalization issuer, where disclosure may be
disadvantageous to the Fund’s accumulation or disposition program.
Abbreviations:ADR — American Depositary ReceiptCVA — Certificaaten van aandelen (Share Certificates)NVDR — Non Voting Depository Receipt
Sector Diversification (Unaudited)March 31, 2017
Sector DiversificationPercentage ofNet Assets
COMMON STOCKS:Capital Goods . . . . . . . . . . . . . . . . . . . . . . . . . . . . . . . . . . . . . . . . . . 10.9%Banks . . . . . . . . . . . . . . . . . . . . . . . . . . . . . . . . . . . . . . . . . . . . . . . . . 10.7Pharmaceuticals, Biotechnology & Life Sciences . . . . . . . . . . . . . . . . 10.3Insurance . . . . . . . . . . . . . . . . . . . . . . . . . . . . . . . . . . . . . . . . . . . . . . 9.8Energy . . . . . . . . . . . . . . . . . . . . . . . . . . . . . . . . . . . . . . . . . . . . . . . . 6.2Food . . . . . . . . . . . . . . . . . . . . . . . . . . . . . . . . . . . . . . . . . . . . . . . . . . 5.4Automobiles & Components . . . . . . . . . . . . . . . . . . . . . . . . . . . . . . . 4.9Beverage . . . . . . . . . . . . . . . . . . . . . . . . . . . . . . . . . . . . . . . . . . . . . . 4.1Commercial Services & Supplies . . . . . . . . . . . . . . . . . . . . . . . . . . . . 3.6Media . . . . . . . . . . . . . . . . . . . . . . . . . . . . . . . . . . . . . . . . . . . . . . . . . 3.4Technology Hardware & Equipment . . . . . . . . . . . . . . . . . . . . . . . . . 2.9Materials . . . . . . . . . . . . . . . . . . . . . . . . . . . . . . . . . . . . . . . . . . . . . . 2.7Software & Services . . . . . . . . . . . . . . . . . . . . . . . . . . . . . . . . . . . . . . 2.6Household & Personal Products . . . . . . . . . . . . . . . . . . . . . . . . . . . . . 1.6Tobacco . . . . . . . . . . . . . . . . . . . . . . . . . . . . . . . . . . . . . . . . . . . . . . . 1.6Electronic Equipment & Instruments . . . . . . . . . . . . . . . . . . . . . . . . . 1.2Retailing . . . . . . . . . . . . . . . . . . . . . . . . . . . . . . . . . . . . . . . . . . . . . . 0.8Real Estate . . . . . . . . . . . . . . . . . . . . . . . . . . . . . . . . . . . . . . . . . . . . . 0.6Utilities . . . . . . . . . . . . . . . . . . . . . . . . . . . . . . . . . . . . . . . . . . . . . . . 0.5Consumer Services . . . . . . . . . . . . . . . . . . . . . . . . . . . . . . . . . . . . . . . 0.4Health Care Equipment & Services . . . . . . . . . . . . . . . . . . . . . . . . . . 0.4
Total Common Stocks . . . . . . . . . . . . . . . . . . . . . . . . . . . . . . . . . . . 84.6Preferred Stocks . . . . . . . . . . . . . . . . . . . . . . . . . . . . . . . . . . . . . . . . 1.1Registered Investment Company . . . . . . . . . . . . . . . . . . . . . . . . . . . 14.5Other Assets and Liabilities (Net) . . . . . . . . . . . . . . . . . . . . . . . . . . (0.2)
Net Assets . . . . . . . . . . . . . . . . . . . . . . . . . . . . . . . . . . . . . . . . . . . . . 100.0%
Portfolio Composition (Unaudited)March 31,2017
(a)(a) "Other Countries" include Canada, Chile, China, Hong Kong, Italy,"Other Countries" include Canada, Chile, China, Hong Kong, Italy, Japan and ThailandJapan and Thailand
Money Market FundsMoney Market Fundsand Other Assets andand Other Assets andLiabilities (Net) 14%Liabilities (Net) 14%
UnitedUnitedKingdom 14%Kingdom 14%
France 13%France 13%
Switzerland 15%Switzerland 15%
South Korea 5%South Korea 5%
Netherlands 6%Netherlands 6%
Singapore 5%Singapore 5%
OtherOtherCountriesCountries(a)(a) 10% 10%
United States 10%United States 10%Germany 8%Germany 8%
SEE NOTES TO FINANCIAL STATEMENTSII-17

Tweedy, BrowneValue FundPortfolio Highlights as of March 31, 2017 (Unaudited)
Hypothetical Illustration of $10,000 Invested in Tweedy, BrowneValue Fund vs. the MSCI World Index (Hedged to US$)
and S&P 500/MSCI World Index (Hedged to US$)12/8/93 through 3/31/17
$64,668$63,629
$52,863
Dec
199
3M
ar 1
994
Mar
199
5
Mar
199
6
Mar
199
7
Mar
199
8
Mar
199
9
Mar
200
0
Mar
200
1
Mar
200
2
Mar
200
3
Mar
200
4
Mar
200
5
Mar
200
6
Mar
200
7
Mar
200
8
Mar
200
9
Mar
201
0
Mar
201
1
Mar
201
2
Mar
201
3
Tweedy, Browne Value Fund
$20,000
$10,000
$30,000
$40,000
$70,000
$60,000
$50,000
Mar
201
4
Mar
201
6
Mar
201
7
Mar
201
5
MSCI World Index (Hedged to US$)S&P 500/MSCI World Index (Hedged to US$)
Average Annual Total Returns – For Periods Ended March 31, 2017
Tweedy, BrowneValue Fund
MSCI World Index(Hedged to US$)
S&P 500/MSCI WorldIndex (Hedged to US$)
1 Year 16.57% 17.59% 17.59%5 Years 8.17 11.61 11.6110 Years 5.23 4.90 4.90Since Inception(12/8/93) 8.34 7.40 8.26Total Annual Fund Operating Expense Ratios as of 3/31/16 and 3/31/17 were 1.38% and 1.40%, respectively.
The preceding performance data represents past performance and is not a guarantee of future results. Total return and principal value of an investment will fluctuate so thatan investor’s shares, when redeemed, may be worth more or less than their original cost. The graph and table do not reflect the deduction of taxes that a shareholder wouldpay on Fund distributions or the redemption of Fund shares. Current performance may be lower or higher than the performance data shown. Results are annualized for allperiods greater than one year. Please visit www.tweedy.com to obtain performance data that is current to the most recent month end.
The Fund does not impose any front-end or deferred sales charges. The expense ratios shown above reflect the inclusion of acquired fund fees and expenses (i.e., the fees andexpenses attributable to investing cash balances in money market funds) and may differ from those shown in the Fund’s financial statements.
The Value Fund’s performance data shown above would have been lower had certain fees and expenses not been waived and/or reimbursed from December 8, 1993 through March 31, 1999.
The MSCI World Index is a free float-adjusted market capitalization weighted index that is designed to measure the equity market performance of developed markets. The MSCI World Index(Hedged to US$) consists of the results of the MSCI World Index with its foreign currency exposure hedged 100% back into U.S. dollars. The MSCI World Index (Hedged to US$) accounts forinterest rate differentials in forward currency exchange rates. Results for each index are inclusive of dividends and net of foreign withholding taxes. The inception date for the Fund is December 8,1993. Prior to 2004, information with respect to the MSCI World indexes used was available at month end only; therefore the closest month end to the Fund’s inception date, November 30,1993, was used.
The S&P 500 Index is a market capitalization weighted index composed of 500 widely held common stocks. The S&P 500/MSCI World Index (Hedged to US$) is a combination of theS&P 500 Index and the MSCI World Index (Hedged to US$), linked together by Tweedy, Browne, and represents the performance of the S&P 500 Index for the periods 12/8/93 – 12/31/06and the performance of the MSCI World Index (Hedged to US$) beginning 1/1/07 and thereafter. For the period from the Fund’s inception through 2006, the Investment Adviser chose the S&P500 Index as the benchmark for the Fund. Starting in mid-December 2006, the Fund’s investment mandate changed from investing at least 80% of its assets in U.S. securities to investing no lessthan approximately 50% of its assets in U.S. securities, and the Investment Adviser chose the MSCI World Index (Hedged to US$) as the benchmark for the Fund starting January 1, 2007.Effective July 29, 2013, the Value Fund removed the 50% requirement, but continues to use the MSCI World Index (Hedged to US$) as its benchmark.
Indexes are unmanaged, and the figures for the indexes shown include reinvestment of dividends and capital gains distributions and do not reflect any fees or expenses. Investors cannot investdirectly in an index.
II-18

Tweedy, Browne Value Fund
Perspective on Assessing Investment Results (Unaudited)
March 31, 2017
In accordance with rules and guidelines set out by theUnited States Securities and Exchange Commission, we haveprovided a comparison of the historical investment results ofTweedy, Browne Value Fund to the results of the MSCIWorld Index (Hedged to US$) and the S&P 500/MSCIWorld Index (Hedged to US$). For the period from theFund’s inception through 2006, the Investment Adviser chosethe S&P 500 Index (S&P 500) as the Fund’s benchmark.Starting in mid-December 2006, the Fund’s investmentmandate changed from investing at least 80% of its assets inU.S. securities to investing no less than approximately 50% ofits assets in U.S. securities, and so the Investment Adviserchose the MSCI World Index (Hedged to US$) as thebenchmark for the Fund for periods starting January 1, 2007.(Effective July 29, 2013, the Fund removed the 50%requirement, but continues to use the MSCI World Index(hedged to US$) as its benchmark.) The S&P 500/MSCIWorld Index (Hedged to US$) is a combination of the S&P500 and the MSCI World Index (Hedged to US$), linkedtogether by the Investment Adviser, and represents theperformance of the S&P 500 for the periods 12/8/93 –12/31/06, and the performance of the MSCI World Index(Hedged to US$) beginning 1/1/07 and thereafter. Althoughwe believe this comparison may be useful, the historicalresults of the S&P 500 and the MSCI World Index (hedgedto US$) in large measure represent the investment results ofstocks that we do not own. Any portfolio that does not ownexactly the same stocks in exactly the same proportions as theindex to which the particular portfolio is being compared isnot likely to have the same results as the index. Theinvestment behavior of a diversified portfolio of undervaluedstocks tends to be correlated to the investment behavior of abroad index; i.e., when the index is up, probably more thanone-half of the stocks in the entire universe of publiccompanies that are included in the same index will be up,albeit in greater or lesser percentages than the index.Similarly, when the index declines, probably more than one-half of the stocks in the entire universe of public companiesthat are included in the index will be down in greater or lesserpercentages than the index. But it is almost a mathematicaltruth that “different stocks equal different results.”
We believe that favorable or unfavorable historicalinvestment results in comparison to an index are notnecessarily predictive of future comparative investmentresults. In 1986, V. Eugene Shahan, a Columbia UniversityBusiness School alumnus and portfolio manager at U.S. Trust,wrote Are Short-Term Performance and Value InvestingMutually Exclusive? In this article, Mr. Shahan analyzed theinvestment performance of seven money managers, aboutwhom Warren Buffett wrote in his article, The Superinvestorsof Graham and Doddsville. Over long periods of time, the sevenmanagers significantly outperformed the market as measuredby the Dow Jones Industrial Average (the DJIA) or theS&P 500 by between 7.7% and 16.5% annually. (The goal ofmost institutional money managers is to outperform themarket by 2% to 3%.) However, for periods ranging from 13years to 28 years, this group of managers underperformed themarket between 7.7% and 42% of the years. Six of the seveninvestment managers underperformed the market between28% and 42% of the years. In today’s environment, theywould have lost many of their clients during their periods ofunderperformance. Longer term, it would have been thewrong decision to fire any of those money managers. Inexamining the seven long-term investment records,unfavorable investment results as compared to either indexdid not predict the future favorable comparative investmentresults that occurred, and favorable investment results incomparison to the DJIA or the S&P 500 were not alwaysfollowed by future favorable comparative results. Stretches ofconsecutive annual underperformance ranged from one to sixyears.
Mr. Shahan concluded:Unfortunately, there is no way to distinguish between apoor three-year stretch for a manager who will do wellover 15 years, from a poor three-year stretch for amanager who will continue to do poorly. Nor is there anyreason to believe that a manager who does well from theoutset cannot continue to do well, and consistently.
II-19

Tweedy, Browne Value Fund
Portfolio of InvestmentsMarch 31, 2017
SharesValue
(Note 2)
COMMON STOCKS—84.8%
Chile—1.5%846,500 Antofagasta PLC . . . . . . . . . . . . . . . . . . . . . . . $8,833,255
China—1.5%49,610 Baidu Inc., Sponsored ADR(a) . . . . . . . . . . . . . 8,558,717
France—4.9%360,300 CNP Assurances . . . . . . . . . . . . . . . . . . . . . . . 7,352,668411,111 Total SA . . . . . . . . . . . . . . . . . . . . . . . . . . . . . 20,848,613
28,201,281
Germany—4.2%164,718 Axel Springer SE . . . . . . . . . . . . . . . . . . . . . . . 9,120,56184,400 Henkel AG & Company, KGaA . . . . . . . . . . . 9,401,64929,300 Muenchener Rueckversicherungs AG . . . . . . . 5,747,372
24,269,582
Japan—0.5%87,000 Honda Motor Company Ltd. . . . . . . . . . . . . . . 2,616,324
Netherlands—9.2%297,000 Heineken Holding NV . . . . . . . . . . . . . . . . . . . 23,687,701765,749 Royal Dutch Shell PLC, Class A . . . . . . . . . . . 20,159,911183,946 Unilever NV, ADR . . . . . . . . . . . . . . . . . . . . . 9,138,437
52,986,049
Singapore—1.5%550,917 United Overseas Bank Ltd. . . . . . . . . . . . . . . . . 8,717,366
South Korea—4.4%92,075 Hyundai Motor Company . . . . . . . . . . . . . . . . 12,967,730
260,000 Kia Motors Corporation . . . . . . . . . . . . . . . . . . 8,613,96856,800 LG Corporation . . . . . . . . . . . . . . . . . . . . . . . . 3,565,555
25,147,253
Switzerland—11.8%238,000 Nestle SA, Registered, Sponsored ADR . . . . . . 18,302,200254,363 Novartis AG, Registered . . . . . . . . . . . . . . . . . 18,893,94079,800 Roche Holding AG . . . . . . . . . . . . . . . . . . . . . 20,393,46638,415 Zurich Insurance Group AG . . . . . . . . . . . . . . 10,262,422
67,852,028
United Kingdom—7.0%143,583 Diageo PLC, Sponsored ADR . . . . . . . . . . . . . 16,595,32378,645 Shire PLC . . . . . . . . . . . . . . . . . . . . . . . . . . . . 4,583,7161,099 Shire PLC, ADR . . . . . . . . . . . . . . . . . . . . . . . 191,479
952,235 Standard Chartered PLC(a) . . . . . . . . . . . . . . . . 9,085,235205,000 Unilever PLC, Sponsored ADR . . . . . . . . . . . . 10,114,700
40,570,453
United States—38.3%94,535 3M Company . . . . . . . . . . . . . . . . . . . . . . . . . . 18,087,3806,150 Alphabet Inc., Class A(a) . . . . . . . . . . . . . . . . . 5,213,9706,166 Alphabet Inc., Class C(a) . . . . . . . . . . . . . . . . . 5,115,067
SharesValue
(Note 2)
United States (continued)393,000 Bank of New York Mellon Corporation/The . . $18,561,390170,490 Baxter International, Inc. . . . . . . . . . . . . . . . . . 8,841,611
80 Berkshire Hathaway Inc., Class A(a) . . . . . . . . . 19,988,00030,626 Berkshire Hathaway Inc., Class B(a) . . . . . . . . . 5,104,742
527,475 Cisco Systems, Inc. . . . . . . . . . . . . . . . . . . . . . . 17,828,655460,136 Comcast Corporation, Class A . . . . . . . . . . . . . 17,296,512161,695 ConocoPhillips . . . . . . . . . . . . . . . . . . . . . . . . 8,063,730129,850 Emerson Electric Company . . . . . . . . . . . . . . . 7,772,821151,709 Halliburton Company . . . . . . . . . . . . . . . . . . . 7,465,600128,400 Johnson & Johnson . . . . . . . . . . . . . . . . . . . . . 15,992,220101,925 MasterCard, Inc., Class A . . . . . . . . . . . . . . . . 11,463,505488,706 MRC Global, Inc.(a) . . . . . . . . . . . . . . . . . . . . . 8,957,98136,818 National Western Life Insurance Company,
Class A . . . . . . . . . . . . . . . . . . . . . . . . . . . . 11,198,56351,335 Philip Morris International, Inc. . . . . . . . . . . . . 5,795,72257,532 Signet Jewelers Ltd. . . . . . . . . . . . . . . . . . . . . . 3,985,242
437,085 Wells Fargo & Company . . . . . . . . . . . . . . . . . 24,328,151221,060,862
TOTAL COMMON STOCKS(Cost $265,125,339) . . . . . . . . . . . . . . . . . . . 488,813,170
REGISTERED INVESTMENT COMPANY—12.2%70,429,753 Dreyfus Government Securities Cash
Management – Institutional Shares(Cost $70,429,753) . . . . . . . . . . . . . . . . . . . 70,429,753
Face Value
U.S. TREASURY BILL—2.4%$14,000,000 0.609%(b) due 06/08/17(c)
(Cost $13,984,147) . . . . . . . . . . . . . . . . . . . 13,981,772
TOTAL INVESTMENTS(Cost $349,539,239) . . . . . . . . . . . . . . . . . . . . . 99.4% 573,224,695
UNREALIZED APPRECIATIONON FORWARD CONTRACTS (Net) . . . . . . 0.3 1,753,961
OTHER ASSETSAND LIABILITIES (Net) . . . . . . . . . . . . . . . . 0.3 1,753,204
NET ASSETS . . . . . . . . . . . . . . . . . . . . . . . . . . . . 100.0% $576,731,860
(a) Non-income producing security.(b) Rate represents annualized yield at date of purchase.(c) This security has been segregated to cover certain open forward contracts. At
March 31, 2017, liquid assets totaling $13,981,772 have been segregated to cover suchopen forward contracts.
Abbreviations:ADR — American Depositary Receipt
SEE NOTES TO FINANCIAL STATEMENTSII-20
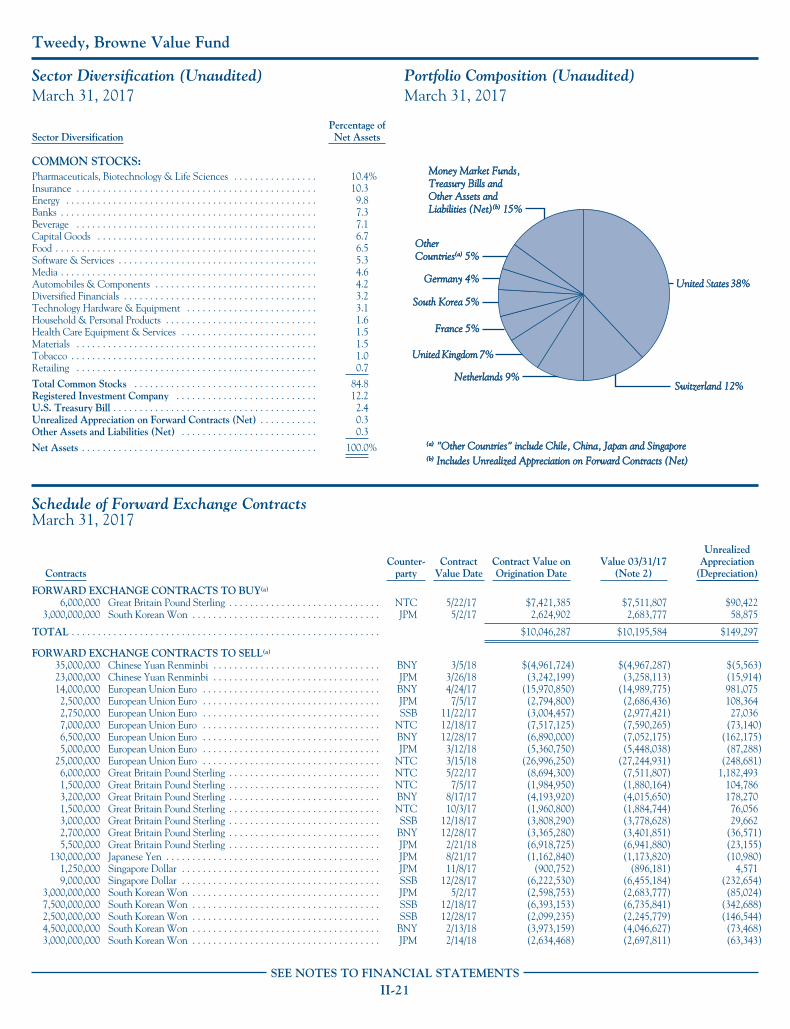
Tweedy, Browne Value Fund
Sector Diversification (Unaudited)March 31, 2017
Sector DiversificationPercentage ofNet Assets
COMMON STOCKS:Pharmaceuticals, Biotechnology & Life Sciences . . . . . . . . . . . . . . . . 10.4%Insurance . . . . . . . . . . . . . . . . . . . . . . . . . . . . . . . . . . . . . . . . . . . . . . 10.3Energy . . . . . . . . . . . . . . . . . . . . . . . . . . . . . . . . . . . . . . . . . . . . . . . . 9.8Banks . . . . . . . . . . . . . . . . . . . . . . . . . . . . . . . . . . . . . . . . . . . . . . . . . 7.3Beverage . . . . . . . . . . . . . . . . . . . . . . . . . . . . . . . . . . . . . . . . . . . . . . 7.1Capital Goods . . . . . . . . . . . . . . . . . . . . . . . . . . . . . . . . . . . . . . . . . . 6.7Food . . . . . . . . . . . . . . . . . . . . . . . . . . . . . . . . . . . . . . . . . . . . . . . . . . 6.5Software & Services . . . . . . . . . . . . . . . . . . . . . . . . . . . . . . . . . . . . . . 5.3Media . . . . . . . . . . . . . . . . . . . . . . . . . . . . . . . . . . . . . . . . . . . . . . . . . 4.6Automobiles & Components . . . . . . . . . . . . . . . . . . . . . . . . . . . . . . . 4.2Diversified Financials . . . . . . . . . . . . . . . . . . . . . . . . . . . . . . . . . . . . . 3.2Technology Hardware & Equipment . . . . . . . . . . . . . . . . . . . . . . . . . 3.1Household & Personal Products . . . . . . . . . . . . . . . . . . . . . . . . . . . . . 1.6Health Care Equipment & Services . . . . . . . . . . . . . . . . . . . . . . . . . . 1.5Materials . . . . . . . . . . . . . . . . . . . . . . . . . . . . . . . . . . . . . . . . . . . . . . 1.5Tobacco . . . . . . . . . . . . . . . . . . . . . . . . . . . . . . . . . . . . . . . . . . . . . . . 1.0Retailing . . . . . . . . . . . . . . . . . . . . . . . . . . . . . . . . . . . . . . . . . . . . . . 0.7
Total Common Stocks . . . . . . . . . . . . . . . . . . . . . . . . . . . . . . . . . . . 84.8Registered Investment Company . . . . . . . . . . . . . . . . . . . . . . . . . . . 12.2U.S. Treasury Bill . . . . . . . . . . . . . . . . . . . . . . . . . . . . . . . . . . . . . . . 2.4Unrealized Appreciation on Forward Contracts (Net) . . . . . . . . . . . 0.3Other Assets and Liabilities (Net) . . . . . . . . . . . . . . . . . . . . . . . . . . 0.3
Net Assets . . . . . . . . . . . . . . . . . . . . . . . . . . . . . . . . . . . . . . . . . . . . . 100.0%
Portfolio Composition (Unaudited)March 31, 2017
Money Market Funds,Money Market Funds,Treasury Bills andTreasury Bills andOther Assets andOther Assets andLiabilities (Net)Liabilities (Net)(b)(b) 15% 15%
(a)(a) "Other Countries" include Chile, China, Japan and Singapore"Other Countries" include Chile, China, Japan and Singapore(b)(b) Includes Unrealized Appreciation on Forward Contracts (Net)Includes Unrealized Appreciation on Forward Contracts (Net)
Germany 4%Germany 4% UnitedUnited Statestates 38%38%
South Korea 5%South Korea 5%
Switzerland 12%Switzerland 12%
OtherOtherCountriesCountries(a)(a) 5% 5%
UnitedUnited KingdomKingdom 7%7%
Netherlands 9%Netherlands 9%
France 5%France 5%
Schedule of Forward Exchange ContractsMarch 31, 2017
ContractsCounter-
partyContract
Value DateContract Value onOrigination Date
Value 03/31/17(Note 2)
UnrealizedAppreciation
(Depreciation)
FORWARD EXCHANGE CONTRACTS TO BUY(a)
6,000,000 Great Britain Pound Sterling . . . . . . . . . . . . . . . . . . . . . . . . . . . . . NTC 5/22/17 $7,421,385 $7,511,807 $90,4223,000,000,000 South Korean Won . . . . . . . . . . . . . . . . . . . . . . . . . . . . . . . . . . . . JPM 5/2/17 2,624,902 2,683,777 58,875
TOTAL . . . . . . . . . . . . . . . . . . . . . . . . . . . . . . . . . . . . . . . . . . . . . . . . . . . . . . . . . . . $10,046,287 $10,195,584 $149,297
FORWARD EXCHANGE CONTRACTS TO SELL(a)
35,000,000 Chinese Yuan Renminbi . . . . . . . . . . . . . . . . . . . . . . . . . . . . . . . . BNY 3/5/18 $(4,961,724) $(4,967,287) $(5,563)23,000,000 Chinese Yuan Renminbi . . . . . . . . . . . . . . . . . . . . . . . . . . . . . . . . JPM 3/26/18 (3,242,199) (3,258,113) (15,914)14,000,000 European Union Euro . . . . . . . . . . . . . . . . . . . . . . . . . . . . . . . . . . BNY 4/24/17 (15,970,850) (14,989,775) 981,0752,500,000 European Union Euro . . . . . . . . . . . . . . . . . . . . . . . . . . . . . . . . . . JPM 7/5/17 (2,794,800) (2,686,436) 108,3642,750,000 European Union Euro . . . . . . . . . . . . . . . . . . . . . . . . . . . . . . . . . . SSB 11/22/17 (3,004,457) (2,977,421) 27,0367,000,000 European Union Euro . . . . . . . . . . . . . . . . . . . . . . . . . . . . . . . . . . NTC 12/18/17 (7,517,125) (7,590,265) (73,140)6,500,000 European Union Euro . . . . . . . . . . . . . . . . . . . . . . . . . . . . . . . . . . BNY 12/28/17 (6,890,000) (7,052,175) (162,175)5,000,000 European Union Euro . . . . . . . . . . . . . . . . . . . . . . . . . . . . . . . . . . JPM 3/12/18 (5,360,750) (5,448,038) (87,288)
25,000,000 European Union Euro . . . . . . . . . . . . . . . . . . . . . . . . . . . . . . . . . . NTC 3/15/18 (26,996,250) (27,244,931) (248,681)6,000,000 Great Britain Pound Sterling . . . . . . . . . . . . . . . . . . . . . . . . . . . . . NTC 5/22/17 (8,694,300) (7,511,807) 1,182,4931,500,000 Great Britain Pound Sterling . . . . . . . . . . . . . . . . . . . . . . . . . . . . . NTC 7/5/17 (1,984,950) (1,880,164) 104,7863,200,000 Great Britain Pound Sterling . . . . . . . . . . . . . . . . . . . . . . . . . . . . . BNY 8/17/17 (4,193,920) (4,015,650) 178,2701,500,000 Great Britain Pound Sterling . . . . . . . . . . . . . . . . . . . . . . . . . . . . . NTC 10/3/17 (1,960,800) (1,884,744) 76,0563,000,000 Great Britain Pound Sterling . . . . . . . . . . . . . . . . . . . . . . . . . . . . . SSB 12/18/17 (3,808,290) (3,778,628) 29,6622,700,000 Great Britain Pound Sterling . . . . . . . . . . . . . . . . . . . . . . . . . . . . . BNY 12/28/17 (3,365,280) (3,401,851) (36,571)5,500,000 Great Britain Pound Sterling . . . . . . . . . . . . . . . . . . . . . . . . . . . . . JPM 2/21/18 (6,918,725) (6,941,880) (23,155)
130,000,000 Japanese Yen . . . . . . . . . . . . . . . . . . . . . . . . . . . . . . . . . . . . . . . . . JPM 8/21/17 (1,162,840) (1,173,820) (10,980)1,250,000 Singapore Dollar . . . . . . . . . . . . . . . . . . . . . . . . . . . . . . . . . . . . . . JPM 11/8/17 (900,752) (896,181) 4,5719,000,000 Singapore Dollar . . . . . . . . . . . . . . . . . . . . . . . . . . . . . . . . . . . . . . SSB 12/28/17 (6,222,530) (6,455,184) (232,654)
3,000,000,000 South Korean Won . . . . . . . . . . . . . . . . . . . . . . . . . . . . . . . . . . . . JPM 5/2/17 (2,598,753) (2,683,777) (85,024)7,500,000,000 South Korean Won . . . . . . . . . . . . . . . . . . . . . . . . . . . . . . . . . . . . SSB 12/18/17 (6,393,153) (6,735,841) (342,688)2,500,000,000 South Korean Won . . . . . . . . . . . . . . . . . . . . . . . . . . . . . . . . . . . . SSB 12/28/17 (2,099,235) (2,245,779) (146,544)4,500,000,000 South Korean Won . . . . . . . . . . . . . . . . . . . . . . . . . . . . . . . . . . . . BNY 2/13/18 (3,973,159) (4,046,627) (73,468)3,000,000,000 South Korean Won . . . . . . . . . . . . . . . . . . . . . . . . . . . . . . . . . . . . JPM 2/14/18 (2,634,468) (2,697,811) (63,343)
SEE NOTES TO FINANCIAL STATEMENTSII-21

Tweedy, Browne Value Fund
Schedule of Forward Exchange ContractsMarch 31, 2017
ContractsCounter-
partyContract
Value DateContract Value onOrigination Date
Value 03/31/17(Note 2)
UnrealizedAppreciation
(Depreciation)
FORWARD EXCHANGE CONTRACTS TO SELL(a) (continued)2,500,000 Swiss Franc . . . . . . . . . . . . . . . . . . . . . . . . . . . . . . . . . . . . . . . . . . JPM 7/5/17 $(2,610,857) $(2,512,395) $98,4623,000,000 Swiss Franc . . . . . . . . . . . . . . . . . . . . . . . . . . . . . . . . . . . . . . . . . . BNY 8/17/17 (3,139,717) (3,023,323) 116,3945,000,000 Swiss Franc . . . . . . . . . . . . . . . . . . . . . . . . . . . . . . . . . . . . . . . . . . NTC 10/3/17 (5,278,716) (5,054,440) 224,2766,700,000 Swiss Franc . . . . . . . . . . . . . . . . . . . . . . . . . . . . . . . . . . . . . . . . . . BNY 11/8/17 (6,999,582) (6,790,316) 209,2668,000,000 Swiss Franc . . . . . . . . . . . . . . . . . . . . . . . . . . . . . . . . . . . . . . . . . . JPM 11/22/17 (8,171,604) (8,115,933) 55,671
13,000,000 Swiss Franc . . . . . . . . . . . . . . . . . . . . . . . . . . . . . . . . . . . . . . . . . . BNY 12/18/17 (13,075,380) (13,212,882) (137,502)5,000,000 Swiss Franc . . . . . . . . . . . . . . . . . . . . . . . . . . . . . . . . . . . . . . . . . . NTC 3/15/18 (5,066,626) (5,113,654) (47,028)
TOTAL . . . . . . . . . . . . . . . . . . . . . . . . . . . . . . . . . . . . . . . . . . . . . . . . . . . . . . . . . . . $(177,991,792) $(176,387,128) $1,604,664
Unrealized Appreciation on Forward Contracts (Net) . . . . . . . . . . . . . . . . . . . . . . . $1,753,961
(a) Primary risk exposure being hedged against is currency risk.
Counterparty Abbreviations:BNY — The Bank of New York MellonJPM — JPMorgan Chase Bank NA
NTC — Northern Trust CompanySSB — State Street Bank and Trust Company
SEE NOTES TO FINANCIAL STATEMENTSII-22
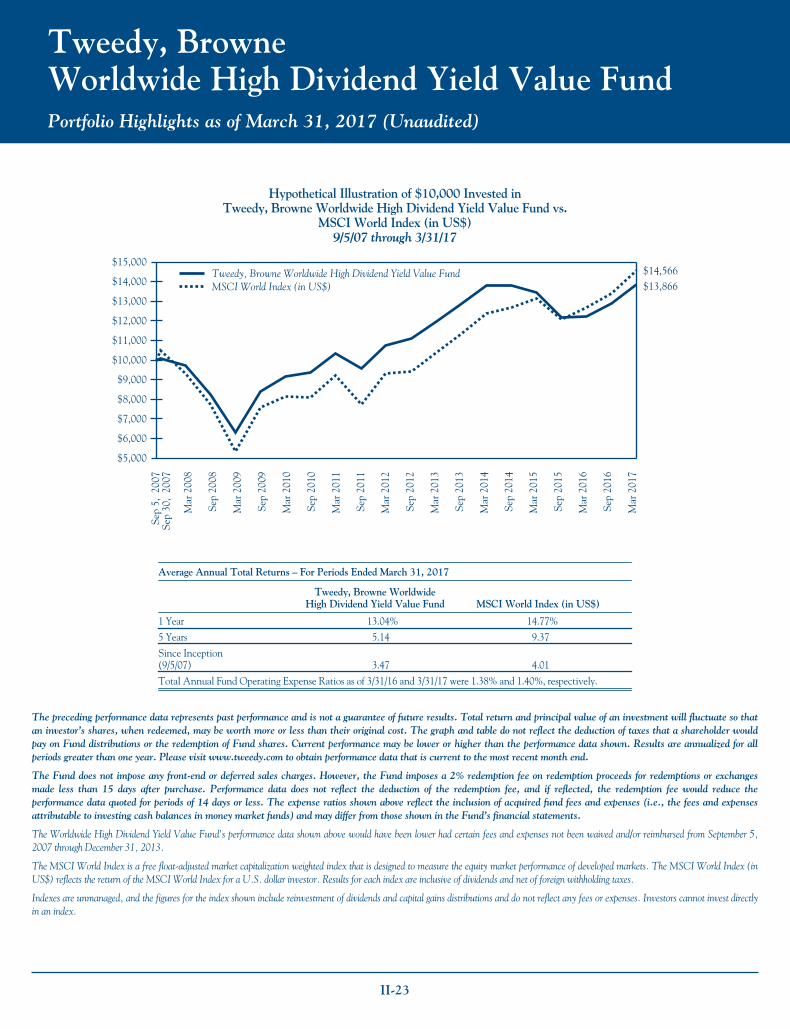
Tweedy, BrowneWorldwide High Dividend Yield Value FundPortfolio Highlights as of March 31, 2017 (Unaudited)
Hypothetical Illustration of $10,000 Invested inTweedy, Browne Worldwide High Dividend Yield Value Fund vs.
MSCI World Index (in US$)9/5/07 through 3/31/17
$14,566$13,866
Tweedy, Browne Worldwide High Dividend Yield Value FundMSCI World Index (in US$)
$5,000
$9,000
$8,000
$7,000
$6,000
$10,000
$11,000
$12,000
$14,000
$15,000
$13,000
Sep
5, 2
007
Sep
30,
2007
Mar
200
8
Sep
2008
Mar
200
9
Sep
2009
Mar
201
0
Sep
2010
Mar
201
1
Sep
2011
Mar
201
2
Sep
2012
Sep
2013
Sep
2014
Mar
201
6
Sep
2016
Mar
201
7
Sep
2015
Mar
201
5
Mar
201
4
Mar
201
3
Average Annual Total Returns – For Periods Ended March 31, 2017
Tweedy, Browne WorldwideHigh Dividend Yield Value Fund MSCI World Index (in US$)
1 Year 13.04% 14.77%
5 Years 5.14 9.37
Since Inception(9/5/07) 3.47 4.01
Total Annual Fund Operating Expense Ratios as of 3/31/16 and 3/31/17 were 1.38% and 1.40%, respectively.
The preceding performance data represents past performance and is not a guarantee of future results. Total return and principal value of an investment will fluctuate so thatan investor’s shares, when redeemed, may be worth more or less than their original cost. The graph and table do not reflect the deduction of taxes that a shareholder wouldpay on Fund distributions or the redemption of Fund shares. Current performance may be lower or higher than the performance data shown. Results are annualized for allperiods greater than one year. Please visit www.tweedy.com to obtain performance data that is current to the most recent month end.
The Fund does not impose any front-end or deferred sales charges. However, the Fund imposes a 2% redemption fee on redemption proceeds for redemptions or exchangesmade less than 15 days after purchase. Performance data does not reflect the deduction of the redemption fee, and if reflected, the redemption fee would reduce theperformance data quoted for periods of 14 days or less. The expense ratios shown above reflect the inclusion of acquired fund fees and expenses (i.e., the fees and expensesattributable to investing cash balances in money market funds) and may differ from those shown in the Fund’s financial statements.
The Worldwide High Dividend Yield Value Fund’s performance data shown above would have been lower had certain fees and expenses not been waived and/or reimbursed from September 5,2007 through December 31, 2013.
The MSCI World Index is a free float-adjusted market capitalization weighted index that is designed to measure the equity market performance of developed markets. The MSCI World Index (inUS$) reflects the return of the MSCI World Index for a U.S. dollar investor. Results for each index are inclusive of dividends and net of foreign withholding taxes.
Indexes are unmanaged, and the figures for the index shown include reinvestment of dividends and capital gains distributions and do not reflect any fees or expenses. Investors cannot invest directlyin an index.
II-23
Tweedy, Browne Worldwide High Dividend Yield Value Fund
Perspective on Assessing Investment Results (Unaudited)
March 31, 2017
In accordance with rules and guidelines set out by theUnited States Securities and Exchange Commission, we haveprovided a comparison of the historical investment results ofTweedy, Browne Worldwide High Dividend Yield ValueFund to the results of the MSCI World Index (in US$).Although we believe this comparison may be useful, thehistorical results of the MSCI World Index (in US$) in largemeasure represent the investment results of stocks that we donot own. Any portfolio that does not own exactly the samestocks in exactly the same proportions as the index to whichthe particular portfolio is being compared is not likely to havethe same results as the index. The investment behavior of adiversified portfolio of undervalued stocks tends to becorrelated to the investment behavior of a broad index; i.e.,when the index is up, probably more than one-half of thestocks in the entire universe of public companies in all thecountries that are included in the same index will be up,albeit in greater or lesser percentages than the index.Similarly, when the index declines, probably more thanone-half of the stocks in the entire universe of publiccompanies in all the countries that are included in the indexwill be down in greater or lesser percentages than the index.But it is almost a mathematical truth that “different stocksequal different results.”
We believe that favorable or unfavorable historicalinvestment results in comparison to an index are notnecessarily predictive of future comparative investmentresults. In 1986, V. Eugene Shahan, a Columbia UniversityBusiness School alumnus and portfolio manager at U.S. Trust,wrote Are Short-Term Performance and Value InvestingMutually Exclusive? In this article, Mr. Shahan analyzed the
investment performance of seven money managers, aboutwhom Warren Buffett wrote in his article, The Superinvestorsof Graham and Doddsville. Over long periods of time, the sevenmanagers significantly outperformed the market as measuredby the Dow Jones Industrial Average (the DJIA) or theS&P 500 Index (the S&P 500) by between 7.7% and 16.5%annually. (The goal of most institutional money managers isto outperform the market by 2% to 3%.) However, for periodsranging from 13 years to 28 years, this group of managersunderperformed the market between 7.7% and 42% of theyears. Six of the seven investment managers underperformedthe market between 28% and 42% of the years. In today’senvironment, they would have lost many of their clientsduring their periods of underperformance. Longer term, itwould have been the wrong decision to fire any of thosemoney managers. In examining the seven long-terminvestment records, unfavorable investment results ascompared to either index did not predict the future favorablecomparative investment results that occurred, and favorableinvestment results in comparison to the DJIA or the S&P 500were not always followed by future favorable comparativeresults. Stretches of consecutive annual underperformanceranged from one to six years.
Mr. Shahan concluded:Unfortunately, there is no way to distinguish between apoor three-year stretch for a manager who will do wellover 15 years, from a poor three-year stretch for amanager who will continue to do poorly. Nor is there anyreason to believe that a manager who does well from theoutset cannot continue to do well, and consistently.
II-24

Tweedy, Browne Worldwide High Dividend Yield Value Fund
Portfolio of InvestmentsMarch 31, 2017
SharesValue
(Note 2)
COMMON STOCKS—90.3%
France—14.1%73,530 Cie Generale des Etablissements Michelin . . . . $8,953,646
169,500 CNP Assurances . . . . . . . . . . . . . . . . . . . . . . . . 3,458,99975,070 Safran SA . . . . . . . . . . . . . . . . . . . . . . . . . . . . . 5,622,803
294,000 SCOR SE . . . . . . . . . . . . . . . . . . . . . . . . . . . . . 11,140,914250,000 Total SA . . . . . . . . . . . . . . . . . . . . . . . . . . . . . . 12,678,214
41,854,576
Germany—10.5%245,600 Axel Springer SE . . . . . . . . . . . . . . . . . . . . . . . . 13,599,05928,700 Muenchener Rueckversicherungs AG . . . . . . . . 5,629,67885,500 Siemens AG . . . . . . . . . . . . . . . . . . . . . . . . . . . 11,741,767
30,970,504
Netherlands—4.4%493,000 Royal Dutch Shell PLC, Class A . . . . . . . . . . . . 12,979,235
Singapore—7.1%739,900 DBS Group Holdings Ltd. . . . . . . . . . . . . . . . . . 10,272,712680,200 United Overseas Bank Ltd. . . . . . . . . . . . . . . . . 10,763,059
21,035,771
Switzerland—20.4%348,000 ABB Ltd. . . . . . . . . . . . . . . . . . . . . . . . . . . . . . . 8,145,901217,900 Nestle SA, Registered . . . . . . . . . . . . . . . . . . . . 16,729,722153,000 Novartis AG, Registered . . . . . . . . . . . . . . . . . . 11,364,75347,000 Roche Holding AG . . . . . . . . . . . . . . . . . . . . . . 12,011,18946,000 Zurich Insurance Group AG . . . . . . . . . . . . . . . 12,288,726
60,540,291
Thailand—0.7%386,200 Bangkok Bank Public Company Ltd., NVDR . . 2,039,878
SharesValue
(Note 2)
United Kingdom—16.4%310,855 BAE Systems PLC . . . . . . . . . . . . . . . . . . . . . . . $2,497,460272,740 Berendsen PLC . . . . . . . . . . . . . . . . . . . . . . . . . 2,499,886475,800 Diageo PLC . . . . . . . . . . . . . . . . . . . . . . . . . . . . 13,586,041
2,374,466 G4S PLC . . . . . . . . . . . . . . . . . . . . . . . . . . . . . 9,035,150532,003 GlaxoSmithKline PLC . . . . . . . . . . . . . . . . . . . 11,039,739
1,212,400 HSBC Holdings PLC . . . . . . . . . . . . . . . . . . . . 9,867,96748,526,243
United States—16.7%408,350 Cisco Systems, Inc. . . . . . . . . . . . . . . . . . . . . . . 13,802,23079,640 ConocoPhillips . . . . . . . . . . . . . . . . . . . . . . . . . 3,971,64759,800 Johnson & Johnson . . . . . . . . . . . . . . . . . . . . . . 7,448,090
224,370 Verizon Communications, Inc. . . . . . . . . . . . . . 10,938,037178,605 Wells Fargo & Company . . . . . . . . . . . . . . . . . . 9,941,15464,175 Williams-Sonoma Inc. . . . . . . . . . . . . . . . . . . . . 3,441,064
49,542,222
TOTAL COMMON STOCKS(Cost $205,768,973) . . . . . . . . . . . . . . . . . . . . 267,488,720
REGISTERED INVESTMENT COMPANY—9.1%26,846,302 Dreyfus Government Securities Cash
Management – Institutional Shares(Cost $26,846,302) . . . . . . . . . . . . . . . . . . . . 26,846,302
TOTAL INVESTMENTS(Cost $232,615,275) . . . . . . . . . . . . . . . . . . . . . 99.4% 294,335,022
OTHER ASSETSAND LIABILITIES (Net) . . . . . . . . . . . . . . . . 0.6 1,772,164
NET ASSETS . . . . . . . . . . . . . . . . . . . . . . . . . . . . 100.0% $296,107,186
Abbreviations:NVDR — Non Voting Depository Receipt
SEE NOTES TO FINANCIAL STATEMENTSII-25

Tweedy, Browne Worldwide High Dividend Yield Value Fund
Sector Diversification (Unaudited)March 31, 2017
Sector DiversificationPercentage ofNet Assets
COMMON STOCKS:Banks . . . . . . . . . . . . . . . . . . . . . . . . . . . . . . . . . . . . . . . . . . . . . . . . . 14.5%Pharmaceuticals, Biotechnology & Life Sciences . . . . . . . . . . . . . . . . 14.1Insurance . . . . . . . . . . . . . . . . . . . . . . . . . . . . . . . . . . . . . . . . . . . . . . 11.0Energy . . . . . . . . . . . . . . . . . . . . . . . . . . . . . . . . . . . . . . . . . . . . . . . . 9.9Capital Goods . . . . . . . . . . . . . . . . . . . . . . . . . . . . . . . . . . . . . . . . . . 9.5Food . . . . . . . . . . . . . . . . . . . . . . . . . . . . . . . . . . . . . . . . . . . . . . . . . . 5.6Technology Hardware & Equipment . . . . . . . . . . . . . . . . . . . . . . . . . 4.7Media . . . . . . . . . . . . . . . . . . . . . . . . . . . . . . . . . . . . . . . . . . . . . . . . . 4.6Beverage . . . . . . . . . . . . . . . . . . . . . . . . . . . . . . . . . . . . . . . . . . . . . . 4.6Commercial Services & Supplies . . . . . . . . . . . . . . . . . . . . . . . . . . . . 3.9Telecommunication Services . . . . . . . . . . . . . . . . . . . . . . . . . . . . . . . 3.7Automobiles & Components . . . . . . . . . . . . . . . . . . . . . . . . . . . . . . . 3.0Retailing . . . . . . . . . . . . . . . . . . . . . . . . . . . . . . . . . . . . . . . . . . . . . . 1.2
Total Common Stocks . . . . . . . . . . . . . . . . . . . . . . . . . . . . . . . . . . . 90.3Registered Investment Company . . . . . . . . . . . . . . . . . . . . . . . . . . . 9.1Other Assets and Liabilities (Net) . . . . . . . . . . . . . . . . . . . . . . . . . . 0.6
Net Assets . . . . . . . . . . . . . . . . . . . . . . . . . . . . . . . . . . . . . . . . . . . . . 100.0%
Portfolio Composition (Unaudited)March 31, 2017
Money Market FundsMoney Market Fundsand Other Assets and and Other Assets and Liabilities (Net) 10%Liabilities (Net) 10%
United StatesUnited States 17% 17%
Switzerland 20%Switzerland 20%
United KingdomUnited Kingdom 16% 16%
Germany 11%Germany 11%
France 14%France 14%
Singapore 7%Singapore 7%
Netherlands 4%Netherlands 4%
Thailand 1Thailand 1%
SEE NOTES TO FINANCIAL STATEMENTSII-26

TWEEDY, BROWNE FUND INC.
Statements of Assets and LiabilitiesMarch 31, 2017
Global ValueFund
Global ValueFund II –CurrencyUnhedged Value Fund
Worldwide HighDividend Yield
Value Fund
ASSETSInvestments, at cost(a) . . . . . . . . . . . . . . . . . . . . . . . . . . . . . . . . $6,941,507,735 $299,708,005 $349,539,239 $232,615,275
Investments in unaffiliated issuers, at value (Note 2) . . . . . . . . $9,313,924,072 $354,442,558 $573,224,695 $294,335,022Investments in affiliated issuers, at value (Note 4) . . . . . . . . . . . 167,292,839 — — —Foreign currency(b) . . . . . . . . . . . . . . . . . . . . . . . . . . . . . . . . . . 1,815 161 — 806Dividends and interest receivable . . . . . . . . . . . . . . . . . . . . . . . 35,959,263 1,181,172 1,700,170 1,298,546Recoverable foreign withholding taxes . . . . . . . . . . . . . . . . . . . 15,729,093 651,701 863,184 870,495Receivable for Fund shares sold . . . . . . . . . . . . . . . . . . . . . . . . . 14,188,375 440,048 35,553 24,058Unrealized appreciation of forward exchange contracts
(Note 2) . . . . . . . . . . . . . . . . . . . . . . . . . . . . . . . . . . . . . . . . 134,119,539 — 3,545,679 —Prepaid expense . . . . . . . . . . . . . . . . . . . . . . . . . . . . . . . . . . . . 69,176 2,642 4,210 2,737
Total Assets . . . . . . . . . . . . . . . . . . . . . . . . . . . . . . . . . . . . . . . . $9,681,284,172 $356,718,282 $579,373,491 $296,531,664
LIABILITIESUnrealized depreciation of forward exchange contracts
(Note 2) . . . . . . . . . . . . . . . . . . . . . . . . . . . . . . . . . . . . . . . . $39,238,009 $ — $1,791,718 $ —Payable for Fund shares redeemed . . . . . . . . . . . . . . . . . . . . . . . 50,912,845 2,663,804 328,531 83,756Investment advisory fee payable (Note 3) . . . . . . . . . . . . . . . . . 6,463,847 235,624 390,756 199,974Shareholder servicing and administration fees payable
(Note 3) . . . . . . . . . . . . . . . . . . . . . . . . . . . . . . . . . . . . . . . . 237,747 8,790 14,357 7,944Accrued foreign capital gains taxes . . . . . . . . . . . . . . . . . . . . . . 2,603,634 103,597 — 56,596Accrued expenses and other payables . . . . . . . . . . . . . . . . . . . . 2,157,649 88,335 116,269 76,208
Total Liabilities . . . . . . . . . . . . . . . . . . . . . . . . . . . . . . . . . . . . . 101,613,731 3,100,150 2,641,631 424,478NET ASSETS . . . . . . . . . . . . . . . . . . . . . . . . . . . . . . . . . . . . . . . $9,579,670,441 $353,618,132 $576,731,860 $296,107,186
NET ASSETS consist ofUndistributed net investment income . . . . . . . . . . . . . . . . . . . . $27,195,352 $1,065,438 $2,340,548 $2,003,832Accumulated net realized gain (loss) on securities, forward
exchange contracts and foreign currencies . . . . . . . . . . . . . . (58,885,381) (16,649,556) 2,573,180 1,168,563Net unrealized appreciation of securities, forward exchange
contracts, foreign currencies and net other assets . . . . . . . . . 2,634,763,956 54,747,636 225,460,258 61,702,046Paid-in capital . . . . . . . . . . . . . . . . . . . . . . . . . . . . . . . . . . . . . 6,976,596,514 314,454,614 346,357,874 231,232,745
Total Net Assets . . . . . . . . . . . . . . . . . . . . . . . . . . . . . . . . . . . . $9,579,670,441 $353,618,132 $576,731,860 $296,107,186
CAPITAL STOCK (common stock outstanding) . . . . . . . . . . . . 358,187,850 25,087,470 26,483,539 31,258,769
NET ASSET VALUE offering and redemption price pershare . . . . . . . . . . . . . . . . . . . . . . . . . . . . . . . . . . . . . . . . . . . . . $26.74 $14.10 $21.78 $9.47
(a) Includes investments in affiliated issuers for Global Value Fund, Global Value Fund II – Currency Unhedged, Value Fund and Worldwide High Dividend YieldValue Fund of $71,225,516, $0, $0 and $0, respectively (Note 4).
(b) Foreign currency held at cost for the Global Value Fund, Global Value Fund II – Currency Unhedged and Worldwide High Dividend Yield Value Fund was $1,819,$161 and $815, respectively.
SEE NOTES TO FINANCIAL STATEMENTSII-27
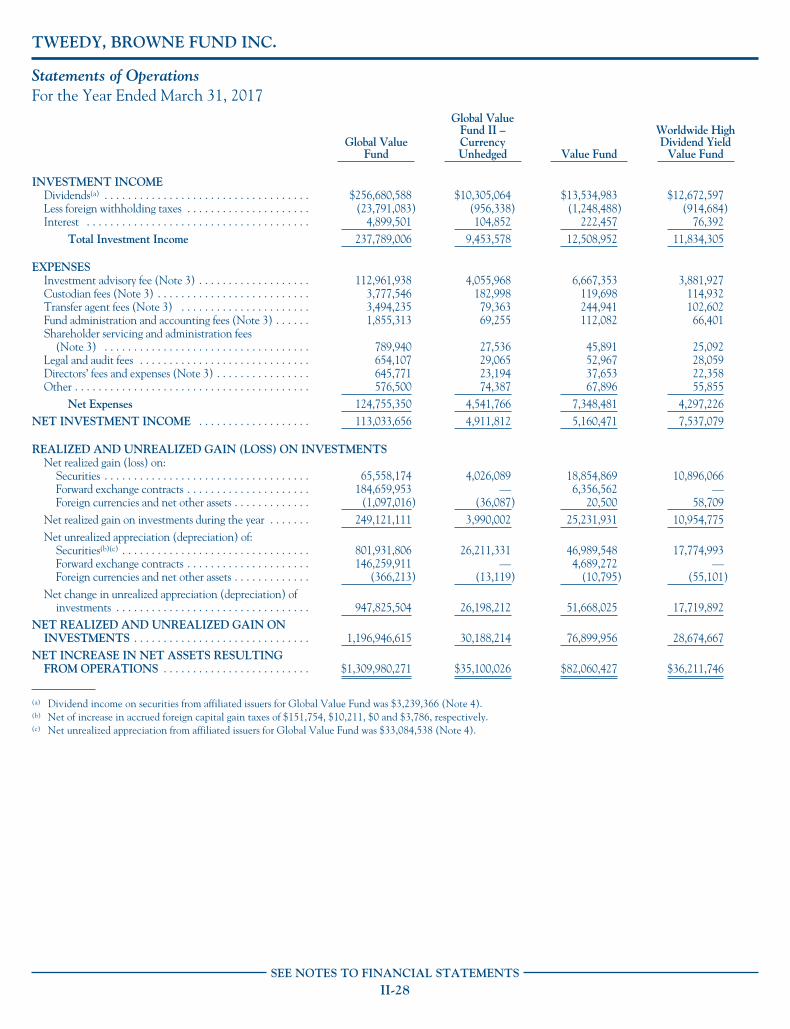
TWEEDY, BROWNE FUND INC.
Statements of OperationsFor the Year Ended March 31, 2017
Global ValueFund
Global ValueFund II –CurrencyUnhedged Value Fund
Worldwide HighDividend Yield
Value Fund
INVESTMENT INCOMEDividends(a) . . . . . . . . . . . . . . . . . . . . . . . . . . . . . . . . . . . $256,680,588 $10,305,064 $13,534,983 $12,672,597Less foreign withholding taxes . . . . . . . . . . . . . . . . . . . . . (23,791,083) (956,338) (1,248,488) (914,684)Interest . . . . . . . . . . . . . . . . . . . . . . . . . . . . . . . . . . . . . . 4,899,501 104,852 222,457 76,392
Total Investment Income 237,789,006 9,453,578 12,508,952 11,834,305
EXPENSESInvestment advisory fee (Note 3) . . . . . . . . . . . . . . . . . . . 112,961,938 4,055,968 6,667,353 3,881,927Custodian fees (Note 3) . . . . . . . . . . . . . . . . . . . . . . . . . . 3,777,546 182,998 119,698 114,932Transfer agent fees (Note 3) . . . . . . . . . . . . . . . . . . . . . . 3,494,235 79,363 244,941 102,602Fund administration and accounting fees (Note 3) . . . . . . 1,855,313 69,255 112,082 66,401Shareholder servicing and administration fees
(Note 3) . . . . . . . . . . . . . . . . . . . . . . . . . . . . . . . . . . . 789,940 27,536 45,891 25,092Legal and audit fees . . . . . . . . . . . . . . . . . . . . . . . . . . . . . 654,107 29,065 52,967 28,059Directors’ fees and expenses (Note 3) . . . . . . . . . . . . . . . . 645,771 23,194 37,653 22,358Other . . . . . . . . . . . . . . . . . . . . . . . . . . . . . . . . . . . . . . . . 576,500 74,387 67,896 55,855
Net Expenses 124,755,350 4,541,766 7,348,481 4,297,226NET INVESTMENT INCOME . . . . . . . . . . . . . . . . . . . 113,033,656 4,911,812 5,160,471 7,537,079
REALIZED AND UNREALIZED GAIN (LOSS) ON INVESTMENTSNet realized gain (loss) on:
Securities . . . . . . . . . . . . . . . . . . . . . . . . . . . . . . . . . . . 65,558,174 4,026,089 18,854,869 10,896,066Forward exchange contracts . . . . . . . . . . . . . . . . . . . . . 184,659,953 — 6,356,562 —Foreign currencies and net other assets . . . . . . . . . . . . . (1,097,016) (36,087) 20,500 58,709
Net realized gain on investments during the year . . . . . . . 249,121,111 3,990,002 25,231,931 10,954,775Net unrealized appreciation (depreciation) of:
Securities(b)(c) . . . . . . . . . . . . . . . . . . . . . . . . . . . . . . . . 801,931,806 26,211,331 46,989,548 17,774,993Forward exchange contracts . . . . . . . . . . . . . . . . . . . . . 146,259,911 — 4,689,272 —Foreign currencies and net other assets . . . . . . . . . . . . . (366,213) (13,119) (10,795) (55,101)
Net change in unrealized appreciation (depreciation) ofinvestments . . . . . . . . . . . . . . . . . . . . . . . . . . . . . . . . . 947,825,504 26,198,212 51,668,025 17,719,892
NET REALIZED AND UNREALIZED GAIN ONINVESTMENTS . . . . . . . . . . . . . . . . . . . . . . . . . . . . . . 1,196,946,615 30,188,214 76,899,956 28,674,667
NET INCREASE IN NET ASSETS RESULTINGFROM OPERATIONS . . . . . . . . . . . . . . . . . . . . . . . . . $1,309,980,271 $35,100,026 $82,060,427 $36,211,746
(a) Dividend income on securities from affiliated issuers for Global Value Fund was $3,239,366 (Note 4).(b) Net of increase in accrued foreign capital gain taxes of $151,754, $10,211, $0 and $3,786, respectively.(c) Net unrealized appreciation from affiliated issuers for Global Value Fund was $33,084,538 (Note 4).
SEE NOTES TO FINANCIAL STATEMENTSII-28
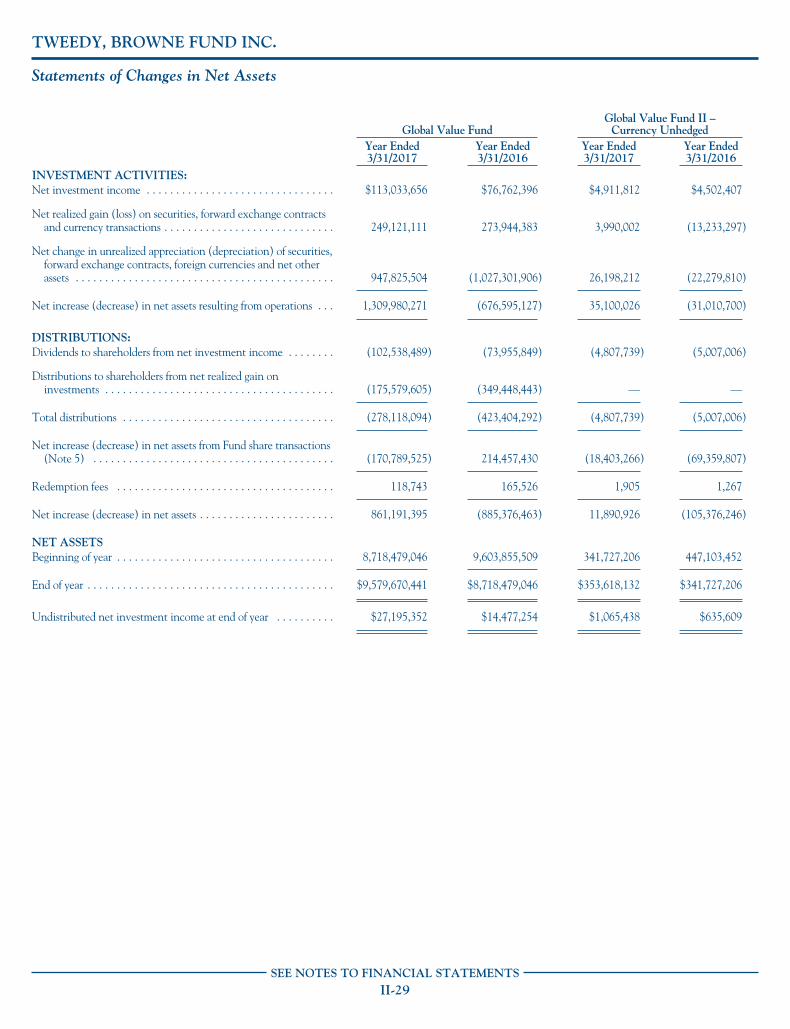
TWEEDY, BROWNE FUND INC.
Statements of Changes in Net Assets
Global Value FundGlobal Value Fund II –
Currency UnhedgedYear Ended3/31/2017
Year Ended3/31/2016
Year Ended3/31/2017
Year Ended3/31/2016
INVESTMENT ACTIVITIES:Net investment income . . . . . . . . . . . . . . . . . . . . . . . . . . . . . . . . $113,033,656 $76,762,396 $4,911,812 $4,502,407
Net realized gain (loss) on securities, forward exchange contractsand currency transactions . . . . . . . . . . . . . . . . . . . . . . . . . . . . . 249,121,111 273,944,383 3,990,002 (13,233,297)
Net change in unrealized appreciation (depreciation) of securities,forward exchange contracts, foreign currencies and net otherassets . . . . . . . . . . . . . . . . . . . . . . . . . . . . . . . . . . . . . . . . . . . . 947,825,504 (1,027,301,906) 26,198,212 (22,279,810)
Net increase (decrease) in net assets resulting from operations . . . 1,309,980,271 (676,595,127) 35,100,026 (31,010,700)
DISTRIBUTIONS:Dividends to shareholders from net investment income . . . . . . . . (102,538,489) (73,955,849) (4,807,739) (5,007,006)
Distributions to shareholders from net realized gain oninvestments . . . . . . . . . . . . . . . . . . . . . . . . . . . . . . . . . . . . . . . (175,579,605) (349,448,443) — —
Total distributions . . . . . . . . . . . . . . . . . . . . . . . . . . . . . . . . . . . . (278,118,094) (423,404,292) (4,807,739) (5,007,006)
Net increase (decrease) in net assets from Fund share transactions(Note 5) . . . . . . . . . . . . . . . . . . . . . . . . . . . . . . . . . . . . . . . . . (170,789,525) 214,457,430 (18,403,266) (69,359,807)
Redemption fees . . . . . . . . . . . . . . . . . . . . . . . . . . . . . . . . . . . . . 118,743 165,526 1,905 1,267
Net increase (decrease) in net assets . . . . . . . . . . . . . . . . . . . . . . . 861,191,395 (885,376,463) 11,890,926 (105,376,246)
NET ASSETSBeginning of year . . . . . . . . . . . . . . . . . . . . . . . . . . . . . . . . . . . . . 8,718,479,046 9,603,855,509 341,727,206 447,103,452
End of year . . . . . . . . . . . . . . . . . . . . . . . . . . . . . . . . . . . . . . . . . . $9,579,670,441 $8,718,479,046 $353,618,132 $341,727,206
Undistributed net investment income at end of year . . . . . . . . . . $27,195,352 $14,477,254 $1,065,438 $635,609
SEE NOTES TO FINANCIAL STATEMENTSII-29

TWEEDY, BROWNE FUND INC.
Statements of Changes in Net Assets
Value FundWorldwide High Dividend
Yield Value FundYear Ended3/31/2017
Year Ended3/31/2016
Year Ended3/31/2017
Year Ended3/31/2016
INVESTMENT ACTIVITIES:Net investment income . . . . . . . . . . . . . . . . . . . . . . . . . . . . . . . . . . . $5,160,471 $5,110,918 $7,537,079 $9,536,628
Net realized gain on securities, forward exchange contracts andcurrency transactions . . . . . . . . . . . . . . . . . . . . . . . . . . . . . . . . . . . 25,231,931 18,276,115 10,954,775 13,395,071
Net change in unrealized appreciation (depreciation) of securities,forward exchange contracts, foreign currencies and net otherasset . . . . . . . . . . . . . . . . . . . . . . . . . . . . . . . . . . . . . . . . . . . . . . . . 51,668,025 (70,525,275) 17,719,892 (64,243,318)
Net increase (decrease) in net assets resulting from operations . . . . . . 82,060,427 (47,138,242) 36,211,746 (41,311,619)
DISTRIBUTIONS:Dividends to shareholders from net investment income . . . . . . . . . . . (4,923,187) (5,466,225) (7,822,186) (10,951,776)
Distributions to shareholders from net realized gain oninvestments . . . . . . . . . . . . . . . . . . . . . . . . . . . . . . . . . . . . . . . . . . (18,915,402) (16,577,477) (4,773,837) (33,147,113)
Total distributions . . . . . . . . . . . . . . . . . . . . . . . . . . . . . . . . . . . . . . . (23,838,589) (22,043,702) (12,596,023) (44,098,889)
Net increase (decrease) in net assets from Fund share transactions(Note 5) . . . . . . . . . . . . . . . . . . . . . . . . . . . . . . . . . . . . . . . . . . . . 12,357,832 (43,823,781) (62,133,540) (148,510,928)
Redemption fees . . . . . . . . . . . . . . . . . . . . . . . . . . . . . . . . . . . . . . . . — — 3,674 2,471
Net increase (decrease) in net assets . . . . . . . . . . . . . . . . . . . . . . . . . 70,579,670 (113,005,725) (38,514,143) (233,918,965)
NET ASSETSBeginning of year . . . . . . . . . . . . . . . . . . . . . . . . . . . . . . . . . . . . . . . . 506,152,190 619,157,915 334,621,329 568,540,294
End of year . . . . . . . . . . . . . . . . . . . . . . . . . . . . . . . . . . . . . . . . . . . . . $576,731,860 $506,152,190 $296,107,186 $334,621,329
Undistributed net investment income at end of year . . . . . . . . . . . . . $2,340,548 $1,840,113 $2,003,832 $2,209,966
SEE NOTES TO FINANCIAL STATEMENTSII-30

TWEEDY, BROWNE FUND INC.
Financial HighlightsTweedy, Browne Global Value FundFor a Fund share outstanding throughout each year.
YearEnded
3/31/17
YearEnded
3/31/16
YearEnded
3/31/15
YearEnded
3/31/14
YearEnded
3/31/13Net asset value, beginning of year . . . . . . . . . . . . . . . . . . . . . . . . . . . . . . . . . . . $23.89 $26.97 $26.98 $25.11 $23.79Income from investment operations:Net investment income . . . . . . . . . . . . . . . . . . . . . . . . . . . . . . . . . . . . . . . . . . 0.32 0.22 0.24 0.32 0.35Net realized and unrealized gain (loss) on investments . . . . . . . . . . . . . . . . . . . 3.32 (2.09) 0.74 2.73 3.61
Total from investment operations . . . . . . . . . . . . . . . . . . . . . . . . . . . . . 3.64 (1.87) 0.98 3.05 3.96Distributions:Dividends from net investment income . . . . . . . . . . . . . . . . . . . . . . . . . . . . . . (0.29) (0.21) (0.33) (0.32) (0.35)Distributions from net realized gains . . . . . . . . . . . . . . . . . . . . . . . . . . . . . . . . . (0.50) (1.00) (0.66) (0.86) (2.29)
Total distributions . . . . . . . . . . . . . . . . . . . . . . . . . . . . . . . . . . . . . . . . (0.79) (1.21) (0.99) (1.18) (2.64)Redemption fees(a) . . . . . . . . . . . . . . . . . . . . . . . . . . . . . . . . . . . . . . . . . . . . . . 0.00 0.00 0.00 0.00 0.00Net asset value, end of year . . . . . . . . . . . . . . . . . . . . . . . . . . . . . . . . . . . . . . . . $26.74 $23.89 $26.97 $26.98 $25.11Total return(b) . . . . . . . . . . . . . . . . . . . . . . . . . . . . . . . . . . . . . . . . . . . . . . . . . . 15.49% (7.08)% 3.69%(c) 12.25%(c) 17.48%
Ratios/Supplemental Data:Net assets, end of year (in 000s) . . . . . . . . . . . . . . . . . . . . . . . . . . . . . . . . . . . . $9,579,670 $8,718,479 $9,603,856 $7,977,755 $5,925,629Ratio of operating expenses to average net assets . . . . . . . . . . . . . . . . . . . . . . . 1.38% 1.37% 1.36% 1.37% 1.38%Ratio of net investment income to average net assets . . . . . . . . . . . . . . . . . . . . 1.25% 0.83% 0.94% 1.30% 1.45%Portfolio turnover rate . . . . . . . . . . . . . . . . . . . . . . . . . . . . . . . . . . . . . . . . . . . 3% 1% 8% 4% 16%
(a) Amount represents less than $0.01 per share.(b) Total return represents aggregate total return for the periods indicated.(c) The net asset value (NAV) disclosed in the March 31, 2014 annual report reflects adjustments in accordance with accounting principles generally accepted in the
United States of America and as such, differs from the NAV reported on March 31, 2014. The total return reported is based on the unadjusted NAV which was theofficial NAV for executing transactions on March 31, 2014.
Tweedy, Browne Global Value Fund II – Currency UnhedgedFor a Fund share outstanding throughout each year.
YearEnded
3/31/17
YearEnded
3/31/16
YearEnded
3/31/15
YearEnded
3/31/14
YearEnded
3/31/13Net asset value, beginning of year . . . . . . . . . . . . . . . . . . . . . . . . . . . . . . . . . . . $12.88 $14.02 $14.90 $13.18 $11.69Income from investment operations:Net investment income . . . . . . . . . . . . . . . . . . . . . . . . . . . . . . . . . . . . . . . . . . 0.21 0.17 0.15 0.15 0.23Net realized and unrealized gain (loss) on investments . . . . . . . . . . . . . . . . . . . 1.21 (1.12) (0.84) 1.72 1.49
Total from investment operations . . . . . . . . . . . . . . . . . . . . . . . . . . . . . 1.42 (0.95) (0.69) 1.87 1.72Distributions:Dividends from net investment income . . . . . . . . . . . . . . . . . . . . . . . . . . . . . . (0.20) (0.19) (0.19) (0.15) (0.22)Distributions from net realized gains . . . . . . . . . . . . . . . . . . . . . . . . . . . . . . . . . — — — — (0.01)
Total distributions . . . . . . . . . . . . . . . . . . . . . . . . . . . . . . . . . . . . . . . . (0.20) (0.19) (0.19) (0.15) (0.23)Redemption fees(a) . . . . . . . . . . . . . . . . . . . . . . . . . . . . . . . . . . . . . . . . . . . . . . 0.00 0.00 0.00 0.00 0.00Net asset value, end of year . . . . . . . . . . . . . . . . . . . . . . . . . . . . . . . . . . . . . . . . $14.10 $12.88 $14.02 $14.90 $13.18Total return(b) . . . . . . . . . . . . . . . . . . . . . . . . . . . . . . . . . . . . . . . . . . . . . . . . . . 11.17% (6.79)% (4.72)%(c) 14.27%(c) 14.77%
Ratios/Supplemental Data:Net assets, end of year (in 000s) . . . . . . . . . . . . . . . . . . . . . . . . . . . . . . . . . . . . $353,618 $341,727 $447,103 $443,382 $282,375Ratio of operating expenses to average net assets . . . . . . . . . . . . . . . . . . . . . . . 1.40% 1.38% 1.37% 1.37% 1.37%Ratio of operating expenses to average net assets excluding recoupments and/or
waivers of expenses . . . . . . . . . . . . . . . . . . . . . . . . . . . . . . . . . . . . . . . . . . . . 1.40% 1.38% 1.36% 1.37% 1.39%Ratio of net investment income to average net assets . . . . . . . . . . . . . . . . . . . . 1.51% 1.12% 1.00% 1.23% 1.74%Portfolio turnover rate . . . . . . . . . . . . . . . . . . . . . . . . . . . . . . . . . . . . . . . . . . . 4% 14% 9% 4% 28%
(a) Amount represents less than $0.01 per share.(b) Total return represents aggregate total return for the periods indicated.(c) The net asset value (NAV) disclosed in the March 31, 2014 annual report reflects adjustments in accordance with accounting principles generally accepted in the
United States of America and as such, differs from the NAV reported on March 31, 2014. The total return reported is based on the unadjusted NAV which was theofficial NAV for executing transactions on March 31, 2014.
SEE NOTES TO FINANCIAL STATEMENTSII-31

TWEEDY, BROWNE FUND INC.
Financial HighlightsTweedy, Browne Value FundFor a Fund share outstanding throughout each year.
YearEnded
3/31/17
YearEnded
3/31/16
YearEnded
3/31/15
YearEnded
3/31/14
YearEnded
3/31/13Net asset value, beginning of year . . . . . . . . . . . . . . . . . . . . . . . . . . . . . . . . . . . $19.51 $22.14 $23.21 $21.68 $19.35
Income from investment operations:Net investment income . . . . . . . . . . . . . . . . . . . . . . . . . . . . . . . . . . . . . . . . . . 0.20 0.20 0.24 0.27 0.20Net realized and unrealized gain (loss) on investments . . . . . . . . . . . . . . . . . . . 2.99 (1.97) 0.47 2.81 3.05
Total from investment operations . . . . . . . . . . . . . . . . . . . . . . . . . . . . . 3.19 (1.77) 0.71 3.08 3.25
Distributions:Dividends from net investment income . . . . . . . . . . . . . . . . . . . . . . . . . . . . . . (0.19) (0.21) (0.26) (0.21) (0.20)Distributions from net realized gains . . . . . . . . . . . . . . . . . . . . . . . . . . . . . . . . . (0.73) (0.65) (1.52) (1.34) (0.72)
Total distributions . . . . . . . . . . . . . . . . . . . . . . . . . . . . . . . . . . . . . . . . (0.92) (0.86) (1.78) (1.55) (0.92)Net asset value, end of year . . . . . . . . . . . . . . . . . . . . . . . . . . . . . . . . . . . . . . . . $21.78 $19.51 $22.14 $23.21 $21.68
Total return(a) . . . . . . . . . . . . . . . . . . . . . . . . . . . . . . . . . . . . . . . . . . . . . . . . . . 16.57% (8.09)% 3.08% 14.38% 17.24%
Ratios/Supplemental Data:Net assets, end of year (in 000s) . . . . . . . . . . . . . . . . . . . . . . . . . . . . . . . . . . . . $576,732 $506,152 $619,158 $638,000 $600,335Ratio of operating expenses to average net assets . . . . . . . . . . . . . . . . . . . . . . . 1.38% 1.37% 1.36% 1.37% 1.39%Ratio of net investment income to average net assets . . . . . . . . . . . . . . . . . . . . 0.97% 0.91% 0.98% 1.17% 1.04%Portfolio turnover rate . . . . . . . . . . . . . . . . . . . . . . . . . . . . . . . . . . . . . . . . . . . 8% 7% 6% 7% 8%
(a) Total return represents aggregate total return for the periods indicated.
Tweedy, Browne Worldwide High Dividend Yield Value FundFor a Fund share outstanding throughout each year.
YearEnded
3/31/17
YearEnded
3/31/16
YearEnded
3/31/15
YearEnded
3/31/14
YearEnded
3/31/13Net asset value, beginning of year . . . . . . . . . . . . . . . . . . . . . . . . . . . . . . . . . . . $8.75 $10.84 $12.01 $10.67 $9.75
Income from investment operations:Net investment income . . . . . . . . . . . . . . . . . . . . . . . . . . . . . . . . . . . . . . . . . . 0.23 0.21(c) 0.25 0.23 0.19Net realized and unrealized gain (loss) on investments . . . . . . . . . . . . . . . . . . . 0.87 (1.15) (0.50) 1.33 0.89
Total from investment operations . . . . . . . . . . . . . . . . . . . . . . . . . . . . . 1.10 (0.94) (0.25) 1.56 1.08
Distributions:Dividends from net investment income . . . . . . . . . . . . . . . . . . . . . . . . . . . . . . (0.23) (0.26) (0.25) (0.20) (0.16)Distributions from net realized gains . . . . . . . . . . . . . . . . . . . . . . . . . . . . . . . . . (0.15) (0.89) (0.67) (0.02) —
Total distributions . . . . . . . . . . . . . . . . . . . . . . . . . . . . . . . . . . . . . . . . (0.38) (1.15) (0.92) (0.22) (0.16)Redemption fees(a) . . . . . . . . . . . . . . . . . . . . . . . . . . . . . . . . . . . . . . . . . . . . . . 0.00 0.00 0.00 0.00 0.00Net asset value, end of year . . . . . . . . . . . . . . . . . . . . . . . . . . . . . . . . . . . . . . . . $9.47 $8.75 $10.84 $12.01 $10.67
Total return(b) . . . . . . . . . . . . . . . . . . . . . . . . . . . . . . . . . . . . . . . . . . . . . . . . . . 13.04% (9.03)% (2.23)% 14.81% 11.32%
Ratios/Supplemental Data:Net assets, end of year (in 000s) . . . . . . . . . . . . . . . . . . . . . . . . . . . . . . . . . . . . $296,107 $334,621 $568,540 $754,786 $666,851Ratio of operating expenses to average net assets . . . . . . . . . . . . . . . . . . . . . . . 1.38% 1.37% 1.35% 1.36% 1.37%Ratio of net investment income to average net assets . . . . . . . . . . . . . . . . . . . . 2.43% 2.11% 1.96% 2.07% 1.88%Portfolio turnover rate . . . . . . . . . . . . . . . . . . . . . . . . . . . . . . . . . . . . . . . . . . . 5% 5% 7% 10% 12%
(a) Amount represents less than $0.01 per share.(b) Total return represents aggregate total return for the periods indicated.(c) Based on average shares outstanding.
SEE NOTES TO FINANCIAL STATEMENTSII-32

TWEEDY, BROWNE FUND INC.
Notes to Financial Statements
1. OrganizationTweedy, Browne Fund Inc. (the “Company”) is an open-
end management investment company registered with theUnited States Securities and Exchange Commission (“SEC”)under the Investment Company Act of 1940, as amended(the “1940 Act”). The Company was organized as a Marylandcorporation on January 28, 1993. Tweedy, Browne GlobalValue Fund (“Global Value Fund”), Tweedy, Browne GlobalValue Fund II – Currency Unhedged (“Global Value Fund II– Currency Unhedged”), Tweedy, Browne Value Fund(“Value Fund”), and Tweedy, Browne Worldwide HighDividend Yield Value Fund (“Worldwide High DividendYield Value Fund”) (each a “Fund” and together, the “Funds”)are each diversified series of the Company.
The Funds commenced operations as follows:
FundCommencement of
Operations
Global Value Fund 06/15/93
Global Value Fund II – Currency Unhedged 10/26/09
Value Fund 12/08/93
Worldwide High Dividend Yield Value Fund 09/05/07
Global Value Fund and Global Value Fund II – CurrencyUnhedged seek long-term capital growth by investingprimarily in foreign equity securities that Tweedy, BrowneCompany LLC (the “Investment Adviser”) believes areundervalued. Value Fund seeks long-term capital growth byinvesting primarily in U.S. and foreign equity securities thatthe Investment Adviser believes are undervalued. WorldwideHigh Dividend Yield Value Fund seeks long-term capitalgrowth by investing primarily in U.S. and foreign equitysecurities that the Investment Adviser believes to have above-average dividend yields and valuations that are reasonable.
2. Significant Accounting PoliciesThe Funds are investment companies and, accordingly,
follow the investment company accounting and reportingguidance of the Financial Accounting Standards BoardAccounting Standards Codification Topic 946 – InvestmentCompanies, which is part of U.S. generally acceptedaccounting principles (“U.S. GAAP”). The preparation offinancial statements in accordance with U.S. GAAP requiresmanagement to make estimates and assumptions that affectthe reported amounts and disclosures in the financialstatements. Actual results could differ from those estimates.The following is a summary of significant accounting policiesconsistently followed by the Funds in the preparation of theirfinancial statements.
Portfolio Valuation. Portfolio securities and other assetslisted on a U.S. national securities exchange, comparable
foreign securities exchange or through any system providingfor contemporaneous publication of actual prices (andnot subject to restrictions against sale by the Fund on suchexchange or system) are valued at the last quoted sale price ator prior to the close of regular trading on the New York StockExchange or, if applicable, the NASDAQ Official ClosingPrice (“NOCP”). Portfolio securities and other assets that arereadily marketable but for which there are no reported saleson the valuation date, whether because they are not traded ina system providing for same day publication of sales or becausethere were no sales reported on such date, are generally valuedat the mean between the last asked price and the last bid priceprior to the close of regular trading. Forward exchangecontracts are valued at the forward rate. Securities and otherassets for which current market quotations are not readilyavailable, and those securities which are generally not readilymarketable due to significant legal or contractual restrictions,are valued at fair value as determined in good faith by theInvestment Adviser under the direction of the Company’sBoard of Directors. Securities and other assets for which themost recent market quotations may not be reliable (includingbecause the last sale price does not reflect current marketvalue at the time of valuing the Fund’s assets due todevelopments since such last price) may be valued at fairvalue if the Investment Adviser concludes that fair valuationwill likely result in a more accurate net asset valuation. TheFunds’ use of fair value pricing may cause the net asset valueof a Fund’s shares to differ from the net asset value that wouldbe calculated using market quotations. Fair value pricinginvolves subjective judgments, and it is possible that the fairvalue determined for a security may be materially differentthan the value that could be realized upon the sale of thatsecurity. Debt securities purchased with a remaining maturityof more than 60 days are valued through pricing obtained bypricing services approved by the Company’s Board ofDirectors. Debt securities purchased with a remainingmaturity of 60 days or less are valued at amortized cost, whichapproximates fair value, or by reference to other factors (i.e.,pricing services or dealer quotations) by the InvestmentAdviser.
Fair Value Measurements. The inputs and valuationtechniques used to determine fair value of the Funds’investments are summarized into three levels as described inthe hierarchy below:
• Level 1 – quoted prices in active markets for identicalsecurities
• Level 2 – other significant observable inputs (includingquoted prices for similar securities, interest rates, creditrisk, etc.)
• Level 3 – significant unobservable inputs (including aFund’s own assumptions in determining the fair valueof investments)
II-33
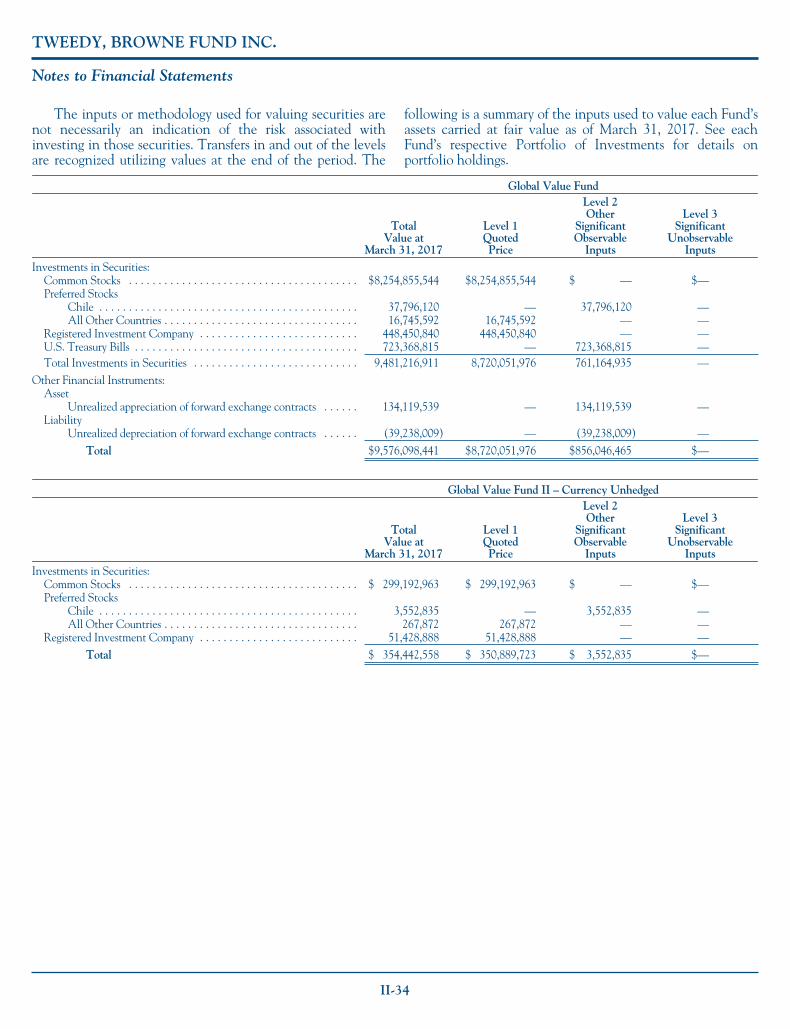
TWEEDY, BROWNE FUND INC.
Notes to Financial Statements
The inputs or methodology used for valuing securities arenot necessarily an indication of the risk associated withinvesting in those securities. Transfers in and out of the levelsare recognized utilizing values at the end of the period. The
following is a summary of the inputs used to value each Fund’sassets carried at fair value as of March 31, 2017. See eachFund’s respective Portfolio of Investments for details onportfolio holdings.
Global Value Fund
TotalValue at
March 31, 2017
Level 1QuotedPrice
Level 2Other
SignificantObservable
Inputs
Level 3Significant
UnobservableInputs
Investments in Securities:Common Stocks . . . . . . . . . . . . . . . . . . . . . . . . . . . . . . . . . . . . . . . $8,254,855,544 $8,254,855,544 $ — $—Preferred Stocks
Chile . . . . . . . . . . . . . . . . . . . . . . . . . . . . . . . . . . . . . . . . . . . . 37,796,120 — 37,796,120 —All Other Countries . . . . . . . . . . . . . . . . . . . . . . . . . . . . . . . . . 16,745,592 16,745,592 — —
Registered Investment Company . . . . . . . . . . . . . . . . . . . . . . . . . . . 448,450,840 448,450,840 — —U.S. Treasury Bills . . . . . . . . . . . . . . . . . . . . . . . . . . . . . . . . . . . . . . 723,368,815 — 723,368,815 —Total Investments in Securities . . . . . . . . . . . . . . . . . . . . . . . . . . . . 9,481,216,911 8,720,051,976 761,164,935 —
Other Financial Instruments:Asset
Unrealized appreciation of forward exchange contracts . . . . . . 134,119,539 — 134,119,539 —Liability
Unrealized depreciation of forward exchange contracts . . . . . . (39,238,009) — (39,238,009) —Total $9,576,098,441 $8,720,051,976 $856,046,465 $—
Global Value Fund II – Currency Unhedged
TotalValue at
March 31, 2017
Level 1QuotedPrice
Level 2Other
SignificantObservable
Inputs
Level 3Significant
UnobservableInputs
Investments in Securities:Common Stocks . . . . . . . . . . . . . . . . . . . . . . . . . . . . . . . . . . . . . . . $ 299,192,963 $ 299,192,963 $ — $—Preferred Stocks
Chile . . . . . . . . . . . . . . . . . . . . . . . . . . . . . . . . . . . . . . . . . . . . 3,552,835 — 3,552,835 —All Other Countries . . . . . . . . . . . . . . . . . . . . . . . . . . . . . . . . . 267,872 267,872 — —
Registered Investment Company . . . . . . . . . . . . . . . . . . . . . . . . . . . 51,428,888 51,428,888 — —Total $ 354,442,558 $ 350,889,723 $ 3,552,835 $—
II-34
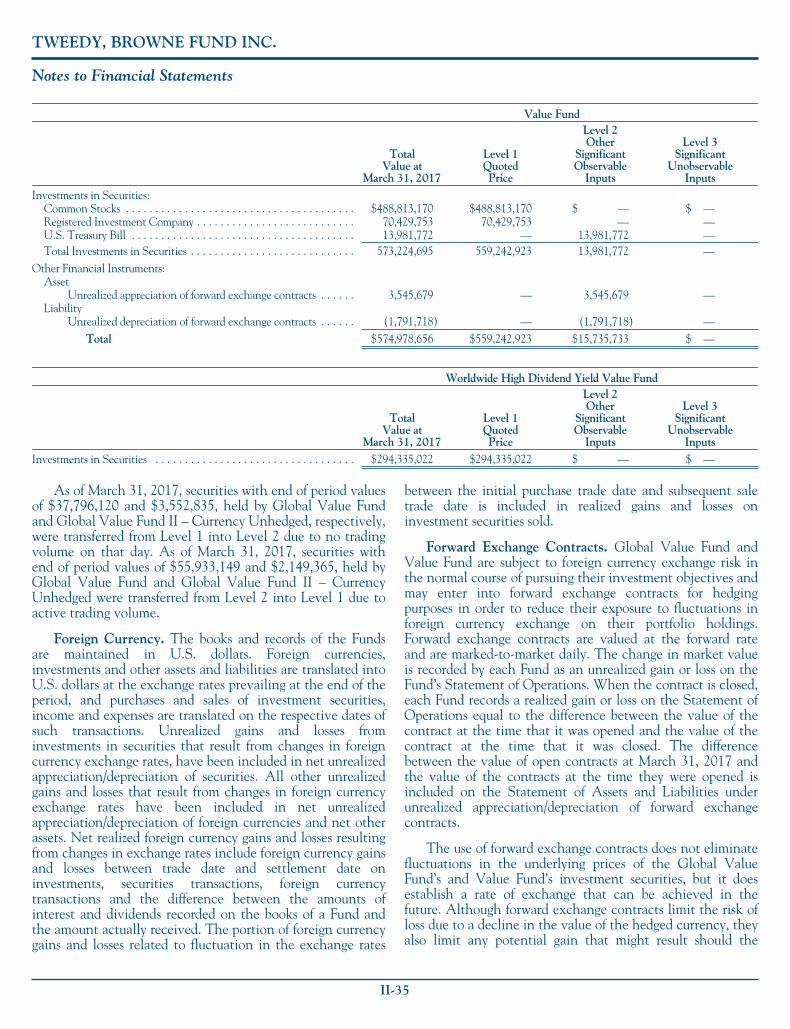
TWEEDY, BROWNE FUND INC.
Notes to Financial Statements
Value Fund
TotalValue at
March 31, 2017
Level 1QuotedPrice
Level 2Other
SignificantObservable
Inputs
Level 3Significant
UnobservableInputs
Investments in Securities:Common Stocks . . . . . . . . . . . . . . . . . . . . . . . . . . . . . . . . . . . . . . . $488,813,170 $488,813,170 $ — $ —Registered Investment Company . . . . . . . . . . . . . . . . . . . . . . . . . . . 70,429,753 70,429,753 — —U.S. Treasury Bill . . . . . . . . . . . . . . . . . . . . . . . . . . . . . . . . . . . . . . 13,981,772 — 13,981,772 —Total Investments in Securities . . . . . . . . . . . . . . . . . . . . . . . . . . . . 573,224,695 559,242,923 13,981,772 —
Other Financial Instruments:Asset
Unrealized appreciation of forward exchange contracts . . . . . . 3,545,679 — 3,545,679 —Liability
Unrealized depreciation of forward exchange contracts . . . . . . (1,791,718) — (1,791,718) —Total $574,978,656 $559,242,923 $15,735,733 $ —
Worldwide High Dividend Yield Value Fund
TotalValue at
March 31, 2017
Level 1QuotedPrice
Level 2Other
SignificantObservable
Inputs
Level 3Significant
UnobservableInputs
Investments in Securities . . . . . . . . . . . . . . . . . . . . . . . . . . . . . . . . . . $294,335,022 $294,335,022 $ — $ —
As of March 31, 2017, securities with end of period valuesof $37,796,120 and $3,552,835, held by Global Value Fundand Global Value Fund II – Currency Unhedged, respectively,were transferred from Level 1 into Level 2 due to no tradingvolume on that day. As of March 31, 2017, securities withend of period values of $55,933,149 and $2,149,365, held byGlobal Value Fund and Global Value Fund II – CurrencyUnhedged were transferred from Level 2 into Level 1 due toactive trading volume.
Foreign Currency. The books and records of the Fundsare maintained in U.S. dollars. Foreign currencies,investments and other assets and liabilities are translated intoU.S. dollars at the exchange rates prevailing at the end of theperiod, and purchases and sales of investment securities,income and expenses are translated on the respective dates ofsuch transactions. Unrealized gains and losses frominvestments in securities that result from changes in foreigncurrency exchange rates, have been included in net unrealizedappreciation/depreciation of securities. All other unrealizedgains and losses that result from changes in foreign currencyexchange rates have been included in net unrealizedappreciation/depreciation of foreign currencies and net otherassets. Net realized foreign currency gains and losses resultingfrom changes in exchange rates include foreign currency gainsand losses between trade date and settlement date oninvestments, securities transactions, foreign currencytransactions and the difference between the amounts ofinterest and dividends recorded on the books of a Fund andthe amount actually received. The portion of foreign currencygains and losses related to fluctuation in the exchange rates
between the initial purchase trade date and subsequent saletrade date is included in realized gains and losses oninvestment securities sold.
Forward Exchange Contracts. Global Value Fund andValue Fund are subject to foreign currency exchange risk inthe normal course of pursuing their investment objectives andmay enter into forward exchange contracts for hedgingpurposes in order to reduce their exposure to fluctuations inforeign currency exchange on their portfolio holdings.Forward exchange contracts are valued at the forward rateand are marked-to-market daily. The change in market valueis recorded by each Fund as an unrealized gain or loss on theFund’s Statement of Operations. When the contract is closed,each Fund records a realized gain or loss on the Statement ofOperations equal to the difference between the value of thecontract at the time that it was opened and the value of thecontract at the time that it was closed. The differencebetween the value of open contracts at March 31, 2017 andthe value of the contracts at the time they were opened isincluded on the Statement of Assets and Liabilities underunrealized appreciation/depreciation of forward exchangecontracts.
The use of forward exchange contracts does not eliminatefluctuations in the underlying prices of the Global ValueFund’s and Value Fund’s investment securities, but it doesestablish a rate of exchange that can be achieved in thefuture. Although forward exchange contracts limit the risk ofloss due to a decline in the value of the hedged currency, theyalso limit any potential gain that might result should the
II-35

TWEEDY, BROWNE FUND INC.
Notes to Financial Statements
value of the hedged currency increase. In addition, the GlobalValue and Value Funds could be exposed to risks if thecounterparties to the contracts are unable to meet the termsof their contracts.
Securities Transactions and Investment Income.Securities transactions are recorded as of the trade date.Realized gains and losses from securities transactions arerecorded on the identified cost basis. Dividend income anddistributions to shareholders are recorded on the ex-dividenddate. In the case of certain foreign securities, dividend incomeis recorded as soon after the ex-date as the Funds becomeaware of such dividend. Interest income and expenses arerecorded on an accrual basis.
Foreign Taxes. The Funds may be subject to foreign taxeson dividend and interest income, gains on investments orcurrency purchase/repatriation, a portion of which may berecoverable. The Funds’ custodian applies for refunds onbehalf of each Fund where available. The Funds will accruesuch taxes and recoveries as applicable, based on their currentinterpretation of tax rules and regulations that exist in themarkets in which they invest.
Dividends and Distributions to Shareholders. Dividendsfrom net investment income, if any, will be declared and paidannually for Global Value Fund, Global Value Fund II –Currency Unhedged, and Value Fund and semi-annually forWorldwide High Dividend Yield Value Fund. Distributionsfrom realized capital gains after utilization of capital losscarryforwards, if any, will be declared and paid annually foreach of the Funds. Additional distributions of net investmentincome and capital gains from the Funds may be made at thediscretion of the Board of Directors in order to avoid theapplication of a 4% non-deductible federal excise tax oncertain undistributed amounts of ordinary income and capitalgains. Income dividends and capital gain distributions aredetermined in accordance with income tax regulations whichmay differ from U.S. GAAP. These differences are primarilydue to differing treatments of income and gains on variousinvestment securities held by the Funds, timing differences anddiffering characterization of distributions made by the Funds.
Federal Income Taxes. Each Fund has qualified andintends to continue to qualify as a regulated investmentcompany by complying with the requirements of the U.S.Internal Revenue Code of 1986, as amended (the “Code”),applicable to regulated investment companies and bydistributing substantially all of its taxable income to itsshareholders. Therefore, no federal income tax provision isrequired.
The Funds are not aware of any events that are reasonablypossible to occur in the next twelve months that would resultin the amounts of any unrecognized tax benefits significantlyincreasing or decreasing for the Funds. However, the Funds’conclusions may be subject to future review based on changes
in accounting standards or tax laws and regulations or theinterpretation thereof. In addition, utilization of any capitalloss carryforwards could be subject to limitations imposed bythe Code related to share ownership changes. Each of theFunds’ tax positions for the tax years for which the applicablestatutes of limitations have not expired are subject toexamination by the Internal Revenue Service, statedepartments of revenue and by foreign tax authorities.
Expenses. Expenses directly attributable to each Fund as adiversified series of the Company are charged to such Fund.Other expenses of the Company are allocated to each seriesbased on the average net assets of each series or otherequitable allocation method.
3. Investment Advisory Fee, Other Related PartyTransactions and Administration Fee
The Company, on behalf of each Fund, has entered intoseparate investment advisory agreements with the InvestmentAdviser (each, an “Advisory Agreement”). Under eachAdvisory Agreement, the Company pays the InvestmentAdviser a fee at the annual rate of 1.25% of the value of eachFund’s average daily net assets. The fee is payable monthly,provided that each Fund will make such interim payments asmay be requested by the Investment Adviser not to exceed75% of the amount of the fee then accrued on the books ofthe Fund and unpaid. For the year ended March 31, 2017, theInvestment Adviser earned $112,961,938, $4,055,968,$6,667,353 and $3,881,927 in fees from Global Value Fund,Global Value Fund II – Currency Unhedged, Value Fund andWorldwide High Dividend Yield Value Fund, respectively.
The Company pays the Investment Adviser for certainshareholder servicing and administration services provided tothe Funds at an annual amount of $475,000, which isallocated pro-rata based on the relative average net assets ofthe Funds.
No officer, director or employee of the InvestmentAdviser, the Funds’ administrator, BNY Mellon InvestmentServicing (US) Inc. (“BNY Mellon”) or any parent orsubsidiary of those corporations receives any compensationfrom the Company for serving as a director or officer of theCompany. The Company pays each Independent Director$125,000 annually, in quarterly increments of $31,250, plusout-of-pocket expenses for their services as directors. (Prior toJanuary 1, 2017, such amounts were $115,000 and $28,750,respectively). The Lead Independent Director receives anadditional annual fee of $25,000. (Prior to January 1, 2017,such amount was $20,000). These fees are allocated pro-ratabased on the relative average net assets of the Funds.
The Company, on behalf of the Funds, has entered intoan administration agreement (the “AdministrationAgreement”) with BNY Mellon, an indirect, wholly-ownedsubsidiary of The Bank of New York Mellon Corporation.Under the Administration Agreement, the Company pays
II-36

TWEEDY, BROWNE FUND INC.
Notes to Financial Statements
BNY Mellon an administration fee and a fund accounting feecomputed daily and payable monthly at the following annualrates of the aggregate average daily net assets of the Funds,allocated according to each Fund’s net assets:
Up to$1 Billion
Between$1 Billion
and$5 Billion
Between$5 Billion
and$10 Billion
Exceeding$10 Billion
Administration Fees 0.0300% 0.0180% 0.0100% 0.0090%
Accounting Fees 0.0075% 0.0060% 0.0050% 0.0040%
Bank of New York Mellon Asset Servicing, an indirect,wholly-owned subsidiary of The Bank of New York MellonCorporation, serves as the Funds’ custodian pursuant to a
custody agreement. BNY Mellon also serves as the Funds’transfer agent.
AMG Distributors, Inc., an affiliate of the InvestmentAdviser, serves as the distributor to the Funds. TheInvestment Adviser pays all distribution-related expenses. Nodistribution fees are paid by the Funds.
At March 31, 2017, one shareholder owned 11.5% ofGlobal Value Fund II – Currency Unhedged’s outstandingshares; three shareholders owned 18.8% of Value Fund’soutstanding shares; and three shareholders owned 25.3% ofWorldwide High Dividend Yield Value Fund’s outstandingshares. Investment activities of these shareholders could havean impact on each respective Fund.
4. Securities TransactionsThe 1940 Act defines “affiliated companies” to include securities in which a fund owns 5% or more of the outstanding
voting shares of an issuer. The following chart lists the issuers owned by Global Value Fund that may be deemed “affiliatedcompanies,” as well as transactions that occurred in the securities of such issuers during the year ended March 31, 2017:
Shares Heldat 3/31/16 Name of Issuer
Value at3/31/16
PurchaseCost
SalesProceeds
Value at3/31/17
Shares Heldat 3/31/17
DividendIncome 4/1/16
to 3/31/17
Net Realized Gain(Loss) 4/1/16 to
3/31/17
Net UnrealizedAppreciation
(Depreciation) 4/1/16to 3/31/17
218,165 Coltene Holding AG $ 14,807,837 $ — $ — $ 17,360,350 218,165 $1,092,510 $ — $ 2,552,513
68,640 Phoenix Mecano AG 30,730,852 — — 35,316,050 68,640 1,037,956 — 4,585,198
248,117 Siegfried Holding AG 45,936,557 — — 65,378,749 248,117 463,650 — 19,442,192
4,795,392 SOL SpA 42,733,055 — — 49,237,690 4,795,392 645,250 — 6,504,635
$134,208,301 $ — $ — $167,292,839 $3,239,366 $ — $33,084,538
None of the other Funds owned 5% or more of the outstanding voting shares of any issuer.
The cost of purchases and proceeds from sales ofinvestment securities, excluding short-term investments, forthe year ended March 31, 2017, are as follows:
Global ValueFund
Global ValueFund II –CurrencyUnhedged Value Fund
WorldwideHigh
DividendYield
Value Fund
Purchases $636,918,344 $10,922,791 $36,559,021 $13,777,869
Sales $249,986,951 $41,155,679 $64,426,910 $95,247,826
5. Capital StockThe Company is authorized to issue 2.0 billion shares of
$0.0001 par value capital stock, of which 600,000,000,600,000,000, 400,000,000 and 400,000,000 shares have beendesignated as shares of Global Value Fund, Global ValueFund II – Currency Unhedged, Value Fund and WorldwideHigh Dividend Yield Value Fund, respectively. Redemptionsfrom the Global Value Fund, Global Value Fund II –Currency Unhedged and Worldwide High Dividend Yield
Value Fund, including exchange redemptions, made less than15 days after purchase are subject to a redemption fee equal to2% of the redemption proceeds, which is retained by eachFund.
Redemptions, including exchanges, made prior toSeptember 1, 2015 were subject to the same redemption fee ifheld less than 60 days.
During the period August 12, 2014 through January 31,2016, Global Value Fund II – Currency Unhedged was closedto most new investors. Effective February 1, 2016 the Fundreopened to all new investors.
Changes in shares outstanding for the year endedMarch 31, 2017 were as follows:
Global Value Fund
Shares Amount
Sold 60,416,173 $1,516,843,063Reinvested 9,794,620 244,278,440Redeemed (76,909,801) (1,931,911,028)
Net Decrease (6,699,008) $(170,789,525)
II-37

TWEEDY, BROWNE FUND INC.
Notes to Financial Statements
Global Value Fund II – Currency Unhedged
Shares Amount
Sold 4,620,257 $61,462,637Reinvested 306,700 3,968,702Redeemed (6,367,640) (83,834,605)
Net Decrease (1,440,683) $(18,403,266)
Value Fund
Shares Amount
Sold 2,139,437 $45,501,290Reinvested 1,092,389 22,743,538Redeemed (2,691,231) (55,886,996)
Net Increase 540,595 $12,357,832
Worldwide HighDividend Yield Value Fund
Shares Amount
Sold 1,113,972 $9,984,880Reinvested 1,396,389 12,265,513Redeemed (9,475,818) (84,383,933)
Net Decrease (6,965,457) $(62,133,540)
Changes in shares outstanding for the year endedMarch 31, 2016 were as follows:
Global Value Fund
Shares Amount
Sold 80,768,091 $2,036,815,258Reinvested 15,155,324 373,438,482Redeemed (87,099,963) (2,195,796,310)
Net Increase 8,823,452 $214,457,430
Global Value Fund II – Currency Unhedged
Shares Amount
Sold 6,152,235 $83,500,293Reinvested 317,347 4,162,030Redeemed (11,831,490) (157,022,130)
Net Decrease (5,361,908) $(69,359,807)
Value Fund
Shares Amount
Sold 1,768,581 $37,830,480Reinvested 1,047,160 20,975,772Redeemed (4,839,534) (102,630,033)
Net Decrease (2,023,793) $(43,823,781)
Worldwide High Dividend Yield Value Fund
Shares Amount
Sold 3,025,682 $28,511,397Reinvested 4,710,041 43,216,470Redeemed (21,945,194) (220,238,795)
Net Decrease (14,209,471) $(148,510,928)
6. Income Tax InformationThe character of distributions paid on a tax basis during
the fiscal year ended March 31, 2017 is as follows:
Distributionspaid from:
GlobalValue Fund
Global ValueFund II –CurrencyUnhedged Value Fund
WorldwideHigh
DividendYield
Value Fund
Investment income $102,538,489 $4,807,739 $4,923,187 $7,822,186Short-term capital
gain 56,185,474 — 3,238,939 —
Ordinary income 158,723,963 4,807,739 8,162,126 7,822,186
Long-term capitalgain 119,394,131 — 15,676,463 4,773,837
Total Distributions $278,118,094 $4,807,739 $23,838,589 $12,596,023
The character of distributions paid on a tax basis duringthe fiscal year ended March 31, 2016 is as follows:
Distributionspaid from:
GlobalValue Fund
Global ValueFund II –CurrencyUnhedged Value Fund
WorldwideHigh
DividendYield
Value Fund
Investment income $74,111,906 $5,007,006 $5,497,912 $10,977,968Short-term capital
gain 73,241,338 — 319,219 —
Ordinary income 147,353,244 5,007,006 5,817,131 10,977,968
Long-term capitalgain 276,051,048 — 16,226,571 33,120,921
Total Distributions $423,404,292 $5,007,006 $22,043,702 $44,098,889
As of March 31, 2017, the components of distributableearnings on a tax basis were as follows:
GlobalValue Fund
Global ValueFund II –CurrencyUnhedged Value Fund
WorldwideHigh
DividendYield
Value Fund
Undistributedordinary income $45,830,600 $1,405,401 $3,316,018 $2,027,091
Undistributedlong-termcapital gain 20,584,855 — 3,579,766 1,238,168
Unrealizedappreciation/(depreciation) 2,536,658,472 54,210,921 223,478,202 61,632,441
Accumulatedcapital andother losses — (16,450,962) — —
Total $2,603,073,927 $39,165,360 $230,373,986 $64,897,700
The Funds may have temporary or permanent book/taxdifferences. The temporary differences are due to differingtreatments for losses deferred due to excise tax regulations,capital loss carryforwards, mark-to-market on forwardcontracts, and mark-to-market on passive foreign investmentcompanies. Temporary differences will reverse at some time inthe future. Reclassifications are recorded to the Funds’ capitalaccounts for any permanent tax differences to reflect income
II-38

TWEEDY, BROWNE FUND INC.
Notes to Financial Statements
and gains available for distribution (or available capital losscarryforwards) under income tax regulations. For the yearended March 31, 2017, permanent book and tax basisdifferences resulting primarily from differing treatments forforeign currency transactions, sales of passive foreigninvestment companies and distribution redesignations wereidentified and reclassified among the components of eachFund’s net assets as follows:
GlobalValue Fund
Global ValueFund II –CurrencyUnhedged Value Fund
WorldwideHigh
DividendYield
Value Fund
Undistributedordinary income $2,222,931 $325,756 $263,151 $78,973
Accumulatednet realizedgain (loss) (2,222,931) (325,756) (263,151) (78,973)
Paid-in capital — — — —
Results of operations and net assets were not affected bythese reclassifications.
As of March 31, 2017, Global Value Fund II – CurrencyUnhedged had a short-term and a long-term capital losscarryforward of $9,025,729 and $7,425,233, respectively,which under current federal income tax rules may be availableto reduce future net realized gains on investments in anyfuture period to the extent permitted by the Code. Utilizationof these capital loss carryforwards could be subject tolimitations imposed by the Code related to share ownershipchanges. During the year ended March 31, 2017, GlobalValue Fund and Global Value Fund II – Currency Unhedgedutilized $177,724,321 and $3,664,250, respectively, in capitalloss carry forwards.
As of March 31, 2017, the aggregate cost of securities ineach Fund’s portfolio for federal tax purposes was as follows:
Global Value Fund $6,945,225,745
Global Value Fund II – Currency Unhedged $300,244,720
Value Fund $349,539,250
Worldwide High Dividend Yield Value Fund $232,684,880
The aggregate gross unrealized appreciation/depreciationand net unrealized appreciation as computed on a federalincome tax basis at March 31, 2017 for each Fund is as follows:
GrossAppreciation
GrossDepreciation
NetAppreciation
Global Value Fund $3,296,595,161 $(760,603,995) $2,535,991,166
Global Value Fund II –Currency Unhedged 92,138,841 (37,941,003) 54,197,838
Value Fund 244,080,540 (20,395,095) 223,685,445
Worldwide High DividendYield Value Fund 85,149,098 (23,498,956) 61,650,142
7. Foreign SecuritiesInvesting in securities of foreign companies and foreign
governments involves economic and political risks andconsiderations not typically associated with investing in U.S.companies and the U.S. Government. These considerationsinclude changes in exchange rates and exchange rate controls(which may include suspension of the ability to transfercurrency from a given country), costs incurred in conversionsbetween currencies, non-negotiable brokerage commissions,less publicly available information, not generally being subjectto uniform standards, practices and requirements with respectto accounting, auditing and financial reporting, lower tradingvolume, delayed settlements and greater market volatility, thedifficulty of enforcing obligations in other countries, lesssecurities regulation, different tax provisions (includingwithholding on dividends paid to a Fund), war, seizure,political and social instability and diplomatic developments.
8. Derivative InstrumentsDuring the year ended March 31, 2017, Global Value Fund
and Value Fund had derivative exposure to forward foreigncurrency exchange contracts. Global Value Fund II – CurrencyUnhedged and Worldwide High Dividend Yield Value Fundhad no exposure to derivatives. For open contracts atMarch 31, 2017, see the Portfolio of Investments.
The following summarizes the volume of the GlobalValue and Value Funds’ forward foreign currency exchangecontract activity during the year ended March 31, 2017:
Global Value Fund Value Fund
Average Notional Amount $(4,703,632,832) $(160,212,647)
Notional Amount at March 31, 2017 $(5,230,826,139) $(167,945,505)
The following table presents the value of derivatives heldas of March 31, 2017, by their primary underlying riskexposure and respective location on the Statements of Assetsand Liabilities:
Statement of Assets and Liabilities
Derivative Assets Location Global Value Fund Value Fund
Forwardexchange contracts
Unrealizedappreciation offorward exchangecontracts $134,119,539 $3,545,679
Derivative Liabilities Location Global Value Fund Value Fund
Forwardexchange contracts
Unrealizeddepreciation offorward exchangecontracts $39,238,009 $1,791,718
II-39

TWEEDY, BROWNE FUND INC.
Notes to Financial Statements
The following table presents the effect of derivatives onthe Statements of Operations for the year ended March 31,2017, by primary risk exposure:
Statement of Operations
Derivative Global Value Fund Value Fund
Forwardexchange contracts
Net realized gain (loss)on forward exchangecontracts $184,659,953 $6,356,562
Derivative Global Value Fund Value Fund
Forwardexchange contracts
Net change inunrealized appreciation(depreciation) of forwardexchange contracts $146,259,911 $4,689,272
For financial reporting purposes, the Funds do not offsetassets and liabilities across derivative types that are subject tomaster netting arrangements on the Statement of Assets andLiabilities.
The following table presents derivative assets net ofamounts available for offset under a master netting agreementfor forward currency contracts as of March 31, 2017:
CounterpartyDerivative
Assets – Gross(a)
DerivativesAvailablefor Offset
DerivativeAssets – Net(b)
Global Value FundBNY $53,233,907 $6,312,478 $46,921,429
JPM 14,121,276 12,926,187 1,195,089
NTC 27,972,994 9,201,348 18,771,646
SSB 38,791,362 10,797,996 27,993,366
Total $134,119,539 $39,238,009 $94,881,530
Value FundBNY $1,485,005 $415,279 $1,069,726
JPM 325,943 285,704 40,239
NTC 1,678,033 368,849 1,309,184
SSB 56,698 56,698 —
Total $3,545,679 $1,126,530 $2,419,149
The following table presents derivative liabilities net ofamounts available for offset under a master netting agreementfor forward currency contracts as of March 31, 2017:
CounterpartyDerivative
Liabilities – Gross(a)
DerivativesAvailablefor Offset
DerivativeLiabilities – Net(c)
Global Value FundBNY $6,312,478 $6,312,478 $—
JPM 12,926,187 12,926,187 —
NTC 9,201,348 9,201,348 —
SSB 10,797,996 10,797,996 —
Total $39,238,009 $39,238,009 $—
CounterpartyDerivative
Liabilities – Gross(a)
DerivativesAvailablefor Offset
DerivativeLiabilities – Net(c)
Value FundBNY $415,279 $415,279 $—
JPM 285,704 285,704 —
NTC 368,849 368,849 —
SSB 721,886 56,698 665,188
Total $1,791,718 $1,126,530 $665,188
(a) As presented in the Statement of Assets and Liabilities.(b) Net amount represents the net receivable due from counterparty in the
event of default(c) Net amount represents the net payable due to counterparty in the event
of default
Counterparty Abbreviations:BNY — The Bank of New York MellonJPM — JPMorgan Chase Bank NA
NTC — Northern Trust CompanySSB — State Street Bank and Trust Company
9. IndemnificationsUnder the Company’s organizational documents, its
directors and officers are indemnified against certain liabilitiesthat may arise out of the performance of their duties to theFunds. Additionally, in the course of business, the Companyenters into contracts that contain a variety of indemnificationclauses. The Funds’ maximum exposure under thesearrangements is unknown, as this would involve future claimsthat may be made against the Funds that have not yetoccurred. However, the Investment Adviser believes the riskof loss under these arrangements to be remote.
10. LitigationCertain holders of notes issued by Tribune Company
initiated litigation against Value Fund and thousands of otherpublic shareholders, seeking to recover payments made toTribune Company shareholders in connection with the 2007leveraged buyout of Tribune Company. A litigation trustarising out of the Tribune Company bankruptcy proceedingalso initiated claims against a substantially similar group ofpublic shareholders, including Value Fund. The claims werepursued in a consolidated multidistrict litigation format. OnSeptember 23, 2013, the claims asserted by the noteholderswere dismissed by the U.S. District Court. The DistrictCourt’s decision was appealed by both plaintiffs anddefendants to the U.S. Court of Appeals for the SecondCircuit. On November 5, 2014, after briefing was completed,the Second Circuit Court of Appeals heard oral arguments.On March 29, 2016 the Second Circuit issued its revisedopinion affirming the District Court’s dismissal of thenoteholder actions. On April 12, 2016, the plaintiffnoteholders filed a petition for rehearing with the SecondCircuit and on July 22, 2016, the Second Circuit issued anorder denying plaintiffs’ petition for rehearing. OnSeptember 9, 2016, the noteholders filed a petition for writ ofcertiorari in the United States Supreme Court, which is
II-40
TWEEDY, BROWNE FUND INC.
Notes to Financial Statements
currently pending. The timetable for a decision by theSupreme Court on whether to hear the appeal is unknown.The claims by the litigation trust pending in pre-trialproceedings before the District Court have been dismissed,subject to the litigation trust’s potential to appeal the DistrictCourt’s January 6, 2017 decision dismissing the litigationtrust’s intentional fraudulent transfer claims. Value Fundtendered its shares in a tender offer from Tribune Companyand received proceeds of approximately $3.4 million. Theplaintiffs’ claims allege that the shareholder payments weremade in violation of various laws prohibiting constructiveand/or actual fraudulent transfers. The complaints allege nomisconduct by Value Fund or any member of the putativedefendant class. The outcome of the proceedings cannot bepredicted at this time and no contingency has been recordedon the books of Value Fund.
11. New Accounting PronouncementsIn October 2016, the SEC issued a new rule, Investment
Company Reporting Modernization, which among otherprovisions, amends Regulation S-X to require standardized,
enhanced disclosures, particularly related to derivatives, ininvestment company financial statements. Compliance withthe rule is effective for financial statements filed with the SECon or after August 1, 2017. Management is currentlyevaluating the impact of adoption and expects the impact willbe limited to additional financial statement disclosure.
In December 2016, the Financial Accounting StandardsBoard (“FASB”) issued Accounting Standards Update2016-19 – Technical Corrections and Improvements(“ASU 2016-19”) that includes amendments to Topic 820Fair Value Measurement (“Topic 820”). The changes toTopic 820 are intended to clarify the difference between avaluation approach and a valuation technique and require anentity to disclose when there has been a change in either orboth. These changes are effective for fiscal years beginningafter December 15, 2016 and interim periods within thosefiscal years. Management is currently evaluating the impact ofadoption and expects the impact will be limited to additionalfinancial statement disclosure.
II-41

TWEEDY, BROWNE FUND INC.
Report of Independent Registered Public Accounting Firm
To the Board of Directors of Tweedy, Browne Fund Inc. and the Shareholders of Tweedy, Browne Global Value Fund,Tweedy, Browne Global Value Fund II – Currency Unhedged, Tweedy, Browne Value Fund and Tweedy, Browne WorldwideHigh Dividend Yield Value Fund:
In our opinion, the accompanying statements of assets and liabilities, including the portfolios of investments, and therelated statements of operations and of changes in net assets and the financial highlights present fairly, in all material respects,the financial position of Tweedy, Browne Global Value Fund, Tweedy, Browne Global Value Fund II – Currency Unhedged,Tweedy, Browne Value Fund and Tweedy, Browne Worldwide High Dividend Yield Value Fund (constituting the Tweedy,Browne Fund Inc., hereafter referred to as the “Fund”) as of March 31, 2017, the results of each of their operations for the yearthen ended, the changes in each of their net assets for each of the two years in the period then ended and the financialhighlights for each of the five years in the period then ended, in conformity with accounting principles generally accepted inthe United States of America. These financial statements and financial highlights (hereafter referred to as “financialstatements”) are the responsibility of the Fund’s management. Our responsibility is to express an opinion on these financialstatements based on our audits. We conducted our audits of these financial statements in accordance with the standards of thePublic Company Accounting Oversight Board (United States). Those standards require that we plan and perform the audit toobtain reasonable assurance about whether the financial statements are free of material misstatement. An audit includesexamining, on a test basis, evidence supporting the amounts and disclosures in the financial statements, assessing theaccounting principles used and significant estimates made by management, and evaluating the overall financial statementpresentation. We believe that our audits, which included confirmation of securities as of March 31, 2017 by correspondencewith the custodian and brokers, provide a reasonable basis for our opinion.
PricewaterhouseCoopers LLPNew York, New YorkMay 19, 2017
II-42

TWEEDY, BROWNE FUND INC.
Other Information (Unaudited)
1. Investment in the Fund by Managing Directors andEmployees of the Investment Adviser
As of March 31, 2017, the current and retired managingdirectors and their families, as well as employees of theInvestment Adviser, have approximately $128.4 million,$5.6 million, $74.3 million and $7.2 million of their ownmoney invested in Global Value Fund, Global ValueFund II – Currency Unhedged, Value Fund and WorldwideHigh Dividend Yield Value Fund, respectively.
2. Tax Information – Year Ended March 31, 2017For shareholders who do not have a March 31, 2017 tax year
end, this footnote is for informational purposes only. Form1099-DIV will be sent to shareholders in February 2018 reportingthe amounts and tax characterization of distributions for the 2017calendar year.
For the fiscal year ended March 31, 2017, the amount oflong-term capital gain designated by the Funds and taxable atthe lower capital gain rate for federal income tax purposeswas:
Fund
Global Value Fund $139,978,986
Global Value Fund II – Currency Unhedged $—
Value Fund $19,256,229Worldwide High Dividend Yield Value Fund $6,012,005
Of the ordinary income (including short-term capitalgain) distributions made by the Funds during the fiscal yearended March 31, 2017, the percentage that qualifies for thedividend received deduction available to corporateshareholders was:
Fund
Global Value Fund 9.69%
Global Value Fund II – Currency Unhedged 13.54%
Value Fund 50.43%Worldwide High Dividend Yield Value Fund 25.70%
For the fiscal year ended March 31, 2017, the percentageof the distributions paid by the Funds that qualify for thelower tax rates (qualified dividend income) applicable toindividual shareholders was:
Fund
Global Value Fund 100%
Global Value Fund II – Currency Unhedged 100%
Value Fund 100%Worldwide High Dividend Yield Value Fund 100%
If the Funds meet the requirements of Section 853 of theInternal Revenue Code, the Funds may elect to pass throughto their shareholders credits for foreign taxes paid.
For the fiscal year ended March 31, 2017, the grossincome derived from foreign sources and foreign taxes paidwere:
Global Value Fund
Dollar Amount Per Share
Foreign Source Income $238,850,093 $0.6668
Foreign Taxes 14,060,073 0.0393
Global Value Fund II – Currency Unhedged
Dollar Amount Per Share
Foreign Source Income $9,520,312 $0.3795
Foreign Taxes 604,432 0.0241
Worldwide High Dividend Yield Value Fund
Dollar Amount Per Share
Foreign Source Income $10,835,571 $0.3466
Foreign Taxes 447,216 0.0143
3. Portfolio InformationThe Company files each Fund’s complete schedule of
portfolio holdings with the SEC for the first and third quartersof each fiscal year on Form N-Q. The Company’s Form N-Qis available (1) on the SEC’s website at http://www.sec.gov;(2) for review and copying at the SEC’s Public ReferenceRoom (“PRR”) in Washington, DC; or (3) by calling theFund at 800-432-4789. Information regarding the operation ofthe PRR may be obtained by calling 202-551-8090.
4. Proxy Voting InformationThe policies and procedures that the Company uses to
determine how to vote proxies relating to portfolio securitiesheld by the Funds are included in the Company’s Statementof Additional Information, which is available without chargeand upon request by calling the Funds at 800-432-4789 or byvisiting the Funds’ website at www.tweedy.com. Informationregarding how the Funds voted proxies relating to portfoliosecurities during the most recent twelve-month period endedJune 30 is available, without charge, at http://www.sec.gov.
II-43

TWEEDY, BROWNE FUND INC.
Other Information (Unaudited)
NON-INTERESTED DIRECTORS
Name, Address1, Age andPosition(s) with Company
Term ofOffice andLength of
Time Served2Principal Occupation(s)
during at Least the Past 5 Years
Number ofPortfolios in
FundComplex
Overseen byDirector
OtherDirectorships
Held byDirector
Paul F. BalserAge: 75Director
Since 2000 Partner, Ironwood Manufacturing Fund, LP (privateequity investments), since 2003; Partner, IronwoodManagement Fund (private equity investments),since 2007; Partner, Ironwood Partners LLC (privateequity investments), since December 2001; Partner,Generation Partners (private equity investments)from August 1995 to September 30, 2004; SeniorAdvisor, Cheyenne Capital (private equityinvestments) since March 2015.
4 Director, Janus CapitalGroup Inc. (asset
management) throughApril 2014
Bruce A. BealAge: 80Director
Since 1993 Chairman, Related Beal (real estate developmentand investment companies).
4 None
Robert C. ElliottAge: 70Director
Since 2016 Vice Chairman, since March 2014 and Board Membersince May 2011, Market Street Trust Company; Board ofRegents – Winthrop University Hospital since 2005;Senior Adviser, Bessemer Trust from 2011-2014; SeniorManaging Director, Bessemer Trust from 1975-2011.
4 None
Jack E. FocklerAge: 58Director
Since 2016 Managing Director and Vice President, Head of Sales,Client Service and Marketing from October 1989 toJune 2015 and Senior Advisor since July 2015, Royce& Associates, LP.
4 None
John C. Hover IIAge: 73Director
Since 2003 Former Executive Vice President, United States TrustCompany of New York (Retired since 2000).
4 Member of the Boards ofManagers of
Bank of America’sExcelsior Funds
through July 2015
Richard B. SalomonAge: 69Director
Since 1996 Of Counsel, Cozen O’Connor (law firm); Member,Cozen O’Connor from April 2009 to January 2013.
4 None
INTERESTED DIRECTORS3
William H. BrowneAge: 72Vice President and
Director
Vice President –Since July 2009;Chairman of the
Board fromJuly 2009 –
March 2016;Director – SinceMarch 2009 andfrom 1993-1997
Managing Director, Tweedy, Browne Company LLC. 4 N/A
Thomas H. ShragerAge: 59President and Director
President – SinceJuly 2009;
Director – SinceApril 2008
Managing Director, Tweedy, Browne Company LLC. 4 N/A
Robert Q. Wyckoff, Jr.Age: 64Chairman, Vice President
and Director
Chairman andVice President –
Since March2016;
Treasurer fromDecember 2002 –
March 2016;Director – Since
March 2015
Managing Director, Tweedy, Browne Company LLC. 4 N/A
1 Each director may be reached c/o Tweedy, Browne Company LLC, One Station Place, Stamford, CT 06902. The Statement of Additional Informationincludes additional information about Fund directors and is available without charge, upon request at 800-432-4789.
2 Directors serve for a term until the next annual meeting of stockholders and the election and qualification of their successors, or until their earlierremoval, resignation or death.
3 Messrs. William H. Browne, Thomas H. Shrager and Robert Q. Wyckoff, Jr. are each an “interested person” of the Company as defined in the 1940 Actbecause of their affiliation with Tweedy, Browne Company LLC, which acts as the Company’s Investment Adviser, and with AMG Distributors, Inc.,the Funds’ distributor.
II-44

TWEEDY, BROWNE FUND INC.
Other Information (Unaudited)
OFFICERS WHO ARE NOT DIRECTORS
Name, Address1, Age andPosition(s) with Company
Term ofOffice andLength of
Time Served2Principal Occupation(s)
during at Least the Past 5 Years
Roger R. de BreeAge: 54Treasurer
Since 2016 Research Analyst (since 2000) and member of the Investment Committee (since 2013), Tweedy, BrowneCompany LLC.
Elise M. DolanAge: 40Chief Compliance Officer
and Assistant Secretary
Since 2013 Chief Compliance Officer, Tweedy, Browne Fund Inc. (since 2013); General Counsel and ChiefCompliance Officer (since 2016) and Associate General Counsel (2013-2016), Tweedy, BrowneCompany LLC; Associate, Dechert LLP (2002-2013).
Patricia A. RogersAge: 50Vice President and Secretary
Since 2013 Associate General Counsel (since 2016 and 1998-2013) and General Counsel and Chief ComplianceOfficer (2014-2016), Tweedy, Browne Company LLC; Chief Compliance Officer (2004-2013) and ChiefOperating Officer (2013-2014), Tweedy, Browne Fund Inc.
John D. SpearsAge: 68Vice President
Since 1993 Managing Director, Tweedy, Browne Company LLC.
1 Each officer may be reached c/o Tweedy, Browne Company LLC, One Station Place, Stamford, CT 06902.2 Officers serve for an indefinite term until the election and qualification of their successors, or until their earlier removal, resignation or death.
II-45

TWEEDY, BROWNE FUND INC.One Station Place, Stamford, CT 06902
800-432-4789www.tweedy.com
TB-ANN-0317