investing in water and sanitation: increasing access
TRANSCRIPT

INVESTING IN WATER AND SANITATION: INCREASING ACCESS, REDUCING INEQUALITIESGLAAS 2014 findings — Highlights for the Region of the Americas

2
UN
-WAT
ER G
LOB
AL A
NAL
YSIS
AN
D A
SSES
SMEN
T O
F SA
NIT
ATIO
N A
ND
DR
INK
ING
-WAT
ER (G
LAAS
) 201
4
WHO/FWC/WSH/16.41
© World Health Organization 2016
All rights reserved. Publications of the World Health Organization are available on the WHO website (www.who.int) or can be purchased from WHO Press, World Health Organization, 20 Avenue Appia, 1211 Geneva 27, Switzerland (tel.: +41 22 791 3264; fax: +41 22 791 4857; e-mail: [email protected]).
Requests for permission to reproduce or translate WHO publications –whether for sale or for non-commercial distribution– should be addressed to WHO Press through the WHO website (www.who.int/about/licensing/copyright_form/en/index.html).
The designations employed and the presentation of the material in this publication do not imply the expression of any opinion whatsoever on the part of the World Health Organization concerning the legal status of any country, territory, city or area or of its authorities, or concerning the delimitation of its frontiers or boundaries. Dotted and dashed lines on maps represent approximate border lines for which there may not yet be full agreement.
The mention of specific companies or of certain manufacturers’ products does not imply that they are endorsed or recommended by the World Health Organization in preference to others of a similar nature that are not mentioned. Errors and omissions excepted, the names of proprietary products are distinguished by initial capital letters.
All reasonable precautions have been taken by the World Health Organization to verify the information contained in this publication. However, the published material is being distributed without warranty of any kind, either expressed or implied. The responsibility for the interpretation and use of the material lies with the reader. In no event shall the World Health Organization be liable for damages arising from its use.
Design and layout by L’IV Com Sàrl, Villars-sous-Yens, Switzerland.
GLAAS visual identifier design by Ledgard Jepson Ltd, Barnsley, South Yorkshire, England.
Printed by the WHO Document Production Services, Geneva, Switzerland.
3
GLA
AS 2
014
FIN
DIN
GS
– H
IGH
LIG
HTS
FO
R T
HE
REG
ION
OF
THE
AMER
ICAS
UN-Water and WHO gratefully acknowledge the financial support provided by the Department for International Development, United Kingdom; the Swiss Agency for Development and Cooperation; the Directorate-General for International Cooperation, the Netherlands; and the Government of Kuwait.
UN-Water and WHO would like to extend their gratitude to all those individuals and organizations that contributed to the development of the GLAAS 2014 results and report – especially those individuals who coordinated efforts and submitted information from 94 countries and 23 external support and partner agencies, acknowledged in Annex F of the GLAAS 2014 report (http://www.who.int/water_sanitation_health/glaas/2014/en/).
The preparation of this special report for the Region of the Americas involved contributions from the GLAAS team at WHO Headquarters: Nathalie André, Betsy Engebretson, Mark Hoeke, Cathy Jung, Francesco Mitis, Tara Neville, Peregrine Swann, Marina Takane, Bruce Gordon, Maria Neira and Fiona Gore; WHO Region of the Americas: Rosa María Alcayhuamán, Paulo Teixeira and Teofilo Monteiro.
Acknowledgements
4
UN
-WAT
ER G
LOB
AL A
NAL
YSIS
AN
D A
SSES
SMEN
T O
F SA
NIT
ATIO
N A
ND
DR
INK
ING
-WAT
ER (G
LAAS
) 201
4
The UN-Water Global Analysis and Assessment of Sanitation and Drinking-water (GLAAS), implemented by WHO, monitors the efforts and approaches to extend and sustain water, sanitation and hygiene (WASH) systems and services. It provides a global update on four key areas: policy framework, monitoring, human resources base, and international and national finance streams in support of drinking-water and sanitation.
Sixteen countries1 out of 35 in the WHO Region of the Americas, with a total population of 550 million, participated in the GLAAS 2013/2014 reporting cycle. Overall, access to improved drinking-water and sanitation services in the Region of the Americas is 96 and 87 per cent (in 2015), respectively. More than 110 million people gained access to an improved drinking-water source and over 400 million gained access to improved sanitation in the 2005 to 2015 time period.2 However in 2015, there were still over 100 million people without improved sanitation and over 35 million without access to an improved drinking-water source in the Region of the Americas.
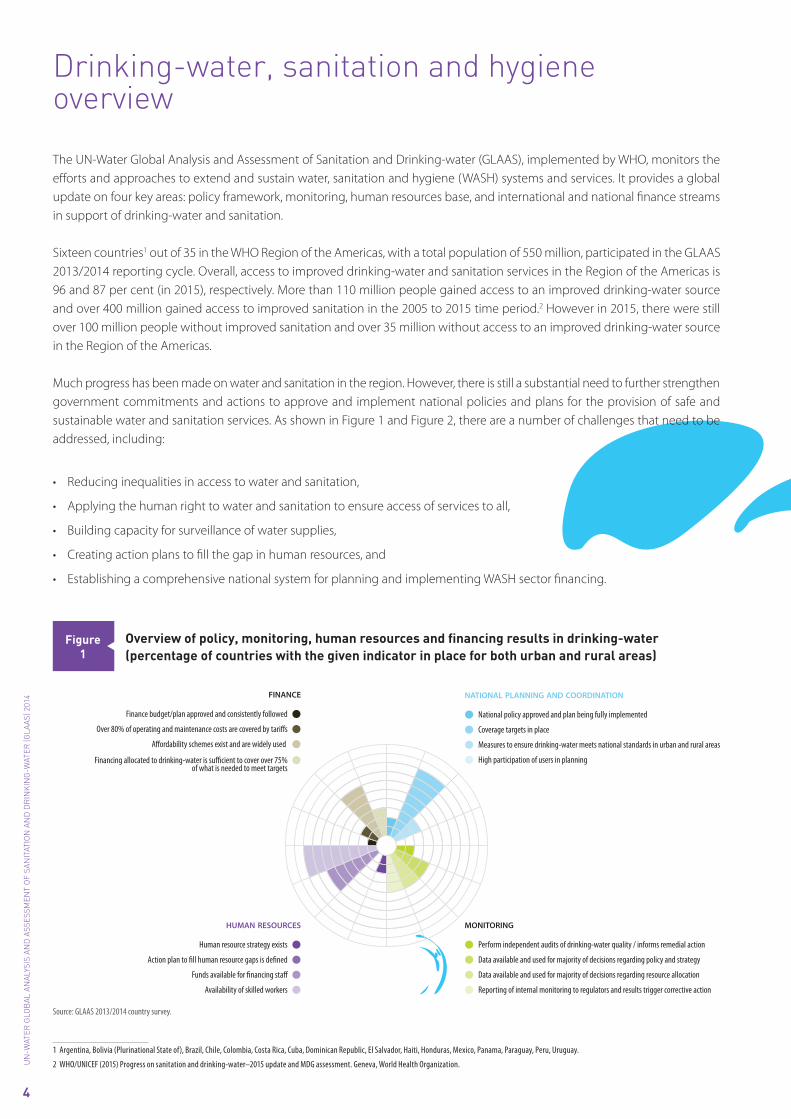
Much progress has been made on water and sanitation in the region. However, there is still a substantial need to further strengthen government commitments and actions to approve and implement national policies and plans for the provision of safe and sustainable water and sanitation services. As shown in Figure 1 and Figure 2, there are a number of challenges that need to be addressed, including:
• Reducing inequalities in access to water and sanitation,
• Applying the human right to water and sanitation to ensure access of services to all,
• Building capacity for surveillance of water supplies,
• Creating action plans to fill the gap in human resources, and
• Establishing a comprehensive national system for planning and implementing WASH sector financing.
Drinking-water, sanitation and hygiene overview
Overview of policy, monitoring, human resources and financing results in drinking-water (percentage of countries with the given indicator in place for both urban and rural areas)
Figure1
finance
Affordability schemes exist and are widely used ●
Finance budget/plan approved and consistently followed ●
Over 80% of operating and maintenance costs are covered by tariffs ●
Financing allocated to drinking-water is sufficient to cover over 75% ● of what is needed to meet targets
Funds available for financing staff ●
Availability of skilled workers ●
human resources
Human resource strategy exists ●
Action plan to fill human resource gaps is defined ●
national planning and coordination
● Measures to ensure drinking-water meets national standards in urban and rural areas
● National policy approved and plan being fully implemented
● Coverage targets in place
● High participation of users in planning
monitoring
● Data available and used for majority of decisions regarding resource allocation
● Perform independent audits of drinking-water quality / informs remedial action
● Data available and used for majority of decisions regarding policy and strategy
● Reporting of internal monitoring to regulators and results trigger corrective action
Source: GLAAS 2013/2014 country survey.
1 Argentina, Bolivia (Plurinational State of), Brazil, Chile, Colombia, Costa Rica, Cuba, Dominican Republic, El Salvador, Haiti, Honduras, Mexico, Panama, Paraguay, Peru, Uruguay.
2 WHO/UNICEF (2015) Progress on sanitation and drinking-water–2015 update and MDG assessment. Geneva, World Health Organization.

5
GLA
AS 2
014
FIN
DIN
GS
– H
IGH
LIG
HTS
FO
R T
HE
REG
ION
OF
THE
AMER
ICAS
Overview of policy, monitoring, human resources and financing results in sanitation (percentage of countries with the given indicator in place for both urban and rural areas)
Figure2
finance
Affordability schemes exist and are widely used ●
Finance budget/plan approved and consistently followed ●
Over 80% of operating and maintenance costs are covered by tariffs ●
Financing allocated to sanitation is sufficient to cover over 75% ● of what is needed to meet targets
Funds available for financing staff ●
Availability of skilled workers ●
human resources
Human resource strategy exists ●
Action plan to fill human resource gaps is defined ●
national planning and coordination
● High implementation of measures to reuse wastewater and/or septage
● National policy approved and plan being fully implemented
● Coverage targets in place
● High participation of users in planning
monitoring
● Reporting of internal monitoring to regulators and results trigger corrective action
● Data available and used for majority of decisions regarding policy and strategy
● Data available and used for majority of decisions regarding resource allocation
Source: GLAAS 2013/2014 country survey.

6
UN
-WAT
ER G
LOB
AL A
NAL
YSIS
AN
D A
SSES
SMEN
T O
F SA
NIT
ATIO
N A
ND
DR
INK
ING
-WAT
ER (G
LAAS
) 201
4
Twelve out of 16 respondent countries in the Region of the Americas reported that national plans/policies for drinking-water are in place, while ten countries indicated the adoption of similar sanitation plans/policies. Full implementation (with funding and regular review) of both drinking-water and sanitation plans/policies was reported by only three countries (Bolivia (Plurinational State of ), Cuba and Mexico), while two countries reported partial policy implementation (Colombia and Chile) (Figure 3).
Two countries (Mexico and Cuba) report full implementation of sanitation and drinking-water plans/policies in schools and in healthcare facilities. Five countries report full implementation of hygiene promotion plans nationally and in schools.
While some countries report low implementation of national policies, activities in water and sanitation may be guided through different approaches. For example, in Uruguay, the National Water Policy, which includes drinking-water and sanitation was approved and released in 2009. The policy states that the goal of politics in drinking-water and sanitation is to ensure universal access with social factors taking precedence over economic factors, as well as to meet the MDGs. The country reports that although implementation plans based on the approved national policy do not exist, there are other important plans and activities aimed at improving quality of services and access.
National policy and implementation
Three respondent countries (Bolivia (Plurinational State of), Cuba, and Mexico) in the Region of the Americas report having fully implemented urban and rural drinking-water and sanitation policies/plans with funding that are regularly reviewed.
National policy and plan implementation in drinking-water in drinking-waterFigure3
National policy and plan implementation in drinking-water
Fully implemented, urban only
Partially implemented, urban and rural
Fully implemented, rural only
Not a GLAAS survey participant
No policy or under development
Not applicable
Fully implemented, urban and rural
Policy approved, no implementation plan based on policy
Source: GLAAS 2013/2014 country survey.
Note: National policy implementation for sanitation in the Region of Americas differs from drinking-water only for Chile where no data is reported for sanitation, and in Costa Rica, which reports that no national sanitation policy has been adopted.

7
GLA
AS 2
014
FIN
DIN
GS
– H
IGH
LIG
HTS
FO
R T
HE
REG
ION
OF
THE
AMER
ICAS
Sustainable Development Goal 6 aims to “Ensure availability and sustainable management of water and sanitation for all” and places new emphasis on countries to improve services beyond basic access, which includes measures to improve quality and availability of drinking-water, and to ensure safe management of faecal waste.
DRINKING-WATER QUALITY – A moderate to high level of monitoring and enforcement measures to ensure drinking-water quality are reported to be in place in 13 out of 16 countries1 (Figure 4).
SUSTAINABILITY – Fourteen out of 16 countries report implementing measures to improve the reliability and continuity of urban water supplies. Measures to ensure the functioning of rural water supplies appear to be less robust. Seven out of 16 countries indicate a moderate to high level of implementation to ensure the sustainability of rural water services over the long-term (Figure 4).
WASTEWATER REUSE – Half of countries reported low or moderate reuse of treated wastewater or septage waste.
Improving water quality, reliability, and reuse
1 Argentina, Bolivia (Plurinational State of), Brazil, Chile, Colombia, Costa Rica, Cuba, El Salvador, Haiti, Mexico, Panama, Peru, and Uruguay.
Number of countries with specific measures to improve and sustain services and the level of implementation of these measures (16 countries)
Figure4
|0
|8
Source: GLAAS 2013/2014 country survey.
number of countries
|4
Ensure drinking-water quality meets national standards
Reuse wastewater and/or septage
Improve the reliability and continuity of urban water supplies
Keep rural water supplies functioning over the long-term
● Low level of implementation
● High level of implementation
● Some level of implementation
|6
|2
|10
|14
|12
|16

8
UN
-WAT
ER G
LOB
AL A
NAL
YSIS
AN
D A
SSES
SMEN
T O
F SA
NIT
ATIO
N A
ND
DR
INK
ING
-WAT
ER (G
LAAS
) 201
4
TYPES OF SERVICE PROVIDERS
Twelve out of 14 countries report that a majority of the urban population is served by a formal drinking-water service provider (Figures 5 and 6). However, Argentina, Honduras, and Paraguay indicated that a significant portion of urban populations (nearly 18 million people) obtain drinking-water through informal and community service providers. These can include point sources such as pumps, water kiosks and protected springs or wells owned or operated by communities.
1 Several countries reported population breakdowns by service provision that were less than total UN population estimates (for urban areas), thus individual country percentages may not sum to 100%.
Breakdown of urban drinking-water service by provider type (data available for 14 countries)1 Figure5
Source: GLAAS 2013/2014 country survey.
% O
F U
RBA
N P
OPU
LATI
ON
SER
VED
100 —
80 —
60 —
40 —
20 —
0 —
ARGENTINA
Formal urban water Community urban water Informal urban water Self-supply urban water
BOLIVIA(PLURINATIONAL
STATE OF)
BRAZIL CHILE COLOMBIA COSTA RICA CUBA EL SALVADOR HONDURAS MEXICO PANAMA PARAGUAY PERU URUGUAY
Formal service providers serve a majority of the population in all WASH subsectors (Figure 6)
Breakdown of service provider types (14 countries) Figure6
Urban sanitation Rural sanitation Urban drinking-water Rural drinking-water
Source: GLAAS 2013/2014 country survey.
100% —
80% —
60% —
40% —
20% —
0% —
FORMAL COMMUNITY INFORMAL SELF-SUPPLY
90% —
70% —
50% —
30% —
10% —

9
GLA
AS 2
014
FIN
DIN
GS
– H
IGH
LIG
HTS
FO
R T
HE
REG
ION
OF
THE
AMER
ICAS
HUMAN RIGHTS AND EQUITY MEASURES
Eleven out of 16 countries recognize the human right to water and sanitation, and all countries have established one or more equity measures to reach disadvantaged populations, such as those living in informal settlements and in hard to reach areas (e.g. 14 out of 16 countries have established policies for informal settlements and slums, and 10 out of 16 countries have established policies for remote or hard to reach areas). For example, the Mexican Government, through Conagua, implements the Program for Sustainable Potable Water and Sanitation in Rural Communities, which references indigenous groups in its operating rules.
A majority of the respondent countries have legislation in place that outlines user participation in WASH planning. The extent of Rural drinking-water remains limited, although a minority of countries report having a high level of user-involvement in WASH planning (Table 1).
Indicators of policies and measures to ensure equity in WASH services by countryTable1
COUNTRY
Human right recognized in law
Specific measures are included in
national plan to reach disadvantaged groups
Participation procedures are defined
in law or policy*Extent to which service users participate
in planning
Existence of a public complaint mechanism for population
served
Drinking-water Sanitation
Drinking-water and sanitation
Drinking-water and sanitation
Drinking-water Sanitation Drinking-water Sanitation Drinking-water Sanitation
National National National National National National Urban Rural Urban Rural Urban Rural Urban Rural
Populations living in slums or informal
settlements
Populations living in
remote or hard to reach
areas
Argentina Yes Yes Yes Yes Yes Yes Low Low Low Low — —Bolivia (Plurinational State of) Yes Yes Yes Yes Yes Yes Moderate High Moderate High — —Brazil Yes Yes Yes Yes Yes Yes Moderate Moderate Moderate Moderate
Chile No No No Yes No/Yes* No — Moderate — —
Colombia Yes Yes Yes No Yes Yes Moderate Low Moderate Low
Costa Rica Yes Yes Yes No Yes No Low Low Low Low
Cuba Yes Yes Yes Yes Yes Yes Moderate Moderate Moderate Moderate
Dominican Republic Yes Yes Yes Yes No No — — — — — — — —El Salvador No No Yes Yes Yes No/Yes* Low High — Moderate
Haiti Yes Yes Yes No Yes Yes Moderate Low Moderate Low — — — —Honduras Yes Yes Yes No Yes Yes Low High Low Low
Mexico Yes Yes No Yes Yes Yes Moderate Moderate Moderate Moderate
Panama No No Yes Yes Yes Yes Low Moderate Low Moderate — —Paraguay Yes No Yes Yes Yes Yes Moderate Moderate Moderate Low
Peru No No Yes No Yes Yes Moderate Moderate Moderate Moderate — —Uruguay Yes Yes Yes No Yes Yes Low Low Low Low —
* No difference between urban and rural, except as noted with an asterisk(*) where response is for urban/rural.. Effective complaint mechanisms exist for most (more than 50% of population served). Effective complaint mechanisms exist for some (between 25–50% of population served). Effective complaint mechanisms exist for few (less than 25% of population served).
Source: GLAAS 2013/2014 country survey.

10
UN
-WAT
ER G
LOB
AL A
NAL
YSIS
AN
D A
SSES
SMEN
T O
F SA
NIT
ATIO
N A
ND
DR
INK
ING
-WAT
ER (G
LAAS
) 201
4
Oversight and operational monitoring of drinking-water and sanitation services (e.g. quality, cost recovery, line breaks, affordability, costs) are conducted to ensure the continuity of service, inform decision-making for implementing improvements, provide accountability to the public, and ensure services meet expected standards.
In 75% of responding countries in the Region of the Americas (12 out of 16), formal drinking-water service providers in urban areas share the results of their internal (operational) monitoring to regulatory authorities for comparison against required service standards and are subject to corrective action as needed. However, there is no well-established mechanism of reporting for community and informal service providers (Figure 7).
Service standards for drinking-water monitored by service providers in the Region of the Americas include quality (e.g. conforming to National Drinking-Water Quality Standards) and continuity of service; however, the exact requirements can vary between countries. For sanitation, service quality indicators include percentage of wastewater collected and treated.
Overall, more countries in Region of the Americas have developed a full cycle of monitoring, reporting and corrective action for drinking-water than for sanitation (Figure 7).
Monitoring of drinking-water and sanitation
Percentage of countries in which service providers report monitoring against service standard (16 countries)1
Figure7
Source: GLAAS 2013/2014 country survey.
% C
OU
NTR
IES
WIT
H R
ESU
LTS
REPO
RTED
AN
D U
SED
FO
R C
ORR
ECTI
VE A
CTI
ON
S
70 —
10 —
30 —
50 —
60 —● Community service providers
● Urban formal service providers
● Rural formal service providers
● Informal service providers
20 —
40 —
SANITATION DRINKING-WATER
0 —
1 Examples of service provision types can be found in the country survey guidance note at the following link http://www.who.int/water_sanitation_health/glaas/2014/en/
80 —

11
GLA
AS 2
014
FIN
DIN
GS
– H
IGH
LIG
HTS
FO
R T
HE
REG
ION
OF
THE
AMER
ICAS
USE OF MONITORING DATA FOR RESOURCE ALLOCATION
Six out of 15 countries report that they collect and analyse data through a management information system and regularly use the results for resource allocation in both sanitation and drinking-water (Figure 8).
Data availability for decision-making in resource allocation (15 countries, drinking-water; 14 countries, sanitation)
Figure8
Source: GLAAS 2013/2014 country survey.
10% —
30% —
● Sanitation
● Drinking-water
20% —
40% —
DATA USED FOR A MAJORITY OF DECISIONS
DATA USED FOR A MINORITY OF DECISIONS
0 —
50% —
5% —
25% —
45% —
15% —
35% —
PARTIAL DATA COLLECTED BUT NOT USED
LIMITED DATA COLLECTION

12
UN
-WAT
ER G
LOB
AL A
NAL
YSIS
AN
D A
SSES
SMEN
T O
F SA
NIT
ATIO
N A
ND
DR
INK
ING
-WAT
ER (G
LAAS
) 201
4
COMMUNICATING PERFORMANCE DATA TO THE PUBLIC
Performance reviews of formal service providers in urban areas are made publicly available in most respondent countries (e.g. 11 out of 16 countries for drinking-water, and 8 out of 16 countries for sanitation). Only two countries indicate that performance reviews of rural service providers are publicly available (Costa Rica and Cuba).
Most countries in the Region of the Americas have established some performance indicators for water and sanitation.
Though 70% of countries reporting from the Region of the Americas have established performance indicators for water and sanitation, less than one-third report to be using a comprehensive set of performance indicators for either drinking-water supply or sanitation services (Table 2).
Several countries have developed performance indicators for hygiene promotion, however, only two are tracking indicators with established data (Colombia and Cuba). The most common indicators for hygiene promotion coverage include 1) the number of municipalities with hygiene promotion programs and 2) the percentage of schools and health facilities promoting hygiene practices.
Performance indicators used to track progress (16 countries)Table2
Source: GLAAS 2013/2014 country survey.
CATEGORY TYPE
PERCENTAGE OF COUNTRIES TRACKING INDICATORS AGAINST
ESTABLISHED BASELINE
MOST COMMONLY CITED INDICATORSDrinking-water Sanitation
FINANCIAL Expenditure 50% 25% Budget execution rate (% of ratio spent vs. allocated), % GDP
Cost-recovery 31% 38% Operating ratio (revenue vs. costs), collection of costs (recovery of billing)
Cost-effectiveness 44% 19% Cost/unit volume produced, operation and maintenance costs
EQUITY Equitable service coverage 44% 38% Urban/rural access coverage, access coverage by geographical area
Affordability 19% 25% Delinquency (months)
SERVICE PROVIDERINDICATORS
Service quality 44% 44% Response time in requesting service (connections, correction of blockages), etc. quality of water
Functionality of systems 25% 19% Pumping capacity (sanitation)
Institutional effectiveness 19% 38% Non-revenue water, total staff per 1000 connections and/or per billed volume, proportion of wastewater treated
Wastewater reuse Not applicable 25% % of treated wastewater reused

13
GLA
AS 2
014
FIN
DIN
GS
– H
IGH
LIG
HTS
FO
R T
HE
REG
ION
OF
THE
AMER
ICAS
Even where national strategies are well developed, government institutions are well coordinated and sufficient financing is available, progress on sanitation and drinking-water relies on adequately trained, capable staff and a work environment conducive to effective outputs.
Several countries in the Region of the Americas report a shortage of skilled workers (e.g. engineers, chemists, mechanics, hygienists, etc.) impacting a range of WASH activities including planning, design, quality of construction, and operations and maintenance. Countries surveyed cited several problem areas in human resource development, including:
1) Insufficient educational training specializing in water and sanitation,
2) Low wages limiting ability to obtain qualified staff,
3) Regional imbalances in the location of labor and training institutions, and
4) Public and state service provider leadership turnover due to changing political influences.
As a result of these constraints, the sector’s ability to recruit and retain skilled workers is limited.
Human resources
Most surveyed countries in the Region of the Americas cited moderate to severe WASH human resource constraints, especially due to insufficient education and training opportunities (Figure 9).
Despite staff shortages, only one-third of countries surveyed in the Region of the Americas have an overall strategy to develop and manage human resources for drinking-water and sanitation, and only three of 16 respondent countries have a human resources strategy for hygiene promotion.
Constraints to WASH human resources for sanitationFigure9
|0
|40
Source: GLAAS 2013/2014 country survey.
percent of countries (out of 16)
|20
Insufficient educational organizations to meet demand
Salaries and benefits
Recruitment practices
Preference to not live/work in rural areas
● Severe constraint
● Moderate constraint
|30
|10
|50
Preference to work in other sectors
Lack of skilled graduates
Emigration of skilled workers
|80
|60
|100
|90
|70

14
UN
-WAT
ER G
LOB
AL A
NAL
YSIS
AN
D A
SSES
SMEN
T O
F SA
NIT
ATIO
N A
ND
DR
INK
ING
-WAT
ER (G
LAAS
) 201
4
Extending and sustaining water and sanitation programmes, and infrastructure, especially in the context of reducing inequalities, requires adequate funds and effective financial management.
Half of respondent countries indicated they have an approved financing plan/budget for the WASH sector. However, only three of 16 respondent countries reported that it is consistently followed for urban drinking-water and sanitation (and only two for rural drinking-water and sanitation). Limited data were available from the region on WASH budgets and expenditure, with eight countries providing data on national WASH budgets and six countries providing data on WASH expenditure (Table 3).
Financing
WASH expenditure data for ten countries Table3
Source: GLAAS 2013/2014 country survey; 2014 TrackFin pilot assessment (indicated by asterisk*).
COUNTRY
REPORTED NATIONAL WASH BUDGET
(US$ MILLION)
REPORTED TOTAL WASH EXPENDITURE(US$ MILLION)
Bolivia (Plurinational State of) 163
Brazil* 11 700 19 605
Chile 132
Colombia 393 6205
Costa Rica 275
El Salvador 295
Honduras 46
Panama 11 556
Peru 554
Uruguay 598 557
The proportion of WASH expenditure as a percentage of GDP could be estimated for the seven countries providing total WASH expenditure (Figure 10).
1 In Uruguay, government-coordinated expenditure is low as more than 80% of expenditure is from household contributions.
Source: GLAAS 2013/2014 country survey; 2014 TrackFin pilot assessment (indicated by asterisk*).
Proportion of government-coordinated expenditure on WASH as percentage of GDP (7 countries)1 Figure10
|0
government-coordinated expenditure on wash as a % of gdp
|0.5
|1.5
|2.0
COLOMBIA 0.35
BRAZIL* 0.11
CUBA 0.02
|1.0
BOLIVIA (PLURINATIONAL STATE OF) 0.64
EL SALVADOR 0.28
URUGUAY 0.00
PANAMA 1.34
15
GLA
AS 2
014
FIN
DIN
GS
– H
IGH
LIG
HTS
FO
R T
HE
REG
ION
OF
THE
AMER
ICAS
A review of expenditure breakdowns can indicate potential issues with targeting of financial resources. However, only limited data were available for countries in the Region of the Americas.
WATER VERSUS SANITATION – The disaggregation of expenditure data for water and sanitation was available for five countries. The percentage of expenditure for sanitation of the total WASH expenditure ranged from 6% (Panama) to 41% (the Plurinational State of Bolivia), with a median value of 25%.
URBAN VERSUS RURAL – The disaggregation of expenditure data for urban and rural areas was available for two countries. The estimated expenditure for rural areas of the total WASH expenditure was obtained for the Plurinational State of Bolivia (34%) and for Brazil (5%).
The lack of data on financing highlights the substantial need in many countries to establish a comprehensive system for planning, fund allocation and tracking WASH sector financing.
Data on expenditure allocations are largely unavailable.
Overall financing is reported to be insufficient to meet targets, especially in rural areas.
From the information available, eight of 12 country respondents indicated that sufficient financing is available to meet urban drinking-water targets, and only five countries indicated that sufficient finance is available for urban sanitation targets. Insufficient financing is a more significant issue in rural areas, with fewer than five countries indicating sufficient finance for rural drinking-water and sanitation targets.
There is also an indication that basic costs for sustaining and maintaining services are not being fully met by tariffs. While many respondent countries indicated that users are expected to bear the costs of investment, operation and maintenance, only seven of 15 respondent countries reported that tariffs cover over 80% of operating and maintenance costs for urban drinking-water. Government subsidies are most often cited as the means for covering the operational finance gap. In Colombia, it is also noted that high-income users pay higher tariffs in order to subsidize low-income users.
16
UN
-WAT
ER G
LOB
AL A
NAL
YSIS
AN
D A
SSES
SMEN
T O
F SA
NIT
ATIO
N A
ND
DR
INK
ING
-WAT
ER (G
LAAS
) 201
4
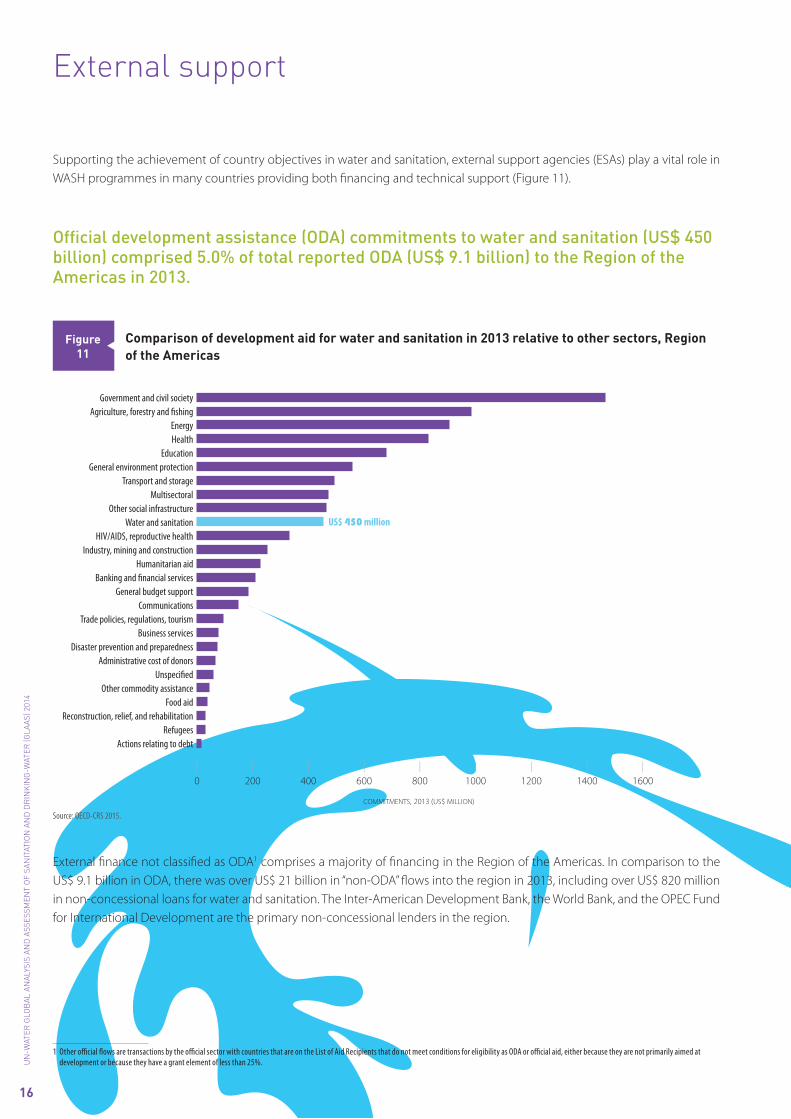
Supporting the achievement of country objectives in water and sanitation, external support agencies (ESAs) play a vital role in WASH programmes in many countries providing both financing and technical support (Figure 11).
External support
Official development assistance (ODA) commitments to water and sanitation (US$ 450 billion) comprised 5.0% of total reported ODA (US$ 9.1 billion) to the Region of the Americas in 2013.
Comparison of development aid for water and sanitation in 2013 relative to other sectors, Region of the Americas
Figure11
Source: OECD-CRS 2015.
Government and civil societyAgriculture, forestry and fishing
EnergyHealth
EducationGeneral environment protection
Transport and storageMultisectoral
Other social infrastructureWater and sanitation
HIV/AIDS, reproductive healthIndustry, mining and construction
Humanitarian aidBanking and financial services
General budget supportCommunications
Trade policies, regulations, tourismBusiness services
Disaster prevention and preparednessAdministrative cost of donors
UnspecifiedOther commodity assistance
Food aidReconstruction, relief, and rehabilitation
|1200
|0
|600
commitments, 2013 (us$ million)
|800
|200
|400
|1000
US$ 450 million
|1400
|1600
RefugeesActions relating to debt
External finance not classified as ODA1 comprises a majority of financing in the Region of the Americas. In comparison to the US$ 9.1 billion in ODA, there was over US$ 21 billion in “non-ODA” flows into the region in 2013, including over US$ 820 million in non-concessional loans for water and sanitation. The Inter-American Development Bank, the World Bank, and the OPEC Fund for International Development are the primary non-concessional lenders in the region.
1 Other official flows are transactions by the official sector with countries that are on the List of Aid Recipients that do not meet conditions for eligibility as ODA or official aid, either because they are not primarily aimed at development or because they have a grant element of less than 25%.

17
GLA
AS 2
014
FIN
DIN
GS
– H
IGH
LIG
HTS
FO
R T
HE
REG
ION
OF
THE
AMER
ICAS
External support agencies use a number of criteria to select countries in which to allocate development aid for sanitation and drinking-water. Needs based on poverty or coverage levels, established in-country presence, and relevance of contributions are the most frequently cited criteria used by donors. Other targeting criteria used include existence of strategic dialogue, strength of sector plans/budgets, and quality of governance, among others. Figure 12 shows how coverage levels relate to aid levels in the Region of the Americas.
WASH coverage is a major factor in prioritizing/targeting of WASH aid.
Comparison of unserved populations and WASH aid to the Region of the Americas, by countryFigure12
UNSERVED POPULATION(MILLIONS)
AVERAGE ANNUAL ODA COMMITMENT(2011–2013, US$ MILLIONS)
0.5
0.0
4.3
2.0
0.6
19.0
15.4
5.8
26.4
0.9
10.5
0.3
21.5
19.6
4.3
26.9
118.9
4.4
117.2
21.0
50.6
32.3
311.0
0 50 100 150 200 250 300 350
Uruguay
Suriname
Guyana
Trinidad and Tobago
Chile
Costa Rica
Jamaica
Paraguay
Panama
Cuba
Argentina
El Salvador
Venezuela (BolivarianRepublic of)
Honduras
Nicaragua
Dominican Republic
Ecuador
Bolivia (Plurinational Stateof)
Guatemala
Peru
Haiti
Colombia
Mexico
Brazil
0.1
0.1
0.1
0.1
0.3
0.5
0.8
1.0
0.8
1.5
1.6
1.5
2.0
1.7
2.5
5.5
5.9
7.4
7.7
9.4
18.6
35.1
0.0
0.0
0.0
0.1
0.2
0.1
0.2
0.1
0.2
0.6
0.4
0.4
2.2
0.7
0.8
1.6
2.1
1.1
1.2
4.1
4.5
4.3
4.9
3.8
010203040
Uruguay
Suriname
Guyana
Trinidad and Tobago
Chile
Costa Rica
Jamaica
Paraguay
Panama
Cuba
Argentina
El Salvador
Venezuela (Bolivarian Republic of)
Honduras
Nicaragua
Dominican Republic
Ecuador
Bolivia (Plurinational State of)
Guatemala
Peru
Haiti
Colombia
Mexico
Brazil
Average annual ODA commitment (2011-2013, US$ millions)
Drinking-water
Sanitation Aid for water and sanitation
Unserved population(2015, millions)
Source: OECD-CRS 2015; WHO/UNICEF, 2015.

0 50 100 150 200 250 300 350 400
GGGI
Australia
United Kingdom
Austria
IFAD
Bill & Melinda Gates Foundation
Netherlands
Italy
Norway
Nordic Dev.Fund
Luxembourg
Belgium
United States
Canada
Sweden
Kuwait (KFAED)
IDA
GEF
Korea
EU Institutions
OFID
Switzerland
Spain
France
IDB Sp.Fund
Germany
Japan
Average annual commitments to sanitation and drinking-water, 2011–2013 (US$ millions, constant 2013 $US)
Basic systemsLarge systemsOther
050100150200250300350400
GGGI Australia United Kingdom Austria IFAD Bill & Melinda Gates Foundation Netherlands Italy Norway Nordic Dev.Fund Luxembourg Belgium United States Canada Sweden Kuwait (KFAED) IDA GEF Republic of Korea EU Institutions OFID Switzerland Spain France IDB Sp.Fund Germany Japan
Average annual commitments to sanitation and drinking-water, 2011–2013 (US$ millions, constant 2013 $US)
ODA GrantsODA LoansEquity Investment
18
UN
-WAT
ER G
LOB
AL A
NAL
YSIS
AN
D A
SSES
SMEN
T O
F SA
NIT
ATIO
N A
ND
DR
INK
ING
-WAT
ER (G
LAAS
) 201
4
There were eleven ESAs with water and sanitation ODA commitments that each exceeded an average of US$10 million per year from 2011 to 2013. The majority of aid for water and sanitation (60%) is targeted towards large systems, while 13% of development aid is targeted towards basic systems. Aid for water resources, water policy and administration comprised the remaining 27% of aid for water and sanitation. Seventy-two per cent of aid is in the form of concessional loans1 and 28% of aid is in the form of grants (Figure 13).
Important contributors to the Region of the Americas, in terms of ODA aid amounts include Japan, Germany, France, Spain, and the Inter-American Development Bank (IDB).
Breakdown of aid commitments for sanitation and drinking-water to the Region of the Americas by ESA, among grants and loans, and purpose types, 2011–2013 annual average
Figure13
1 For a loan to qualify as ODA, it must among other things, be concessional in character and must convey a grant element of at least 25 per cent. The grant element test is a mathematical calculation based on the terms of repayment of a loan (e.g. grace period, maturity and interest) and a discount rate of 10 per cent.
Note: Chart represents ESAs with annual contributions averaging over US$ 100,000.GEF, Global Environment Facility; GGGI, Global Green Growth Institute; IDA, International Development Association, World Bank; IDB, Inter-American Development Bank; IFAD, International Fund for Agricultural Development; OFID, OPEC Fund for International Development; OPEC, Organization of the Petroleum Exporting Countries.
Source: OECD-CRS, 2015.


http://www.who.int/water_sanitation_health/glaas/en/contact email: [email protected]
WHO/FWC/WSH/16.41