investing in delivery: how we can respond to the pressures ... arup research report investing... ·...
TRANSCRIPT

0
Investing in Delivery: How we can respond to the pressures on local authority
planning
RTPI Research Report no.10 October 2015

1
INVESTING IN DELIVERY: HOW WE CAN RESPOND TO THE PRESSURES ON LOCAL AUTHORITY PLANNING
Executive Summary Introduction This report has been prepared by Arup on behalf of the Royal Town Planning Institute (RTPI) North West region. Arup was commissioned to investigate the resourcing of local planning authorities in the North West, whether a lack of resources is impacting on growth and development, and what can be done to respond to these pressures. This report presents the findings from the research, considers whether a lack of resourcing in planning is undermining economic recovery across the region, and suggests practical ways in which local planning authorities and others can respond to these pressures to ensure future growth and development. The research included a literature and data analysis, a survey sent to all North West local planning authorities, 19 telephone and face to face interviews and two focus group sessions with public and private sector participants. Over 40 organisations participated in the research. Who should read this report? This report should be of interest to anyone with an involvement in planning for economic growth and development, and the resourcing and status of local authority planning more broadly, in particular local authority chief executives, policy teams and planners, central and local government policymakers, developers, planning consultants, and researchers.

2
Key messages for policy and practice The UK Government has set out clearly its priorities for planning in England, focusing on the delivery of housing and development, and increasing the coverage of local plans. However, analysis conducted for this research suggests that there have been significant reductions in local planning authority budgets and staffing since 2010 – including a decrease on average of 37 per cent in planning policy staff and 27 per cent in development management staff. These reductions have been disproportionate to those in other local authority services, and are now impacting on delivery and development. While there are some good examples of local authorities that continue to invest in their planning services, overall it is the case that reductions in local planning authorities’ budgets have resulted in increasing difficulties in both the public and private sectors, with the latter frustrated by the decline in local authority planning services in some places. Although the time taken to determine applications are often still good, there are increasingly delays and uncertainty in receiving pre-application advice, S106 agreements and discharge of conditions, resulting in delays bringing forward development. There are also cases where the lack of planning policy means it is too commercially risky for developers to prepare the planning applications they had intended. The lack of proactive plan-making is likely to result in fewer projects coming forward, particularly public-private partnerships, often with a regeneration agenda. Local planning authorities have responded to these pressures in varying ways. Based on this research, they can be broadly characterised as either ‘striving’, ‘surviving’ or ‘struggling’ (see further below). In the majority of cases local planning services are surviving on the “goodwill and professional integrity” of officers, but this may not be sustainable. The danger is that further reductions in budgets could exacerbate a cycle of decline in more local planning authorities, pushing more planning services into the ‘surviving’ and ‘struggling’ categories, and further impacting on delivery and development. At the same time, it is crucial to recognize that planning services are an increasingly significant source of income for authorities, including through the New Homes Bonus. However, this positive contribution is often not reflected in the funding provided to planning services. A range of measures are required to enable ‘striving’ authorities to maintain and even improve high standards of delivery, support ‘surviving’ authorities who have the potential to perform better, and focus resources on ‘struggling’ authorities to address and reverse the causes of decline. This would help to ensure that planning services are put on a more stable footing, local development is promoted, and the Government’s priorities are realised. Most obviously, ensuring effective and efficient public sector planning that supports delivery and development, including reversing the cycle of decline in some authorities, will require greater reinvestment in public sector planning services alongside the continuation and further development of strong relationships between the public and private sector. This could either be done directly, through local authorities prioritising reinvestment from sources of planning income, or indirectly, through drawing on support from organisations such as the Planning Advisory Service and the RTPI. Greater flexibility in responding to varying workload demands is also needed. This could be achieved through a benchmarking approach to guide appropriate resourcing combined with the increased use of Planning Performance Agreements (PPAs) and informal agreements to help resourcing, communication and thereby increased certainty for developers. The use of these measures as part of a positive approach towards planning is essential for the effective delivery of planning services and for the development industry to fulfil its economic potential.

3
Key findings Resource changes: Public sector planning staff shortages have been an ongoing issue over the last 10 years. Since 2010 there have been significant reductions in planning staff, with this survey identifying an average reduction of 37 per cent in planning policy staff and 27 per cent in development management staff between 2010 and 2015. In the last year in particular there has been a move towards use of mandatory redundancy packages, combined with an increase in the recruitment of temporary staff. The overall reduction in recruitment means that public sector planning officers are having to extend their roles to fill the gaps caused by staff cuts. Evidence from interviews and focus groups shows this has affected customer service and the quality of decision-making, as planning officers are increasingly tied-up with process related matters. The loss of between 20-30% of managerial staff has also impacted member engagement and proactive decision-making. Budget and income changes: This survey also suggests that between 2009/10 and 2013/14 the average net expenditure for development management decreased by 27% and decreased for planning policy by 18%. Public sector planning services have been left to manage increasingly constrained and challenging budgets which often do not reflect the true cost of service delivery. Despite budget reductions, planning services continue to generate significant levels of income. In terms of the New Homes Bonus alone, North West sub-regions received an average of £16 million in 2014/15, with the highest amount received by Greater Manchester authorities. Evidence from the focus groups and interviews conducted for this research shows that this income is not ring-fenced for reinvestment in planning services and is absorbed into overall council budgets. Planning services are therefore a significant income source for local authorities, but are not receiving the benefits themselves. Performance: Local planning authorities have consistently achieved government targets for the determination of applications within 8 and 13 weeks, however this data does not take account of time taken at pre-application and post-determination stages with the end to end application process taking up to two years in some cases. In discussions with developers in this research, concerns were raised around the varied quality of pre-application advice and the time taken to agree Section 106 agreements. Policy performance and a lack of proactive planning were also highlighted, with policy vacuums created by out-of-date policies and the challenge of delays to the submission and adoption of local plans. Another key consideration is the impact of the quality of decision-making and associated delays on the delivery of development. The complexity of delivering development means it is difficult to conclude that delays have been caused directly by reductions in public sector resources. Evidence from the interviews conducted for this research suggest that delays in local plan preparation and the progression of planning applications increases costs and financial risk for the private sector, which in turn impacts on delivery. One private sector developer stated: “In the North West not many areas have an up to date local plan in place or a five year housing supply. There is effectively a hiatus in housing delivery and a land supply crisis. Industry is being prevented from acting and there could be much more development coming forward.”

4
This study explored perceptions around local planning authority performance issues, particularly with regard to ‘planning by appeal’ and complaints relating to development management performance. The survey found that in comparison to the average number of application submitted over the last 10 years, the average number of appeals has remained around 2%. In terms of complaints raised to the Ombudsman, around 55 per cent related to development management, however only 9% of lodged appeals were upheld following formal investigation. Evidence from the focus groups and interviews found that officers are working longer hours to compensate for a loss of staff, with an increasing reliance on their “good will and professional integrity” (to quote one respondent to the research). This research suggests that in terms of resourcing and performance there are broadly three types of local planning authority. These can be characterised as either ‘striving’, ‘surviving’ or ‘struggling’:
Striving authorities typically have an up-to-date local plan and five year housing land supply, process applications within required timescales and have productive and timely pre-application discussions. The authority is proactive in engaging with others in bringing forward development, including in neighbourhood planning. It has strong planning leadership with regular positive engagement with members and the chief executive, good staff morale and an innovative culture. There is a strategic approach to corporate management and resource sharing.
Surviving authorities typically process applications just within required timescales but may be slow in delivering other development management services. A core strategy may be in place but policymaking can be limited or slow. Planning is a lower priority for members and the chief executive. Staff morale can be poor, with services dependent on the goodwill of officers, considerable out-of-hours working, and non-specialist staff forced to deal with specialist matters (for example, conservation, urban design).
Struggling authorities are seen as providing a poorer service by the development community, with a high proportion of appeals. There is no up-to-date local plan, and a lack of proactive plan-making and engagement with the development community. Planning managers have limited experience, and there is a weak relationship between senior officers and members. Resources are increasingly focused on appeals and challenged examinations rather than service improvement, potentially resulting in a spiral of decline. There is very low staff morale, with too few staff to maintain service delivery, often resulting in high staff turnover, sickness rates and difficulty in recruiting.
Section 6 of this report sets out the key characteristics for each of these types of authority. The overall aim of the recommendations set out in this report is to establish a positive cycle of reinvestment in public sector planning in order to drive housing delivery and development, and better place-making more broadly. This should ensure that ‘striving’ authorities have the means to maintain and even improve high standards of delivery, ‘surviving’ authorities have the support to perform better, and ‘struggling’ authorities can focus resources on reversing the cycle of decline – in short, that all authorities can make progress towards becoming ‘striving’ public sector planning services.

5
Practice changes: This study also explored a range of solutions and practice changes to the pressures being experienced by local planning authorities. These include: collaboration and resource sharing either with neighbouring authorities or private sector consultants; the use of alternative service delivery models; and PPAs to address concerns over timescales and quality. The research also identified the need to offer greater protection for and reinvestment in planning service budgets. Changes introduced by local planning authorities to address performance and quality issues mainly related to procedural matters including recognising the value of IT systems, the use of standardised processes and the importance of continuity through the application process. These types of changes are considered further below. Recommendations The recommendations set out below are directed at three main audiences: central government; local authority leaders; and local authority planning departments (with support from professional bodies and government agencies). Resourcing and budgets: Prioritising reinvestment in planning services using income from the New Homes Bonus
Council leaders should recognise the value of planning to local economies, and so the importance of reinvesting more of the income generated by planning, most notably from the New Homes Bonus, back into planning services. This would lead to a cycle of positive planning and income generation, enabling resources to support the adoption of local plans, leading to greater development certainty and more efficient development management services, in turn securing further planning income for reinvestment in services.
In addition to the New Homes Bonus, this could include regularly reviewing pre-application and Section 106 agreement charges to ensure that costs are covered. Any increases in charges need to be linked to the robust identification of the full end-to-end costs involved in processing, determining and discharging all types of applications, and any required improvements in services to meet applicants’ needs.
Government and organisations such as the RTPI should emphasise the link between revenue sources such as the New Homes Bonus and the work of local planning services. Government should also emphasise how local authorities could further the purposes of the New Homes Bonus by reinvesting this additional revenue back into planning, regeneration, economic development and related services.
Performance: Using good practice guidance to support local planning authorities
More local authorities should take advantage of the information and support available from organisations such as the Planning Advisory Service (PAS), in order to improve performance and delivery and to address any gaps in specialist advice or resourcing. PAS in particular can provide full service reviews (including benchmarking their performance), support delivery against PPAs and advise on local plan delivery. In addition, ATLAS can support local authorities dealing with complex large scale housing-led projects.

6
Adopting a pragmatic and flexible approach to procurement
Local authorities should approach the procurement of additional resource and specialist input into planning services in a pragmatic and flexible way, in order to adapt more quickly to changing demands on services. Government and other organisations such as the RTPI and PAS could do more to advise local authorities in this regard.
Identifying potential resource sharing arrangements
To ensure flexibility and manage peaks in workload there is the potential for resource sharing within local planning authorities, across neighbouring authorities, with statutory consultees, specialist staff and via the use of private sector staff. This can be achieved through the identification of areas of potential collaboration, particularly to address the loss of specialist staff in areas such as conservation and design.
Identifying more opportunities for Planning Performance Agreements
Planning Performance Agreements (PPAs) can be adapted to suit the scale of schemes and offer greater flexibility to both local planning authorities and developers, as they set expectations out of the standard 8 and 13 week determination periods. Whilst it is important to adequately resource PPAs, there is the potential to establish a PPA ‘light’, incorporating a scaled-back standardised PPA which could be used to determine less complex, medium-scale applications.

7
Contents 1 Introduction 10 1.1 Context 10 1.2 Methodology 11 1.3 The report 12 1.4 Acknowledgements 12 2 Literature review 13 2.1 Introduction 13 2.2 Planning resources 13 2.3 Budget and income changes 14 2.4 Planning service performance 18 3 Baseline data analysis 22 3.1 Introduction 22 3.2 Planning resources 22 3.3 Budget and income changes 26 3.4 Income 32 3.5 Performance 34 4 Local planning authority survey analysis 42 4.1 Introduction 42 4.2 Analysis approach 43 4.3 Resources 43 4.4 Budget and income 52 4.5 Performance 57 4.6 Practice changes 60 5 Stakeholder engagement 62 5.1 Introduction 62 5.2 Resources 63 5.3 Budget and income 66 5.4 Performance 68 5.5 Practice changes 73 6 Conclusions and recommendations 80 6.1 Introduction 80 6.2 Key findings 80 6.3 Research question responses 87 6.4 Recommendations – Asks and offers 89 Tables Table 4-1: The number of structural and corporate changes respondents had 52 undergone in the specified timeframes Table 4-2: Average number of applications submitted/received and the 58 average number of planning appeals Table 4-3: Average number of planning related complaints lodged with 60 ombudsman and the percentage of these complaints concerned with development management, formally investigated and upheld Table 4-4: Revisions in services experienced in the specified timeframes 61

8
Table 6-1: Percentage change in the average number of FTE staff in 81 development management and planning policy teams Figures Figure 2-1: Service spending as proportions of overall budget 14 Figure 2-2: Reductions to public sector services 14 Figure 3-1: Total planning and development staff for 2005/06 and 2009/10 22 Figure 3-2: Percentage of planning policy staff in planning and development 24 for 2005/06 and 2009/10 Figure 3-3: Percentage of development management staff in planning 25 and development for 2005/06 and 2009/10 Figure 3-4: Average staff numbers between 2005/06 and 2009/10 25 for planning and development services, planning policy and development management Figure 3-5: Total net expenditure for planning and development services 27 Figure 3-6: Average total net expenditure for planning and development services 28 Figure 3-7: Net expenditure on planning policy (actuals) 29 Figure 3-8: Average net expenditure on planning policy (actuals) 29 Figure 3-9: Net expenditure on development management (actuals) 30 Figure 3-10: Average net expenditure on development management (actuals) 31 Figure 3-11: Total applications submitted/received by each North West local 33 planning authority in 2005/06, 2009/10 and 2013/14 Figure 3-12: Average total amount of application fees received in North West 33 local planning authorities in 2009/10 and 2013/14 Figure 3-13: Total applications submitted/received by each North West local 34 planning authority in 2005/06, 2009/10 and 2013/14 Figure 3-14: Average total number of applications submitted/received by each 35 North West local planning authority in 2005/06, 2009/10 and 2013/14 Figure 3-15: Percentage of decisions decided within 8 weeks 35 Figure 3-16: Percentage of major development applications granted within 37 13 weeks in 2013/14 Figure 3-17: Average receipts by sub-region from the New Homes Bonus 38 and Planning Delivery Grant Figure 3-18: Average Planning Delivery Grant and New Homes Bonus received 39 in the North West Figure 3-19: Average number of housing completions against the average number 40 of applications received across the North West Figure 3-20: Average number of housing completions for each sub-region 41 Figure 4-1: Average number of FTE staff working in the planning service, 44 development management, planning policy and enforcement in 2006, 2010 and 2015 Figure 4-2: The average number of FTE staff in development management teams 45 Figure 4-3: Average number of FTE staff in planning policy teams 46 Figure 4-4: Average number of staff losses in planning departments 48 Figure 4-5: Average number of staff gains 49 Figure 4-6: Comparison between the average number of losses and the 50 average number of gains in 2005/06, 2009/10 and 2014/15 Figure 4-7: Average actual expenditure on development management 53 and planning policy Figure 4-8: Average amount spent on external consultants 54 Figure 4-9: Details on income from pre-application advice, PPA and cost awards 56 Figure 4-10: Details on average income levels from planning application fees 57 Figure 4-11: Average numbers of pre-application advice sessions 58

9
Appendices Appendix A: List of North West local authorities 100 Appendix B: Data analysis framework 102 Appendix C: Survey questions 105 Appendix D: Interview questions 113

10
1. Introduction Since the financial crisis in particular, the public sector has experienced increasing resource pressures resulting from the deficit reduction measures. The purpose of this research has been to understand how changes in public sector planning service resources have affected economic recovery and the capacity across the North West to deliver housing and development. The research focuses on the North West region, as this is one of the largest regions in the UK and represents a good cross-section of rural and urban authorities. There are 42 local planning authorities in the North West which have been contacted as part of this research. Full details of each authority are provided in Appendix A. The purpose of the research was to respond to the following questions, which were agreed with the RTPI North West region at the start of the project:
1. Is there a tension in the ‘balance of resources’ between the public, private and developer participants in the development process?
2. How are public sector planning resources changing over time and what are the consequences?
3. What is the relationship between public sector planning resource and levels of development investment/housing delivery; is this undermining economic recovery across the North West?
4. What models or best practice approaches can be used to deliver quality resource solutions and how can these influence decision makers to reflect an ideal or optimised ‘balance of resources’?
5. How can the role of planning and the profile of RTPI members be enhanced in the workplace in response to resourcing issues?
The aim of the research was to provide credible evidence behind the news headlines and general discussions taking place in the development industry relating to how public sector budget reductions are impacting delivery of private sector development. Local authority resourcing in the North West region is obviously particularly important to the development of the ‘Northern Powerhouse’. In order to address these questions, the research project was structured using four themes: public sector resource changes; budget and income changes; performance; and practice changes. A series of recommendations are also provided. 1.1 Context This research looks back over the last 10 years to take account of significant changes that have taken place within the planning profession or impacted the public sector, the key events are summarised below. This provides useful context for the study and in some cases have contributed to changes or demands on public sector resources; levels of expenditure and income; and performance or planning outcomes. The key events which are of particular importance to this research are:
The UK recession in 2008/09;
The introduction of Planning Performance Agreements in 2008;
End of the Planning and Delivery Grant in 2008;
New Coalition Government in power and Comprehensive Spending Review in 2010;
Introduction of the New Homes Bonus in 2011;

11
Revisions to permitted development rights for householder development in 2008 and 2012;
Revocation of Regional Spatial Strategies;
The publication of the National Planning Policy Framework in March 2012; and
The publication of National Planning Practice Guidance in March 2014; and
New Conservative Government in power in 2015. Whilst this list is not exhaustive it provides a useful context for the types of changes which have taken place within public sector planning services over the last 10 years. 1.2 Methodology This research study has been completed using a combination of primary and secondary techniques, through desktop and stakeholder engagement. The methodology sought to establish a robust and comprehensive framework to inform credible outputs, progress thinking and identify potential solutions (see Appendix B for the data analysis framework). Throughout the project stakeholders have been engaged from the public and private sector. Public sector stakeholders were identified from the ‘planning service’ defined as including planning policy, development management and enforcement functions. The private sector was recognised as a key stakeholder in this research, with a range of private sector consultants and developers engaged who have an active interest in the North West. A variety of sources were used to inform the desktop data collation and analysis. The literature review used information from press reports, reports from the National Audit Office (NAO) and the Local Government Association (LGA). Press reports were used to gauge opinion, understand latest thinking and gain a full appreciation of how the key issues have evolved over the last few years. For the first stage of the study baseline data analysis was also completed using available information from the Chartered Institute of Public Finance and Accountancy (CIPFA) for local authority resources, expenditure and performance. Information from DCLG was used for New Homes Bonus income levels and housing completions data to understand rates of development across the region. The purpose of this first stage was to provide a contextual framework to inform the primary research questions during the stakeholder engagement stage. In order to gain an appreciation of how public sector planning service resource changes are affecting development in the North West, stakeholders were engaged using the following approach:
a survey sent to all 42 local planning authorities across the North West region;
two focus group sessions with public and private sector stakeholders; and
in-depth interviews with a sample of 20 public and private sector stakeholders to follow up on issues or questions raised during earlier engagement.
The outcomes of this research and engagement are presented in this report.

12
1.3 The report The report firstly covers the baseline literature review and published data analysis. This has been used to inform the key research themes and issues to be explored in the next stage of the study. The report then covers the findings from the local authority survey and stakeholder engagement through the interviews and focus group sessions. It concludes with a series of recommendations to be taken forward by the RTPI (regionally and nationally) set out as a series of ‘asks’ and ‘offers’ focused primarily at Government and local authority leadership. The report is structured using the four themes which have been used throughout this research. These are:
public sector resources;
budget and income changes;
performance matters; and
practice changes. 1.4 Acknowledgements This report was commissioned by the North West Branch of the Royal Town Planning Institute from Arup. The authors are grateful for the guidance and support of the core Steering Group, which comprised: Justin Paul (Steering Group Chair) Len Harris Michael Harris Peter Kuit Duncan McCorquodale The Arup study team included: Jane Healey Brown (Project Director) Sarah Lewis (Project Manager) Kieron Hyams (Technical Adviser) Anna Ortega Sarah Grady We extend our particular appreciation to all the stakeholders that engaged with and informed the study, notably those local planning authorities that made survey returns, discussion seminar attendees and one-off interviewees.

13
2. Literature review 2.1 Introduction The literature review has been prepared using a variety of sources including reports prepared for DCLG; Local Government Association publications; planning profession and mainstream media articles. The purpose of the literature review is to set the context for the research and uncover key issues to be explored further within the study. The literature review presents the national view which sets the wider context for analysis in the North West. The literature review has been set out using the themes of planning resources; budget and income changes; and planning performance. This allows for analysis against the five key research questions set out in the introduction. This section is followed by baseline analysis (see chapter 3) which uses data from CIPFA and DCLG to build on the findings of the literature review. 2.2 Planning resources The 2008 House of Commons Report1 on labour shortage and skills gaps in planning identified two “linked and chronic problems” which need to be addressed to prevent the Government targets for house building and regeneration being missed: the drastic shortage of planning officers (estimated to affect 46% of local authority posts by 2012), and the significant and growing skills gap among those planners within the system. Over the last 15 years, a wide range of reports and inquiries have explored the issue of planning skills and labour shortages including Lord Rogers’ Urban Task Force (1998), the Planning Green papers of the late 1990s, the Barker review of Housing Supply (2004), the Egan Review (2004), the Leitch Review of Skills (2005), the Barker review of Land Use Planning (2006), the ASC’s Mind the Skills Gap report (2007) and the Calcutt Review of House building (2007). The 2008 Commons Report notes that even with this vast array of evidence the change in trajectory has not come about, both in increasing the numbers of people entering and staying in the planning profession, and in raising the level and range of skills required to do the job. The repeated concerns and recommendations expressed over the past 10 - 15 years appear to have not been translated into actions. In November 2010, Arup updated the DCLG ‘Planning Costs and Fees: Final Report’. This report identified that two-thirds of respondents had seen a decline in staffing levels, with a median decline of close to 6%, and almost a third of respondents had lost more than 10% of their staff compared to four years ago. In December 2012, Planning Resource reported in their survey of Heads of Planning in English councils that three quarters of respondents did not expect to be able to expand their teams this year or next year and 40% of respondents were not clear about likely future staffing levels. Four fifths of respondents expected the extension of permitted development rights and the diversion of more applications to the Planning Inspectorate to cut fee income.2
1 Planning Matters – Labour shortages and skills gaps, July 2008 (House of Commons CLG Committee).
2 Planning Resource, Town Hall Resources to Remain Tight Next Year, 14 December 2012.

14
Summary Planning skills and staff shortages have been an ongoing issue over the last 10-15 years. Whilst recommendations have been made, these have not been translated into actions in terms of changes to planning service staffing levels. The literature review highlights that since 2010 there have been reductions in planning staff combined with a freeze on recruitment. 2.3 Budget and income changes 2.3.1 Budget changes Over the last 5 years local authority planning departments have been hit by funding reductions. According to the National Trust almost half (47%) of 227 councils surveyed in late 2011 had suffered a cut in the number of planning staff since 2008, with only 7% seeing more staff employed to deal with extra work. More than a third (37%) have also had their overall budget for planning activities reduced.3 The Institute for Fiscal Studies (IFS)4 supports this view in their election briefing note ‘Central Cuts, Local Decision-Making’ (March 2015) which states spending by local authorities in England has been cut between 2009/10 and 2014/15 by 20.4% after accounting for inflation. In terms of budgets, local authority planning and development services have experienced the largest reductions on average with net spending cut by more than 50% in the same period. These findings are backed by the National Audit Office report ‘The impact of funding reductions on local authorities’ (NAO, November, 2014),5 which found that council planning and development services have been subjected to the deepest local government cuts. According to the NAO between 2010/11 and 2014/15 spending on planning and development including building control and environment will have been cut by 46% in single tier and county authorities. “Most of the fall in planning and development spending took place between 2010/11 and 2011/12 when centrally funded programmes like the Neighbourhood Renewal Fund and Local Enterprise Growth Initiative were halted.” With reports that three in five councils will have exhausted other ways of making savings by 2015,6 planning services alongside other local services are more exposed to future reductions. The Local Government Association (LGA) report ‘Under Pressure’ (May 12, 2014) says councils are almost at the point “where they will not have enough money to meet all their statutory responsibilities.” According to the LGA, council spending on planning and development services over the medium term to 2020 does not improve. The ‘Funding outlook for councils from 2010/11 to 2019/20: preliminary modelling’ (June 2012) predicts planning services could experience reductions of more than 90% by the end of the decade as council expenditure is channelled to services such as adult social care, social services and waste collection where there is explicit statutory responsibility.
3 http://www.theguardian.com/local-government-network/2012/may/10/planning-teams-threat-cuts-
national-trust, Accessed July 2015 4 http://www.ifs.org.uk/uploads/publications/bns/BN166.pdf compared to the CIPFA data
5 http://www.insidehousing.co.uk/planning-and-housing-hardest-hit-by-council-cuts-says-
nao/7006931.article. Accessed July 2015 6 http://www.theguardian.com/society/2014/may/11/public-service-cuts-deepen-councils-
savings?CMP=twt_gu. Accessed July 2015.

15
Figure 2-1: Service spending as proportions of overall budget
Source: ‘Funding outlook for councils from 2010/11 to 2019/20: preliminary modelling’ (LGA, June 2012). The Local Government Association report ‘Local government’s role in promoting economic growth’ (November 2012)7 shows between 2009/10 and 2012/13 pro-growth public sector services such as planning and development have been hit the hardest by reductions. Figure 2-2: Reductions to public sector services
Source: ‘Local government’s role in promoting economic growth’ (LGA, November 2012). 7 http://www.local.gov.uk/c/document_library/get_file?uuid=25a4547d-bc7e-415f-b1eb-
7ed57070d66e&groupId=10180. Accessed July 2015.

16
Figure 2.2 shows disproportionate reductions to planning and development compared to other public sector services. The LGA report explains the reason for this and the implications for economic growth and development: “..spending on housing, highways and transport, cultural and, particularly, planning and economic development services is being reduced far faster than the average for all of local government. The consequence of requiring local government to make reductions that exceed those made to the NHS, education, work and pensions and international development, coupled with inescapable pressure on councils to protect social care and local environmental provision delivers, however accidentally, a result which is likely to undermine growth.8” Public sector budget reductions are set to continue over the next three years. According to the Institute for Fiscal Studies, based on proposed reductions of £13 billion to central government budgets between 2015/16 and 2017/18 public sector departments will see their budgets cut by 15% up to 2017/18. This is almost a third lower than they were in 2010 once inflation is taken into account.9 Summary Since 2008 there has been a reduction in the overall budget for planning activities combined with a reduction in the number of planning staff. Disproportionate reductions to planning and development mean that average net spending has been cut by around 50% between 2009/10 and 2014/15. Public sector planning services are also exposed to future reductions. According to the Local Government Association (May 2014) councils are almost at the point where they do not have enough money to meet statutory responsibilities with future reductions likely to undermine growth. 2.3.2 Planning service income changes In June 2000, Arup and the Bailey Consultancy were commissioned by DTLR to undertake detailed research into planning fees. The report’s overall recommendation was that application fees should be charged so as to achieve full cost recovery with a logical incremental fee structure at a national level. Failing this, they recommend that fees should achieve full cost recovery with some cross subsidisation between fee categories (DTLR, Planning Fees, June 2000). The House of Commons 2002 Planning Green Paper set out a commitment to carry out a fundamental review of the fee regime. From this stemmed the ODPM Report, ‘The Planning Service: Costs and Fees’ (November 2003). This considered two options of setting application fees locally and setting variable fees. It concluded that there were no systematic differences in costs to justify locally set fees and authorities did not have the accounting systems in place to calculate and implement such a fee regime. Whilst the report considered variable fees to represent a useful policy mechanism, it concluded that at the current time it was better to use central government’s grant allocation mechanism in the interests of clarity, equity and administrative efficiency. In 2009, Arup and Addison & Associates undertook a study on behalf of DCLG specifically looking at the costs of different types of planning applications. This is also one of the few studies to focus on the planning system from the perspective of the applicant looking at the ‘customer’ experience
8 ‘Local government’s role in promoting economic growth’ (LGA, November 2012).
http://www.local.gov.uk/c/document_library/get_file?uuid=25a4547d-bc7e-415f-b1eb-7ed57070d66e&groupId=10180. Accessed July 2015. 9 http://www.theguardian.com/society-professionals/2015/jun/10/public-services-longer-hours-breaks-
stress. Accessed July 2015.

17
(DCLG, Benchmarking the costs to applicants of submitting a planning application, July 2009). This report has been influential as the basis of a number of regulatory impact assessments relating to the ‘customer’ impact of planning fee changes. Arup prepared an update for DCLG in November 2010 with the ‘Planning Costs and Fees: Final Report’. The study found that whilst applications had fallen and fee income had declined, costs had risen, reflecting inflation in staff costs. A comparison of average costs (£619 per application) to average fees (£563) found an overall increase of 10% on fees is required. In considering the future options in relation to fees the report recommends that the estimation of overheads needs to be improved as the current accounting structures are focused towards total cost accounting at an authority level and not planning service costs specifically (CIPFA have published guidance on the principles for calculating planning service overheads). The November 2010 study found that 64% of respondents were opposed to the principle of locally-set fees however recommended that if fees were to be set locally, these should remain linked to cost and not performance, and the estimate for these fees should be based on defined overheads and time recording evidence, with the Secretary of State able to cap these fees. The report identified scope to combine fee categories and recommended that fees for certain application should better reflect the costs of these applications. In 2011, PAS and CIPFA undertook a fee setting model working with local authorities to prepare new methods of service delivery. This work began as part of the Managing Excellent Planning Services (MEPS) initiative, but with the potential introduction of locally-set planning application fees evolved in the PAS/CIPFA Benchmark. Their data gathering exercise found that many cost drivers for councils lie outside the planning department including overheads, premises and corporate charges. They identified that there is often a wide variation in cost between councils, economies of scale do not apply in most cases, and whilst applications vary, the processes to handle them does not. In terms of fees it found that these covered 50% of overall costs, the national fee schedule was too complex, and the use of standard processes and lack of local flexibility meant that prices start high even for the simplest applications. 2.3.3 Financial incentives Given the longstanding recognition by Government of the problems within council planning departments, there has been a series of different grant regimes over time, each with slightly different purposes. The Planning and Delivery Grant (PDG, latterly Housing and Planning Delivery Grant (HPDG)) was first introduced in April 2003 by ODPM. It had no specific conditions attached to how it was to be spent however its primary objective was to redress identified under-resourcing of the planning service within councils. It was not intended to be a grant to pump-prime improved resources or performance, but rather was an ex post reward for previous investment and service improvement. The grant came to an end in 2008. Annual evaluation of the PDG by ODPM (in September 2004, 2005 and 2006) found that the grant improved the level of resources in authorities and provided an incentive to improve performance irrespective of the size of the grant received. The 2003/04 grant was spent on planning services in 96% of authorities, it enhanced areas of expenditure and brought forward projects to enable their completion earlier. The 2004/05 grant was spent on planning services in 97% of authorities and the potential award of cash resources helped to focus corporate attention on the effectiveness of the planning service. The 2005/06 grant evaluation found that key areas of investment via the grant was in IT, staff, commissioning external consultants, assistance in producing Local

18
Development Frameworks (LDFs), and in improving the quality of the service. Following the Barker Review of Land Use Planning in 2006, the Government consulted on reforming the PDG creating the Housing and Planning Delivery Grant. The intention for this new grant was to strengthen the incentive for local planning authorities to respond to local housing pressures, supporting increasing housing delivery to meet local needs, encouraging local planning authorities to be involved in the delivery of new housing, unlocking blockages in the delivery chain, returning the benefits of growth to the community through new funding streams, and incentivising efficient and effective planning procedures (DCLG, Housing and Planning Delivery Grant Consultation Paper, July 2006). In April 2011, the Housing and Delivery Planning Grant was replaced by the New Homes Bonus in order to encourage bringing empty homes back into use. The New Homes Bonus is a grant paid by central government to local councils for increasing the number of homes and their use. The New Homes Bonus is paid each year for six years. It is based on the amount of extra Council Tax revenue raised for new build homes, conversions and long-term empty homes brought back into use. There is also an extra payment for providing affordable homes.10 Looking forward, strategies to tackle the 2015/16 council budget challenge include increasing new homes bonus receipts and maximising the income from fees and charges11. The LGA report ‘Under Pressure’ (May 2014) states “Local authorities are looking at ways to increase their local tax base, mainly through encouraging more house building. This has a double financial effect of providing council tax revenue from additional occupied homes and new homes bonus funding from central government.” However, it is difficult to rely on these income sources in the short term, due to aspects of economic and housing growth being outside local authority control. The planning process and time taken to build new properties presents uncertainty on when the income from council tax and the new homes bonus will be available. Summary The DTLR planning fees report (June 2000) recommended fees are charged to achieve full cost recovery with an incremental fee structure set at the national level. It is also important that fee income takes account of inflation and is adjusted over time (Planning Cost and Fees: Final Report, DCLG November 2010). Other sources of income into planning relate to financial incentives, firstly from the Planning Delivery Grant in 2003 and then the New Homes Bonus in 2011. The planning service provides an important means of securing income for the local planning authority through the development process from application fees, New Homes Bonus incentives and council tax receipts. 2.4 Planning service performance 2.4.1 Decision-making Local authority planning services continue to experience resource pressures as a result of planning service budget reductions and changes in the planning regime. According to the National Audit Office report (November 2014) ‘The impact of funding reductions on local authorities’ show how applications are taking longer to process although the performance on major applications has increased:
10
2010 to 2015 Government Policy: House Building (DCLG, HCA). 11
Under Pressure (LGA, May 2014).

19
“Within planning and development services, the percentage of minor planning applications processed within 8 weeks fell from 75% in 2010-11 to 70% in 2013-14, despite a 3% fall in the number of applications. The share of ‘other applications’ processed within 8 weeks fell from 86% in 2010-11 to 83% in 2013-14, despite a 4% fall in the number of applications. In contrast, the share of ‘major applications’ processed within 13 weeks increased from 67% to 71% over this period.” The issue over the time taken to process applications is also recognised by the Federation of Master Builders (FMB)12 who highlight that councils are missing the decision deadline in nearly half of all planning applications. Some 29% of applications took over six months to be decided, and 12% had not been given a verdict after a year. This is having an impact on private sector financial resources. Brian Berry, Chief Executive of the FMB13, said: “The length of time it takes to get planning permission and to negotiate post-planning conditions is a big concern for small house builders because of the impact it can have on their cash flow. Local authority planning departments are often inadequately resourced, which results in planning applications being held up.”
According to research by Nathaniel Litchfield and Partners (NLP) changes in the planning regime are placing further resource pressures on local planning authorities. Half the plans submitted for examination since the NPPF have experienced delays. Progress of many plans has stalled as local planning authorities take stock of their evidence base before proceeding with the rigorous examination process. The number of plans being withdrawn has increased between 2013/14 and 2012/13.14 Changes to permitted development are also seeing development management teams faced with increased administration of prior approvals.
Negative perceptions associated with resource reductions and planning complexity are filtering through to the development industry. Philip Barnes (Group Land and Planning Director, Barratt Developments) 15 stated: “We’re held back by the complexity of the local planning process and the lack of resources in local authority planning departments.” 2.4.2 Resourcing and process changes A DCLG 2005/06 study ‘Key Lessons for Development Control’ evaluated the performance of 58 Planning Standards Authorities and identified the importance of taking a proactive approach to application management as well as the whole planning service. It recommended that development control services should be actively supported by elected members and senior officers to ensure sustainable resources. Staff levels should take account of the volume of work involved in the determination process (including the pre-application process, the committee process, appeals, training and job satisfaction). A benchmark caseload figure of 150 was found to be a useful guideline (albeit dependent on the ratio of major/minor/other cases, and depending on the extent to which officers also handled pre-application, duty planner or appeal/enforcement work).
12
http://www.express.co.uk/news/uk/455632/Britains-house-building-drive-undermined-by-Government-cuts-to-council-planning-budgets. Accessed July 2015. 13
http://www.express.co.uk/news/uk/455632/Britain-s-house-building-drive-undermined-by-Government-cuts-to-council-planning-budgets. Accessed July 2015. 14
http://nlpplanning.com/PositivePreparations.pdf. Accessed July 2015. 15
The Planner, April 2015.

20
The report recommended various ways of delivering planning services including delivery across authorities; in conjunction with the private sector; and through sharing resources, particularly where there were recruitment and retention problems or very small services. It recommended having good pre-application procedures and clear advice on validation requirements in order to ensure that applications submitted are “fit for purpose” to reduce invalid applications. The report also highlighted the benefits of ensuring clear public guidance on key issues such as registration/validation, Section 106 agreements, policy, and the decision making process.16 The 2006 Audit Commission Report ‘ The Planning System: Matching Expectations and Capacity’ recommended that councils should balance providing planning services in house with finding solutions available through the private sector and/or sharing resources with other authorities. Councillors should be involved in pre-application discussions in order to identify issues early in the process. Councils should engage with local communities regarding the issues that are open for debate, particularly strategic housing numbers. The developer’s role should be to engage with councils at the pre-application stage in order to allow meaningful discussion of planning issues. Statutory consultees should provide clear guidance to councils to assist in resolving technical matters at a local level. The 2006 Audit Commission Report also cites a number of good practice examples including using private sector resources to assist with capacity issues including the use of external solicitors to deal with Section 106 agreements by Southampton City Council, entering into a joint venture partnership with the private sector by Salford City Council, engaging planning firms to improve meeting targets by Redditch Borough Council, and using external consultants to deal with planning appeals by Birmingham City Council17 (Audit Commission, The Planning System: Matching Expectations and Capacity, February 2006). Since the Killian Pretty Review (November 2008), a number of recommendations have been taken forward to further increase efficiencies in the planning system These include reducing the number of small scale developments that require full planning permission by extending permitted development rights; making the planning application process more efficient by improving the pre-application stage; improving the quality of information available to users of the planning application system through the use of the Planning Portal; and producing a national planning policy framework. The recommendation by Killian Pretty regarding improvements to local authority capacity and performance including thorough revision of performance measures and financial incentives has not been fully realised and is still an area to be addressed. Whist Development Control targets for determining applications of 8 weeks (minor applications) and 13 weeks (major applications) remain, the Government abolished the Public Service Agreement (BVPI 109abc, latterly NI 157) targets in June 2010. Financial incentives for the planning service (such as the New Homes Bonus) are now largely driven by housing delivery.
16
DCLG, Key Lessons for development Control, An Overview of the Evaluation of Planning Standards Authorities 2005/06, June 2006 DCLG, Key Lessons for development Control, An Overview of the Evaluation of Planning Standards Authorities 2005/06, June 2006. 17
Audit Commission, The Planning System: Matching Expectations and Capacity, February 2006.

21
Since the UK general election in May 2015, a key political issue has been the level of resourcing for council planning departments and prioritising funding of those departments as key drivers of “the jobs growth and homes people need.”18 The need to prioritise investment in planning departments in order to cope with rising housing demand is supported by the Federation of Master Builders (FMB) in its ‘Programme for Government’ agenda.19 Recent announcements by Government on the 2015/16 Comprehensive Spending Review have set the challenge for Whitehall departments including DCLG to model cuts of 25% and 40%. This suggests that further budget reductions are likely to be directed downwards towards local public sector planning services, although the extent of reductions are unknown at this stage. The announcements are in conjunction with Government objectives to improve the performance of the planning system. ‘Fixing the foundations: Creating a more prosperous nation’ is the title given to the July 2015 budget. The planning performance regime will be tightened so that local authorities making fewer than 50% of decisions on time and those processing minor applications too slowly are at risk of designation. The Government will also introduce a dispute resolution mechanism for Section 106 agreements to speed up negotiations and allow housing starts to proceed more quickly. Local planning authorities that are slow in bringing forward their local plans will also be penalised as the report highlights the importance of having an adopted local plan. In the House of Commons Written Statement, Brandon Lewis, Minister of State for Housing and Planning, stated that the Government will intervene to ensure that all local authorities will have local plans in place by early 2017 by arranging for the plan to be written in consultation with local people. League tables detailing the progress that each local authority has made in providing a plan for the jobs and homes that are needed locally will be created.20 Summary The main issue highlighted in the literature review is the time taken to determine minor and other applications, largely as a result of the ongoing prioritisation of major applications in the current performance regime. According to the FMB, 29% of applications took over 6 months to determine and 12% were given a verdict in a year. There is further impact from permitted development changes and increased administration of prior approvals. Delays in producing and adopting planning policy are also prevalent, with half of plans submitted for examination since the NPPF experiencing delays. Government announced local planning authority performance targets in the July 2015 budget to address these issues. The approach will see greater enforcement of determination of minor applications within 8 weeks and a target for Local planning authorities to have an up to date local plan in place by 2017.
18
http://www.planningresource.co.uk/article/1342107/resourcing-planning-departments-key-issue-richard-garlick. Accessed July 2015. 19
http://www.planningresource.co.uk/article/1331678/builders-calls-better-planning-department-resourcing. Accessed July 2015. 20
DCLG, House of Commons: Written Statement: Brandon Lewis, Local Plan (July 2015).

22
3. Baseline data analysis 3.1 Introduction Baseline analysis has been carried out on public sector planning service data to understand how planning services across the North West have changed over the last 10-15 years. The analysis covers trends in resourcing, budget and income from application fees and New Homes Bonus. Data to inform the baseline analysis has been sourced from CIPFA and DCLG. In order to establish trends over the last 10 years, where possible data has been collated for Local planning authorities within the North West for 2005/06, 2009/10 and 2014/15. In the case of CIPFA information, the most recent available data was for 2013/14. The data analysis has been shaped by the availability of information from CIPFA given that the 2013/14 CIPFA data differs from previous years with a focus on planning application statistics broken down by development type, application type and timescales for determination. It does not include data on planning and development staff numbers, unlike the 2005/06 and 2009/10 sources, but instead includes employee expenditure for each planning service. Thus, care should be used when reading across time periods. The CIPFA categorisation of planning services differs between datasets. In the 2013/14 data, planning comprises: development control, conservation and listed buildings planning policy, other planning policy, environmental initiatives, business support, economic research, economic development, and community development. In comparison, the 2009/10 data uses: planning policy, development control/management, environmental initiatives, and building control, whilst the 2005/06 data consists of: planning policy, development control, environmental initiates, community development, building control, and economic development. Given the differences between the CIPFA data over time, the local authority planning survey results will be used as a means of supplementing the data, as well as providing an up-to-date picture of the situation post 2013/14. This remainder of this section covers planning resources; budget changes and planning income, and performance; three of the four main themes which can be analysed using baseline data. 3.2 Planning resources Total planning and development staff CIPFA data for those authorities where it was available (for both time points) (figure 3.1) shows that total planning and development staff numbers21 decreased in all North West authorities (except Ribble Valley) between 2005/05 and 2009/1022 with the greatest reduction in Liverpool, followed by Wirral and Manchester. The average total planning and development staff numbers in North West authorities in 2005/06 was 114.1 FTE whereas in 2009/10 this had reduced to 65.4 FTE, thus there was an average reduction in staff numbers of 42.6% in these authorities.
21
Figures include planning policy, development control, building control, environmental initiatives, community development and economic development staff. 22
Equivalent data are not available post-2010.

23
Figure 3-1: Total planning and development staff for 2005/06 and 2009/10
This data was further analysed to examine any variation in trends between planning policy and development management service areas. Planning policy In all North West authorities (where information was available for both time points) with the exception of Stockport, Warrington, Lancashire and Eden, there was an increase actual planning policy staff numbers between 2005/06 and 2009/10,23 as shown in Figure 3.2 below. The average number of planning policy staff (FTE) for the above authorities was 13.3 in 2005/06 and this increased in 2009/10 to 15, an average increase of 12.8%.
23
Equivalent data are not available post-2010.

24
Figure 3-2: Percentage of planning policy staff in planning and development for 2005/06 and 2009/10
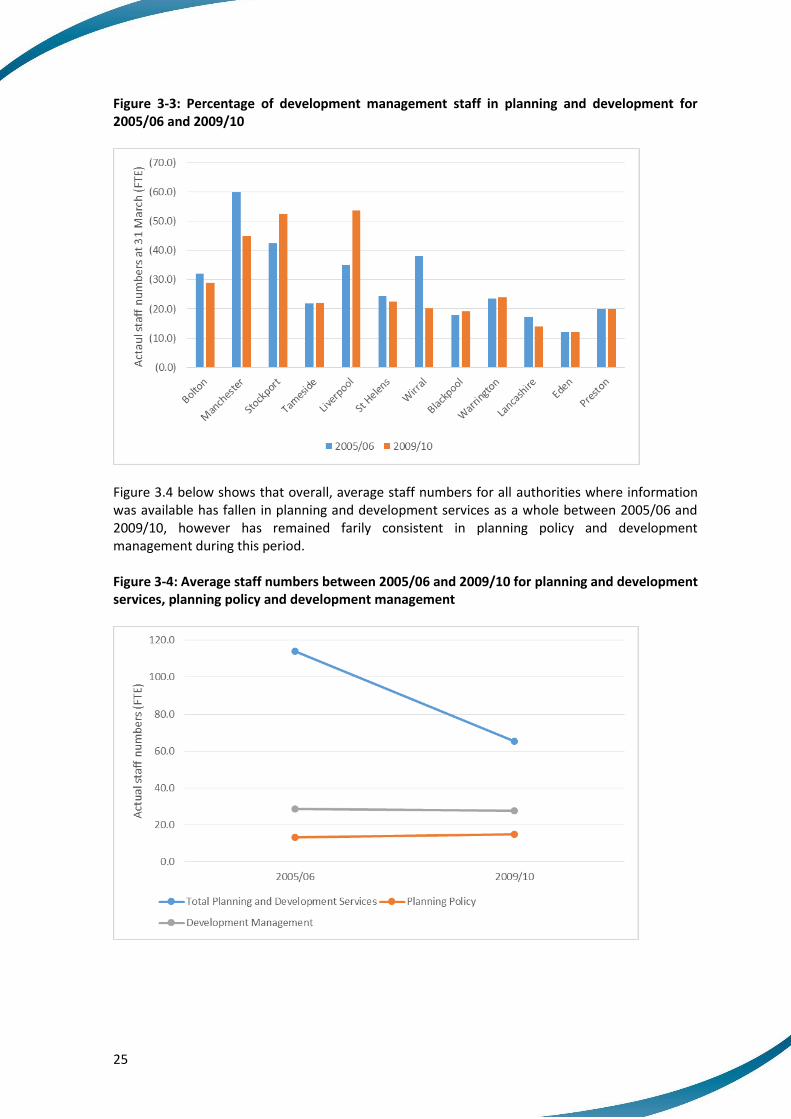
Development management In all authorities (where information was available) with the exception of Stockport, Tameside, Blackpool, Warrington and Liverpool, there was a decrease in the percentage of development management staff within planning and development between 2005/06 and 2009/1024. The greatest percentage decrease was in Wirral and Manchester, whilst the greatest increase in staff was in Liverpool. The average number of development management staff (FTE) for the above authorities was 28.7 in 2005/06 and this decreased in 2009/10 to 27.8, an average decrease of 3.1%.
24
Equivalent data are not available post-2010.
25
Figure 3-3: Percentage of development management staff in planning and development for 2005/06 and 2009/10
Figure 3.4 below shows that overall, average staff numbers for all authorities where information was available has fallen in planning and development services as a whole between 2005/06 and 2009/10, however has remained farily consistent in planning policy and development management during this period. Figure 3-4: Average staff numbers between 2005/06 and 2009/10 for planning and development services, planning policy and development management

26
Planning resource conclusions The CIPFA analysis for 2005/06 and 2009/10 shows that despite there being an overall reduction of 43% in the amount of planning and development staff over this period, this has not impacted planning policy and development management staff numbers given that there has been a slight increase in the percentage of planning policy staff (up by 12.8%) and a slight decrease in development management staff (down by 3.1%). The greatest staff reductions have occurred in the metropolitan districts of Liverpool, Wirral and Manchester. Despite reductions in planning and development, authorities across the North West have seen an increase in the percentage of staff working in planning policy and only a slight decrease in the development management service area. Therefore higher percentages of staff have been cut from other planning and development service areas including building control, environment, community development and economic development. Given the lack of data post 2010 these data are supplemented in the following section by the findings from the North West local planning authority survey conducted for this research. This is particularly important given significant budget and staff reductions took place after 2010 in many local authorities.
3.3 Budget and income changes In this section budget information from CIPFA has been analysed based on net expenditure for planning policy and development management and total employee expenditure across the planning service. Analysis also includes planning income from application fees, New Homes Bonus and Planning Delivery Grant. 3.3.1 Net expenditure Planning and development services The following graph (figure 3.5) shows total net expenditure spent on planning and development services within North West authorities where data was available in 2005/06, 2009/10 and 2013/14.

27
Figure 3-5: Total net expenditure for planning and development services
Note that the 2009/10 and 2013/14 data represents actual expenditure whilst for 2005/06 only estimated data is available. The categorisation of planning services differs in the 2013/14 data source consisting of: development control, conservation and listed buildings planning policy, other planning policy, environmental initiatives, business support, economic research, economic development, and community development. In comparison, the 2009/10 data uses the following categories: planning policy, development control/management, environmental initiatives, and building control, whilst the 2005/06 data consists of: planning policy, development control, environmental initiates, community development, building control, and economic development. Given this, it is likely that the large increases evident in Liverpool and Lancashire between 2013/14 and 2009/10 are due to the additional categories of economic research, economic development and community development being included within the 2013/14 data.

28
Figure 3-6: Average total net expenditure for planning and development services
On average, total net expenditure has significantly increased in 2013/14 at £6,398,000 from both 2005/06 and 2009/10 figures being £3,574,000 and £2,237,000 respectively. This represents a 79% increase between 2005/06 and 2013/14 and a 186% increase between 2009/10 and 2013/14. Figure 3.6 above demonstrates these changes and is based on the authorities shown in figure 3.5. Manchester, Liverpool and Cheshire West and Chester have seen the highest increases in total net expenditure for planning and development services between 2009/10 and 2013/14 with an average increase of 87%. (Data for all three time periods was not available for Manchester and Cheshire West and Chester and therefore they have not been included in the graph or the average figure). The increase in the range of services in 2009/10 (i.e. as noted above, the incorporation of economic and community development) is likely to be a reason for the significant increase in average budgets, which means comparison of data in planning and development services budgets is significantly restricted. It is therefore more appropriate to consider net expenditure on planning policy and development management, as set out below, as these are more comparable across the period of analysis.
29
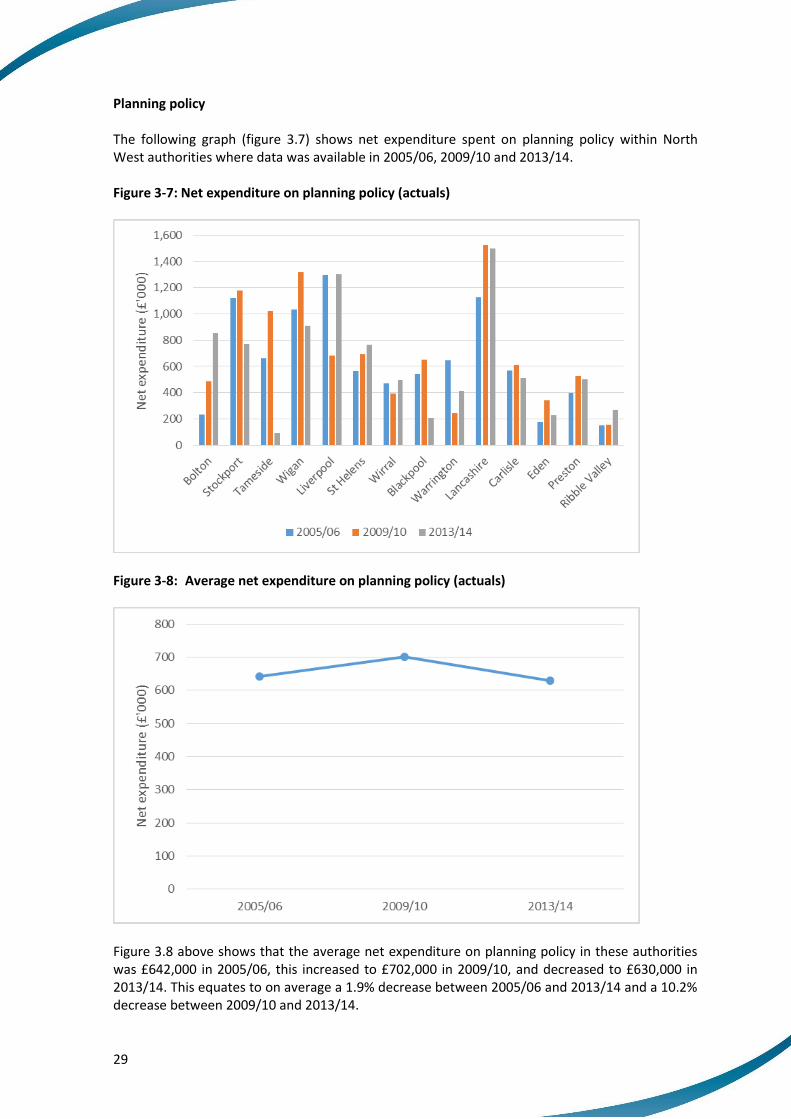
Planning policy The following graph (figure 3.7) shows net expenditure spent on planning policy within North West authorities where data was available in 2005/06, 2009/10 and 2013/14. Figure 3-7: Net expenditure on planning policy (actuals)
Figure 3-8: Average net expenditure on planning policy (actuals)
Figure 3.8 above shows that the average net expenditure on planning policy in these authorities was £642,000 in 2005/06, this increased to £702,000 in 2009/10, and decreased to £630,000 in 2013/14. This equates to on average a 1.9% decrease between 2005/06 and 2013/14 and a 10.2% decrease between 2009/10 and 2013/14.

30
In contrast to the more constant nature of development management work, planning policy costs can be expected to fluctuate during the plan-making cycle, particularly around events such as the commissioning of evidence base reports, or the legal and increased in-house costs associate with consultation and inspection events. For Tameside and Blackpool, there are noticeable peaks in planning policy expenditure for 2009/10 with significant reductions of around 68% in Blackpool and 91% in Tameside for 2013/14. The profile for local planning authorities such as Warrington and Liverpool are similar in that they start from a relatively high expenditure with reductions experienced in 2009/10 before expenditure starts to increase again in 2013/14. Development management The following graph (figure 3.9) shows total net expenditure spent on development management within North West authorities where data was available in 2005/06, 2009/10 and 2013/14. Figure 3-9: Net expenditure on development management (actuals)

31
Figure 3-10: Average net expenditure on development management (actuals)
Figure 3.10 above demonstrates that the average net expenditure on development management in these authorities was £413,000 in 2005/06, this increased to £744,000 in 2009/10, and decreased to £439,000 in 2013/14. This equates to a 6.3% increase between 2005/06 and 2013/14, and a 41% decrease between 2009/10 and 2013/14. Average expenditure for 2013/14 would be higher if data for Liverpool, Manchester, and Cheshire West and Chester was included, however given that data for Manchester and Liverpool includes minus figures for one of the time periods, and data for all three time periods for Cheshire West and Chester is not available, these authorities have been excluded from the graph. Figures 3.9 and 3.10, between them, demonstrate that there is a clear pattern of increase in net expenditure across NW Local planning authorities between 2005/06 to 2009/10 with the exception of Lancashire and Ribble Valley. Between 2009/10 and 2013/14 net expenditure has predominantly decreased with the sharpest decrease of 82% in Wigan followed by Bolton and Stockport with 52%. In comparison, and whilst not shown above, net expenditure in Manchester increased by 68% between 2009/10 and 2013/14 and 45% in Cheshire West and Chester. Of the available data for the authorities, Cheshire West and Chester had the highest net expenditure on development management in 2013/14 of £2,372,000. Planning policy and development management as part of planning and development services budgets The highest total net planning and development expenditure was in Liverpool at £33,133,000 in 2013/14, however despite this, only £1,305,000 of this net expenditure went on planning policy services and £1,294,000 on development management services, thus representing approximately 4% of total expenditure. Similarly, Cheshire West and Chester and Manchester had very high levels of total net planning and development expenditure at £31,438,000 and £28,500,000 in 2013/14, respectively. Of this, in Cheshire West and Chester only £2,372,000 was spent on development management equating to 7.5% of total expenditure whilst in Manchester, only £1,570,000 was spent on development management equating to 5.5% of total expenditure (figures are not available for planning policy expenditure in 2013/14).

32
Across England in 2013/14, the average total planning and development expenditure being spent on development management is 16.52%, and for planning policy is 16.36%. Economic development uses the most expenditure taking up 29.27% of spending on average. Therefore, on the whole, only a very small share of expenditure is being spent on development management and planning policy in Liverpool, and on development management in Cheshire West and Chester and Manchester. However, this relative spend by service needs to also be considered against absolute spend. In authorities with substantial capital economic development programmes, the proportionate spend on planning will be lower. This may or may not reflect real net investment by the authority or ‘pay back’ funding using mechanisms such as TIF or prudential borrowing.
Budget conclusions Where data was available for NW authorities, on average, total net expenditure for planning and development services has significantly increased in 2013/14 at £6,398,000 compared to both 2005/06 and 2009/10 figures with a 186% increase between 2009/10 and 2013/14; however this is likely to reflect the increased range of services covered by these budgets. The change in budgets for development management and planning policy are therefore a better gauge of planning service budgets over this time period. The average net expenditure on development management in NW authorities where data are available was £413,000 in 2005/06, this increased to £744,000 in 2009/10, and decreased to £439,000 in 2013/14. This equates to a 41% decrease between 2009/10 and 2013/14. The average net expenditure on planning policy in NW authorities where data was available was £642,000 in 2005/06, this increased to £702,000 in 2009/10, and decreased to £630,000 in 2013/14. This equates to a 10% decrease between 2009/10 and 2013/14.
3.4 Income 3.4.1 Application fees Figure 3.11 below shows data for application fees received by each authority in 2009/10 and 2013/14. No data were available for 2005/06. The average amount of application fees received by each authority (where data was available for both time periods) was £890,474 in 2009/10 and this increased to £954,765 in 2013/14, representing an increase of 7.2%. This is shown in figure 3.12 below. Cheshire East received the most application fees in 2013/14 with a total of £3,118,926, followed by Liverpool (£2,777,252), Manchester (£2,156,555), and Cheshire West and Chester (£2,134,850). (Cheshire East is not shown on the graph below given that data was only available for 2013/14). Between 2009/10 and 2013/14 there was an increase in income from application fees for Bolton, Manchester, Stockport, Liverpool, Wirral, Cheshire West, Warrington and Ribble Valley. This varied considerably at 43% for Stockport, 46% for Bolton, 48% for Wirral, 49% for Ribble Valley, 53% for Manchester, 73% for Liverpool and 115% for Cheshire West and Chester. Salford, Sefton and Blackpool saw a reduction in fees from planning applications for 2014/15. There was a 30% reduction in Salford, a 33% reduction in Sefton and a 52% reduction in Blackpool.

33
Figure 3-11: Total amount of application fees received by each North West local planning authority in 2009/10 and 2013/14
Figure 3-12: Average total amount of application fees received in North West local planning authorities in 2009/10 and 2013/14

34
3.5 Performance 3.5.1 Number of applications Figure 3.13 below shows the total number of applications submitted/received in North West authorities where data was available between 2005/06 and 2013/14. It shows that Liverpool consistently had the largest number of applications to determine in 2004/05 and 2009/10, followed by Stockport and Bolton. On average the number of applications submitted/received in 2005/06 was 2,230. This decreased by 47.3% by 2013/14 to 1,174. Figure 3.14 demonstrates these averages. In all authorities, the number of applications submitted/received has decreased between 2005/06 and 2013/14, this. In 2013/14, the highest number of applications submitted/received was in Cheshire East (3,897), Cheshire West and Chester (3,113), followed by Liverpool (2,516), Manchester (2,312) and Stockport (1,676). (Cheshire East, Cheshire West and Chester and Manchester are not shown on the graph below as data for all three time periods was not available for these authorities). Figure 3-13: Total applications submitted/received by each North West local planning authority in 2005/06, 2009/10 and 2013/14

35
Figure 3-14: Average total number of applications submitted/received by each North West local planning authority in 2005/06, 2009/10 and 2013/14

3.5.2 Determination timescales Figure 3.15 below shows the percentage of decisions decided within 8 weeks in North West authorities where data was available between 2005/06 and 2013/14. On average, the percentage of decisions made within 8 weeks has remained fairly constant at 79% in 2005/06, 83% in 2009/10 and 77% in 2013/14, thus representing only a 2.5% reduction between 2005/06 and 2013/14. Figure 3-15: Percentage of decisions decided within 8 weeks
In 2013/14, 70% of major developments were granted within 13 weeks. Figure 3.16 below shows the percentage of major developments granted within 13 weeks for NW authorities where data was available in 2013/14.

37
Figure 3-16: Percentage of major development applications granted within 13 weeks in 2013/14
New Homes Bonus and Planning Delivery Grant Planning Delivery Grant was a key income source for local authorities directly related to planning. Following the withdrawal of PDG, new Homes Bonus is the only comparable income source linked to planning delivery, albeit output-based rather than timeliness-driven. The DCLG data shows the amount of income from the New Homes Bonus received by each Local Authority in the North West since its introduction in April 2011. The information for New Homes Bonus data has been presented on a sub-regional basis covering Greater Manchester, Lancashire, Merseyside, Cheshire and Cumbria. Greater Manchester had the highest average of over £21 million whilst Cumbria had the lowest average of just over £2 million. Greater Manchester also had the highest average received from the Planning Delivery Grant at just under £4 million between 2006/07 and 2008/09 whilst again Cumbria had the lowest average with just under £650,000. Figure 3.17 below comparing the amount received from Planning Delivery Grant and New Homes Bonus funding demonstrates how all local authorities received a significant amount more from New Homes Bonus funding compared to Planning Delivery Grant. Figure 3.18 demonstrating the average amount received by each authority in the North West also depicts an increased amount of money received from New Homes Bonus compared to Planning Delivery Grant.

38
Figure 3-17: Average receipts by sub-region from the New Homes Bonus and Planning Delivery Grant
£0.00
£5,000,000.00
£10,000,000.00
£15,000,000.00
£20,000,000.00
£25,000,000.00
GreaterManchester
Lancashire Merseyside Cheshire Cumbria
Ave
rage
Am
ou
nt
Rec
eive
d (
£)
Planning Delivery Grant 2006/07 to 2008/09
New Homes Bonus 2011/12 to 2014/15
80%
increase
74%
increase 64%
increase
82%
increase
68%
increase

39
£0.00
£2,000,000.00
£4,000,000.00
£6,000,000.00
£8,000,000.00
£10,000,000.00
£12,000,000.00
£14,000,000.00
£16,000,000.00
£18,000,000.00
Planning Delivery Grant New Homes Bonus
Ave
rage
Am
ou
nt
Rec
eive
d (
£)
2006/07 2008/09 2012/13 2013/14 2014/15
Figure 3-18: Average Planning Delivery Grant and New Homes Bonus received in the North West
Income and performance conclusions On average, the number of applications submitted/received has declined between 2005/06 and 2013/14 by 47%. The total annual average application fees received increased between 2009/10 and 2013/14 by 7.2%; no data are available for 2005/6. There has been little change in performance based on determination times for applications. Looking only at performance, data it is not possible to determine any effects of the transition from the timeliness-driven PDG regime to the output-based NHB one. Between 2011/12 and 2015/15 local planning authorities in Greater Manchester and Cheshire received the highest income from New Homes Bonus of between £5 million and £32 million, Merseyside Local planning authorities received between £4 million and £10 million. Income levels from New Homes Bonus for Lancashire Local planning authorities was under £9 million and for Local planning authorities in Cumbria it was under £5 million. The amount received on average in the North West for New Homes Bonus was significantly higher than the previous Planning Delivery Grant. There is a difference of approximately £15 million between 2008/09 and 2014/15 which shows the impact the New Homes Bonus has had on local authorities.

40
Level of development investment and housing delivery Although not a measure of planning performance due to the range of other influencing factors, we have undertaken a brief review of housing delivery to depict the levels of housing development occurring across the North West. Housing completions data from DCLG was used to establish the number of completions within each Local Authority area. Data on housing completions in 2005/06, 2009/10 and 2013/14 have been used to demonstrate the trends in housing completions, however there are some limitations as data for each of these years is not available for every Local Authority. These data have been compared against the average number of applications received in the North West in each of these years, as shown in figure 3.19 below. Figure 3-19: Average number of housing completions against the average number of applications received across the North West
Data have also been presented on the average number of housing completions for each sub-region in the North West, as shown in figure 3.20 below. These data have been broken down by sub-region to show the trends over 10 years for housing completions. Housing completions for 2005/06, 2009/10, 2013/14 and 2014/15 have been presented. Cheshire has experienced the most varied rate of completions with a decrease from 896 in 2005/06 to 195 in 2009/10. All sub-regions had a decrease in completions between 2005/06 and 2009/10 which demonstrates the impact of the economic crisis, but they did not all recover in the same way as in 2013/14 some areas experienced a further drop in completions.
0
200
400
600
800
1000
1200
2005/06 2009/10 2013/14
Ave
rage
Nu
mb
er o
f H
ou
sin
g C
om
ple
tio
ns
and
Ap
plic
atio
ns
Average Housing Completions Average Applications Received

41
Figure 3-20: Average number of housing completions for each sub-region
Housing delivery conclusions There are a number of factors that affect the delivery of housing and these have all contributed to the variations and trends in the housing completions graphs. Across the North West, the general trend shows a reduction in housing completions for 2009/10 compared with the 2005/06 figure, which is likely to be in response to the economic recession. This reduction continued in some areas (Greater Manchester and Merseyside) in 2013/14. Housing completions are now starting to rise across all sub-regions in the North West, however they have not returned to pre-recession levels.
0
100
200
300
400
500
600
700
800
900
1000
GreaterManchester
Lancashire Merseyside Cheshire Cumbria
Ave
rage
Nu
mb
er o
f C
om
ple
tio
ns
2005/6 2009/10 2013/14 2014/15

42
4. Local planning authority survey analysis 4.1 Introduction The survey was sent to all 42 local planning authorities (Local planning authorities) in the North West. The survey ran from the 15th June 2015 to the 8th July 2015. The survey questions are provided in Appendix C. There were 14 local authorities that completed the survey:
Blackburn with Darwen
Blackpool
Bolton
Eden
Halton
Hyndburn
Knowsley
Lake District National Park
Lancaster
Liverpool
Preston
Rochdale
Salford
South Ribble. The survey questions were grouped under the following thematic areas that emerged from the baseline literature and data research: 1. Resources:
a. staff numbers; b. staff losses; c. staff gains; and d. structural and corporate changes.
2. Budget and Income:
a. expenditure; b. spend of external consultants; and c. income levels.
3. Performance:
a. planning appeals; b. pre-application advice sessions; and c. ombudsman complaints.
4. Practice changes:
a. revisions in services. The survey sought data from points within the last 10 years to allow trends to be analysed. In some cases the data presented in this section is for the end of financial year to enable a cut off point for staff figures (e.g. 31st March 2006). The years selected have enabled a valuable insight into the most recent changes within public sector planning services and also fills in any absences of information where data is not available from other sources, particularly the changes in more recent CIPFA data.

43
4.2 Analysis approach The survey consisted of 19 questions: the analysis below picks out the key responses with a robust response rate. Some of questions related to contextual information which has not been subject to separate analysis. Questions 17 and 18 asked if the local planning authority would be willing to participate further in the research and Question 19 provided an arena to give any other comments or experiences, these have been included where the information was appropriate. Analysis has been carried out for each of the survey questions, however not all the ‘completed’ surveys responded to every question. This has been taken into account when considering the completeness and robustness of responses. However this may have resulted in some inconsistencies when calculating averages as in some cases different numbers of authorities have responded to each part of the question. The years that have been selected for information to be provided on in each question have been chosen as they allow the change over time to be illustrated. Generally 2005/06, 2009/10 and 2014/15 have been looked at however for some questions there needed to be a cut-off point, which was selected to be the end of the financial year; for example 31/03/2006 is the date data is given for but this reflects the information from 01/04/2005 to 31/03/2006. These years demonstrate the changes that the planning profession has undergone within the last decade, and also the changes that have occurred within local planning authorities. The key events which have been important for this research are provided in section 1. The analysis has focused on average trends across the returns made to understand patterns overtime and the links between these. Reference has been made to particularly relevant individual responses but with all responses anonymised to the authority type. In a small number of cases where anomalous or internally inconsistent data was provided. These data points were excluded from the analysis. 4.3 Resources 4.3.1 Staff numbers Team The survey requested information on numbers of FTE staff working in different areas of the planning service, it also requested information on FTE staff numbers for different roles within respective teams. Where staff are working across services it was asked that the time was split between the services they work for, e.g. a manager who spends half their time managing staff and half their time on a development management caseload would be 0.5 FTE for each. Of the completed returns, there was a 100% response rate for this question. The issue of staff numbers was particularly important for the survey due to the lack of more recent CIPFA data on staff numbers.

44
Figure 4-1: Average number of FTE staff working in the planning service, development management, planning policy and enforcement in 2006, 2010 and 2015
The graph depicts that more staff work in development management than planning policy on average in each authority. There has been a decrease in all types of planning staff between 2006 and 2015 from 30.6 FTE staff to 20 FTE which is a decrease of 35%. Development management has experienced a decline in staff numbers since 2006 so now there is an average of 4 fewer staff in development management departments, a decline of 29%. A metropolitan authority had lost the most staff in development management from 51.7 FTE staff in 2006 to 27.5 FTE staff in 2015. Some authorities did have a slight increase in staff numbers in development management between 2006 and 2010, for example an urban authority increased from 20.8 FTE to 22.8 FTE staff however all authorities experienced declines from 2010 to 2015.

45
The trend for planning policy staff numbers is different to the trend for development management. On average, there was an increase in the numbers of planning policy staff between 2006 and 2010 and then there was a decline from 2010 to 2015. There was a percentage decrease of 36% between 2010 where there was 7.6 FTE staff and 2015 when there was 4.9 FTE staff. An urban authority had a large increase in the planning policy team from 1 FTE in 2006 to 14.4 FTE in 2010 but this then decreased to 3.07 in 2015. There were some urban authorities that had a constant number of staff between 2006 and 2010 but all authorities experienced contractions in the size of the department between 2010 and 2015. The average number of enforcement staff in 2006 was 2.12 FTE and this increased to 2.6 in 2010. However there has been a decline in the number of enforcement staff to an average of 1.4 FTE staff in 2015, this is a decline of 1.2 FTE staff which is a decrease of 46%. Role Figure 4-2: The average number of FTE staff in development management teams

46
Figure 4-3: Average number of FTE staff in planning policy teams
In development management, the average number of admin/support staff has declined from 8.32 FTE in 2006 to 6.73 FTE in 2015. There is only an average vacancy of 0.14 FTE admin/support staff across the 14 authorities that responded. The average number of admin/support staff for planning policy is significantly lower than for development management. In 2006 the average was of 1.06 FTE, this figure almost halved in 2010 to 0.8 FTE and then declined so there was an average of just 0.6 FTE admin staff in 2015. This is again a halving of the average number of admin/support staff. There were no vacant posts and no utilisation of agency/temporary staff. The number of technicians in planning policy has decreased. In 2006, there was an average of 1.4 FTE, this remained constant in 2010 at 1.4 FTE and then declined to an average of 0.6 FTE in 2015. There was an increase in development management technicians between 2006 and 2015, although there was a slight decrease between 2010 and 2015. The number of planning officers in development management has declined, from 5.17 FTE in 2006 to 3.55 FTE staff in 2010. This is a decline of 31%. There was a further decline in the number of planning officers in development management as it reduced to an average of 3.28 FTE staff in 2015. The trend for planning officers in planning policy has been different. There was an increase from 2.89 FTE staff to 3.45 FTE staff between 2006 and 2010. There was then a decrease of 58% as the number of planning officers reduced to 1.45 FTE staff. The number of senior planning officers in development management departments has been more constant. In 2006 there was an average of 3.5 FTE and this increased slightly to an average of 3.55 FTE staff in 2010. There was a decrease to 2.52 FTE staff in 2015. In planning policy there has been fewer senior planning officers than development management. In 2006, there was an average of 2.66 FTE staff, this increased to 2.72 in 2010. This was followed by a decrease in staff numbers in 2015, to 1.99 which is a decline of 27% of senior planning officers in planning policy departments.

47
The trend across both senior planning officers and planning officers needs to be considered in combination. During and post-recession, authorities have typically responded to a downturn in workload and/or budget reductions through recruitment freezes, redundancies, regarding and similar means. These are explored within the following section. At the same time, case officers progress, increase their experience and potentially move from planning officer to senior planning officer posts. Changes in overall numbers can thus be explained in a variety of ways. The trend for managerial staff has been similar in both DM and planning policy. The number of managerial staff in development management has declined by an average of 32% between 2006 and 2015. There was an average of 2.1 FTE staff in 2006, this decreased slightly to 2.03 FTE in 2010 and then had another decrease to 1.42 FTE staff in 2015. The number of managerial staff in planning policy has declined by 42% between 2006 and 2015. There was an average number of 1.39 FTE staff in 2006 and 0.8 FTE staff in 2015. On 31st March 2015, 50% of authorities had vacancies in the development management team and 29% had vacancies in planning policy. There was also varying use of agency and temporary staff at this point. The most up to date information was requested for temporary staff as this shows the increased utilisation of temporary staff in planning services. An urban authority had 5 FTE agency or temporary staff which increased staff numbers to just 1 less than the figure in 2006. One of the rural authorities had 8 FTE agency/temporary staff on 31st March 2015 in development management and 3.4 FTE agency/temporary staff in planning policy. 4.3.2 Staff losses The survey asked that each local authority gave details regarding staff losses. The losses were broken down to identify the number of resignations, retirements, voluntary redundancies and mandatory redundancies. There was a 100% response rate of those who completed the questionnaire to this question.

48
Figure 4-4: Average number of staff losses in planning departments
From the graph it is apparent that in 2009/10 there was an increase in retirements and voluntary redundancies. Mandatory redundancies had not occurred until recently, possibly when they were the only option left to decrease staff numbers. Resignations have remained fairly constant. The graph shows the number of resignations was similar between 2005/06 and 2009/10 and then decreased in 2014/15. In 2005/06 there were 14.1 FTE resignations, 4.6 FTE of which were in one of the urban authorities. The highest number of resignations in one authority was 5 FTE which was also in an urban authority in 2009/10. This authority also had the highest loss of staff, with 13 FTE leaving the authority in 2009/10, of this there were 5 FTE resignations, 6 FTE retirements and 2 FTE voluntary redundancies. Very few mandatory redundancies occurred across the authorities, there were just 2 FTE in a metropolitan authority in 2014/15 and 1 FTE in a rural authority in the same year. Voluntary redundancies have been more common, with 10 FTE occurring in a metropolitan authority in 2009/10 and 4.6 FTE in an urban authority in 2009/10. The average number of retirements follows a similar pattern to voluntary redundancies. The number increased from 2005/06 to 2009/10 and then declined. However the data provided on retirements does not specify whether these were early retirements or the staff were due to retire regardless of the situation within local authorities. The majority of retirements occurred in 2009/10, there were 6 FTE in one metropolitan authority and 4 FTE in in another metropolitan authority.

49
4.3.3 Staff gains Staff gains were incorporated as part of the survey and for the survey the types of recruitment were broken down into 6 areas:
Managerial
Senior Planning Officers
Planning Officers
Graduate
Pre-graduate
Temporary. However, for the purpose of the analysis the total number of recruitment has been reviewed for each authority. There was an 86% response rate to this question from the returns received and a metropolitan authority only provided a response to the numbers of pre-graduate and temporary workers, not giving a figure for the numbers of other types of recruitment. Figure 4-5: Average number of staff gains
Figure 4.5 shows a decrease in all levels of recruitment between 2005/6 and 2014/15 with the exception of graduate and temporary staff. The graph shows that in 2005/06 the highest level of recruitment was planning officers and pre-graduates but in 2014/5 there was a move towards an increased recruitment of temporary staff. There is also a slight increase in the recruitment of graduate staff in 2009/10.

50
For Figure 4.5, the gaps in the graph for senior planning officers, pre-graduate and temporary staff are due to a combination of incomplete data and zero responses. The data indicates that there were few recruitments were made into local authorities. An urban authority recruited a total of 4 FTE in 2005/06 which was the largest number for one authority in one year. They hired 1 managerial staff, 1 senior planning officer and 2 planning officers. A metropolitan authority and another urban authority made the second largest as one hired a total of 3 pre-graduates in 2005/06 and the other hired 3 planning officers in 2009/10. In 2009/10 they was less than 50% of the number of staff gains than in 2005/06. Planning officers were the most recruited type of staff, in total 9 planning officers were hired across the authorities that responded in the 3 years selected. Out of the 14 authorities, only 3 employed managerial staff and only 3 hired senior planning officers. The average number of planning officers recruited has considerably decreased over the given time period, as has the number for pre-graduates being recruited. The number of senior officers recruited saw a sudden decline from 2005/06 to 2009/10 but has since increased. There was a very slight increase in the number of temporary staff being recruited between 2005/06 and 2009/10 but then there was a greater increase as there were a total of 8.25 FTE recruits made in 2014/15 which suggests an increasing dependency on temporary staff. 4.3.3 Staff losses and gains The following analysis compares the average losses and gains experienced by the local planning authority planning services. Figure 4-6: Comparison between the average number of losses and the average number of gains in 2005/06, 2009/10 and 2014/15

51
The graph shows that in 2005/06 the average number of losses and gains was similar with an average of 1.45 FTE gains and an average of 1.36 FTE losses. There was a 6% increase in gains than losses in 2005/06. In 2009/10 there was an 85% difference between the average losses and gains. There were 0.66 FTE gains whilst the average loss is 4.24 FTE. This demonstrates how the departments have contracted and that staff have left without being replaced. In 2014/15 there is still a higher number of losses than gains but the difference has been reduced by 64%. The average gain is for 0.75 FTE staff into a department whilst the average loss is 2.10 FTE staff in 2014/15. 4.3.5 Structural and corporate changes Local authorities have experienced many changes in the recent years and the survey asked whether the following changes had occurred in the local authorities in the last 6-10 years, last 3-5 years and the last 2 years:
pay freeze;
recruitment freeze;
benefit freeze (leave, training, discounts etc.);
corporate restructure;
service/department restructure;
increase in agency/temp staff;
decrease in agency/temp staff;
outsourcing exercise;
actual outsourcing; and
utilised free training/support (e.g. PAS, LGA or similar). The survey required that respondents ‘ticked’ if any of the changes had occurred within those timescales therefore they could select numerous options for each timeframe. The table below shows the percentage of local authorities that have experienced those changes. 93% of authorities who completed the questionnaire responded to this question.

52
Table 4-1: The number of structural and corporate changes respondents had undergone in the specified timeframes25
In the last 6-10 years
In the last 3-5 years
In the last 2 years
Pay freeze 14% 79% 36%
Recruitment freeze 14% 57% 43%
Benefit freeze 7% 29% 29%
Corporate restructure 71% 79% 79%
Service/department restructure
57% 86% 86%
Increase in agency/temp staff
21% 21% 50%
Decrease in agency/temp staff
7% 14% 7%
Outsourcing exercise 14% 0% 0%
Actual outsourcing 7% 0% 7%
Utilised free training/support
14% 64% 86%
In the last 3-5 years 79% of respondents experienced a pay freeze and 57% experienced a recruitment freeze. The last 2 years has also seen 50% of authorities increasingly use temporary staff. Corporate restructure has been ongoing over the last 10 years, although there has been an increase in the number of authorities experiencing service/department restructures in the last 5 years. Also in the last 5 years there has been an increased reliance on free training and support provided by agencies such as PAS (and the LGA) and ATLAS with 86% of authorities utilising free training in the last 2 years. Few authorities have looked to outsource services with the exception of 2 urban authorities in the last 6-10 years, and actual outsourcing was only adopted by one urban authority in the last 2 years and last 6-10 years, respectively. 4.4 Budget and income 4.4.1 Expenditure Total expenditure in the survey was split up into various categories, namely development management and planning policy. Actual total expenditure was looked at for each of these in the selected years. The actual figures have been provided, however for 2014/15 a metropolitan authority only provided a figure for budget and not actual expenditure so the budget figure has been included. There was a 79% response rate to this question from those who completed the survey.
25
The percentage is the percentage of authorities that responded that experienced the change.

53
Figure 4-7: Average actual expenditure on development management and planning policy
Expenditure has been presented for the development management and planning policy departments separately however they both follow the same trend with an increase 2005/6 to 2009/10 and then a more significant decline between 2009/10 and 2014/15. Overall for development management, the decline from 2005/06 to 2014/15 has been 32% and the decline for planning policy between 2005/06 and 2014/15 was slightly higher at 34%. Local planning authorities reported an increase between 2005/06 and 2009/10, and a more severe decline between 2009/10 and 2014/15. The compound effect of this is that, whilst CIPFA indicates a general increase in expenditure over the period, self-reporting expenditure indicates a substantial decline. Development management departments have a higher average expenditure than planning policy with average expenditure in 2005/06 of £1.1 million which then increased to £1.2 million in 2009/10 and then substantially decreased in 2014/15 to just over £750,000. The relative increase in the expenditure in policy was higher from an average of just under £800,000 in 2005/06 to £960,000 in 2009/10, but then reduced significantly to £500,000 in 2014/15. A metropolitan authority followed the trend for the development management expenditure however for planning policy it has continued to increase expenditure from £1.2 million in 2009/10 to £1.4 million in 2014/15. 4.4.2 Total spent on external consultants External consultants are often used to support the services supplied by local authorities. The amounts spent over certain time periods have been included as part of the survey to look at another area where the local authority has expenditure. Variations between local authorities are due to different views on the use of external consultants, different specialisms which they will or will not require consultants for and different budgets that may prevent external consultants being used.

54
Further, the distribution of spend varies more with development management, with outsourced and in-house services representing the extremes, compared to planning policy where evidence base reports make the use of consultants more staple. For this reason, the commentary below refers to both average (mean) and median (mid-point) values. Figure 4-8: Average amount spent on external consultants
There have been different response rates to this question with 71% responding on development management and 64% responding for planning policy. The highest average spend occurred in 2009/10 with £63,000 spent on development management and £57,000 spent on planning policy. Overall, the average spent on development management is higher as consultancies support development management more than planning policy. There is decline in the consultancy spend in 2014/15 compared to 2009/10 with a reduction of 35.2% for development management and 38% for planning policy. In 2005/06 an average of £48,656 was spent on external consultants for development management, there was an increase to £63,113 spent in 2009/10 and then this decreased to £40,891 in 2014/15. For planning policy less has been spent on external consultants. £36,167 was spent in 2005/06, £57,285 was spent in 2009/10 and then £36,166 was spent in 2014/15. For both development management and planning policy the figures for 2005/06 and 2014/15 are similar. The median figure for planning policy in 2005/06 was £13,710, the median figure for 2009/10 was £25,000 and the median figure for 2014/15 was £18,875. This mirrors the trend of the average figures with an increase in spend on external consultants between 2005/06 and 2009/10 but the median figure shows less of a decline from 2009/10 to 2014/15. The median figures for development management follow the trend between 2005/06 and 2009/10 with the median spend rising from £21,784 to £34,030. However as with planning policy, the decline in spend on external consultants between 2009/10 and 2014/15 is not as severe as displayed in the average figures with the 2009/10 figure decreasing to £24,738 which is still a higher spend than in 2005/06.

55
4.4.3 Income levels The survey requested local authorities provide details of the income they received. To enable an understanding of where the income came from and the reasons for its presence, income levels were broken down into sub categories, these were:
planning application fees;
pre application advice;
planning performance agreements (PPAs);
cost awards;
grants (specifically including neighbourhood planning, planning delivery; grant, new homes bonus);
retained Section 106/CIL contributions;
service level agreements/trading account recharges. There were numerous gaps in the data provided for this topic which leaves a query over whether the authorities did not receive anything for one of the subcategories or whether they did not have the available information. There was an 86% response rate to this question from those who completed the survey. One of the sub categories, PPAs, had a response rate of 71% however many of the responses were ‘0’ as authorities did not receive income from PPAs in 2005/06 and 2009/10. In 2014/15, 8 authorities (a majority of respondents) still did not receive any income from PPAs. The figures that were provided on the income stream from grants was considered to be low across all authorities compared to data from DCLG shown in Figure 3.17. This raised the query as to whether money from the New Homes Bonus (NHB) was in the survey information as the NHB data in Figure 3.17 indicated that the money authorities received from NHB was high. This may not have been included as money that authorities receive from the NHB is often not directed back into the planning department and therefore has been under recorded in the survey findings. This does not undermine the survey findings, however, as it is important to establish the extent to which authorities ring fence or top slice income at a corporate level.

56
Figure 4-9: Details on income from pre-application advice, PPA and cost awards

57
Figure 4-10: Details on average income levels from planning application fees
The two graphs above show the average income levels for (a) pre-application advice, PPAs, pre-application advice and cost awards, and (b) planning application fees. None of the authorities who responded had received income from PPAs in 2005/06 and 2009/10 but then in 2014/15 this changed as 2 authorities did receive money from PPAs. The rural authority received £35,000 and the urban authority received £1690. This confirms that the use of PPA is still emerging and is not being fully adopted by all authorities. As expected, the largest source of income for authorities was from planning application fees, as shown in Figure 4.10. The average received by authorities for planning application fees was just below £850,000 in 2005/06. The average decreased in 2009/10 to around £700,000 which is likely to be due to a decrease in the number of applications. However since then the average income has increased to above the 2005/06 figure with £884,000 being received in 2014/15. This shows that planning applications fee income has increased as the number of applications received has been reducing. 4.5 Performance 4.5.1 Planning appeals One question within the survey focused on planning appeals for all types of planning applications, lawfulness certificates and enforcement notices. Appeals included Section 78 planning, prior approval and advertising appeals, Section 106 agreement appeals, Section 174 enforcement appeals, Section 195 lawful certificate appeals, Section 20 listed building consent appeals, Section 39 listed building enforcement appeals, Section 71 High Hedges appeals, and Section 208 Tree Preservation Order appeals but not CIL appeals.

58
Information was provided by local authorities on the total number of appeals, total number of dismissed, upheld and split decision appeals but also the number of appeals with costs awarded to the planning authority and the amount and the number of appeals awarded to the appellant and the amount. 71% of authorities who completed the survey provided a response to this question. To enable comparison, data for the average number of applications submitted/received has been extracted from the CIPFA data and compared with the appeal data. The data available from CIPFA was not for the same years that data was requested for in the survey, therefore figures are based on trends rather than the actual number of applications have been used in Table 4.2. The data has only been used for the authorities that provided a response to the question on planning appeals. Table 4-2: Average number of applications submitted/received and the average number of planning appeals
2005/06 2009/10 2014/15
Average number of applications (based on CIPFA trend data)
2,090 1,488 891
Average total appeals 51 (2.4%)
37 (2.5%)
20 (2.2%)
The propensity for appeals appears consistent over time. There has been a slight decrease in 2014 from the percentage in 2005/06 and 2009/10. In 2005/06 and 2014/15, only 1 appeal had costs awarded to the local planning authority, whilst in 2009/10 there were 2 authorities that had an appeal where costs were awarded to the local planning authority. The number of appeals with costs awarded to the appellant is slightly higher. There was only 1 appeal with the costs awarded to the appellant in 2005/06, however there were 3 in 2009/10 and 4 in 2014/15. This shows a slight increase in the number of appeals where the appellant is awarded the costs in each of the years that data has been collected. 4.5.2 Pre-application advice Local authorities that completed the survey provided various details on the pre-application advice that they carried out. Around 79% of authorities provided a response to this question, however some of the responses did not provide information on each sub category. Information was requested on the number of paid and unpaid pre-application sessions, the number of applications considered initially invalid and the number of applications resubmitted as a ‘free go.’ It has been commented on by more than one authority that unpaid pre-application advice sessions are not monitored (indeed many authorities do not always record such informal advice within their systems at all) and this should be considered when looking at the graph below. Another authority commented that a paid pre-application service was only introduced in January 2015.

59
Figure 4-11: Average numbers of pre-application advice sessions
The graph illustrates that on average there were no paid pre-application sessions across the NW region in 2005/06 and 2009/10 but this changed and there were on average 107 paid sessions in 2014/15 per authority. The average number of unpaid sessions was higher in 2005/06 and 2009/10 however this decreased in 2014/15. In 2014/15, a total of 9 authorities had paid pre-application sessions (over half of respondents), 5 of the authorities held less than 100 sessions but the others all held more. A metropolitan authority had 266 paid pre-application sessions, another metropolitan authority had 166 paid sessions, and 2 of the urban authorities held 150 and 104 sessions. In 2005/06 only 2 authorities had (or recorded) unpaid pre-application sessions, a metropolitan local planning authority had 20 and an urban authority had 694. In 2009/10, 5 authorities had unpaid pre-application sessions. Only 4 authorities had unpaid sessions in 2014/15, a metropolitan authority had the highest with 130 unpaid pre-application sessions. The number of applications considered initially invalid has been very varied between authorities but it has increased over the last 10 years. A metropolitan borough had 1,461 applications considered initially invalid in 2014/15 which is more than double the second highest figure who had 682 applications. Only 6 authorities gave data on the number of applications resubmitted as a ‘free go’ and since 2009/10 the average has remained fairly constant. Overall, the average number of pre-application advice sessions has increased each year. There were 60 sessions held on average in 2005/06, 90 sessions in 2009/10 and an average of 103 sessions were held in 2014/15.

60
Ombudsman complaints To understand perceptions and actual performance issues, a question was included on the survey to obtain figures relating to ombudsman complaints, and the result(s) of those complaints. The incidence of complaints can indicate challenges to the performance of an authority around quality and procedural issues that may be occurring across the service including both officers and members. The response rate varied for each year but 64% of authorities who completed the survey provided a response to all, or part of this question. In the table below, the average number of complaints per authority that responded has been calculated. Table 4-3: Average number of planning related complaints lodged with Ombudsman and the percentage of these complaints concerned with development management, formally investigated and upheld
2005/06 2009/10 2014/15
Average number of planning-related complaints lodged with Ombudsman per planning authority
1.67 4.16 4.25
Percentage of planning-related complaints lodged with Ombudsman of which about development management
60% 60% 79%
Percentage of Ombudsman complaints formally investigated
80% 36% 32%
Percentage of Ombudsman complaints upheld compared to those lodged
0% 8% 9%
In short, complaints have increased, fewer are investigated, but a comparatively consistent number are upheld. The number of planning-related complaints lodged with Ombudsman has increased over the last 10 years. In 2005/06, 60% of the complaints were about development management and this remained constant in 2009/10. In 2014/15 the proportion of planning complaints that were about development management rose to 79% which implies that there are slightly higher levels of dissatisfaction with (and/or propensity or willingness to complain about) development management service than other parts of the planning service. In 2005/06, 80% of the complaints were formally investigated and none of these were upheld. In 2009/10, 36% of complaints were formally investigated and 8% of these were upheld. The percentage of complaints formally investigated in 2014/15 was 32%, and 9% of the total complaints raised were upheld. This suggests a potential decline in service quality, although the small numbers of cases mean it should not be interpreted as reflective of the overall service.

61
4.6 Practice changes 4.6.1 Revisions in services Local authorities were asked to identify if any of the following have occurred in the last 6-10 years, last 3-5 years and the last 2 years:
revised scheme of delegation;
revised local validation checklist;
revised committee protocol (size, frequency, quorum etc.);
added application (workflow) tracking software; and
undertaken IT system upgrade (application database and/or document management). The survey required that respondents ‘ticked’ if any of the changes had occurred within those timescales therefore they could select numerous options for each timeframe. The table below shows the percentages of authorities that have experienced any revisions in those services. There was a response rate of 93% for this question from those authorities who completed the survey. Table 4-4: Revisions in services experienced in the specified timeframes. The percentage shows the percentage of respondents that underwent a revision
In the last 6-10 years
In the last 3-5 years
In the last 2 years
Revised scheme of delegation 57% 57% 43%
Revised local validation checklist 43% 43% 57%
Revised committee protocol (size, frequency, quorum etc.)
21% 36% 50%
Added application (workflow) tracking software
7% 36% 14%
Undertaken IT system upgrade (either/both application database and/or document management)
50% 64% 57%
A rural authority did not select any of the revisions as occurring in the timescales, which could indicate they have not had them. For the remaining authorities, service revisions have remained fairly constant over the last 10 years for delegation, validation and IT system upgrades. Assuming the workflow software is a first-time installation and not an upgrade, around 57% of Local planning authorities now have some form of workflow tracking software. Revised schemes of delegation did see a slight decline from 57% to 43% in the last 2 years. This reduction may be due to changes in committee arrangements with a 14% increase between 2009/10 and 2014/15 in the number of Local planning authorities revising committee protocol. There has been an increase from 43% to 57% in revised local validation checklists. DCLG’s Planning Practice Guidance is clear that local validation checklists cannot be used once more than two years old, and that they should be reviewed at least every two years.26
26
http://planningguidance.planningportal.gov.uk/blog/guidance/making-an-application/validation-requirements/local-information-requirements/ (Paragraphs 039 and 043). Accessed July 2015.

62
5. Stakeholder engagement 5.1 Introduction This section sets out the findings from the focus group and interview elements of the research. Two focus group sessions were held as part of the research, the first session aimed to test the emerging issues whilst the second session discussed the findings and tested a range of potential solutions (asks and offers). A range of public and private sector participants were invited to the focus group sessions, these included the following: Public sector:
heads of planning from the NW authorities;
development management leaders from the NW authorities; and
planning policy leaders from the NW authorities. Private sector:
planning consultants;
developers;
house builders;
professional bodies and representatives;
property consultants; and
multidisciplinary firms. Both small, medium and large scale companies were invited as well as those from across the different former county areas of the region to ensure the discussion would be representative of the whole of the North West. In total there were 25 participants in attendance at the first focus group session, the participants were seated in three groups, and this comprised two private sector only groups and one public sector only group in order to encourage open and honest discussion. Each group had a facilitator and a note taker enabling full detailed notes to be taken for the session. All participants’ responses have been anonymised. Following the first focus group session, ten face-to-face and ten telephone interviews were conducted, again with a range of private and public sector participants, some of whom had attended the first focus group session. The interviewers used a list of set questions which were tailored for the face-to-face, telephone and public and private sector interviews. The questions are attached at Appendix D. Notes were taken by the interviewer and have been used in this section however all responses have been anonymised. The second focus group session involved eight participants. The purpose of the second focus group was to discuss the potential solutions and engender debate and discussion. To enable this the private and public sector participants were mixed in one group. A facilitator steered the discussion and a note taker enabled full detailed notes to be taken. Again, all participants’ responses have been anonymised.

63
A large amount of anecdotal and qualitative evidence was collated as a result of this part of the research. The four themes which have been used throughout the report have been used to group the findings. Within this, certain sub-themes emerged as they were consistently raised by participants, these are set out below under the four themes. The first half of this section sets out the issues raised in terms of resources, budget and income, and performance, whilst the second half consider the practice changes which have been implemented or suggested in response to these issues. Reference to participants throughout this section relates to both focus group participants and interviews. Boxed case studies are provided to supplement the analysis with examples. 5.2 Resources 5.2.1 Staff reductions Staff reductions and the overall loss of resources has been a key area of discussion within both the interviews and focus groups. Anecdotal evidence suggested that local authorities have experienced huge reductions financially and staff numbers have been significantly impacted by this. Between 2010 and 2013, one local authority reported that planning policy staff had been cut by 33% and development management staff had been cut by 20%. One authority revealed that when staff left they were not being replaced which meant that staff numbers were consistently reducing, despite the ‘establishment’ remaining the same. Many of the participants felt that although staff loss in general was a major issue, the biggest issue was that the most knowledgeable and senior staff were often the ones who left. These officers were considered to hold members’ respect and were happy to ‘make the difficult decisions’. There was a perception that as these more-experienced staff were often older, they tended to leave as a result of early retirement or voluntary redundancy and thus it was felt that experienced staff losses were opportunistic and not structural. This is considered further in Section 6.2.4 below. Many of the private sector consultants that participated in the interviews and focus groups reported that from their experience in dealing with Local planning authorities, they had felt there had been a general decline in the number of staff working in local authority planning departments. Their awareness had often stemmed from the inability to get in contact with planning officers to discuss applications, with the larger local authorities harder to engage with. Cut backs in staff have various outcomes for the private sector, the first being that there is less certainty in the department. The second is that there is a discontinuity in staff which can result in a poorer service as different people are working on the application. In tension with this is the increasing local planning authority practice of ‘channel-shifting’ enquiries using website resources and customer care centres to try and minimise enquiry escalation to case officers whilst at the same time encouraging paid pre-application advice. One consultant also acknowledged that there is a resource issue but felt that it was as much to do with the “convoluted way of plan making” as it was about staff reductions. Issues relating to the plan making process were identified by other consultants who raised the issue of the lack of resources specifically in planning policy teams combined with the complexity of the Government’s plan making system resulting in considerable time being required to produce a local plan when resources are already thin and/or stretched.

64
One consultancy is in a unique situation regarding the resourcing issue in local authorities as in one of their offices, they mainly work on behalf of local planning authorities filling in any gaps. During the interview it was explained they had not experienced any actual issues or delays in getting responses from officers although anecdotally they are aware that they are struggling with resources. This consultant believed that planning departments are “stretched as far as they can go” which is why they are turning to consultancies. The first focus group revealed that people felt Local planning authorities did not have enough resources to do any ‘goodwill’ work that they would have done a decade ago. A number of private sector consultants in the focus group identified that the biggest cost to their business was due to delays that are related to local planning authority staffing and resources.
5.2.2 Loss of technical/specialist staff The evidence identified that technical and specialist staff appear to have been cut from Local planning authorities across the North West at a considerable rate. A problem the private sector faces is the lack of access to specialist officers in the local planning authority. One of local authorities identified that they had lost landscape staff as well as other specialists. Each local authority expressed that they have had lost different types of technical staff as they are not seen as the core planning officers. This has resulted in some authorities outsourcing their technical work and for others the officers that are left have had to absorb this work when they do not have the knowledge, or time, to do so. The focus group revealed that as authorities often do not have access to specialists, they are required to either outsource or share technical staff between authorities however this outsourcing tended to increase their workload and resulted in the officer having less time to talk to applicants. One consultant has been increasingly filling gaps in specialist advice over the last five years, and has received more case officer work from the County Council. This is because of the lack of specialist advice so authorities are having to outsource advice.
Local planning authority
One local planning authority has had a significant change in staff numbers which was explained in an interview. In 2001 they had 16 policy staff whilst now the only have eight, and the majority of these losses have occurred in the last five years. They also have three development management teams which each used to have nine or ten members of staff in whilst now they have only six or seven. The staff being interviewed did reveal that structurally development management “aren’t too bad” but that the problem is the lack of technical support and enforcement. To add to the decline in numbers, the authority has been “left with staff all aged 35-50” which is because the older and more senior staff had a “better redundancy package.” This issue is exacerbated as there is no recruitment happening within the department.
The loss of the development management leader means that they have not update procedures, the information of the website, pre-application meeting charges or Section 106 policy. It was said that they “fly by the seat of our pants” with Section 106 policy as it is very old.

65
A consultant in an interview revealed that they have experienced problems because of the loss of specialist staff within departments. As specialist input is now often outsourced, delays are more common as both the outsourced specialist advice and the local planning authority come back with queries. Another area that was reported as being affected is Section 106. A number of Local planning authorities and consultants said that the lack of staff has resulted in delays in Section 106 agreements being signed as no one is overseeing them and the lack of senior staff limits renegotiation on Section 106 requirements so ultimately the authority loses out on potential funding. An local planning authority reported that as planning officers no longer have Section 106 advisers within the department, this means they have to go to an external solicitor which causes delays. The solicitor often deals with multiple authorities and therefore is “not akin to what the authority is prepared to accept.” 5.2.3 Structural changes Anecdotal evidence suggests that local authorities have undergone structural changes in recent years to try and mitigate against the loss of staff and to keep all services running with reduced resources. Participants noted that some local authority planning departments have undergone more severe reorganisation than others. The restructure and merging of previous authorities was identified by one consultant as one of the biggest causes of delays and the particular authority that was being commented on was interviewed. The interview revealed that the authority had struggled with the reorganisation as the changes had not been fully implemented when the cuts began, resulting in a reduction in quality of service provided. The structural changes have been driven by cost savings as the decline has often been in the staff with higher wages rather than there being a strategic approach. This has led to an imbalance in the remaining teams. 5.2.4 Staff skills and experience During the first focus group session, it emerged that the staff members who were leaving authorities tended to be the more senior staff. One consultant in an interview described the problems stemming from the local planning authority being primarily composed of junior staff, resulting in pre-application, Section 106 agreements and discharge of conditions processes being “a nightmare” and less of a priority in the department. Both the public and private sector were sympathetic towards the junior staff given their lack of skills and the lack of experienced staff to train them and enable them to progress. The lack of training time available for junior staff was something that was mentioned particularly in the focus groups as they acknowledged that the few senior officers left in departments will have larger workloads comprising of the more difficult tasks so investing time in junior officers to improve their performance will be limited. One consultant also mentioned that the multitude of tasks faced by senior staff members in training junior staff and having higher workloads meant that it was difficult to form relationships with officers.

66
5.3 Budget and income 5.3.1 Amount of reduction Anecdotal evidence suggests that Local planning authorities have experienced reductions in their available budgets but the scale of these has varied between authorities. One authority estimated they lost £3/4 million in resources for planning between 2010 and 2012 and this was happening alongside staff reductions and consultancy work being postponed from the programme into subsequent years. Another authority reported having a 60% reduction in their budget in the last seven or eight years. 5.3.2 Expenditure Reduction in expenditure was considered to be a priority for councils. A number of authorities commented that budgets were unrealistic. One authority said that their income is offset against their overall budget with development management and building control having to pay a fee if they overspend however this overspend does often occur because of the unrealistic budget. It was also commented that permitted development changes have impacted upon budgets as too much time is spent on tasks that do not have any income. Another authority revealed that since the Comprehensive Spending Review there have been annual reviews that have affected the planning service as the council find ways to save money each year. The same local planning authority also stated that they do not recover the expenditure relative to the amount of pre-application work that they do. Local authority officers at the focus group noted that there had been instances where staff were forced to take periods of unpaid leave which had contributed to officers feeling demotivated. At one authority, staff had five days of enforced unpaid leave which had impacted on the goodwill of officers. At another authority there was a period of unpaid leave during the shutdown over Christmas.
Local planning authority 1
One authority lost a spatial planning manager and then lost another senior member of staff due to sickness but they were not replaced for a significant period of time until the leader recognised the problem. Another authority reported that five years ago they lost both the head of DM and head of policy and these staff had not been replaced. The same authority commented that the most common reason for the loss of senior staff within the authority was due to retirement, albeit it was unclear whether this included early retirement.
Local planning authority 2
One authority commented that they had stopped recruiting and as a result their staff were all staff aged 35 to 50 with those over 50 years old having left as a result of being offered good redundancy packages.

67
5.3.3 Risks to budget The budget of an local planning authority is constantly at risk due to the potential for the corporate core to seek further reductions, and the pressure for, or impression that, planning application fee income should pay for the entire development management function (i.e. not recognising non-fee applications, non-fee work on fee-related applications and non-fee work areas such as general enquiries, enforcement and appeals, aside from the ‘public good’ of planning policy). Another risk to local planning authority budgets was provided by a private consultant who explained that clients have requested a fee refund as their application took 26 weeks, and part of the Governments ‘Planning Guarantee’ commitment. This shows how poor performance can in turn reduce the income levels thus creating a downward cycle. 5.3.4 Sources of income It was noted by participants that the planning department is one of the few areas within a council that actually has a source of income however the level of cost recovery was discussed as an issue. One consultant acknowledged that for major applications the planning fees and pre-application fees just about cover the costs but for householder applications local planning authorities lose a significant amount of money and the way this is dealt with needs to be addressed. During the focus group, there were differing opinions on the idea of Local planning authorities setting their own application fees with one of the private sector groups commenting that this would be a “nightmare.” Some authorities charge for pre-application advice and one authority described this as a good source of income commenting that their fee was “about right” for cost recovery given the pre-application process could be time consuming. Another authority explained that they had introduced pre-application fees in 2011 which they had not done previously. They also said that the service is bolstered by money from the Homes and Communities Agency which helps to support planning policy. However given that they have experienced several years of low completions and until last year the number of new starts has been low, this additional income source has suffered but they anticipate the figures will increase from this year. Up until 2010 this authority had been reasonably well resourced in financial terms and this was bolstered in part by PDG and other external funding sources. One authority felt that the performance culture had gone and this was especially since the PDG was stopped and performance is therefore now not a priority for management. It was also felt that they needed to review their pre-application charges, which is currently in three tiers. In particular, the authority suggested they may need to start charging for pre-application advice in relation to householder applications which they do not currently do. Given that the income provided to Local planning authorities from application fees comes from the private sector, there were mixed views from the private sector interviews on the level of costs relative to the service received. One consultant felt that application fees are high and for larger scale applications, the service is not representative of the money you receive for it. However another consultant commented that application charges were reasonable compared to the prices that consultants charge for documents to support applications. One criticism a consultant gave to Local planning authorities is that some have internal service charges for providing advice between departments which removes the ethos of collaboration and removes the potential for knowledge to be shared.

68
5.3.5 Uses of income from planning activities The planning department was identified by participants as one of the only departments that has a source of income, however this income is not necessarily seen by the department. One authority said their income is absorbed into the overall council budget to support other parts of the service. Two authorities explained that the income from the New Homes Bonus is not seen by the planning service but it is given to other departments. One local planning authority said that the income received from the planning department is approximately £3 million whilst the running costs of the department is just £1million however this did encourage senior management to approve some new recruitment. One authority commented that where money was retained by the department, this money was not spent on improvements but went towards savings so it was not reinvested.
5.4 Performance 5.4.1 Development management Performance within the development management service was a key area of discussion within the interviews and focus groups. The participants were in agreement that the service had mainly been compromised due to loss of staff which has caused delays in determining applications. One authority has experienced a rise in the caseload of each officer which has resulted in poorer customer service and longer waiting times. In one local planning authority the head of planning has to do all major application as there are only two assistant planners to do the remaining work which means that they are not able to do any other part of the service. The officers in one authority are working harder than before and working longer hours to compensate for the loss of staff, therefore the performance figures for the end of March 2015 appear healthy but this hides issues that are below the surface. A consultant commented that they are aware that officers are carrying “10s of cases at any one time and are spinning plates” and also feels that applications have become more complex.
Local planning authority One local authority that was interviewed focused on the risks to their current budget and changes to the budget that may occur. The representatives that were interviewed said that they are expecting cuts in 2016 due to the cuts that are occurring in the grants that they will receive. They felt they had been disproportionately affected by the Comprehensive Spending Review however a key issue for them was that planning was not a priority service and the funding which was achieved by the planning department was absorbed by education and social services.

69
5.4.2 Policy During the focus groups and interviews a number of consultants commented on the lack of adopted core strategies/local plans amongst North West local planning authorities and it was felt that this had affected decision making as consultants and authorities were trying to work with out of date policies. Both the private and public sector felt that the progression of local plans had been slow not only due to staff reductions but also due to the ever-changing policy regime. Combined with this, the consultants felt there was inadequate training on producing and interpreting policy requirements which results in delays in policy production. One authority commented that their entire focus had been on producing the local plan and other areas have been ignored, particularly as the local plan has taken longer as a result of the 2010 changes and 2011 member input. The ever-changing range of Government requirements has also made the process longer. This local planning authority was concerned that if league tables were introduced for policy document production then they “will be in trouble.” The private sector consultants felt that out of date policies and the lack of clear policy context were causing issues for developers and preventing development. In particular there were problems with certainty and an increase in the level of risk. One developer said that the company is holding back schemes as they cannot justify the risk of taking developments forward with out of date policies, in one sub-region all authorities have either no five year housing supply or the policies are pre-NPPF. A number of participants expressed concern that the lack of plan making would have an impact in a few years when development that otherwise may have come forward would not. Similarly, a lack of proactive plan making, including engagement with developers means that development will not be encouraged to come forward and local authorities will have less influence on the location and type of development to meet their objectives.
Private sector consultant “The length of time taken for planning policy documents to be prepared means that the staff that did the previous Local Plan some 10 years ago have left by the time the new one comes forward and requires doing…” Local planning authority “It would be fantastic if the Government made no more announcements for the next five years. Sadly, things like last week’s Ministerial Statement on wind have meant we’ve had to do a lot of thinking “on the hoof” and seek legal advice on what it means for us which again takes time...It’s a back’s to the wall time of struggling to get a Plan out before the goalposts change again, maintain soundness and not feeling that you have enough time and resource to check all the details and options. All the time there is an awareness that some clever consultant (sorry, I know you have to do your job) is just waiting to find that dodgy bit of information to unpick your whole Plan.”

70
5.4.3 Appeals Anecdotal evidence suggests that the system is becoming ‘planning by appeal’ and this was discussed in the focus groups and interviews. One local planning authority has had an increase in applications being approved as they try to “sieve out” those likely to be refused before they are submitted so they have had very few appeals. A different local planning authority felt that the number of refusals has been fairly consistent but the number of appeals has fluctuated however there has been a noticeable increase in the success rate for appeals for developers. The private sector consultants had varying views on the topic of appeals. One comment was that the current issue is getting appeals registered whilst another said that appeals are seen as the priority and this is causing a delay in applications. This was validated by one participant who noted that half of the staff in an local planning authority had been drawn into working on an appeal. One consultant suggested why there had been an increase in appeals and that included that the appeal route is the only option when there are delays with major applications. A frequent comment from the private sector consultants was that the appeal route was not preferable to them however they are commercial entities and are often left with no other choice. 5.4.4. Planning Performance Agreements (PPAs) PPAs were described as not being “a part of the culture in the North West” in one of the focus groups even though they are “a popular tool in London and the North East”. One consultancy is working with a local authority to develop a PPA approach for major schemes which would result in the developer paying for inputs, especially for external scrutiny, including viability as this is currently a cost. The same authority commented that they had generally had positive feedback regarding PPAs as there is a recognition of the pressures and more talk on PPAs is currently occurring. Another local planning authority said that as they have very few large schemes (more than 100 houses) they do not see PPAs as relevant. A consultancy in an interview commented that they often use PPAs and these do work really well but there was a need to widen the use of PPAs. Anecdotally, some authorities now welcome use of a ‘PPA-light’ on smaller major schemes. The local authority sub group in the focus group raised the argument over whether a PPA does provide a better service and contribute to faster decisions, and whether it could actually help to improve the service. Their main concern was that it may take resources away from other applications and services that need to be provided which would increase the workload for all members of staff. This would likely result in an overall increase in the time taken to complete applications and other work as there would be another task added to the workload. Private sector participants were generally happy to pay higher fees either as application fees or PPAs if this guaranteed a better service, namely quicker with consistent advice. 5.4.5 Pre-application The performance of local authorities is very varied regarding the pre-application advice service. One consultant commented that some Local planning authorities will not put their output in writing and another commented that pre-application work is not prioritised. A point was also made that if the pre-application process is taking too long then it is sometimes not possible for projects to go ahead. An authority commented that the quality and quantity of their pre-application service is suffering.

71
The focus group and interview discussions on pre-application services revealed that the quality of service received varied widely between authorities with some consultants suggesting that those authorities who were more “desperate for development” provided a better level of service. One consultant revealed that they had to wait six to seven months to get a pre-application letter after they had paid £2,000. A different consultant felt that a better service is received from the authorities that charge for pre-application however another felt frustrated that they paid for pre-application and saw no results for 13-14 weeks and continued to experience delays when the letter came back. They felt that paying a fee around £7,000 and getting an inadequate service was pointless as they could carry out the work themselves. The private sector consultants generally felt they would be happy to pay a higher fee for pre-application engagement if they experienced a higher level of service. 5.4.6 Section 106 agreements Section 106 agreements have already been mentioned as an issue due to lack of resources, but there are also issues in terms of performance. One local authority said that a lack of staff has resulted in delays in Section 106 agreements being sought as there is no one to oversee it and negotiation is limited. A consultant described the process of Section 106 as “a nightmare” due to it not being a priority in planning departments. Another private consultant said that Section 106 is “a big issue” with particular focus on getting agreements in place as Local planning authorities will not put resources in until they have approval “in principle.” They also criticised the length of time taken by council solicitors and noted the hesitancy of council solicitors to use standard heads of terms. A comment by a private sector consultant was made that it was “strange” how each local planning authority has a different Section 106 agreement template. This was one of the priority areas identified for improving the speed of approving applications to enable development to commence on the ground. 5.4.7 Delays/time frames Throughout the interviews, comments regarding delays and time frames in the context of performance were given by the private sector consultants. One consultant felt that a reason for the extended timescales was because of the increased layers of bureaucracy; only one said that they had not noticed any delays. It was commented that from one consultant’s experience that if an application goes beyond the 8 or 13 week determination period, it becomes a “lost cause” unless there is PPA involved. They also stated that some clients are looking for a fee refund once the determination period extends beyond 26 weeks however this is not common (despite Government’s commitment in terms of the Planning Guarantee) as the consultants want to maintain good working relationships. The general feeling was that monitored determination timescales were met in most cases but the end to end timescales were the issue, these were described as being from “cradle to grave” consisting of the pre-application process, the determination, the discharging of conditions and the signing of a Section 106 agreement. These front- and back-end non-monitored timescales were highlighted in discussions as being “a real frustration” as there is no priority for local planning authorities to get these through; they are secondary to the determination of the application because this is monitored by government.

72
Consultants have become aware of delaying tactics in registrations, in one example it took five weeks to register an application, and they also commented on planning officers using extension of time agreements to ensure they do not fail to meet timescales. The private sector consultants raised significant concern that only targets that are measured are being met and that there is a significant amount of “hidden time” which is not shown by the statistics thus time frames are longer than the real reporting scales. The discharge of conditions was raised as a particular issue by the private sector as it was commented that it takes just as long or longer to get conditions discharged as it does to get the application determined. It was not yet clear how deemed consent might influence behaviour.
5.4.8 Skills, quality and morale Due to the changes in the overall performance of Local planning authorities, it was felt by the private sector that the morale of officers has changed and there are also certain types of work that can no longer be completed. One consultant when interviewed commented that the officers in post at the minute “give you 90% whereas in the past you used to get 110%.” They acknowledged how this was due to the pressures they are under and the lack of support and time they have to invest in the process. A consultant explained how they felt that negotiation skills and the ability to make a pragmatic decision has been lost from local authorities. A consultant also described the service as “too negative” and said that local planning authority officers are “storing up problems for three to four years down the line.” Local planning authorities have had to adapt their practices in order to accommodate the new structures that are in place around them and also as a way to mitigate against the resource losses that have occurred. A local authority that was interviewed said that the service was reliant on “good will and professional integrity” however quality has dropped. They feel that the job has become more focused on process than quality and that this will “have a long term effect on the quality of the built environment.”
Private sector consultant 1 An example was given that permission for 200 houses took 53/54 weeks to get from pre-application to determination stage and this was not including the discharge of conditions or signing of the Section 106 agreement. Private sector consultant 2 Another consultant commented that with one authority they had worked with, it had taken two years from submitting the application to getting the Section 106 agreement signed. The consultant stated that this time frame was common within “a couple of authorities.”

73
During interviews, two authorities mentioned work they are no longer able to carry out. One said that they need to review various guidelines that they currently have in place but are not able to do this due to the resource issue. They also said that extra services like preparing development briefs to address areas of change are not done as they are less proactive in the “extras.” Authorities also generally mentioned that they encourage people contacting them to use the website as this reduces the time officers spend on the phone.
5.4.9 Impact on development Performance issues from delays in Local Plan preparation and progression of planning applications also has an impact for the private sector. The lack of up to date planning policy and a five year housing supply is making it too commercially risky for some developers to justify the huge costs associated with preparing major planning applications. The increased time for the total planning application process, including pre-application, S106 sign off and discharge of conditions is resulting in delays and additional costs for developers bringing forward sites. One private sector consultant commented that planning delays have led to increases in private sector planning costs of around 10-15% to take account of time taken to chase and progress an application.
Private sector consultant 1 A private sector participant stated there are greater risks proceeding development without up to date Local Plans in place as they “cannot justify the cost and risk of going forward with out of date policies”. Private sector consultant 2 Another private sector participant stated “The Local Plan position affects strategic decisions, developers won’t speculate £0.25 million on getting an application through without certainty and they are more likely to go with allocated sites.” The time taken to complete the application process can be over two years for major applications, this combined with financial pressures are leading some developers to take risks from making a start on site without fully discharging conditions. Private sector consultant 3 To respond to these issues a private sector developer stated “Some authorities have developed successful relationships and are flexible so developers are starting to prioritise these (authorities), speed is critical for developers as the market is moving to we need the local planning authority to act in this way.”
Local planning authority “After 30 years I still enjoy planning – it’s just steering through the bureaucratic and adversarial elements that is so dispiriting at times.”

74
5.5 Practice changes This latter part of the stakeholder engagement findings focuses upon practice changes, both in terms of existing changes which had already been made as well as ideas for future change. For ease of reference the findings on practice changes have been grouped by the theme issues set out in the preceding section: resources, budget and income, and performance. Albeit it is recognised that these changes are relevant across multiple issues and will improve the overall service as a whole. 5.5.1 Resources Responding to resourcing gaps In response to resourcing gaps and staff shortages, a number of private sector consultants cited good practice examples involving the secondment of private sector staff to Local planning authorities on an ad hoc part time basis. There were examples of the private sector being brought in to manage major complex applications and others where authorities managed the larger application and the consultant dealt with the “churn” of smaller applications. Participants felt that this was beneficial in dealing with peaks and troughs in workloads. One private sector consultant interviewed cited the example of a secondment to an local planning authority in order to provide specialist design advice within the authority. During interview, one local planning authority raised the idea of introducing a “framework with planning consultancies” in order to deal with peaks in workloads or staff sickness and holidays, and further to this to have ‘on call’ staff available to Local planning authorities to provide technical input for example on viability or flood risk. It was noted by some that there was issues with procurement processes in introducing this. The private sector consultants felt that increasing the practice of outsourcing the production of evidence base documents should be increased via a more coordinated approach. One authority in particular in attendance at the focus group session outsources its entire development management section and this has been working well with the private sector commenting that they had not noticed much difference as there was still a case officer as the point of contact.

75
Both the private and public sector focus group participants suggested that the role between development management and policy should be blurred so that resources were pooled. The private sector consultants felt that in their roles they used expertise in both development management and policy and thus the public sector should do the same. In addition to this, a number of participants mentioned that more staff should be pooled between neighbouring authorities, or alternatively staff should be given short-term secondments to authorities within the sub-region, albeit it was accepted that this approach would lose local in-depth knowledge but as a positive it would enable staff to witness first-hand how other authorities approach the same tasks. A number of the local planning authority participants commented that they had already attempted to do this in some form. The private sector participants felt that it was particularly important to pool specialist staff between authorities given the anecdotal evidence suggesting problems in obtaining specialist advice. One private sector consultant cited the building control model where staff can easily move around. Overall, the private and public sector participants felt that improved coordination and collaboration between council departments was required and councils should act in more multi-disciplinary way. Similar to this, the increased use of agency staff was suggested by a private sector consultant when interviewed albeit it was recognised that it was important to ensure accountability and responsibility of the decisions to the authority. During the focus group, a number of participants highlighted that they felt that the cost of agency staff was extortionate.
Joint venture model There is an example in the North West of a local planning authority that outsources its development management work to a private consultancy. Both participants in the Joint Venture Model were interviewed which has enabled a more rounded picture to be presented. The local authority said that they have learnt that for the model to work there has to be trust and confidence and continuity of senior staff on both sides is helpful for this. The authority also said that they feel they are getting continually good value. The private consultancy undertaking the work explained that they have been brought in to help “deal with peaks and troughs” as well as providing resilience to help retain staff. The consultancy does not just work with one authority, but has worked with 80 across the UK, particularly when resources are constrained and there is an immediate need. The consultancy provides support for those who need specialist input and help with major projects where they have limited experience however this work is decreasing as local planning authorities want to retain major applications for staff benefits. Although most staff do have other work streams, there are some staff that are focused on the one authority in particular which allows relationships to be formed. The consultancy and authority have monthly performance meetings, discuss any changes and define the forward resource to outline the consultancy staff required, as well as understand the authority’s current performance focus. The consultancy also looks to help the authority with savings, any business case for improvements and some of their profit is fed back to the authority.

76
Some softer day-to-day measures currently being employed by a number of private sector consultants which were identified in both the focus group sessions and in interview include offering increased assistance to Local planning authorities by drafting elements of the officer’s report or committee report, or drafting conditions, and it was felt that planning officers could do more by making the best use out of consultants. Furthermore, those private sector consultants who had good working relationships with officers stated they had provided free advice and facilitator workshops to certain authorities. The relationship between peaks in funding and access to additional resources was noted. In particular, it was felt that funding from PPAs could only be effective if authorities had access to a flexible source of staff to help them respond. If this was not the case then the risk would be that PPAs would cause the service delivery to decline for other applications. Improving local planning authority staff recruitment and retention In response to the issue of staff recruitment and retention, a number of private sector focus group participants, some of which had previously worked in Local planning authorities commented that a better career or reward structure needed to be implemented. Similarly, it was felt by both public and private sector participants that more qualified resourcing was required as well as an increase in planners entering the public sector more generally as anecdotal evidence suggested that graduates entering the profession were not considering local authorities as an attractive career opportunity compared to the private sector. The focus group participants mentioned the use of university bursaries which required graduates in receipt of these to work in the public sector for a number of years however it was not known whether such funding was working in practice and whether this was still ongoing. 5.5.2 Budget and income Cost recovery There were fewer suggestions within the focus groups and interviews in relation to practice changes to deal with budget and income issues. One private sector consultant suggested separating householder applications from the normal application process given the disparity between cost level and cost recovery. One local planning authority suggested undertaking a review of the actual cost of providing a pre-application service to ensure that the true costs were understood. It was felt by all focus group participants that there needed for greater protection to be afforded to planning service budgets however participants were unsure on how this could be done. One private sector consultant felt that the Government needed to better understand the value added from planning both in terms of the money from application fees but also the value added from new development. It was commented by the public sector participants that there was a need to ring fence income sources to ensure that they are fed back into planning, in particular this included grants such as the New Homes Bonus. Both the private and public sector focus group participants agreed that increased devolution to certain councils to provide greater freedom to manage budgets and channel money into planning services could be beneficial.

77
5.5.3 Performance Responding to rising caseloads In response to the issue of the rising caseloads of officers and the resultant delays and impacts on customer service, a number of private sector consultants commented that an increase in admin staff or the use of project management staff to deal with “process” issues would enable planning officer time to be freed up to focus on “planning issues”. A smaller scale measure suggested by one local planning authority involved reducing the availability of calls on the planning advice duty line in order to free up officers’ time. A number of private sector consultants felt that more fundamental changes to the system were required in order to reduce officer caseloads by giving officers greater delegation and more discretion in decision making. One consultant when interviewed commented that they had noticed a difference in the system compared to 20 years ago when a minor amendment could be authorised simply by a letter from the officer, but this had been wiped out by recent changes. One private sector consultant felt that greater permitted development rights were required for very minor changes.
Plugging the policy vacuum In relation to the issue of slow local plan preparation and the policy vacuum, a number of private sector consultants recommended that better clarification from Government was required on how to prepare local plans and the idea to further streamline policy recently announced by the Government was welcomed as a positive step. One consultant when interviewed felt that a move towards more strategic plans rather than detailed documents would be beneficial whilst another recommended the introduction of a standardised methodology for aspects such as objectively assessed need in order to avoid local nuances. One local planning authority commented that the use of joint evidence base studies should be increased, for example Strategic Housing Market Area Assessments or retail studies.
Private sector consultant “One thing we are guilty of is making changes throughout the application process and post-decision e.g. introducing bi-fold doors throughout our entire portfolio as this is what the market wants, however this has meant we have had to do non-material amendment applications across our whole portfolio to introduce these. Therefore a greater amount of permitted development will enable less work for the authority and enable such small changes to take place.”

78
Reducing delays Model processes and standards During the focus groups and interviews, the private sector consultants commented that a key way of reducing delays in the process was by increasing the standardisation of documents for example having model conditions and standard committee reports, or having standard Section 106 heads of terms across Greater Manchester or across neighbouring authorities. In parallel with this, one private sector consultant commented that the discharge of conditions process should be slim-lined to include a critical look at whether conditions were necessary. These comments stemmed from the identified problems of delays with the ‘back end’ of the application process. One local planning authority also commented that the validation process needed to be streamlined. Proportionality One private sector consultant felt that the information requirements for applications needed to be reviewed and should be streamlined to only include proportionate evidence on what was strictly necessary instead of the existing “better safe than sorry” approach. On the other side of the coin, one private sector consultant noted the importance of planning applications being submitted by properly qualified professionals to ensure that correct information was being submitted in the first instance and thus to avoid delays. IT systems During the focus group session, the participants commented on the need for more investment in IT facilities in particular focusing on relaying information quicker, via real time application updates and consultation response uploads. It was felt by the participants that this would reduce the number of phone calls to officers from applicants requesting updates and would allow officers more time to spend on actually determining applications. One consultant noted that map-based planning search facilities were better than list or address based facilities. PPAs The private sector consultants referred to the use of PPAs and noted the need to widen the use of PPAs with the possibility of attaching sanctions where PPA deadlines were not met. Some consultants felt that the principles underpinning PPAs could be utilised more widely, one emphasised the importance of building up good working relationships between officers and applicants, “…like having a PPA without having a PPA”. This could be classed as a ‘PPA Light’ whereby no money was attached to it. During the focus group session, a number of private sector consultants revealed that they would be willing to pay more for applications in order to receive a premium service, almost like a ‘PPA Plus’, although it was noted that in order for this to be successful there would have to be a guarantee of some sort to meet targets. This was because the consultants felt that they were subsidising other applications anyway and it was taking longer for them to get a decision. This linked to a more fundamental issue raised during the focus group session which was the problem of how performance was being measured by the timescale for determination and this didn’t consider the full determination period including Section 106 agreements and then considering the time between the decision being issued and actual delivery. It was felt that an alternative to this measure was required however it would need to be a two way process in which the council’s validation letter would set up the council’s side of the bargain and what they would agree to do.

79
One private sector consultant commented that there was something to be learnt from the Nationally Significant Infrastructure Project process. Consistency In order to prevent development being delayed, one private sector consultant suggested that certain applications should be prioritised with senior officers in major teams specifically dealing with large scale applications. Overall, both the public and private sector participants emphasised the need, where possible, for consistency in officers dealing with applications from the pre-application stage right through to determination and the discharge of conditions and signing of the Section 106 agreement thus ensuring there is single ownership of the application process. The private sector felt that processes within Local planning authorities needed improving to allow this to happen. Improving morale and working relationships In order to respond to the issue of poor customer service and poor performance in development management, the focus group participants agreed that improved working together was required and certain behavioural changes were needed both within local planning authorities and the private sector. One consultant commented that there needed to be more empathy and understanding for local planning authority officers in order to rebuild trust on both sides. Another private sector consultant felt that local planning authorities needed to understand the impact of their decisions upon the industry. More collaboration with other professions in the built environment was also raised during the focus group, including with architects as a means of improving the quality of design. One private sector consultant raised the idea of reintroducing development forums which had previously been used in the past to bring together developers, local businesses and local authorities, this would be aligned with the private sector providing more feedback to Local planning authorities. In addition to this, the consultant felt that an annual review of how the local planning authority was doing and what improvements they could make on a constructive basis would be beneficial. During the focus group session, the private sector consultants felt that local planning authorities should explore opportunities to share good best practice and also bad experiences which should then become the norm across the North West.

80
6. Conclusions and recommendations 6.1 Introduction This section of the report sets out the conclusions and recommendations from this research. It first highlights key findings grouped by the research themes of resource changes; budget and income changes; performance and practice changes. Next, it sets out a range of recommendations focused on ‘asks’ and ‘offers’. The ‘asks’ are directed to both government and council leadership incorporating chief executives and council leaders. The ‘offers’ summarise the practice changes which could be taken forward by North West local planning authorities with the support of professional bodies such as the RTPI, RIBA and Government agencies such as PAS (and the LGA) and ATLAS. 6.2 Key findings 6.2.1 Resource changes The research findings identify significant reductions to public sector planning services. Between 2010 and 2015 for those North West authorities who responded, the survey data shows there has been an average reduction of 37% of planning policy staff and an average reduction of 27% of development management staff. Prior to this, between 2005/06 and 2009/10 the survey data and CIPFA analysis show an 8% increase in planning policy staff and a 7% in development management staff, but CIPFA stopped collecting data on planning staff numbers after 2010. The survey analysis shows for those authorities who responded, over the last 5 years staff losses have not been offset by staff gains. There has also been a shift in the last year from reliance on retirements and voluntary redundancy to use of mandatory redundancy packages in 2014/15. Where recruitment has taken place, there has been a move towards recruitment of temporary staff in 2014/15 alongside a slight increase in graduate recruitment. For development management, between March 2006 and March 2015 the greatest percentage reductions have occurred for admin/support and planning officers. In comparison, for the same period the greatest percentage reductions have occurred for technicians, planning officers and managerial staff working in planning policy (see Table 6.1). The issues arising from losses for these types of roles have been explored through the qualitative research. This shows officers are having to take on a more varied role to fill the gaps left by staff losses.

81
Table 6-1: Percentage change in the average number of FTE staff in development management and planning policy teams
Role Percentage change between 31st March 2006 and 31st March 2015
Development management Planning policy
Overall 27% reduction 37% reduction
Admin/Support 50% reduction 25% reduction
Technician 25% increase 33% reduction
Planning Officer 23% reduction 33% reduction
Senior Planning Officer 16% reduction 5% increase
Managerial 20% reduction 30% reduction
Evidence from the focus groups and interviews shows planning officers are increasingly tied up with process related matters that would have traditionally been managed by admin and support staff. This is detracting from officers spending time on planning matters. At the other end of the scale, the loss of between 20-30% of managerial staff in development management and planning policy has resulted in loss of senior knowledgeable staff who were used to engaging with members, had long standing relationships with developers and were able to apply a proactive approach to decision making. 6.2.2 Budget and income changes The literature review and CIPFA data both show disproportionate reductions in North West local planning authority budgets compared to overall local government spending reductions. The average net expenditure on development management in North West authorities decreased by 27% between 2009/10 and 2013/14. The average net expenditure on planning policy in North West authorities decreased by 18% between 2009/10 and 2013/14. The survey analysis shows between 2009/10 and 2014/15 expenditure for planning policy decreased by 48% and for development management decreased by 37%. Evidence from the stakeholder engagement supports these findings with one participant reporting a 60% reduction in their budget in the last 7-8 years. As a result public sector planning services have been left to manage increasingly constrained and challenging budgets which often do not reflect the true costs of service delivery. Despite the budget changes, public sector planning services generate significant levels of income from a variety of sources including:
pre-application fees;
planning application fees;
planning performance agreements;
cost awards (from planning appeals);
grants (including New Homes Bonus);
retailed Section 106/CIL contributions; and
service level agreements/trading account recharges.

82
The baseline analysis shows the average New Homes Bonus received by local planning authorities in the North West in 2014/15 was £16 million, this compares to £1.5 million average Planning Delivery Grant received in 2008/09. It is not clear to what extent this money is retained by, or used to improve, the planning service. There are also, as with Planning Delivery Grant, risks associated with both increasing deadweight over time and challenges associated with transitional arrangements and maintaining services post-New Homes Bonus. Of those authorities that responded to the survey, the average income from planning applications was £884,000 in 2014/15 an increase of 21% compared to 2009/10. This is despite an overall reduction in the number of applications received. However when analysing average fee income for applications across North West local planning authority, CIPFA data shows there is a reduction of 7.6% between 2009/10 and 2013/14. One local authority reported that income into the planning service from New Homes Bonus grants amounted to £3 million, this compared to service operating costs of £1 million. This highlights the potential income generation and added value planning services can contribute to the public sector. The research findings show that whilst public sector services have the potential to generate significant levels of income for a local planning authority, this income is not ring-fenced for re-investment in planning services and tends to be absorbed into overall council budgets. Evidence from the focus groups and interviews show income received for planning applications does not currently cover true costs with fees for major applications covering the costs of minor and householder applications. Section 5.3.3 of this report shows “for householder applications Local planning authorities lose a significant amount of money and the way this is dealt with needs to be addressed.” Anecdotally, Local planning authorities set their pre-application fees using a mixture of internal planning budget-based full cost accounting (noting that not all planning service costs are borne from the planning budget) and levels that will encourage or incentivise take-up. If any service offer is under-recovering its costs, by definition it is being cross-subsidies by either other fee-paying work and / or the public purse. Poor performance is also putting income at risk whereby clients are requesting fee refunds for applications that take longer than 26 weeks to determine. One research participant felt that performance culture has gone since the Planning Delivery Grant was replaced and it is no longer a priority for management. The relationship between performance, grants and income should be considered with the potential to benchmark performance against income levels. 6.2.3 Performance Evidence from the focus groups and interviews shows performance remains an issue in terms of time taken to determine applications and delays in preparation of local plans. Despite this, the baseline analysis of performance figures show local planning authorities have remained consistent achieving around 70% of decisions on minor and major applications within 8 and 13 weeks respectively. This is due to government targets focusing on the determination stage rather than the end of end application process. The survey considered a variety of elements to assess performance including analysis of the pre-application stage, percentage of appeals over the last 10 years and analysis of formal complaints to the Ombudsman over the last 10 years. In terms of the quality of information coming into public sector planning services in the North West, there has been an average increase of 30% over the last 10 years in the number of applications initially considered invalid. The average number of sessions considered invalid in 2014/15 was 641.

83
This places a burden on a local planning authority due to the time taken to process and identify the application as invalid, plus time taken to advise on changes needed prior to validation. The research found until recently Local planning authorities also spent time giving free pre-application advice and it was not until 2014/15 that North West authorities introduced paid pre-application sessions. When assessing local planning authority performance, the survey highlights the variation between perceived performance issues and actual performance issues. Concerns have been raised regarding a perceived increase in ‘planning by appeal’. The survey analysis, for those authorities who responded, shows in comparison to the average number of applications submitted over the last 10 years, the average number of appeals has remained at around 2% of applications with a slight decrease in 2014/15. Both the survey and stakeholder analysis show in recent years there has been a noticeable increase in the success rate for appeals for developers. The difference between perceived issues and upheld complaints is also demonstrated by analysis of complaints to the Ombudsman. The survey shows, for those authorities who responded, between 2005/06 and 2014/15 planning-related complaints lodged with the Ombudsman has increased by 82%. Around two thirds of complaints lodged are about development management, however in 2014/15 only 9% of complaints lodged were upheld following formal investigation. The research findings for performance identify the development management service was a key area of discussion with interviews and focus groups. There were issues raised around delays in determining applications caused by loss of staff, with remaining officers working longer hours to compensate for cutbacks. This approach means performance issues are hidden below the surface as officers are still meeting the government targets of 8 and 13 week for determination although the end to end process from pre-application to discharge of conditions is taking up to 2 years in some cases. With regard to pre-application advice, the research found that performance in this area is varied and there is no relationship between quality of service for paid and un-paid advice. At the other end of the application process, concerns were also raised regarding the time taken to sign off Section 106 agreements due to availability of council solicitors, use of different Section 106 heads of terms across Local planning authorities and availability of public sector resource to manage negotiations. The qualitative analysis highlighted that delays, particularly in the plan making processes were not just due to staff reductions but also as a result of the ever-changing policy regime. The Government announcement as part of the 2015 summer budget to set a deadline for local plans to be complete by 2017. This means local planning authorities will have to continue to prioritise local plan production to the detriment of other areas of monitoring, advice and plan making. Overall, increased work pressures has resulted in a reduction in performance with public sector planning services reliant on “good will and professional integrity.” Public sector planners have a lack of support and less time to invest in the process, with less ability to make pragmatic decisions. Restructuring of public sector planning services combined with planning regime changes at the national level has led to a greater focus on process rather than quality, and this is likely to have a long-term effect on the built environment. The complexity of delivering development means it is not possible to provide quantitative evidence that delays or reductions in delivery of development have been caused by public sector resource reductions. However, qualitative evidence from the interviews show delays in Local Plan preparation and progression of planning applications has cost and financial risk impacts for the private sector.

84
Development is being affected by the additional time taken to progress applications and costs associated with delaying commencement of development. For example one private sector development stated extended planning application processes were adding 10-15% to costs. Others were having to take risks by starting development without fully discharging conditions. Developers are also unable to risk preparing applications in some areas where there is a lack of planning policy due to the additional costs arising from the uncertainty and increased risk. 6.2.4 Practice changes The literature review identifies practice changes that could be introduced by North West Local planning authorities. This includes ensuring staffing levels take account of the volume of work involved in the determination process informed by benchmarking of caseloads; shared services either through joint delivery with neighbouring authorities or in conjunction with the private sector; use of clearly defined processes, guidance and validation requirements; and engagement with councillors at the pre-application stage. Other recommendations from the Killian Pretty Review in 2008 relating to revised performance measures and financial incentives have not been fully-realised. The survey shows public sector planning services have responded to resource and budget constraints through a variety of ways including use of a revised scheme of delegation; use of a revised local validation checklist and processes supported by IT system upgrades. There was a slight reduction of 14% in the number of authorities making use of the revised scheme of delegation in the last two years. At the same time, there was an increase of 14% of authorities revising committee protocols in the last two years. A range of solutions and practice changes were explored through stakeholder engagement with participants discussing solutions relating to the themes of resource, budget and income and performance. In terms of responding to resource gaps potential solutions identify the following which are explored further in the section on ‘asks’ and ‘offers in Section 7.4:
secondment of private sector staff on an ad hoc basis to either deal with churn of smaller applications or manage major applications;
co-ordinated outsourcing of evidence base documents to inform the plan making process;
consideration of joint venture and other alternative service delivery models;
pooling of staff between neighbouring authorities or secondment to neighbouring authorities;
making use of private sector consultants to draft pre-application minutes, committee reports and conditions; and
use of PPAs to assign resources to applications and set expectations regarding determination timescale.
To address budget changes the research found public sector planning services needed to address cost recovery issues with regard to minor and householder applications and pre-application discussions. This should be combined with the greater protection of planning service budgets and potential ring fencing of income sources such as New Homes Bonus with re-investment back into public sector planning services.

85
In terms of performance, possible approaches to re-dress the quality of performance from public sector planning services include:
use of administrative staff or project management staff to deal with process issues, this would free up planning officer time to focus on planning issues;
use of benchmarking to monitor resourcing and caseloads to achieve a balance between efficiency and quality. A resource standard of 150-170 cases per FTE case officer is identified;27
use of it systems for real time progress updates for applications, this provides a central source of information and reduces the reliance on officers needing to respond to duplicate queries on the telephone;
use of proportionate evidence for both local plan preparation and scale of application submitted;
use of model processes and standards for committee reports, section 106 heads of terms and planning conditions;
use of planning performance agreements; and
designation of a lead officer from pre-application to discharge of conditions to ensure efficiency and consistency through the application process.
Planning Performance Agreements can be used to address performance issues and set expectations with both the applicant and local planning authority. The qualitative research found that PPAs are “not a part of the culture in the North West.” There is the feeling PPAs can be used in a positive way and provide a greater degree of flexibility to both the local planning authority and the applicant, however PPAs need to be adequately resourced and may only be applicable for larger schemes. The recommended practice changes are developed further in the ‘asks’ and ‘offers’ section (see section 6.4). 6.2.5 Local authority typologies The findings from the research have suggested that in terms of resourcing and performance there are broadly three types of authority in the North West. These can be termed ‘striving’, ‘surviving’ and ‘struggling’. An indicative pen portrait for each authority type is defined as follows: Striving:
Up-to-date plan and five year housing land supply
Policy continues to be monitored and developed
Evidence base is continually developed
Delivers applications within required timescales
Productive and timely pre-application discussions
Timely discharge of conditions and S106
Strong planning leadership with regular positive engagement with members and the chief executive
Manageable workload for development management and policy officers
27
This figure has been identified through work for DCLG on the best value indicator regime. It is a ‘desired’ benchmark taking account of efficiency and quality. The benchmark is calculated using normative judgement on the aggregate workload taking account of an average blend of major, minor and other applications along with officer input into other work. It also is based on a weighted average across a planning service for the year.

86
Council pro-active in engaging with others in bringing forward development, including Neighbourhood Planning
Strategic approach to corporate management and resource sharing
Good staff morale and innovative culture. Surviving:
Delivers applications just within required timescales
Slow in delivering other development management services, e.g. pre-application discussions, S106, discharge conditions
A Core Strategy in place but limited or slow future policy making, including limited evidence base development
Limited experience of planning managers in relating to members and the chief executive resulting in planning being a lower priority
Deliver of workload dependent on goodwill of professional officers and considerable out of hours working
Focus on delivering core activities only
Non-specialist staff forced to deal with specialist matters, for example conservation, urban design, ecology, resulting in technical vulnerability and risk of inappropriate decisions
No resource contingency to innovate or manage impact of change
Low staff morale. Struggling:
Perceived poorer service delivery on applications by development community.
High proportion of appeals
Weak relationship between senior officers and members
Limited experience of planning managers
Lack of an up-to-date local plan
No proactive plan making or engagement with development community
Resources increasingly focused on appeals and challenged examinations rather than investing in service improvement, potentially resulting in spiral of decline
Very low staff morale
Too few staff to maintain service delivery, often resulting in high staff turnover, sickness rates and difficulty in recruiting.
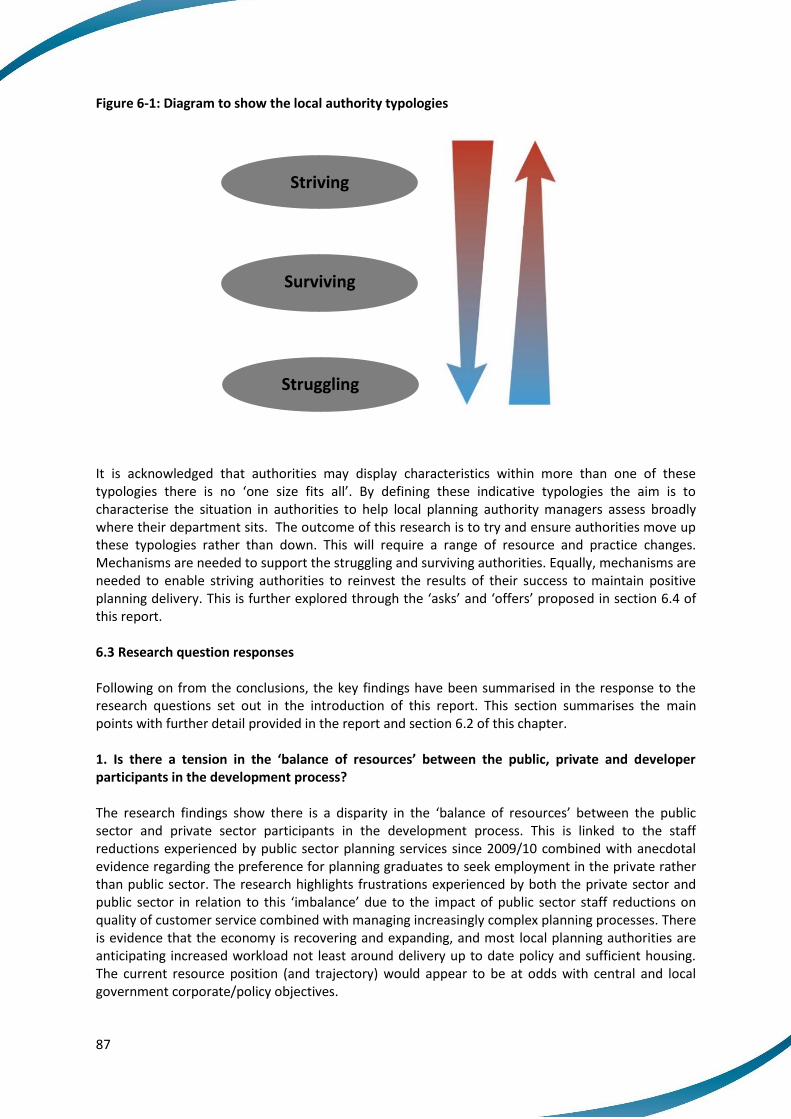
87
Striving
Surviving
Struggling
Figure 6-1: Diagram to show the local authority typologies
It is acknowledged that authorities may display characteristics within more than one of these typologies there is no ‘one size fits all’. By defining these indicative typologies the aim is to characterise the situation in authorities to help local planning authority managers assess broadly where their department sits. The outcome of this research is to try and ensure authorities move up these typologies rather than down. This will require a range of resource and practice changes. Mechanisms are needed to support the struggling and surviving authorities. Equally, mechanisms are needed to enable striving authorities to reinvest the results of their success to maintain positive planning delivery. This is further explored through the ‘asks’ and ‘offers’ proposed in section 6.4 of this report. 6.3 Research question responses Following on from the conclusions, the key findings have been summarised in the response to the research questions set out in the introduction of this report. This section summarises the main points with further detail provided in the report and section 6.2 of this chapter. 1. Is there a tension in the ‘balance of resources’ between the public, private and developer participants in the development process? The research findings show there is a disparity in the ‘balance of resources’ between the public sector and private sector participants in the development process. This is linked to the staff reductions experienced by public sector planning services since 2009/10 combined with anecdotal evidence regarding the preference for planning graduates to seek employment in the private rather than public sector. The research highlights frustrations experienced by both the private sector and public sector in relation to this ‘imbalance’ due to the impact of public sector staff reductions on quality of customer service combined with managing increasingly complex planning processes. There is evidence that the economy is recovering and expanding, and most local planning authorities are anticipating increased workload not least around delivery up to date policy and sufficient housing. The current resource position (and trajectory) would appear to be at odds with central and local government corporate/policy objectives.

88
2. How are public sector planning resources changing over time and what are the consequences? Evidence from the LGA, CIPFA and the survey analysis shows there have been disproportionate reductions to local planning authority planning services compared to other service areas. With regard to resource changes within development management and planning policy across the North West, the CIPFA data shows a slightly different picture with lower average reductions, however the trend shown in both the CIPFA and survey data shows loss of staff in the last five years. Whilst planning service reductions in resource have impacted the quality of service including time taken to determine applications and prepare local plans, other factors also need to be taken into account including increasingly complex planning processes relating to development management and the preparation of local plans. 3. What is the relationship between public sector planning resource and levels of development investment/housing delivery; is this undermining economic recovery across the North West? There are two factors identified within the research which are impacting delivery of development across the North West. The first is time taken to progress the preparation of local plans leading to reliance on out of date policies and less certainty with regard to planning outcomes. As a result developers are holding back on schemes considered to be too high risk, with other schemes being constrained by availability of finance as institutions are more likely to release finance where there is certainty through an up to date policy position and allocated sites. Secondly, changes in public sector resources combined with complex development management processes has led to extended timescales for applications prior to and post the 8 or 13 week determination period. Anecdotal evidence shows pre-application discussions can take up to six to seven months with varying quality in the level of advice offered. There are also issues regarding the time taken to discharge conditions or finalise Section 106 agreements. These are all factors in terms of time taken to ‘get a spade in the ground’ and commence development. 4. What models or best practice approaches can be used to deliver quality resource solutions and how can these influence decision makers to reflect an ideal or optimised ‘balance of resources’? There is no single solution or ‘one size fits all approach’ as each local planning authority in the North West has different experiences and challenges. Instead this report identifies three typologies which broadly characterise Local planning authorities across the North West and presents a range of practice changes which are carried forward into asks and offers in Section 6.4. These recommendations can be used in combination based on the different needs of each local planning authority. On this basis, and accepting that providing public services involves balancing prudent resource use against performance objectives, it might be more appropriate to refer to ‘good’ rather than ‘best’ practice. However, at the same time, the experiences of the North West are likely to apply almost equally across the UK and the similarly broad range of local planning authority contexts.

89
5. How can the role of planning and profile of RTPI members be enhanced in the workplace in response to resourcing issues? There is an opportunity for the RTPI to promote best practice changes to support public sector planning services. This involves providing advice on resource management, sharing and outsourcing; use of PPAs; and practice changes within Development Management. Section 6.4 has further information on the opportunities for RTPI, PAS (and the LGA) and ATLAS. Several work streams in this vein already exist. PAS provide ‘resource review’ support to local planning authorities, have created the Planning Quality Framework to measure and inform performance and ATLAS have advice on the use of PPAs, although this could be updated to reflect current circumstances. The ‘asks’ and ‘offers’ set out below are focused on central government and council leadership. RTPI is best placed to take a key role in negotiating with the Government and it is understood that this is already underway in relation to a number of the matters raised in this study. RTPI can also assist planners in engaging directly with council leadership through support for the practical measures proposed in this report. 6.4 Recommendations – Asks and offers 6.4.1 Introduction The purpose of this research is to influence the agenda at both the national level and across the North West with regard to managing current and future changes to public sector planning services. For the research study to be influential, it is important that conclusions and recommendations are clearly articulated and targeted at the correct level. This section of the report has two aims, firstly to set out a series of ‘asks’ directed towards Government and at local planning authority leaders/chief executives across the North West. The ‘asks’ are focused on measures which need to be put in place to ensure the ‘offers’ are successful. Secondly, the report provides a series of ‘offers’ which can be taken forward by local planning authority planning services, the wider development industry and associated professional organisations to manage the changes taking place in public sector planning services. Throughout this research it is important to recognise that the challenges facing Local planning authorities across the North West are different for individual authorities, as such there is no ‘one size fits all solution’. Instead this section presents a package of solutions with a range of complimentary asks and offers. This section is structured using the research themes which run throughout this report. These are resources and budget, and performance. The offers in this section relate to the practice changes summarised in section 6.2.

90
6.4.2 Resource and budget asks Government
1. Guidance regarding local determination of resources to enable re-investment within planning services
The Government has clearly stated its ambitions to have local plans in place by 2017 and to deliver 200,000 starter homes by 2020. In order to realise these goals it needs to be supported by efficient and effective local authority planning services. Research by the Local Government Association28 clearly shows planning services have experienced disproportionate budget reductions of around 40% compared to other council departments. Focusing on one region, this research has identified similar reductions. A continuation of this trend of high level reductions would put at risk the ability of local authority planning teams to effectively deliver day-to-day services, let alone achieve the Government’s targets for local plan production and housing delivery. Nonetheless, it needs to be recognised that measures to reduce the deficit will continue to be implemented by the over the next 5 years. In this context, moving from a cycle of decline to a cycle of positive planning can be achieved through re-investment of planning generated income back into public sector planning services. Re-investment can come from a range of income sources including New Homes Bonus grants, planning fees and pre-application fees. It is crucial to recognize that planning services are an increasingly significant source of income for authorities, through application fees and the New Homes Bonus. However, this positive contribution is often not reflected in the funding provided to planning services. Government and organisations such as the RTPI should emphasise the link between revenue such as the New Homes Bonus and the work of local planning services. To this end, Government could also provide guidance on the desired level of re-investment to planning services, particularly from planning-related grants which tend to be directed into central budgets. This would provide ‘striving’ authorities in particular with the means to maintain a positive approach towards planning and delivery. There is also an opportunity to allow in-direct reinvestment through transfer of grants to other agencies such as PAS and ATLAS, which can then provide a greater degree of support to local authorities who are currently ‘surviving’ or ‘struggling’.
2. Funding for an enhanced PAS- and ATLAS-type service to provide essential support and
resources for ‘struggling’ and ‘surviving’ authorities With reductions to public sector planning services, local planning authorities are increasingly reliant on private sector consultants to provide training, capacity building, and support to manage peaks in resource or provide specialist advice. These consultancy costs have to be managed within public sector planning service budgets. An alternative approach is for PAS and ATLAS to offer an enhanced service and provide ‘surviving’ and ‘struggling’ local planning authorities with a greater degree of flexibility over resource management to address issues faced by these authorities regarding staff losses and associated constraints to service delivery. This may or may not follow the current PAS and ATLAS models, or might reflect other international practices. The objectives would be to:
28
‘Funding outlook for councils from 2010/11 to 2019/20: preliminary modelling’ (LGA, June 2012).

91
provide a resource for Local planning authorities to draw upon specialist skills and services such as design, viability, infrastructure in a way that is cost-effective for all parties;
build capacity in terms of project management, resource planning, staff development, systems improvement and workflow monitoring;
establish and disseminate good practice in relation to current and emerging government policy and practices stemming from it; and
provide a resource to cater for ‘peaks’ in the service, such as when smaller authorities receive larger applications, or when local plan production reaches a resource-intensive stage.
Critically, all of the above need to be achieve with a culture of local sensitivity to ensure both local context and ownership, and maximum up-skilling across the sector. This research recognises the potential enhanced service this could offer and recommends that Government reviews the remit of these central services to provide a greater degree of support to local planning authority planning services during a time of significant change and restructuring. 3. Enabling access to indirect ring-fenced budgets to support public sector recruitment,
development and retention One of the issues arising from the research was the perception that local planning authority planning teams would be a less attractive option for planning graduates compared to the private sector, leading to concerns regarding resource shortages and skills gaps. In addition, some Local planning authorities that do invest in ‘growing’ planners worry that other Local planning authorities may reap the benefits by offering slightly higher salaries and/or progression prospects. To counter this, DCLG should view and address staff in a more global way. It has the means to present public sector planning as a more attractive option to graduates by providing bursaries (or scholarships, apprenticeships or equivalent) for students linked to public sector jobs. Bursaries can include conditions to ensure students spending a period of time working within the public sector. It can recommend the grading of local authority planners such that post grading’s do not suffer as a result of current definitions around staff and budget responsibility. It can require and/or support day-release-type training schemes for planners at a national level. Historically the PDG element that was top-sliced to fund bursaries was effective and stimulating local planning authority recruitment and retention. Building on the experience of Birmingham City Council, LEPS can directly promote and fund planning training programmes. Importantly all of these things can be achieved without ring-fencing local authorities’ monies. Ring-fencing is felt to result in unintended outcomes around offsetting, top-slicing or otherwise rearranging budgets to in essence withdraw or counter the intended ring-fencing effect.

92
4. Ensure any changes to development management practice are assessed for financial
burden, including existing planning fee levels The research shows planning processes are becoming increasingly complex, with increasing costs and time hidden within the pre- and post- application processes. Recent changes to development management practice (such as changes to permitted development rights) have placed increased demands on planning services who are managing an increase in prior approvals which is non-fee earning workload. This is combined with GPDO changes leading to a reduction in planning applications and associated fees. It is recommended the cost impact of any future changes to development management practice is fully understood to ensure these changes do not place increased resource and cost burdens upon planning services. It is also important that mitigation measures are put in place to manage any future financial and resource burdens. In addition to the ‘non-fee’ increases above, the government-set planning application fees have not been reviewed for some time. Where planning fees do not cover the costs of determination, work is in effect being cross-subsidised from other sources. Government should consider ways in which local planning authorities could be granted additional opportunities to reinvest more in their planning services, including by reviewing government-set application fees. 5. Review service data monitoring to enable effective end-to-end benchmarking To enable effective tracking of changes to public sector planning services, it is recommended DCLG review data captured across the sector to ensure effective capture of data such as development management and policy staff numbers (including FTE case officers engaged on cases); number of pre-application sessions (paid and unpaid); number of applications received; and number of appeals. This information can also feed into benchmarking planning service performance. Data sources that might be considered in this way could include: CIPFA planning services records, DCLG (C)PS1/2 returns and previous research on the development of a cross-service performance indicator, PAS/CIPFA locally set fees Benchmarking and the emerging PAS Planning Quality Framework. Other examples might also include current and proposed performance frameworks in Scotland and Wales respectively.

93
Local planning authority leadership 1. Sector-led benchmarking of staff resource based on the average number of decisions per
officer and the expected average time commitment for each type of planning application Reductions of staff numbers within development management teams has resulted in officers taking on increased caseloads leading to performance issues. In similar vein to organisations committing to paying a ‘living wage’, authorities should commit to a ‘resource standard’ such as operating within 150-17029 applications determined per FTE case officer working on cases. It is recommended that chief executives review and benchmark caseloads based on best practice advice. Setting benchmark caseloads will enable Local planning authorities to manage resource demands and will support development management officers who are struggling to provide an effective service due to excessive workloads. We understand that PAS is looking into benchmarking standards, the outcomes of their review may provide the basis for establishing benchmark guidelines. 2. Resources to enable plan making to achieve government targets for local plans by 2017 It is important for local planning authority leaders to understand the impact of delays to local plan preparation and commit resources to enable local plans to be completed and adopted before the government target of early 2017. This relates to the prioritisation of local plans at chief executive level and the importance of ensuring certainty within the planning system in order to support growth and development. As with applications above, authorities should commit to a ‘resource standard’ for policy-making which includes both adequate staffing and a commitment against delay or slippage from a LDS-type timetable. 3. Give greater priority to Section 106 approval and coordination and to support
standardisation and minimisation of pre-commencement conditions The research has found there have been cut backs in services supporting planning departments such as public sector legal services. This has extended the negotiation and approval period for Section 106 agreements. The report recommends ensuring sufficient legal support to enable appropriate negotiation, approval and implementation of Section 106 agreements. This is beneficial to Local planning authorities as it speeds up the process and secures future income. The sector, through bodies such as the RTPI, PAS (and the LGA), ATLAS and POS should commit to produce and adopt a single, assimilated Section 106 template in much the same way the advent of the Planning Portal and the ‘1APP’ process removed local inconsistencies within application forms.
29
This figure has been identified through work for DCLG on the best value indicator regime. It is a ‘desired’ benchmark taking account of efficiency and quality. The benchmark is calculated using normative judgement on the aggregate workload taking account of an average blend of major, minor and other applications along with officer input into other work. It also is based on a weighted average across a planning service for the year.

94
The same concept could also be applied to planning conditions. There is evidence of both local planning authorities and Applicants favouring increasing numbers of conditions in order to expedite decision-making and increase certainty during the determination of applications. This has the effect of ‘back-loading’ issues of substance. These are subsequently discharged by applications, often several at a time, for a nominal application fee which in no way reflects evidence on the costs of determination. Further, the challenges around deemed consent threatens to create a performance and resource bottleneck. Developing (and in many ways, returning) to a national set of model planning conditions would dramatically reduce the time and resource inputs in this work area. The need to adhere to the standards set would help prevent excessive bespoke additional conditions.
6.4.3 Resource and budget offers
1. Review of planning service team structures by Local planning authorities to ensure they are fit for purpose with a balance of management, senior and more junior officers and support staff
The research findings show the value of flexibility within resource management and whilst resource reductions are being made it is necessary to adopt a more radical approach, this is particularly important for local planning authorities who recognise characteristics within the ‘surviving’ and ‘struggling’ typologies (see section 6.2). It is recommended local planning authorities review team structures to identify potential areas of resource sharing and flexibility between development management and planning policy teams. Whilst it is important for officers to deliver core functions in both these areas, it is advantageous to have officers who are able to work across development management and policy. This will better prepare Local planning authorities to effectively resource PPAs or ensure sufficient resource to meet government targets for determination of applications or local plan preparation. Where necessary, a review of team structures will also help to re-dress any imbalances caused by staff churn due to previous cuts, early retirement and voluntary redundancy. In addition, local planning authorities can review the impact of loss of administrative and technical staff to understand the extent planning officers are carrying out these tasks. There is an opportunity to make use of RTPI apprenticeships (www.rtpi.org.uk/apprenticeships) where funding is subsidised by the Skills Funding Agency. This will free up time for planning officers and senior staff to focus on specialist planning tasks. 2. Proactively seek support to address any gaps in specialist advice or resource, to provide
best practice and delivery advice and to train and develop staff ‘Surviving’ and ‘struggling’ authorities have been affected by the loss of skilled and specialist support. Provision of additional resources and skills from agencies such as ATLAS can lead to positive benefits and outcomes, enabling these authorities to move from a cycle of decline towards a positive planning approach. There is an opportunity for ATLAS to take on a greater role offering specialist advice relating to urban design, landscape, contamination and conservation in addition to supporting delivery of local plans or application case load. The research has identified that resource sharing could be beneficial in addressing future budget and staff reductions. The advantage of using ATLAS is they provide a central pool of specialist knowledge and resource which can be accessed to address peaks in workload.

95
It is recommended local planning authorities take advantage of the services offered by PAS to provide full service reviews, deliver against PPAs and advise on local plan delivery. PAS have the advantage of gaining best practice experience across a number of local planning authorities, which can be beneficial when providing support to authorities which have been impacted by a loss of senior or skilled staff. Part of the ‘resource standard’ commitment by local planning authorities could be for a certain training provision (such as two days per year) to be guaranteed for all staff. Importantly, a commitment to a minimum half-day training ‘ration’ would ensure this is used meaningfully rather that subverted via things more often considered CPD or ‘staying up to date’ type activities. 3. Review pre-application and Section 106 agreement charges to ensure costs are fully
covered It is recommended local planning authorities regularly review pre-application charges in light of development management process changes and running costs. It is vital any increases in charges are linked to a quality service offer, effective resourcing at the pre-application stage and associated performance improvements to meet applicant’s needs. Good practice already exists to assist this process, but authorities need to be robust and holistic in their identification of overhead costs, of staff from outside the planning service also engaged within pre-application, and in estimating the full end-to-end time taken to organise, convene, log and promptly respond in full to enquiries. Similarly, and in recognition of case officer as well as legal officer involvement in negotiating and concluding Section 106 agreements, it is important that a realistic time/cost estimate is produced to avoid cross-subsidy from elsewhere. 4. Increase use of Planning Performance Agreements The research shows within the North West Planning Performance Agreements are currently under-utilised. This could be due to a variety of reasons including viability issues relating to additional costs from a PPA. The research findings recognise the benefits of PPAs and have explored the possibility of implementing a ‘PPA light’ which involves a simplified user agreement, often without a fee attached but which helps to identify commitments from both applicant and local planning authority. Any move towards PPAs should be supported by greater access to different types of flexible resources to provide an enhanced level of service. There is also a role for both ATLAS and the RTPI to provide further guidance and good practice advice on implementing PPAs within the North West.

96
6.4.4 Performance asks Government
1. Guidance on a simplified planning process including housing policy Over time the housing policy position has become increasingly complex. The revocation of RSS led to a policy vacuum with regard to housing numbers. In addition the introduction of the NPPF and concept of Objectively Assessed Housing Need has led to an increasingly complex policy position exacerbated by challenges to local planning authority 5 year housing supply and reliance on case law. A simplified housing position would provide greater clarity and certainty which could support the progress of a local plan in so far as to help minimise the resource inputs and elapsed time. The request for a simplified housing position forms part of a wider ask related to the plan making process. The RTPI, District Councils Network, County Councils Network and Planning Officers Society (POS)30 prepared a joint position statement in June 2015 which requests improvements to local plans and strategic planning including reducing risks and costs; incentivising plan making; making plans shorter and facilitating cross boundary planning. 2. Promotion of the advantages of planning to council chief executives DCLG has an important role to play in promoting the value and importance of planning in meeting the Government’s growth and housing delivery targets. This includes raising the profile and value of planning within Local planning authorities, particularly those that identify with ‘surviving’ or ‘struggling’ typologies. It is important for council chief executives to understand the link between planning services and income generation, as well as the benefits of proactive planning to ensure future delivery of development. Crucially, arguably more than any other local authority service, planning is at the centre of meeting the overwhelming majority of typical corporate plan objectives.
Local authority chief executives
1. Local determination for re-investment in planning services using income from NHB, Planning Performance Agreements, or revised pre-application fees
The income generated by the local planning authority planning service through planning fees, Section 106 agreements, the New Homes Bonus, council tax and business rates provides an important revenue stream for a local planning authority. If planning services are overly constrained due to disproportionate reductions, their ability to secure this level of income is restricted. Within the remit of local determination of council budgets, chief executives should consider the opportunity to reinvest planning related income back into planning services. This would lead to a cycle of positive planning and income generation, whereby:
Re-investment provides resources to secure adoption of the Local Plan;
Clearly defined policies and allocations in the local plan provide certainty to the development community;
30
http://districtcouncilsnetwork.cmail1.com/t/r-l-flitdx-ydktjytidr-o/. Accessed July 2015.

97
The risk of uncertainty and challenge from out of date policies is removed;
Development management team resources are able to manage a more effective planning process, with fewer points of challenge and a reduction in diversion of resources to manage appeals;
Development management teams can be more responsive to development needs and keep pace with market demands to ensure effective deliver of development;
Further income is generated from the planning service.
This mechanism is needed to enable striving authorities to reinvest the results of their success to maintain positive planning delivery. This approach relates to the ‘ask’ to Government to provide guidance on planning service re-investment.
2. A flexible and adaptive approach to procurement Local authorities should approach the procurement of additional resource and specialist input into planning services in a pragmatic, proportionate and flexible way, in order to adapt more quickly to changing demands on services. Government and other organisations such as the RTPI and PAS could do more to advise local authorities in this regard.
6.4.5 Performance offers
1. Use of good practice guidance to support local planning authorities Local authorities should actively seek information and support to improve performance and delivery, and to address any gaps in specialist advice or resource, in order to move towards a positive and proactive planning approach. Authorities should take advantage of the services offered by the Planning Advisory Service (PAS) to provide full service reviews (including benchmarking their performance), deliver against PPAs and advise on local plan delivery. PAS has the advantage of best practice experience drawn from a range of local authorities, which could be especially valuable for authorities which have been impacted by a loss of senior or skilled staff. In addition, ATLAS can support local authorities dealing with complex large scale housing-led projects. The RTPI is also developing a programme of work to promote better planning in local authorities and beyond.
2. Identify potential resource sharing arrangements
To ensure flexibility and manage peaks in workload within development management and planning policy teams there is the potential to arrange resource sharing between development management and policy teams, although this has limitations if both teams are working at capacity. Other options for resource sharing include secondment of staff between neighbouring authorities, sharing specialist staff with neighbouring authorities or using statutory consultee specialist staff. Resource sharing can also extend to use of private sector staff through secondment arrangements or joint ventures. 3. Opportunities for greater use of PPA arrangements
Planning Performance Agreements can offer a greater degree of flexibility for both applicant and planning officer, as agreements can be made which fall outside of the 8 or 13 week determination timeframe. This report has also identified the potential for different types of PPA including ‘PPA light’ which involves a user agreement without a fee, and ‘PPA+’ which involves a greater degree of service quality linked to higher fee levels.

98
4. Preparation of RTPI good practice guidance There is the opportunity for organisations such as the RTPI and PAS to prepare good practice guidance on:
Resource sharing between authorities, in partnership arrangements or through the use of consultancies on a secondment basis.
Planning officer engagement with Members and council leadership to set out a framework for positive engagement and encourage a greater level of delegation.
Use of PPAs to establish an agreed performance approach, with associated monitoring and evaluation.
In addition, local planning authorities can make use of the RTPI guidance already in place including the ‘10 commitments for effective pre-application engagement’ (RTPI and LGA, January 2014) which sets out pre-application good practice for Local planning authorities and applicants. 5. Promote the value of public sector planning services through RTPI and PAS There is an increased role for PAS to inform council chief executives on the role and advantages of planning including the benefits of revenue from planning related income sources. RTPI can also play a role in promoting public sector planning to Government and the development industry. Both PAS and RTPI could use the local planning authority typologies in section 6.2 to target authorities which are showing characteristics that broadly align with ‘surviving’ and ‘struggling’ authorities.

99
6.5 Summary There have been significant local planning authority budget and staff reductions since 2010, a reduction on average of 37% of policy and 27% of development management staff since 2010. The reductions to planning and development services have been disproportionate to reductions to other local authority services. Nonetheless, local planning authorities are increasingly a significant source of income for councils, through application fees and the New Homes Bonus, but this positive impact is not reflected in the funding provided for the service. The reductions to local planning authorities have resulted in increasing difficulties in both the public and private sectors, with the latter frustrated by the decline in local authority planning services in some areas. However, they are equally sympathetic because they recognise it is a result of the cut backs and have witnessed the pressures on local planning authority staff. Although the time taken to determine applications can often be good, there are increasingly delays and uncertainty in receiving pre-application advice, S106 agreements and discharge of conditions, resulting in delays bringing forward development. There are cases where the lack of planning policy is meaning it is too commercially risky for developers to prepare the planning applications they had intended. The lack of pro-active plan-making will result in fewer projects coming forward, particularly public-private partnerships, often with a regeneration agenda. Whilst resource changes have had a significant impact on public sector planning services, the research has identified that local planning authorities have managed to varying degrees. As such North West authorities could be broadly defined as either ‘striving’, ‘surviving’ or ‘struggling’. In the majority of cases local planning services are surviving on the “goodwill and professional integrity” of the officers. It is feared this cannot be sustained. The key factors in reversing the cycle of decline and achieving a positive planning system are reinvestment in public sector planning services combined with the continuation of strong relationships between the public and private sector. A range of measures are required to enable ‘striving’ authorities to maintain high standards; to support ‘surviving’ authorities who have the potential to perform; and to focus resources on ‘struggling’ authorities to address the causes of decline. Investment is needed to ensure effective and efficient public sector planning that encourages positive development. This can either be direct investment through local determination of reinvestment from sources of planning income or indirect investment through resource capacity and skills offered by agencies such as PAS and RTPI. Greater flexibility in responding to varying workload demands is needed. This can be achieved through a benchmarking approach to guide appropriate resourcing combined with an increased use of PPAs and informal agreements to help resourcing, communication and thereby certainty for developers. Use of these measures as part of a positive approach towards planning is essential for effective delivery of planning services and for the development industry to fulfil its economic potential.

100
Appendix A – List of North West local authorities North West local authorities by sub-region: Greater Manchester:
Bolton
Bury
Manchester
Oldham
Rochdale
Salford
Stockport
Tameside
Trafford
Wigan Lancashire:
Blackburn
Blackpool
Burnley
Chorley
Fylde
Hyndburn
Lancaster
Pendle
Preston
Ribble Valley
Rossendale
South Ribble
West Lancashire
Wyre Merseyside:
Knowsley
Liverpool
Sefton
St Helens
Wirral Cheshire:
Cheshire East
Cheshire West and Chester
Halton
Warrington

101
Cumbria:
Allerdale
Barrow
Carlisle
Copeland
Eden
Lake District
South Lakeland

102
Appendix B – Data analysis framework B1 – Data analysis framework
Data Time Source
Resources
Staff
Staff structure of planning service 2015 Survey (No CIPFA)
Numbers of staff within each service (including vacant posts)
All years Survey (CIPFA 2005/06 and 08/09 includes actual staff numbers for planning policy and development control, CIPFA 2013/14 only includes employee expenditure (for planning policy and DC), not staff numbers)
Staff salary All years Survey (No CIPFA)
How much experience staff have (level) All years Survey (No CIPFA)
Numbers of staff within each service (including vacant posts)
All years Survey (No CIPFA)
Staff turnover rates including level of experience (over career and within authority)
All years Survey (No CIPFA)
Expenditure
Costs broken down by service (policy, development control, enforcement) (including all costs as included in CIPFA)
2015 – Budget and actual. Actual for other years
Survey (CIPFA 2013/14 broken down to service and employees and running expenses, 2005/06 and 08/09 broken down total for planning and development:

103
employees, premises related expenses, transport related expenses, supplies and services, third party payments, support services)
Costs of any external consultants All years Survey (No CIPFA)
How much spent on training (courses/day release/other) and numbers of staff benefitting from training
All years Survey (No CIPFA)
Income Survey
Income broken down by service (planning policy, development control, enforcement) and by source (application fees, cost awards, retained Section106 contributions, land charges, service level agreements, other)
All years Survey (CIPFA 2013/14 broken down by sales fees and income, and other income for planning policy and DC. CIPFA 2009/10 and 2005/06 includes income figure for planning policy and DC).
Have you benefitted from any grants (New Homes Bonus/Housing Delivery Grant/Neighbourhood Planning Grant)
All years Survey (No CIPFA)
Any internal cost recovery All years Survey (No CIPFA)
Other
Have any of the following occurred:
Retirements
Voluntary redundancies
Mandatory redundancies
Resignations (staff leaving)
Recruit graduate
Between 2005/06 to now
Survey (No CIPFA)

104
Recruit case officer
Recruit senior officer
Recruit managerial
Recruit pre graduate
Promotion of technician to case officer
Pay freeze
Recruitment freeze
Benefit freeze
Corporate restructure
Department restructure
Increase in agency staff
Decrease in agency staff
Outsourcing exercise
Actual outsourcing
Utilised free training e.g. PAS support

105
Appendix C – Survey questions C1 – RTPI North West public sector resource survey
Arup and RTPI are requesting information on public sector resources from every local planning authority (local planning authority) across the North West Region to inform research on ‘Public Sector Resources and Positive Planning.’ Please provide your response no later than Wednesday 8 July 2015.
How can you help us?
You have been invited to participate in the survey. We would be grateful if you could spend 15 – 20 minutes to complete the questions. The survey covers the following themes relating to both Development Plan and Development Management teams:
Staff and resourcing – to understand how public sector resources have changed over the last 10 years;
Expenditure and income – to explore changes in planning income and public sector costs;
Performance matters – to establish the effect of budget changes on performance matters; and
Practice changes – to examine how Local planning authorities have positively responded to these challenges.
The survey requests staff, budget and planning performance information. Please download the pdf in the accompanying email for further details on the information required prior to completing the survey.
All information provided will be treated confidentially and reported on an anonymous basis. The data will be used to analyse the relationship between resources and performance.
How can we help you?
The aim of the research is to quantify the impact of pressures on public sector planning resources upon development across the region. The research outcomes provide an important opportunity to:
1. Inform local planning authority business and operational cases for future investment and resource management of public sector planning teams; and
2. Support RTPI influence on public sector planning investment at the national level.
This research comes at an important time for our profession considering pressures being faced by public sector planning teams across the region. In order to maximise the value and quality of this research, we would appreciate you taking time to complete the survey so that we can achieve 100% coverage across the regions’ local planning authorities.
Thank you for participating in the survey, if you have any queries please contact Sarah Lewis at Arup on 0161 228 2331 or via [email protected].
For the purposes of this survey, ‘planning service’ is defined as including the planning policy,
development management and enforcement functions. It does not include building control,
community development, economic development, environmental initiatives, land charges, trees,
heritage, conservation etc. Please ensure staff and financial information relates to these areas only,
wherever possible. If you are unsure how to determine your figures, please call us to discuss this
further.

106
AUTHORITY INFORMATION
1. Authority Name:
Officer Name:
Officer Position:
Telephone number:
Email address:
STAFF
2. If available, please provide a structure chart of the planning service in your authority. We are
interested in how the component parts of the service are distributed and the relationships
between different teams. (including person and role). [Please upload a structure chart, ideally in
PDF, Word or PowerPoint format].
[Upload file function]
3. Please complete the below using full-time equivalent (FTE) staff numbers (e.g. 0.25, 0.33, 0.8
etc). Where staff are working across services, please pro rata e.g. a manager who spends half
their time managing staff and half their time on a development management case load would be
0.5 FTE for each. [Please estimate for each time period required.]
Service Grade FTE in post at 31/03/06
FTE in post at 31/03/10
FTE in post at 31/03/15
FTE Vacant at 31/03/15
FTE Agency/ Temp at 31/03/15
Overall Service
Admin/Support
Managerial
Development Management
Admin/Support
Technician
Planning Officer
Senior Planning officer
Managerial
Other (please specify)
Planning Policy
Admin/Support
Technician
Planning Officer
Senior Planning

107
officer
Managerial
Other (please specify)
Enforcement Admin/Support
Technician
Planning officer
Senior Planning officer
Managerial
Other (please specify)
Total
4. If you answered 'other' above for some staff numbers, please describe the reasons below:
5. Please complete the following tables in relation to FTE staff LOSSES which have taken place in
the stated years. [Please put the number of FTEs applicable to each].
2005/06 2009/10 2014/15
Resignations
Retirements
Voluntary redundancies
Mandatory redundancies
6. Please complete the following tables in relation to FTE staff GAINS which have taken place
in the stated years. [Please put the number of FTEs applicable to each].
2005/06 2009/10 2014/15
Recruitment – managerial
Recruitment – senior planning officer
Recruitment – planning officer
Recruitment – graduate
Recruitment – pre-graduate (e.g. gap year, placement, day release, “grow your own” planners)
Recruitment – temporary

108
(e.g. intern, summer placement (0.25 FTE), work experience)
7. Please indicate which (if any) of the following structural and corporate changes have taken
place in the stated timescales. [Please tick all that apply].
In the last 2 years
In the last 3-5 years
In the last 6-10 years
Pay freeze
Recruitment freeze
Benefit freeze (leave, training, discounts etc.)
Corporate restructure
Service/department restructure
Increase in agency/temp staff
Decrease in agency/temp staff
Outsourcing exercise
Actual outsourcing
Utilised free training/support (e.g. PAS, LGA or similar)
EXPENDITURE
8. Please provide total expenditure details for 2014/15 (budget and actual) split between
planning services, and actual expenditure for 2005/06 and 2009/10. For the purposes of this
question, please interpret ‘expenditure’ to be total gross spend. For example, an authority
might have an income of £250,000 a net spend of £750,000. The total spend would be
£1,000,000. We are seeking data on the total cost of the service.
Expenditure details should include all costs to the authority, including aspects such as
employees and on costs, premises costs, supplies and services, transport related expenses,
third party payments, support services. [Please apportion management or overall service
costs between the service areas.]
2005/06 actual expenditure
2009/10 actual expenditure
2014/15 expenditure
Budget Actual
Development management
Planning Policy
Enforcement
Total
9. Please indicate the total spend on external consultants for any of the following work. This
will include ongoing outsourcing arrangements where they apply. [This will include any
external (extra-authority) support from the private sector. it will also include any support
such as shared services (with another authority) where is a SLA or payment.]

109
2005/06 2009/10 2014/15
Development Management
Customer enquiries/service
Application registration/validation
Application determination
Specialist advice role
Appeals/Inquiry support
Planning policy
Local plan document preparation
Evidence base document preparation
Specialist advice role
Enforcement activity
Other (please specify)
Total
10. If you answered 'other' above for consultant spend, please describe the reasons below:
INCOME
11. Please provides details of income levels by source for the following years:
2005/06 2009/10 2014/15
Planning Application Fees
Pre-application advice
Planning Performance Agreements
Cost Awards (both planning and enforcement appeals)
Grants (e.g. Neighbourhood Planning, Planning Delivery Grant, New Homes Bonus)
Retained Section 106/CIL contributions
Service level agreements/trading account recharges
Total
WORKLOAD AND PERFORMANCE
12. Please upload your PS1 AND PS2 Forms for the following financial years:
2005/06
2009/10
2014/15

110
Data should be provided for the financial year ending 31 March. For your convenience, you
can either upload each year in aggregate, or the individual quarters. Only PDF, Word (doc
or docx) or Excel (xls or xlsx) files can be uploaded.
[Upload file function - a maximum of 24 files (12 x PS1 and 12 x PS2) can be uploaded, but
combined PDFs are also fine.]
13. In the table below, please provide details on the number of pre-application advice
sessions, the number of applications determined by planning committee, applications
considered initially invalid and number of applications resubmitted as a ‘free go’.
Pre-application sessions are defined as pro-actively seeking advice on a proposed scheme and
can include advice via phone, meeting, or written form.
A ‘free go’ refers to an application of the same character or description as a previous
application submitted by the same applicant on the same (or part of the same) site either
within 12 months of a permission or a refusal, or, where an application was witdrawn, within
12 months of the date of the making of the earlier one, or, in the case of an appeal against
non-determination, within twelve months of the expiry of the 8 or 13 week period for
determination. [Please provide the number of sessions/applications as required.]
2005/06 2009/10 2014/15
Number of paid pre-application sessions
Number of unpaid pre-application sessions
Number of applications considered initially invalid
Number of applications resubmitted as a ‘free go’
14. Please provide the following details in relation to the number of planning appeals for all
types of planning applications, lawfulness certificates and enforcement notices. [Appeals
include Section 78 planning, prior approval and advertising appeals, Section 106 agreement
appeals, Section 174 enforcement apeals, Section 195 lawful certificate appeals, Section 20
listed building consent appeals, Section 39 listed building enforcement appeals, Section71
High Hedges appeals, and Section 208 Tree Preservation Order appeals. Please do not
include CIL appeals.]
2005/06 2009/10 2014/15
Total number of planning appeal decisions
…of which dismissed
…of which upheld
…of which split decision
Number of appeals with costs awarded to local planning authority

111
Total costs awarded to local planning authority (£)
Number of appeals with costs awarded to Appellants
Total costs awarded to Appellants (3)
15. Please provide details below in relation to any ombudsman complaints in the following
years:
2005/06 2009/10 2014/15
Total planning-related complaints lodged
with Ombudsman
… of which member complaints
… of which about development
management
Number of ombudsman complaints formally
investigated
…of which upheld
…of which decided against
CHANGING PRACTICE
16. Please identify if any of the following have taken place in the stated timescales: [Please
tick those that apply in each of the timescales that apply.]
In the last 2 years
In the last 3-5 years
In the last 6-10 years
Revised scheme of delegation
Revised local validation checklist
Revised committee protocol (size, frequency, quorum etc.)
Added application (workflow) tracking software
Undertaken IT system upgrade (either/both application database and/or document management)
17. Would you be willing to be considered as an anonymous case study to take part in a face
to face interview?
Yes/No
18. Would you be willing to take part in a focus group?

112
Yes/No
19. Part of the aim of this research is to understand more about the ways in which local planning
authorities have reacted to changes in budgets and staffing. If you have any experiences
you would like to share, such as projects, process changes, business cases or similar that
you would like to share please indicate and explain below.
Thank you for your support, it is very much appreciated and will help to provide evidence for this
research.

113
Appendix D – Interview questions D1 – Telephone interview questions Note: Telephone interviews were only conducted with the private sector. D1.1 Introduction Brief introduction explaining the NW RTPI ‘Public Sector Resources and Positive Planning’ Research project: Include:
Focus of the research is across the North West region.
Engagement with 42 local planning authorities in North West and private sector stakeholders (including house builders, developers and consultants).
Report due in September and will be formally launched by the NW RTPI in line with the Tory Party Conference in October.
Agreement regarding the use of information from the interview and any areas where it should remain anonymous / confidential.
D1.2 Questions
1. Can you explain your role and what you do to engage with public sector planning services?
a. What type of work / projects? b. What areas of the planning service do you access?
2. Over the last 5 years have you noticed any change in service? Please give examples. a. Has there been any change in the quality of decision making and input of specialist
advice? b. Has this lead to an increase in appeals? c. Have you made any complaints relating to the performance of an local planning
authority? 3. (If applicable) Over the last 5 years on average how long does it take to progress an
application through the process from pre-app discussion to Section 106 agreement / discharge of conditions?
4. Can you quantify what impacts any delays have had in terms of average costs per scheme? 5. To what extent do you feel planning service staff cuts have been a barrier to progressing
applications? a. Are there any other factors?
6. Have cuts in the planning service and progression of Local Plans created a policy vacuum, in what way has this changed the way you operate?
7. Do you feel the service offered is reflective of the application fees / service charges? a. Is there a difference in the level of service received from authorities who charge for
pre-allocation discussions and other advice? 8. Have you proposed any solutions to local planning authorities to overcome these issues?
a. Has this been taken up and what were the outcomes? 9. If not already covered - What changes would you like to see to improve public sector
planning services? a. What public sector and private sector interventions are needed?
10. What can you change in your practices to provide support?

114
11. Do you think under resource in any way impacted on quantity/quality and local authority department you have been involved with? Reminder of focus group on 28th July 2015. Opportunity to add any final comments.
D2 – Private sector face-to-face interview questions D2.1 Introduction Brief introduction explaining the NW RTPI ‘Public Sector Resources and Positive Planning’ research project. Include:
Focus of the research is on the NW region;
Engagement with 42 local planning authorities in the North West and private sector stakeholders (including house buildings, developers and consultants);
Within local planning authorities focus on planning service relating to delivery of development (planning policy, development management and support functions);
Report due in September and will be formally launched by the NW RTPI in line with the Tory Part Conference in October;
Agreement regarding the use of information from the interview and any areas where it should remain anonymous / confidential.
D2.2 Questions D2.2.1 Context
1. Please can you tell me about your organisation and your role within the organisation? 2. Can you explain about how you engage with public sector planning services? a. What types of work / projects? b. What areas of the planning service do you access? D2.2.2 Resources/performance 3. Over the last 5 years have you noticed any change in public sector planning services? Please give examples. 4. Our research has shown the most severe cuts to planning services have been made to specialist areas rather than planning policy and development management, how does this relate to your experience of public sector planning services?
a. Has there been any change in the quality of decision making and input of specialist advice?
b. Has this lead to an increase in appeals? c. Have you made any complaints relating to the performance of an local planning authority? 5. Over the last 5 years on average how long does it take to progress an application through the process from pre-app discussion to Section 106 agreement/discharge of conditions? 6. Can you quantify what impacts these delays have had in terms of average cost per scheme? 7. Have cuts in the planning service and progression of local plans created a policy vacuum, in what way has this changed the way you operate?

115
8. Do you feel George Osborne’s proposals last week in ‘Fixing the Foundations’ will speed up the planning process and improve public sector performance? NOTES FOR Q8. (George Osborne announcement: ‘Fixing the Foundations’ – proposal to tighten the planning performance regime so that local planning authorities making 50% or fewer of decisions on time are at risk of designation; extending the performance regime to minor applications; introducing a dispute resolution mechanism for Section 106 agreements; and proposals to streamline the length and process of local plans to speed up the process of implementing or amending an plan.) D2.2.3 Budget and income 9. To what extent do you feel budget cuts to the planning service have acted as a barrier to progressing development? Please give examples.
a. Do you feel local planning authorities are able to meet the proposals set by George Osborne and manage further public sector cuts?
10. In cases where Local planning authorities offer a fee charging service for pre-app discussions and other services, do you feel a different level of service is offered?
a. What is your view on the level of these charges, are they reflective of the service offered and should they be increased?
D2.2.4 Practice changes 11. What changes would you like to see to improve public sector planning services? a. What public sector and private sector interventions are needed? 12. Have you been involved in any outsourcing of work from the public sector? Please give examples. 13. In what ways could your company work differently to overcome public sector performance and resource constraints? 14. Have you proposed any solutions to Local planning authorities to overcome public sector resource pressures? a. Has this been taken up and what were the outcomes? D2.2.5 Close out 14. Have you got any other comments not covered in the questions? 15. Is there anything we have discussed that you would like to remain anonymous or confidential? (Confirm arrangements for review of interview notes if necessary). 16. Reminder about the second focus group session on the 28th July from 1.30 – 4pm in Manchester. D3 – Public sector face-to-face interview questions D3.1 Introduction Brief introduction explaining the NW RTPI ‘Public Sector Resources and Positive Planning’ research project. Include:
Focus of the research is on the NW region;
Engagement with 42 Local planning authorities in the North West and private sector stakeholders (including house buildings, developers and consultants);

116
Within Local planning authorities focus on planning service relating to delivery of development (planning policy, development management and support functions);
Report due in September and will be formally launched by the NW RTPI in line with the Tory Part Conference in October;
Agreement regarding the use of information from the interview and any areas where it should remain anonymous / confidential.
Time taken for the interview should be around 30–40 minutes. D3.2 Questions D3.2.1 Context 1. Please can you tell me about your role and responsibilities within the local planning authority. D3.2.2 Resources 2. How do you think the planning service has changed over the last 5 years? 3. How has the planning service within your local planning authority been affected by austerity measures and resource changes?
a. How has this influenced the role and function of planning policy and development management? [restructuring/use of external resource etc]
D3.2.3 Performance 4. How have cut backs affected the performance of the planning service? a. Has this lead to an increase in planning appeals? (Please quantify).
b. (If applicable) Has this lead to delays in the local plan process or created a policy vacuum? (Please quantify).
5. Have you seen an increase in the use of Planning Performance Agreements in the last 5 years? a. How is this managed within your authority? 6. How do you feel the recent announcement by George Osborne regarding local planning authority performance on decision times for applications and time taken to prepare a local plan is going to affect your local planning authority? NOTES FOR Q6. (George Osborne announcement: ‘Fixing the Foundations’ – proposal to tighten the planning performance regime so that Local planning authorities making 50% or fewer of decisions on time are at risk of designation; extending the performance regime to minor applications; and proposals to streamline the length and process of local plans to speed up the process of implementing or amending an plan.) D3.2.4 Budget and income 7. Can you explain how planning service budgets have changed over the last 5 years? 8. Is the local planning authority budget ‘protected’ for statutory functions within the planning service? 9. Have budget changes been offset by changes in planning income? 10. Can you provide an estimate of the level of New Homes Bonus your local planning authority received last year?
a. How is the income managed, is any ring fenced for use by the planning service? 11. Has your authority introduced charging for pre-application discussions and other services? a. How well has this worked?

117
b. How has this been received by the private sector? D3.2.5 Practice changes 12. What service efficiencies have been introduced by your authority to save money and staff resources? 13. Over the last 5 years has there been an increase in the use of external resources?
a. What areas have they provided support? [LP evidence base, Section 106 negotiations etc] 14. Have any other measures been introduced such as collaboration / sharing of specialist skills with neighbouring authorities? 15. What changes would you like to see introduced into the planning service in response to resource pressures? D3.2.6 Close out 16. Have you got any other comments not covered in the questions? 17. Is there anything we have discussed that you would like to remain anonymous or confidential? (Confirm arrangements for review of interview notes if necessary). 18. Reminder about the second focus group session on the 28th July from 1.30 – 4pm in Manchester.

118
About the research
This report is based on research conducted for the RTPI by Jane Healey Brown, Sarah Lewis, Laura Ross and Kieron Hyams at Arup.
Further information The report is available on the RTPI website at: www.rtpi.org.uk/investingindelivery
About the RTPI The Royal Town Planning Institute holds a unique position in relation to planning as a professional membership body, a charity and a learned institute. We have a responsibility to promote the research needs of spatial planning in the UK, Ireland and internationally. More information on our research projects can be found on the RTPI website at: www.rtpi.org.uk/knowledge/research/ You are also welcome to email us at: [email protected]
About Arup Arup is the creative force at the heart of many of the world’s most prominent projects in the built environment and across industry. From 90 offices in 38 countries our 11,000 planners, designers, engineers and consultants deliver innovative projects across the world with creativity and passion. For further information go to: www.arup.com