investing in athletes: predicting the brand value of
TRANSCRIPT

INVESTING IN ATHLETES:
Predicting the Brand Value of Andrew Wiggins and Doug McDermott
A THESIS
Presented to
The Faculty of the Department of Economics and Business
The Colorado College
In Partial Fulfillment of the Requirements for the Degree
Bachelor of Arts
By
Ryan Whitt Milne
May 2014

INVESTING IN ATHLETES
Predicting the Brand Value of Andrew Wiggins and Doug McDermott
Ryan Whitt Milne
May 2014
Economics
Abstract
This study investigates the company Fantex as well as creates a hypothetical model used to
evaluate two upcoming NBA draft lottery picks, Andrew Wiggins and Doug McDermott. There
is very little research on this subject being that Fantex is a relatively new company. Before this
study, the only models that this company has created have been for NFL football players Arian
Foster, running back for the Houston Texans, Vernon Davis, tight end for the San Francisco
49ers, and only recently EJ Manuel, quarterback for the Buffalo Bills. I will be creating these
models so that I can come up with my own equation to value these phenomenal college athletes,
and determine if investment in their brand would be a profitable venture. This analysis will
provide new information about the effect of endorsement deals, player statistics, current contract,
likeability, and other variables (that will be explained later) on a player’s stock. I am coming up
with a forecast model to determine the influence of each statistic on a player’s salary. I am
taking a specific player, plugging in their actual college statistics into the equation (player’s last
year of college statistics + model coefficients) and coming up with each player’s predicted
salaries. Once I have their predicted salaries I will estimate the likelihood of endorsements and
exactly how much they might bring in. I will then approximate how long each player will play
in the league. Finally, I will create a contract, similar to Fantex’s contracts, to offer each player.
KEYWORDS: (Fantex, Projected Salaries, Endorsements, Contract)

ON MY HONOR, I HAVE NEITHER GIVER NOR RECEIVED
UNAUTHORIZED AID ON THIS THESIS
Signature
TABLE OF CONTENTS
1. Introduction……………………………………………………………………………...….1
1.1 Importance of Study………………………………………………………………....3
1.2 Overview of the Present Study…………………………………………………........4
2. Literature Review…………………………………………………………………………...6
3. Theory……………………………………………………………………………………....13
3.1 College Statistics………………………………………………………………….…13
3.2 Risk Smoothing……………………………………………………………………...17
3.3 Return on Investment………………………...………………………………………19
4. Data…………………………………………………………………………………………27
5. Results and Conclusions……………………………………………………………………34
5.1 Results from the Three Regression Models………………………………………….35
5.2 Endorsements…..……………………..…………………………………………...…45
5.3 The Contracts………………………………………………………………………...55
6. References………….…………………………………………………………………….…65

LIST OF TABLES
1. Variable Definitions……………………………....................................................................27
2. Regression results of estimated model proj. 1st year…..…………………………………….35
3. Regression results of estimated model proj. 4th year…………………..………...…………..36
4. Regressions results of model using Position, Age, X, AD, AC…………………..………….37
5. Regression results table using pos3, pos2, PA, X, AC, AD ………………………...…….…38
6. Regression results of model using pos3, pos2, PA, X, AC, AD ………………..…...………39
7. Projected salaries through first 8 years………………………………..………………..…....40
8. Average error in model prediction…………………………………………………………...40
9. Regression results table using mock draft position…………………………………….…….42
10. Projected salary based on mock draft position……………………………………….……..42
11. Average between mock draft regression and college statistics regression……….…………43
12. Present value projected salaries………………………………………………….………….44
13. McDermott endorsement deal using college statistics regression……………….……….…50
14. Wiggins endorsement deal using college statistics regression…………………...…………50
15. McDermott endorsement deal using mock draft position……………………….…………..51
16. Wiggins endorsement deal using mock draft position………………………………………51
17. McDermott player comparison…………………………………………………...…………57
18. Wiggins player comparison……………………………………………………...……….....58
19. McDermott final calculations……………………………………………………….………60
20. Wiggins final calculations………………………………………………..…………....……61
LIST OF FIGURES
1. Jake Mann’s scenarios for investing in Fantex………..………………………………………20
2. Jake Mann’s estimated return on EJ Manuel………………………………………….………21
3. Jake Mann’s second estimated return on EJ Manuel.………………………………………....22
4. Estimated Regression Equation…………………………………...........………………….….27
5. Second Regression Equation…………………………………………….…………...……….32
6. Final Regression Equation using college statistics………………………………………....…39
7. Regression Equation measuring mock draft positions……………………………….….…….43
8. NBA Shoe Endorsement chart………………………………………………………….…..…48
9. Regression Equation measuring endorsement deals with college statistics…………....……..51
10. Regression Equation measuring endorsement deals with mock draft position………...……52

ACKNOWLEDGEMENTS
I would like to thank Professor Kevin Rask for his endless help, constant guidance and overall
patience in this research. I would also like to thank my parents for their constant support and
insight. In addition, I would like to thank Mike Edmonds for his mentorship throughout my four
years at Colorado College. My deepest thanks go to Phoenix Von Wagoner for all his endless
help and availability, I truly would not have been able to complete this thesis without him.
Finally, I would like to thank John Rodin for taking time out of his busy schedule to help shed
some wisdom and light on the company, Fantex.

1
Introduction
For years businessmen, banks, insurance companies, and individual investors
have been buying, selling, and trading in the stock market. The stock market allows for
businesses to be publicly traded, raising additional financial capital for expansion by
selling shares of ownership of the company in a public market. History has shown that
the price of shares and other assets are important part of the dynamics of economic
activity and can even be an indicator of social mood and how well an economy is doing
(Stock Market, 2013). The stock market is often considered the primary indicator of a
country’s economic strength and development (Singh, 2011). Why am I explaining the
stock market to you? The reason is that one company has decided to change up the stock
market game for good. Every second of everyday people are trying to find something
new, something fresh to gain a competitive advantage. One company thinks that they
might have done that.
Fantex Brokerage Services, a company based out of San Francisco, California, is
the world’s first registered trading platform that lets you invest in Fantex, Inc. tracking
stock that is linked to the value and performance of a professional athlete brand. Fantex,
Inc. purchases a minority interest in an athlete brand and works to increase the value of
this brand while Fantex Brokerage Services lets you do the actual buying and selling of
the stock (Fantex Arian Foster, 2013). If the time ever comes that the brand stops
generating income the tracking stock may be converted into Fantex, Inc. Platform
common stock.
2
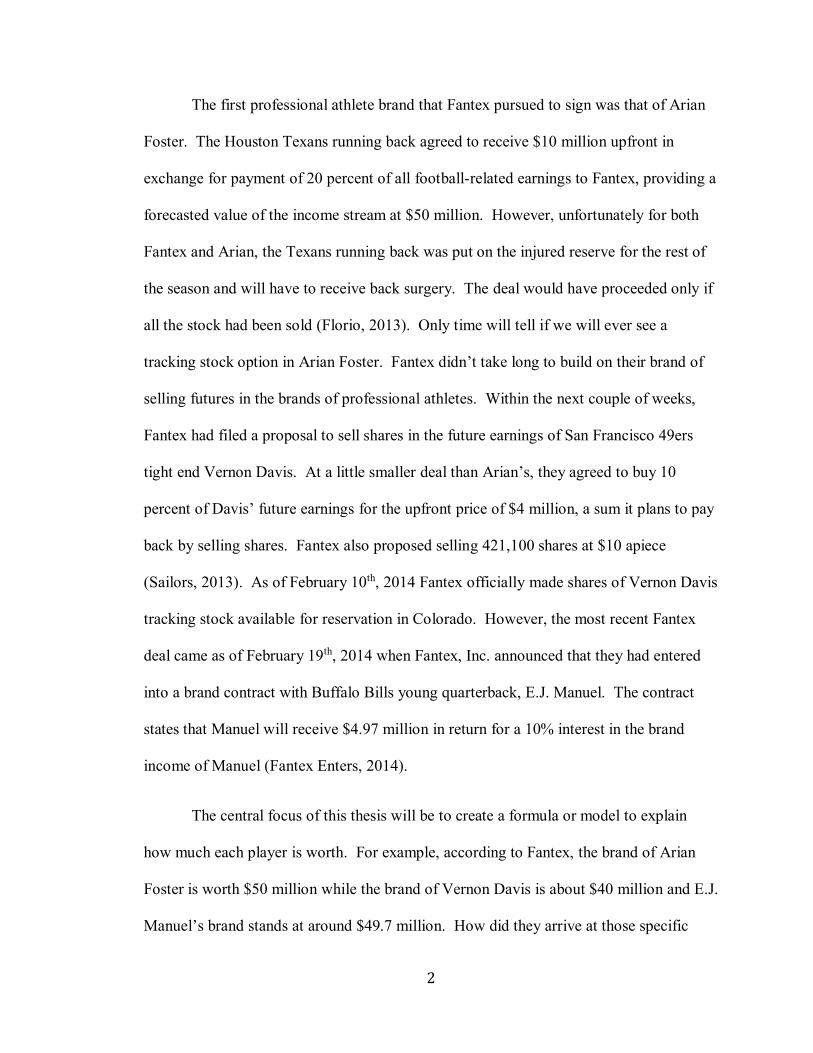
The first professional athlete brand that Fantex pursued to sign was that of Arian
Foster. The Houston Texans running back agreed to receive $10 million upfront in
exchange for payment of 20 percent of all football-related earnings to Fantex, providing a
forecasted value of the income stream at $50 million. However, unfortunately for both
Fantex and Arian, the Texans running back was put on the injured reserve for the rest of
the season and will have to receive back surgery. The deal would have proceeded only if
all the stock had been sold (Florio, 2013). Only time will tell if we will ever see a
tracking stock option in Arian Foster. Fantex didn’t take long to build on their brand of
selling futures in the brands of professional athletes. Within the next couple of weeks,
Fantex had filed a proposal to sell shares in the future earnings of San Francisco 49ers
tight end Vernon Davis. At a little smaller deal than Arian’s, they agreed to buy 10
percent of Davis’ future earnings for the upfront price of $4 million, a sum it plans to pay
back by selling shares. Fantex also proposed selling 421,100 shares at $10 apiece
(Sailors, 2013). As of February 10th, 2014 Fantex officially made shares of Vernon Davis
tracking stock available for reservation in Colorado. However, the most recent Fantex
deal came as of February 19th, 2014 when Fantex, Inc. announced that they had entered
into a brand contract with Buffalo Bills young quarterback, E.J. Manuel. The contract
states that Manuel will receive $4.97 million in return for a 10% interest in the brand
income of Manuel (Fantex Enters, 2014).
The central focus of this thesis will be to create a formula or model to explain
how much each player is worth. For example, according to Fantex, the brand of Arian
Foster is worth $50 million while the brand of Vernon Davis is about $40 million and E.J.
Manuel’s brand stands at around $49.7 million. How did they arrive at those specific

3
valuations? This thesis will explore a number of variables to consider in order to build a
winning model for Fantex and the investor and explain why. However, instead of
searching the NFL for a brand, I will investigate a handful of basketball players from the
NCAA that will most likely be entering the NBA draft this summer. The players I have
chosen are some of the best players in the country from freshmen to seniors. Essentially,
I will be coming up with my own proprietary model for valuing NBA prospects.
Importance of this study
This is one of the first theses of its kind. With Fantex only very recently in the
market with the revolutionary idea to buy and sell tracking stock in a professional athlete,
there is obviously limited information about this relatively new concept. In this thesis, I
will develop a model that will evaluate and determine how much University of Kansas’
freshman small forward and projected top 5 pick, Andrew Wiggins and Creighton
University’s senior forward and Naismith/Wooden award winner, Doug McDermott are
worth. I will come up with an exact dollar figure and explain the calculations used to
determine the upfront price that will be paid to the athletes, the percentage on future
earnings of the athlete’s brand, the number of shares offered, and the price at which those
shares will be sold on the exchange. I am creating these models so that I can come up
with my own equation to value these phenomenal college athletes, and determine if
investment in their brand would be a profitable venture. This analysis will provide new
information about the effect of endorsement deals, player statistics, current contract,
likeability, and other variables (that will be explained later) on a player’s stock. I will
also talk about why anyone would start these markets and why anyone would invest, as
well.

4
Overview of the Present Study
This study will use data from every NBA draft lottery pick from 2003-2013. The
data more specifically will take these players’ statistics from their last year of college. If
they skipped college and went straight to the league from high school or if they are
international they were automatically omitted. This study is attempting to evaluate
Wiggins’ and McDermott’s game-performance statistics from their last year of college
and compare them to 111 NBA draft lottery picks’ numbers in their last year of college in
order to come up with a forecast of Wiggins’ and McDermott’s first year salary, second
year salary, third year salary, etc. I will be running an OLS regression with those 111
NBA draft lottery picks’ last year of college statistics. More specifically, a regression
using the particular variables I have chosen (Figure 5) to be significant. I will then
multiply each coefficient by each of Wiggins’ and McDermott’s relative statistics in
order to get a correct prediction of their first year salary. I will do that for as many years
as I can until the results start getting omitted and skewed. They will start getting skewed
simply because there will not be enough data.
Next, in order to take into account career potential, athletic ability, talent, height,
weight, wingspan, etc., I will be running another regression using NBA mock drafts
instead of college statistics to project their future salaries. I will be running an OLS
regression with all 153 NBA draft lottery picks from the last ten years, providing each
player’s specific draft position along with their salaries. I will only include salaries where
players have either already been paid or are guaranteed to be paid. If there are team
options or player options or any sort of deal that is not entirely guaranteed that figure will
not be included. Once this second regression has been run, I will repeat the process as I

5
did in the previous college statistics regression I mentioned in the last paragraph in order
to find their projected salaries, multiplying each coefficient by each of Wiggins’ and
McDermott’s mock draft position to get their respective forecasts. Once I have both of
the regressions done and the projections for each model calculated, I will average the
results together and use the present-value exercise to get a more accurate figure.
Essentially, I am coming up with a forecast model to determine the influence of
each statistic on a player’s salary. I am taking a specific player, plugging in their actual
college statistics into the equation (player’s last year of college statistics + model
coefficients) and coming up with each player’s predicted salaries. Once I have their
predicted salaries I will estimate the likelihood of endorsements and exactly how much
they might bring in. I will then approximate how long each player will play in the
league. Finally, I will create a contract, similar to Fantex’s contracts, to offer each
player. However, instead of continuing into the football market and looking at players
that have already played a couple of years in the league, I will be switching the focus to
the NBA. But not veterans or anyone that has played even a minute in the NBA, I will be
looking at NBA prospects. I have chosen to evaluate a very talented freshman who was
projected to go number 1 in the NBA draft before his season began and a senior that will
go down as one of the greatest college basketball players to ever play the game. By the
end of this thesis I will put an accurate share price on the freshman from the University of
Kansas, Andrew Wiggins, and the senior from Creighton University, Doug McDermott,
just as Fantex priced Arian Foster, Vernon Davis, and E.J. Manuel.
The next chapter will explore the literature on the history of Fantex, other
comparable ideas to Fantex as well as how effective those ideas are, and towards the end

6
talk about some literary concepts that are relevant. Chapter III will then discuss the
economic theories of why an individual would either invest or enter this market. It will
cover some of the literary concepts that were discussed in Chapter II, as well. Chapter IV
will discuss the data set used in order to successfully run a series of regression analysis
models in order to accurately depict the NBA prospects’ salaries and values. Chapter V
will then discuss the results of these regressions, while also getting to the main point of
this thesis: the value (price per share) of these NBA prospects.
Literature Review
This chapter will review the literature on the history of this tracking stock as well
as other similar approaches of its kind. Because Fantex is such a relatively new idea,
there really isn’t too much literature on the subject. That being said, I will begin by
dissecting the literature that pertains to the direct history of Fantex Brokerage Services,
the billion-dollar minds behind the operation, and how this revolutionary idea came
about. I will then share to other comparable ideas to Fantex that are currently in the
market, and discuss how effective they are. In doing so, this chapter will convey the
history of how this idea came about and the future potential of this company and idea.
Fantex Chief Executive Officer Buck French imagines a bustling stock exchange
where fans and investors can trade on the value of personal brands. “Our goal is to have
athlete brands in all major sports, and globally as well,” (Gaylord, 2013) he says. Just
like other tracking stocks, investors will not have any ownership over the actual brand.
Every athlete may lead his professional life in whatever direction he sees fit. The first
athlete Fantex targeted, as mentioned earlier, is the Houston Texans’ running back, Arian
7
Foster. The twenty-seven year old has a solid career in designer-watch ads and ESPN
spots; all part of the Arian Foster brand that investors could turn into a nice profit. If it
turns out that Foster is on the back end of his career, however, the IPO will be little more
than a novel stimulus package for the Pro Bowl back. (Gaylord, 2013) The idea seems
great, in theory.
Some have other views on it. “I think it’s pretty dubious… The sport in which
[Fantex’s plan] is least likely to work out is football, at least from an investor’s
perspective.” Says finance professor from the University of Houston Craig Pirrong
(Gaylord, 2013). Obviously football is a high-risk sport with hard-hitting plays that occur
every down. There is added risk with the NFL now being under a microscope because of
what is being learned about the long-term disabilities to players related to multiple
concussions from playing the sport. Football has the highest risk of career-ending
injuries. An average NFL player lasts six years in the league; Foster is currently sitting at
year five (Gaylord, 2013). However, there are many things that could turn the public off
on an athlete, inevitably dooming his stock. Arian Foster turns out to be an interesting
case study in that he had season ending back surgery less than a month after his stock was
supposed to be released (Arian Foster Injury, 2013). Then, compounding the risk to his
stock price due to injury, were rumors that damaged Foster’s brand pertaining to his
mortality and personal integrity. On January 13th, 2014 stories starting popping up saying
that Arian Foster not only cheated on his wife of three years and got the other woman
pregnant, but he also allegedly pressured his mistress to have an abortion (Barrabi, 2014).
There has been no word from Fantex yet on the future of the Arian Foster IPO stock, but
as you can imagine it can’t be good.

8
It is given that there are potential downsides and people who don’t think this idea
will work. However, there are plenty of proponents to this cause as well. A few have
made the point that with the amount of uncertainty football players deal with in terms of
their future, they have a strong incentive to lock-in a guaranteed level of compensation as
Arian Foster and Vernon Davis have. The only way for athletes to share their risk fully is
to sell an equity interest in their earnings (Skin in the game, 2013). The athlete sees this
investment as a win-win. With football being such a risky profession, taking the upfront
cash helps players prepare for their life after football.
Interestingly enough, this is not the first time that the idea of trying to sell stock in
an athlete was proposed. In 2008 a minor league baseball player named Randy Newsom,
tried to offer himself up as an I.P.O. He offered investors 4% of his future major league
income at $20 per share, with each share entitling the owner to .0016% of his potential
major league earnings. So the total revenue he would have raised in return for 4% is
$50,000 (Levitt, 2008). Newsom’s bet was that investors would be willing to accept a
lower return for their investment in return for having fun. Selling a small share of him
gives others a way to vicariously live through him while paying a small fee (Grzegorek,
2009). Randy and a couple others ended up founding Real Sports Investments, LLC
(later renamed Real Sports Interactive) and ended up selling about 1,800 shares of his
stock before the SEC and Major League Baseball turned it down (Grzegorek, 2009).
Eleven years before Randy Newsom and his eye-popping idea of selling stock in
himself ran out, an orange-haired, androgynous icon of the 1970s and 1980s, singer-
songwriter, David Bowie, became the first entertainer of any stripe to “securitize”
himself. The rock legend bought up to $55 million of so-called ‘Bowie Bonds’ privately

9
placed by Fahnestock & Co., a New York City investment firm. Future royalties back the
bonds from 25 albums that Bowie recorded before 1990. According to David Pullman,
the Fahnestock managing director who put together the deal, Bowie was selling more
than 1 million albums a year up to 1997. The bonds have a 10-year average-life at 7.9%.
The bond sale allowed Bowie, who at the time was worth more than $100 million, to
collect his royalties up front and to retain total control of his music (Allis, 1997).
What Fantex has brought to the table is more than just being able to invest in one
of your favorite athletes. It just brought the life of a fan and fantasy football owner closer
to their dream of really being part of the action. It has opened up a world for new ideas.
Why just stop at athletes? What about celebrities? Young actors? Imagine investing in
celebrities like Justin Timberlake, Ryan Gosling, or Brittney Spears when they were just
kids and leaving the Mickey Mouse Club. Or even someone older like Jonah Hill right
after the release of “Superbad”. Investing in a young Jaden Smith right now could be
lucrative. Joe Queenan, an American journalist, critic and essayist, takes the possibilities
another step further. Queenan proposes that there is no reason why these creative IPOs
can’t extend to hotshot economists, cutting-edge fashion designers, trendsetting magazine
editors and high-profile cardiologists. Why can’t investors buy shares in fast-rising talk-
show hosts, potentially amusing stand-up comics and up-and-coming politicians? If you
had bought shares in Barack Obama a decade ago, he points out, you’d be worth billions
already (Queenan, 2013). You could even go more down-market instead of just
celebrities. At a school like Colorado College, I’m surrounded by aspiring individuals
for all different types of careers: DJs, doctors, surgeons, physicists, teachers, clothing
designers, real estate agents, lawyers, you name it. Why not invest in them now?

10
Interestingly enough, there is a site that does just that. The company is called
Pave. Pave has a website that allows backers to invest directly in an individual, not a
project or company. Payments are linked to the individual’s income, which creates a
natural incentive for both backers and prospects to achieve great things together. An
example of how the site works is a young prospect will create an account on pave.com.
Their account or profile will state their goals, experience and funding goal. The site then
independently verifies the prospect’s identity, education and credit history before they
appear on the website. Pave then works with the prospects to set a funding rate. Pave
analysts predict the prospect’s future income using their own proprietary income model
and propose a funding rate that is fair for both prospects and backers (all prospects have
an estimated return of 6-8%) (Pave, n.d.). The funding rate is what the prospect can raise
for each 1% of income shared for the life of the contract (5 or 10 years). The “backers”,
as they are called, are successful and experienced individuals who invest directly in the
prospects of their choosing. They can invest for as little as $500. Once the campaign for
funding is over, prospects keep their backers updated on their career. They then make
recurring payments through Pave based on what they earn (Pave, n.d.).
Finally to wrap up this section, I will introduce a couple literary concepts in order
to put the market in context. The first literary concept is investment and more
specifically investing in sports. When you think about the sports world as an investment
theme and think about it abstractly, most investors would consider this as a good choice.
Professional sports are one of the leading industries in brand loyalty (Abraham, 2012).
People will do anything for their teams. Fans want to show that they have more pride in
their team than their competitor does. They want to be the best fan and watch as many

11
games as possible. They also pass down this brand loyalty from generation to generation.
And now with technology advancements, individuals can watch live sporting events or
highlights on their phones or computers; not to mention satellite radio, pay-per-view
showings, or even the league’s own network channel. All of these distribution channels
are revenue drivers for these businesses. The NFL, NBA, NHL, and MLB all have their
own networks now where they can reel in more of the advertising revenue instead of
having to share it with the traditional networks such as ESPN, FOX, CBS, or NBC
(Abraham, 2012).
Another unbelievable advantage that the sports world has that isn’t true for other
businesses or industries is the lack of competition major sports leagues have. As many
economists would claim: “There are too many barriers to entry” to compete with Major
League Baseball, the National Football League, the National Basketball Association, or
even European soccer especially considering some of the leagues are also protected
legally by anti-competition legislation (Abraham, 2012). The attempts to break in and
contest these leagues have failed. When you step away and just think about that as an
investment theme, it sounds pretty good. However, there are negatives to investing in
this dog-eat-dog world. Investing is never without risk.
Economic shocks don’t skip over professional sports. With the recent 2008
market correction, ticket sales plummeted, which caused imminent television blackouts in
many teams. This was the first year in which multiple sports teams that were in the
playoffs had a threat of blackouts because of the low-ticket sales. An added factor in
low-ticket sales this year was because of the below-freezing temperatures. An economist
would describe the demand for attending sporting events as elastic in that a change in

12
someone’s income would shift demand downward or a change in the products costs
would shift ticket prices upward while having a material impact on final demand
(Abraham, 2012).
The next literary concept is risk smoothing and more specifically for the athlete.
Risk smoothing is defined as “financing risk in such a way that the financial impact of
incurred losses is distributed between members of the risk pool over more than one
financial reporting or policy period. Also known as chronological stabilization plans”
(Risk Smoothing, n.d.). In a simpler fashion, risk smoothing can be seen as insurance.
Insurance is a method of making accumulations to meet uncertain losses, and the
economic benefit, which it confers upon society, is the result of the reduction in the
amount of these accumulations and the elimination of the part due to uncertainty (Willet,
1951). The Fantex model itself can be looked at as an insurance policy to these NFL
players where contracts are not guaranteed and the average professional career is only
around six years. People forget that NFL players have a history of struggling with the
handling of their money. ESPN films, directed by Billy Corben, recently came out with a
documentary precisely about NFL players who lost it all.
The title of the documentary, fittingly enough, is Broke. The film indicates that a
lot of the financial troubles that these athletes endured were from being sucked into bad
investments, “family” or “friends” that stalked them for money, their competitive nature
to show off and ‘be the man’, and so on. All of which quickly brought these NFL players
to their economic doom. One of the more interesting reasons for athletes blowing their
money is due to their competitive nature. One of the former NFL pros that was talking,
was explaining why they would spend so much money in clubs and it was because they

13
wanted people to know who they were or they wanted to spend more than their
counterparts to show that they’re famous. He continues by explaining that people don’t
get to see their faces when they’re on the field like NBA players or even MLB players
because they have to wear a helmet, so their way of letting people know who they were
was by spending ridiculous amounts of money on frivolous things. That doesn’t make it
okay and it isn’t to justify it, it is to simply explain the culture of NFL athletes. Broke is
essentially, from the director himself, a step-by-step guide on “How To Lose Millions of
Dollars Without Breaking a Sweat”. The conventional wisdom is that athletes blow a lot
of money on thoughtless, useless things. Broke explains that although that is absolutely
true, that is only the beginning of it. The film shows that there is an inherent mind-set for
these professional athletes to go broke (Corben, n.d.).
Theory
This chapter will discuss the economic theories that pertain to the data in this
thesis as well as some of the literary concepts that were discussed in Chapter II, risk
smoothing and return on investment. It will also focus on explaining economically why
someone would enter or invest in this market and why a player would agree to such a
deal. This chapter will start off with the economic theory behind the main data sets of
this thesis, college statistics.
College Statistics
This section will focus on the economic theories that relate to a player’s college
statistics to his salary. This thesis aims to quantify the type of statistics a player must put
up in order to receive the highest salary possible.

14
The Moneyball thesis or theory is the most applicable when it comes to college
statistics as an independent variable. The Moneyball theory uses statistical analysis in
order to support small market teams by buying assets that are undervalued by other teams
and selling ones that are overvalued by other teams. The Moneyball theory was used in
the movie “Moneyball” for the Oakland A’s and the best-known Moneyball theory used
on-base percentage as an undervalued asset with sluggers being overvalued. From 1993-
2003, on-base percentage was a significant predictor of wins, but not even close to a
predictor of individual salaries. Players who drew walks were cheap (Grier, 2011).
Now of course, the Moneyball theory was made famous in baseball. It wasn’t
until 2011 when Daryl Morey, general manager of the Houston Rockets, brought it to
basketball. In the summer of 2012, Morey dismantled a young Rockets team involving
13 moves for 31 different players and four draft picks. After all that chaos, only one
Houston rotation player, young second-year small forward Chandler Parsons, stood
alone. What was the basketball Moneyball theory? Morey started by doing something
unheard of in the NBA and that was choosing to stay as a middle-of-the-pack team
instead of bottoming out and rebuilding through the draft. His plan was to return to title
contention without entering the lottery. His plan was to acquire a “foundational” player
again, without entering the lottery. They built up their assets and targeted second-round
picks, which they considered to be the league’s most undervalued commodity, the on-
base percentage of basketball if you will. Morey estimates that the Rockets will spend
ten times the money the next time it comes to investing in quantitative analysis. They
drafted Chandler Parsons 38th in 2011 (Ballard, 2012). If you’ve watched any of the

15
Houston vs. Portland 2014 first round series, you’ve seen how valuable and how big of a
steal Mr. Parsons was in the NBA draft.
Morey then started unloading players once their value peaked as Billy Beane did
with the Oakland A’s. The Houston Rockets’, Carl Landry and Rafer Alston were two
well-known fan favorites that were let go. Alston traded amid a playoff push for backup
Grizzlies’ guard, Kyle Lowry. Aaron Brooks then took over and started turning himself
into a 19-point-a-game scorer. Morey then flipped Brooks to the Suns for their backup
point guard, Goran Dragic. A steal, if you ask me. Lowry then developed as a starter and
became better than anyone had imagined. So valuable in fact that Morey flipped him to
the Raptors for a protected first-round pick in the 2013 draft that became essential in the
deal that acquired James Harden (Ballard, 2012). James Harden went from being the
sixth man for the Oklahoma City Thunder, granted he was sixth man of the year, to being
one of the best players in the NBA. Harden has averaged at least 25 points per game the
past two seasons on the Rockets where he had previously averaged 16.8, 12.2, and 9.9 on
the Thunder (James Harden, n.d.). They found more than one foundational player
considering that in the 2013 off-season the Rockets picked up one of the best centers in
the game in Dwight Howard. The Rockets are currently fourth in the Western
Conference and known as one of the hardest teams to beat in the league right now (NBA
Standings, n.d.).
NBA general managers are starting to analyze player’s statistics differently. It’s
no longer who scores the most points per game or any of these aesthetically pleasing
numbers. Of course there are exceptions, but GM’s are always looking for a new way to
find underrated or undervalued talent that others wouldn’t think of. Only recently,

16
another undervalued statistic was recently written about. Benjamin Morris, sportswriter
for ESPN’s Five Thirty-Eight website, claims that if you had to pick one statistic from the
common box score to tell you just how valuable a player is to his team, it isn’t how many
points he dropped or how many rebounds he grabbed but rather the number of steals.
Morris specifically uses Ricky Rubio, point guard for the Minnesota Timberwolves, as
his example. Ricky Rubio is ranked as the 49th best player in the league according to
ESPN’s TrueHoop Network. Although his scoring numbers aren’t good, and by not good
I mean of all players averaging 30-plus minutes a game, Rubio’s 10 points per game is
the third-fewest overall, and worst of all guards. However, his 2.4 steals per game are the
second most trailing only five-time NBA steal champion Chris Paul by .1. Rubio does
have the upper hand on Paul when it comes to steals per minute and steal percentage
(Morris, 2014).
John Hollinger, current VP of Basketball Operations for the Memphis Grizzlies,
and former ESPN analyst, has his own player efficiency rating that has Rubio ranked 82nd
in the league while his teammate and NBA All Star, Kevin Love, is fourth in the league.
Morris has a problem with Hollinger’s formula saying that Hollinger vastly undervalues
steals. In Hollinger’s formula, he has a single steal basically equating a simple two-point
basket. Why are steals so important? Morris believes that steals hold additional value
when predicting the impact of the players who get them to their team. He ran a
regression using each player’s box score stats to predict how much teams would suffer
when someone couldn’t play. The results were interesting. One rebound is worth 1.7
points per game, one assist worth 2.2, one turnover worth 5.4, one block worth 6.1, and
interestingly enough, one steal worth a staggering 9.1 points per game. Essentially, a

17
player who averages 16 points and two steals a game is predicted (assuming all else is
equal) to have a similar impact on his team’s success as one who averages 25 points but
only one steal (Morris, 2014).
Morris states the following as his reasoning behind why steals are so important.
He believes that if you think about a basketball game and all that occurs during the course
of a game, points, rebounds and assists are what is expected; It is just the nature of the
game. But, and this is key, Morris explains how some things only happen because
somebody makes them happen, like a steal or a block. If you were to replace a player
with someone less skilled in the exact same position at the exact same time, it wouldn’t
occur (Morris, 2014). That is why blocks are so high as well. After reading Morris’
article, I made sure I inserted steals into my final model where I will be evaluating these
NBA prospects.
Risk Smoothing
This section will focus more on the economic theories that relate to why anyone
would invest in or start these markets. Through these theories, this thesis aims to convey
why a professional athlete would agree to such a concept.
When you think about an average professional football player’s career, it isn’t
long. Reports show the average player is in the league for 3.2 years (Bennett, 2011) and
78% of former NFL players are bankrupt or under financial stress after they have been
retired for a mere two years (Corben, n.d.). A statistic such as this is startling as a normal
individual, but even more if you’re an NFL player just entering the league or have been
around a couple years. It is one of the most hard-hitting sports around where guaranteed

18
money in contracts is hard to come by. Such a physical sport causes a lot of injuries.
Sometimes they’re minor, but career-ending plays happen almost every game. NFL
players know this and understand this. The economic theory of risk smoothing or more
simply, insurance, is what is present. NFL players never know which game will be their
last, so if such an opportunity presents itself as it did to Arian Foster, Vernon Davis or EJ
Manuel from Fantex where there is upfront money, not to mention it’s a couple million
dollars, you take it.
If the scenario happens where Foster, Davis and/or Manuel have a long illustrious
career and Fantex and its investors profit from their brand(s), I think it is fairly clear that
this is a scenario all parties can live with. In not doing the deal, the risk to the players
would be turning down upfront millions and having a career ending injury early on in
their career. However, that only works for some of the players in the league. Other
players like a Matt Ryan or an Aaron Rodgers are guaranteed $59 and $54 million
respectively (Thomas, 2013). A couple million upfront for their future earnings wouldn’t
be worth it for them. The reason is because what they’re being offered up front doesn’t
compare to what they will have coming to them in the future. They would essentially be
handing money to Fantex without receiving any value in return.
Another reason why these athletes would enter into this market is because of the
connections and endorsements Fantex can introduce them to. That is one reason why
Fantex is so interesting because of their elite board members and the connections to
endorsements they bring. Denver Broncos great John Elway serves as a director along
with golf legend Jack Nicklaus and NBA star Kerry Kittles who are both advisors. They
also have another advisor on board named Colonel Gregory A. Gadson who was not only

19
a Co-Captain of the 2007 Super Bowl champion New York Giants, but also starred in the
feature film Battleship. Not to mention the fact that the rest of the board is full of
business, technology, banking, and financial geniuses. So although it seems like they are
giving up a lot of their future earnings, Fantex opens doors for them that they might not
be able to get without them.
Return on Investment
This section continues to explore why anyone would enter into this market or
invest. The previous section touched on the professional athlete’s side while this section
will concentrate on the investors’ and creators of Fantex’s point of view.
In order to sufficiently explain why someone would invest in this market or a
professional athlete, Jake Mann, sportswriter for The Motley Fool, broke down the
numbers specifically to explain the upside of investing in a young athlete such as E.J.
Manuel (QB for the Buffalo Bills). His thesis statement, if you will, and main point is
that until there is a proven market for athletes, there is no way to know just how much
more investors will prefer younger players; investors will want to see a player’s Price-to-
Brand Value ratios – let’s call it P/BV – be higher than that of their peers (Mann, 2014).
Another very important detail that he talks about is that while the Fantex executives
cannot control how well the athlete performs on the field, they do help with sponsorship
connections and in turn can generate more endorsement deals. Fantex bought 10% of
E.J. Manuel’s brand value for $4.97 million, meaning they value him at $49.7 million for
his remaining football-related income. His current contract takes care of nearly $9

20
million of this valuation; so a little over $40 million must be collected for Fantex’s
investment to come full circle (Mann, 2014).
Figure 1
Source: (Mann,2014)
Figure 2
Scenarios Contract Endorsements Dividend Payout
Scenario A1 NFL Top 50 Avg. Excellent 20%
Scenario A2 NFL Top 50 Avg. Excellent 40%
Scenario B1 NFL Top 50 Avg. Average 20%
Scenario B2 NFL Top 50 Avg. Average 40%
Scenario C1 NFL Average Average 20%
Scenario C2 NFL Average Average 40%

21
Note. Contract data from Spotrac. Estimates and graphs compiled by Jake Mann.
Assumes rookie signing bonus is spread evenly among first four years, and uses an
inflation rate of 2.5% to estimate contract value. Horizontal axis in years, in terms of
Manuel's career.
Scenario A is Mann’s best-case scenario where Manuel would sign a contract
equal to the annual average of the NFL’s top 50 QBs ($6.9 million) when he becomes a
free agent in 2017. That means Fantex will break-even in EJ Manuel’s eighth season
when he turns 30. This assumes his “Excellent” endorsements are at $2 million a year.
Scenario B portrays Manuel’s contract as the average of the NFL’s top 50 quarterbacks
while his endorsements estimated at a much inferior $300,000 per season (Mann, 2014).
Although the upside shrinks, the investment breaks even in the ninth year because on-
field income would remain high. There is also a slight difference depending on the
dividend rate. The last scenario estimated and calculated by Mann is Scenario C which is
what investors would be expecting if Manuel signs a long-term contract equal to the total
NFL quarterback average at $3.8 million (includes all backups in the league). This deal
also assumes that he can’t improve his endorsement value significantly over time (Mann,
2014).
The key to the future of the E.J. Manuel brand comes back to the Price-to-Brand
Value ratio or P/BV. If his stock trades at, let’s say, a P/BV of 2.0 instead of 1.0 this is
what his valuation would look like (Figure 3).
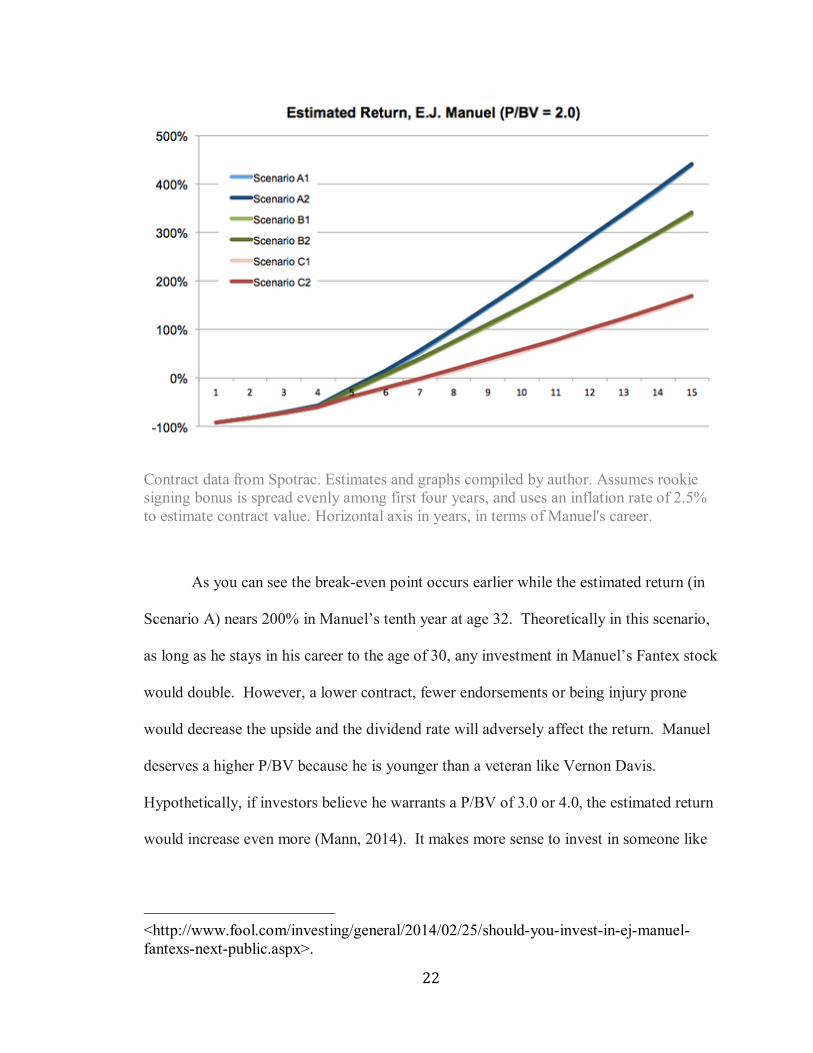
Figure 31:
1 Mann, Jake. "Should You Invest in E.J. Manuel, Fantex's Next Publicly Traded
Athlete?." The Motley Fool. N.p., 25 Feb. 2014. Web. 1 Apr. 2014.
22
Contract data from Spotrac. Estimates and graphs compiled by author. Assumes rookie
signing bonus is spread evenly among first four years, and uses an inflation rate of 2.5%
to estimate contract value. Horizontal axis in years, in terms of Manuel's career.
As you can see the break-even point occurs earlier while the estimated return (in
Scenario A) nears 200% in Manuel’s tenth year at age 32. Theoretically in this scenario,
as long as he stays in his career to the age of 30, any investment in Manuel’s Fantex stock
would double. However, a lower contract, fewer endorsements or being injury prone
would decrease the upside and the dividend rate will adversely affect the return. Manuel
deserves a higher P/BV because he is younger than a veteran like Vernon Davis.
Hypothetically, if investors believe he warrants a P/BV of 3.0 or 4.0, the estimated return
would increase even more (Mann, 2014). It makes more sense to invest in someone like
<http://www.fool.com/investing/general/2014/02/25/should-you-invest-in-ej-manuel-
fantexs-next-public.aspx>.

23
an E.J. Manuel over a Vernon Davis because of the age difference. Manuel has more
time to develop and become a star. He also has more time to bring in big contracts and
big endorsement deals. In a league like the NFL, or really any league, stars come and go
and new stars come around every year. E.J. Manuel could very much be that next star.
And that is exactly Fantex’s thought process.
Investing in Fantex is more than just investing in an athlete’s on-field
performance. Investing in Fantex is investing in that athlete’s brand and brand value.
Currently, E.J. Manuel is a second-year player that is amid a four-year, $8.88 million
contract with the Buffalo Bills. The contract includes a fully guaranteed $4.8 million
signing bonus (Mann, 2014). If you were to invest in E.J. Manuel, you would be
investing in his entire brand. That includes, among contracts and endorsements,
entrepreneurial endeavors. John Elway offers a good illustration of an athlete who turned
‘entrepreneur’. Not only is Elway the current vice president of football operations for the
Denver Broncos, but he also owns several businesses. Elway purchased Manhattan
Beach Toyota in California in 2007 and is co-owner of Crown Toyota in Ontario,
California and these are only his businesses in California. Elway co-owns the Elway’s
Downtown Restaurant in Denver and plans to open another in Vail, Colorado (Nine NFL
#1, n.d.). A lot of athletes find themselves in either the restaurant or car dealership
industry, but a couple others have been successful in different areas of work.
Daniel Wilcox, former Jets, Buccaneers, and Ravens tight end, finished up his
NFL career in 2008 due to injuries but that wouldn’t be the end of his brand value. His
career had only just begun. Wilcox launched Mr. 83 Degreez Renovations and Designs
in 2009, an Atlanta-based residential and commercial remodeling business named after

24
his own number 83 jersey that he wore in the league. His company employs six and hires
more than 100 subcontractors annually (Nine NFL #4, n.d.). Speaking of venturing into
different industries, this three time Super Bowl Champion of the New England Patriots,
Linebacker Rosevelt Colvin, became a franchisee of The UPS Store and opened a store of
his own in his hometown of Indianapolis. Colvin didn’t stop there; in 2009 he and his
wife opened a cupcake business called Sweeties Gourmet Treats. According to Colvin
himself, revenues at The UPS Store have increased “double digits” since he started
managing full time in 2009. “As an athlete, you’re always competitive,” he continues,
“You look for another challenge to tackle, to be apart of.” (Nine NFL #4, n.d.) That quote
is something that should be remembered when it comes to investing in athletes. These
are highly competitive people in nature. They were born this way and it doesn’t matter
what they’re doing whether it is playing video games, playing tic-tac-toe, or running a
business, if it is a competition they want to win and they want to be the best.
Other NFL players have started technology services and even fast food chains,
one more recent NFL player and another New England Patriot, Jarvis Green, took on a
different project in the construction, restaurant and liquor fields. A true entrepreneur of
all fields, in 2004, the defensive end opened a liquor store in Baton Rouge, Louisiana
called Purple & Gold, although he sold the business venture four years later. He also
owned a restaurant called The Capitol before it closed only recently. Green found out the
hard way just how competitive and cutthroat the restaurant industry is. However, it
didn’t stop him from continuing his entrepreneurial path, Green is currently a co-owner
of a commercial construction company called First Millennium Construction that is also
based in Baton Rouge. “I didn’t want to be known just as a football player because I’m

25
so much more than that.” (Nine NFL #6, n.d.) Another reason to get into this market and
invest in athletes is because they are driven unlike any other and they also are extremely
prideful people. The type of dedication, motivation, passion, and drive that it takes to
make it to the NFL and stay in the NFL is something the average individual doesn’t
understand. Yes, sometimes these guys are just pure talent, but that will only take you so
far. The ones that make it and stay there long enough to get the veterans minimum salary
are the ones that have that it factor. These are individuals that won’t stop competing or
wanting to be the best just because they are done with football.
Data
This study uses data taken from every NBA draft lottery pick from the last ten
years (2003-2013). I took player’s statistics from their last year of college basketball. If
they came straight from high school or were drafted from overseas, meaning they never
played college basketball, then their numbers were automatically omitted. The first
attributes I populated in Excel were the year the players were drafted, their age at the
time, which college they were drafted from, and their position. Next, I took every box
score statistic from the player’s last year of college basketball. That list included: games
26
played, minutes played, field goals made, field goals attempted, three pointers made,
three pointers attempted, free throws made, free throws attempted, offensive rebounds,
total rebounds, assists, steals, blocks, turnovers, personal fouls, total points in the season,
field goal percentage, three point percentage, free throw percentage, average minutes
played a game, points per game, rebounds per game, and finally assists per game. Out of
the 154 NBA draft lottery picks from 2003-2013, 111 played at least one year in college
basketball.
My final data points were the drafted player’s contracts and salaries. I only
included salaries that have either already been paid or are guaranteed so team options and
player options etc. were omitted. The players from the 2003 draft class, especially the
superstars that came out of that class, are the reason that I have an eleventh, twelfth, and
thirteenth year salary because the majority of them have guaranteed money through those
years. However, if you look at the 2013 draft class, their contracts are only guaranteed
for the first two years. Teams may exercise an option to re-sign a rookie for a third
season, and if they do so, they may also exercise their option to keep the player for his
fourth season as well (Jessop, 2012). For this reason, I only inputted the first two years
of their contract for the 2013 class. In the 2012 class, all but one got their third year team
option contract. Just another fact to help explain the way rookie contracts are setup and
why the number 2 pick in the 2012 draft made the same as the number 2 pick in the 2011
draft in the first year but then made less the following year. This discrepancy has to do
with the NBA’s collective bargaining agreement. Each player can earn anywhere
between 80-120 percent of the scaled salary amount assigned to his draft position. The
pattern in the league is that the higher the draft pick, the more likely he is of earning that

27
full 120 percent and that also has a lot to do with the quality of the agent that represents
him (Jessop, 2012).
Figure 4:
Estimated Regression Model
Salary Year = pos3 + pos2 + ORB + STL + BLK + Y + FGA + Z + PA + AA + FTA
+AC + AD + AE + _cons
Table 1:
Variable Definitions
Variable Definition
Pos1 Dummy Variable for Centers
Pos2 Dummy Variable for Forwards
Pos3 Dummy Variable for Guards
G Games
MP Minutes Played
FG Total Field Goals Made
FGA Total Field Goals Attempted
3P Total 3 Pointers Made
3PA Total 3 Pointers Attempted
FT Total Free Throws Made
FTA Total Free Throws Attempted

28
I will now describe
each variable in the above
chart and explain its
significance to my
research.
The majority of
the variables are fairly
simple. The variables
pos1, pos2, and pos3 are
dummy variables for
centers, forwards,
and guards in that order. I
created dummy
variables in order to
separate the players by
ORB Total Offensive Rebounds
TRB Total Rebounds
AST Total Assists
STL Total Steals
BLK
Total Blocks
TOV Total Turnovers
PF Total Personal Fouls
PTS Total Points
Y Field Goal Percentage
Z Three Point Percentage
AA Free Throw Percentage
AB Average Minutes Played Per Game
AC Average Points Per Game
AD Average Rebounds Per Game
AE Average Assists Per Game
stYear 1st Year’s Salary
ndYear 2nd Year’s Salary
rdYear 3rd Year’s Salary
thYear 4th Year’s Salary
AJ 5th Year’s Salary

29
their respective
positions. That also
helps with the statistics
because blocks and
rebounds aren’t nearly
as essential to guards as
they are to centers just
like assists and three-
point percentage
aren’t as vital to centers as
they are to guards. The
variable of games they
played (G) and minutes
played (MP) are measured the exact same way by literally accounting for every game
they played and for every minute a player was on the floor. The variable of age (AGE) is
a player’s age during their final year of college. The variable for field goals attempted
(FGA) is every shot a player took for the season while the variable of field goals made
(FG) is computed by adding up every shot they made. The same method goes for the
variables for three-pointers attempted (3PA), three-pointers made (3P), free throws
attempted (FTA), and free throws made (FT).
The variable of rebounds (TRB) takes into account every rebound the player
grabbed all year while the variable (ORB) only contains the offensive rebounds he
snatched up. The next six variables are calculated the same way. The variables for
AK 6th Year’s Salary
AL 7th Year’s Salary
AM 8th Year’s Salary
AN 9th Year’s Salary
AO 10th Year’s Salary
AP 11th Year’s Salary
AQ 12th Year’s Salary
AR 13th Year’s Salary
Age
Age of the Player When Entering the
Draft
_cons
Constant
Constant Prediction

30
assists (AST), steals (STL), blocks (BLK), turnovers (TOV), personal fouls (PF), and
points (PTS) are all totals that were added up through the year. The next variable of field
goal percentage (Y) is gauged by dividing every field goal the individual made by every
field goal he attempted. Field goal percentage is one of the most important categories
because it essentially tells us how effective the player is as a shooter. Others argue the
opposite saying that field goal percentage doesn’t take into account two things: 1) who is
taking the shot, and 2) where they are shooting from on the floor. They continue by
saying that it is a useful metric for summarizing the probability of a field goal attempt
resulting in a made basket, but when the effect of space is overlooked, it is not a valid
proxy for shooting ability. For example, Tyson Chandler, center for the New York
Knicks, led the NBA in overall field goal percentage in 2012 shooting nearly 68% from
the field. However, 96% of his shots occurred within seven feet of the rim while
shooting 2 for 14 from beyond seven feet (Goldsberry, 2012). In other words, this
category is overrated.
The variables of three-point percentage (Z) and free throw percentage (AA) are
calculated the same way as field goal percentage. Free throw percentage is one of the
more straightforward variables. Everyone shoots from the same distance with the same
space. You either make them or you don’t. Three-point percentage is similar to field
goal percentage in that it also doesn’t take into account the distance of the three-point
shot he is taking, who is taking the shot, or even how much space the player has to
release his shot. There is a difference between the pre-shot motion of the three’s a James
Jones or Steve Novak takes (the majority are spot up three’s off of the catch) and the ones
that Steve Nash (majority of his three’s come off the dribble) takes. Kevin Durant,

31
known as one of the best players in the game today, will take his threes anyway he can
get them -- it is a cardinal sin to give him an open shot. The Average minutes played per
game (AB) is calculated by taking all of the minutes a player has played in his last
college season and divide them by number of games played.
The variable for average points per game (AC) is exactly how it sounds. It is
calculated by dividing the number of points scored by the player throughout the year by
the number of games they played in. When the average person thinks of basketball or
wants to know how good a player is, the first thing they ask you is, “how many points a
game are they averaging?” This is also one of those overrated statistics where it isn’t
necessarily indicative of just how good a player is or how much that player means to their
team, but it is an aesthetically pleasing number, a crowd favorite if you will. The
variables for average rebounds a game (AD) and average assists a game (AE) are also
calculated by dividing total rebounds or assists by the number of games played. These
two, more so assists, are underrated categories. They tell how active the player is during
the game and how much he is getting his teammates involved. The rest of the variables
are all variables for salary. There is a variable for the first year of a player’s salary
(stYear) all the way to his thirteenth year (AR).
My Estimated Regression Model contains the independent variables that I
expected to be important and the ones that I expected to be valuable. However, after
actually running the regressions I saw that only a few of the variables were actually
beneficial to the outcome. After sitting down, looking at the results, and truly thinking
about what they meant and why they came out that way, highlighting only a few key
variables makes more sense.
32
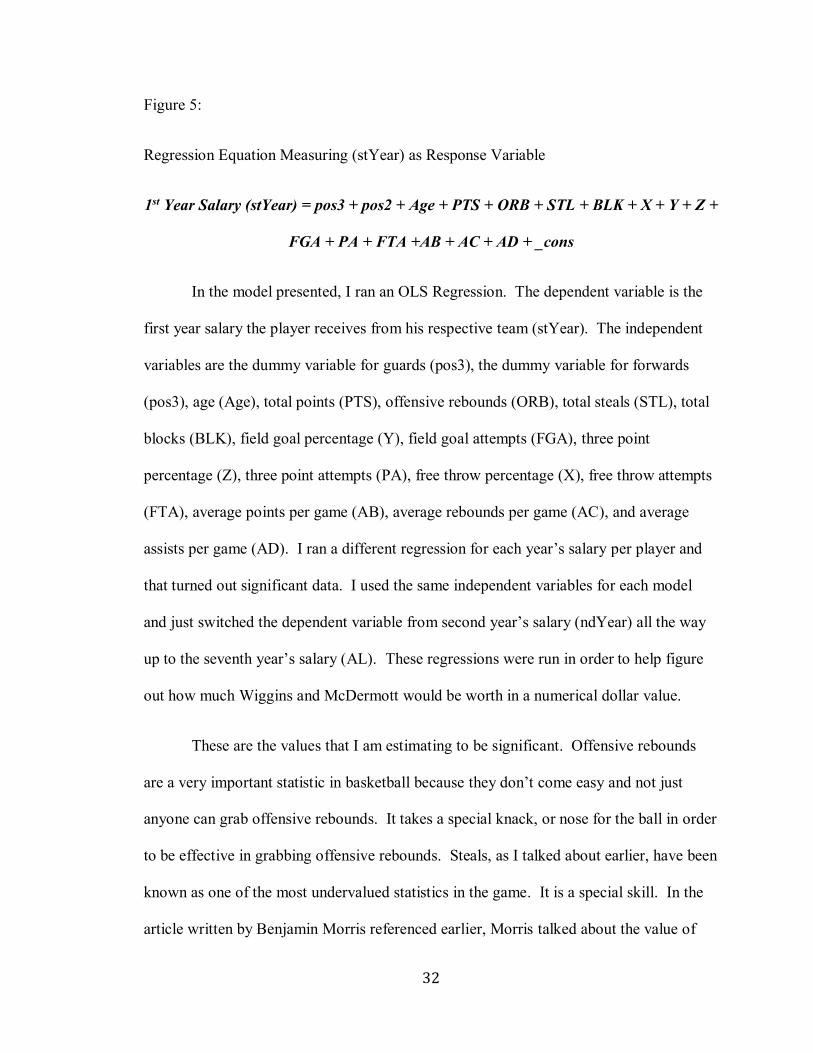
Figure 5:
Regression Equation Measuring (stYear) as Response Variable
1st Year Salary (stYear) = pos3 + pos2 + Age + PTS + ORB + STL + BLK + X + Y + Z +
FGA + PA + FTA +AB + AC + AD + _cons
In the model presented, I ran an OLS Regression. The dependent variable is the
first year salary the player receives from his respective team (stYear). The independent
variables are the dummy variable for guards (pos3), the dummy variable for forwards
(pos3), age (Age), total points (PTS), offensive rebounds (ORB), total steals (STL), total
blocks (BLK), field goal percentage (Y), field goal attempts (FGA), three point
percentage (Z), three point attempts (PA), free throw percentage (X), free throw attempts
(FTA), average points per game (AB), average rebounds per game (AC), and average
assists per game (AD). I ran a different regression for each year’s salary per player and
that turned out significant data. I used the same independent variables for each model
and just switched the dependent variable from second year’s salary (ndYear) all the way
up to the seventh year’s salary (AL). These regressions were run in order to help figure
out how much Wiggins and McDermott would be worth in a numerical dollar value.
These are the values that I am estimating to be significant. Offensive rebounds
are a very important statistic in basketball because they don’t come easy and not just
anyone can grab offensive rebounds. It takes a special knack, or nose for the ball in order
to be effective in grabbing offensive rebounds. Steals, as I talked about earlier, have been
known as one of the most undervalued statistics in the game. It is a special skill. In the
article written by Benjamin Morris referenced earlier, Morris talked about the value of

33
the steal, and he also touched on blocks. One steal equated to 9.1 additional points in the
game, and one block was equal to 6.1 points (Morris, 2014), making a block the second
most underrated or undervalued statistic. Next, I included every shooting percentage in
the game: overall field goal, three-point, and free throw percentage. I also involved a
player’s attempts for each variable as well. The reason is to see if being a high-volume
shooters or someone that gets to the free-throw line a lot would affect contracts. Finally,
I finish up with the player’s averages: points-per-game, rebounds per game, and assists
per game.
To reiterate just exactly what I’m doing, I have run an OLS regression with the
111 NBA draft lottery picks’ last year of college box score statistics. In particular, I ran a
regression using the exact variables that I have chosen in my model above (Figure 5). I
have then multiplied each coefficient by each of Wiggins and McDermott’s relative
statistics in order to get a correct prediction of their first year salary. I built the forecast
to extend 8 years for each player’s salary. As I went into further years, the coefficients
started coming back omitted and the numbers were useless. Essentially I have come up
with a forecast model for the average influence of each statistic on a player’s salary. I
used, as example, specific players in Andrew Wiggins and Doug McDermott, then
plugged in their actual box score statistics from their last year of college into the equation
(player statistics + model coefficients) and I have come up with their predicted salaries.
However, in order to take into account each player’s talent, athleticism, and even
potential, I ran another model using salary as my dependent variable and draft position as
my independent. I used three different websites to get a mock draft position for both of
34
the players, averaged out their draft projections and ran a similar OLS regression. Now
let’s look closer at the results from the first regression.
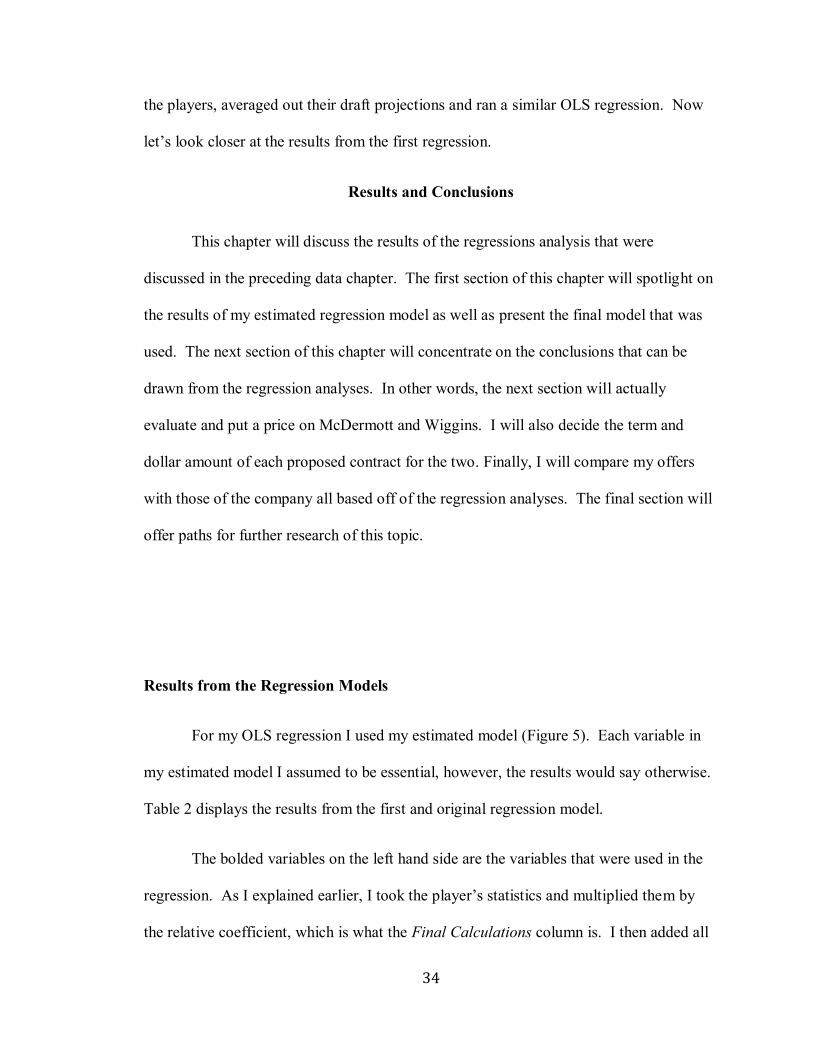
Results and Conclusions
This chapter will discuss the results of the regressions analysis that were
discussed in the preceding data chapter. The first section of this chapter will spotlight on
the results of my estimated regression model as well as present the final model that was
used. The next section of this chapter will concentrate on the conclusions that can be
drawn from the regression analyses. In other words, the next section will actually
evaluate and put a price on McDermott and Wiggins. I will also decide the term and
dollar amount of each proposed contract for the two. Finally, I will compare my offers
with those of the company all based off of the regression analyses. The final section will
offer paths for further research of this topic.
Results from the Regression Models
For my OLS regression I used my estimated model (Figure 5). Each variable in
my estimated model I assumed to be essential, however, the results would say otherwise.
Table 2 displays the results from the first and original regression model.
The bolded variables on the left hand side are the variables that were used in the
regression. As I explained earlier, I took the player’s statistics and multiplied them by
the relative coefficient, which is what the Final Calculations column is. I then added all
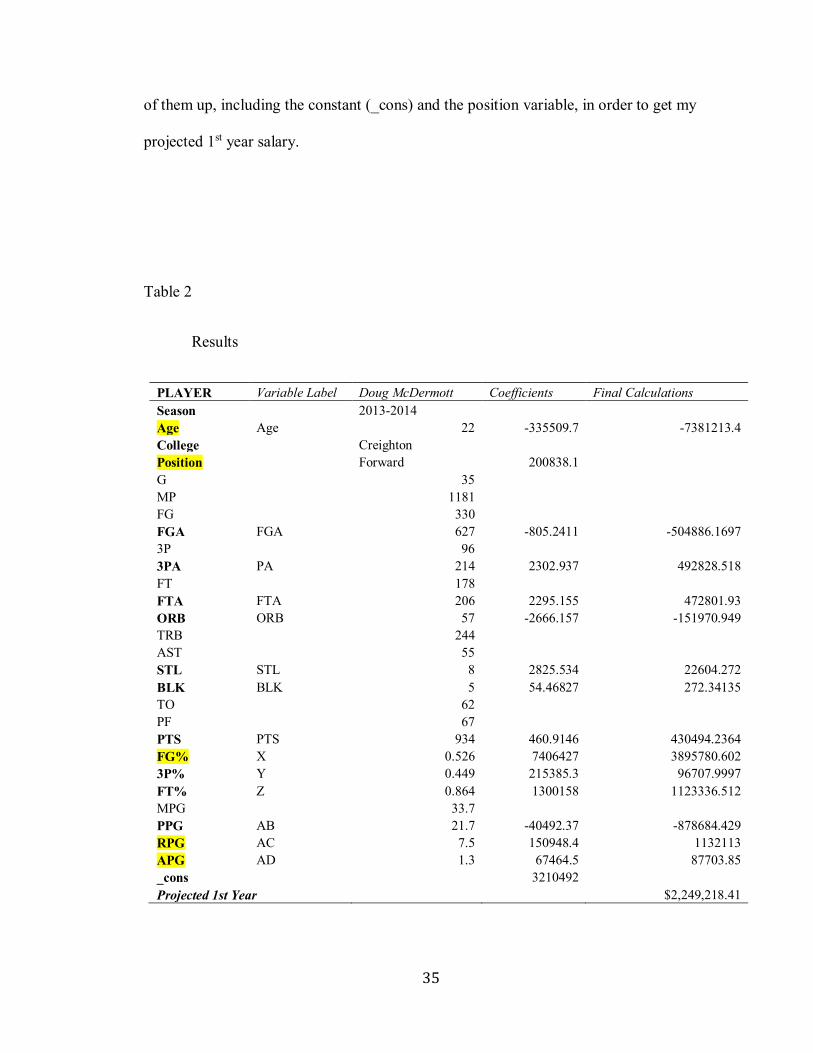
35
of them up, including the constant (_cons) and the position variable, in order to get my
projected 1st year salary.
Table 2
Results
PLAYER Variable Label Doug McDermott Coefficients Final Calculations
Season 2013-2014
Age Age 22 -335509.7 -7381213.4
College Creighton
Position Forward 200838.1
G 35
MP 1181
FG 330
FGA FGA 627 -805.2411 -504886.1697
3P 96
3PA PA 214 2302.937 492828.518
FT 178
FTA FTA 206 2295.155 472801.93
ORB ORB 57 -2666.157 -151970.949
TRB 244
AST 55
STL STL 8 2825.534 22604.272
BLK BLK 5 54.46827 272.34135
TO 62
PF 67
PTS PTS 934 460.9146 430494.2364
FG% X 0.526 7406427 3895780.602
3P% Y 0.449 215385.3 96707.9997
FT% Z 0.864 1300158 1123336.512
MPG 33.7
PPG AB 21.7 -40492.37 -878684.429
RPG AC 7.5 150948.4 1132113
APG AD 1.3 67464.5 87703.85
_cons 3210492
Projected 1st Year $2,249,218.41
36
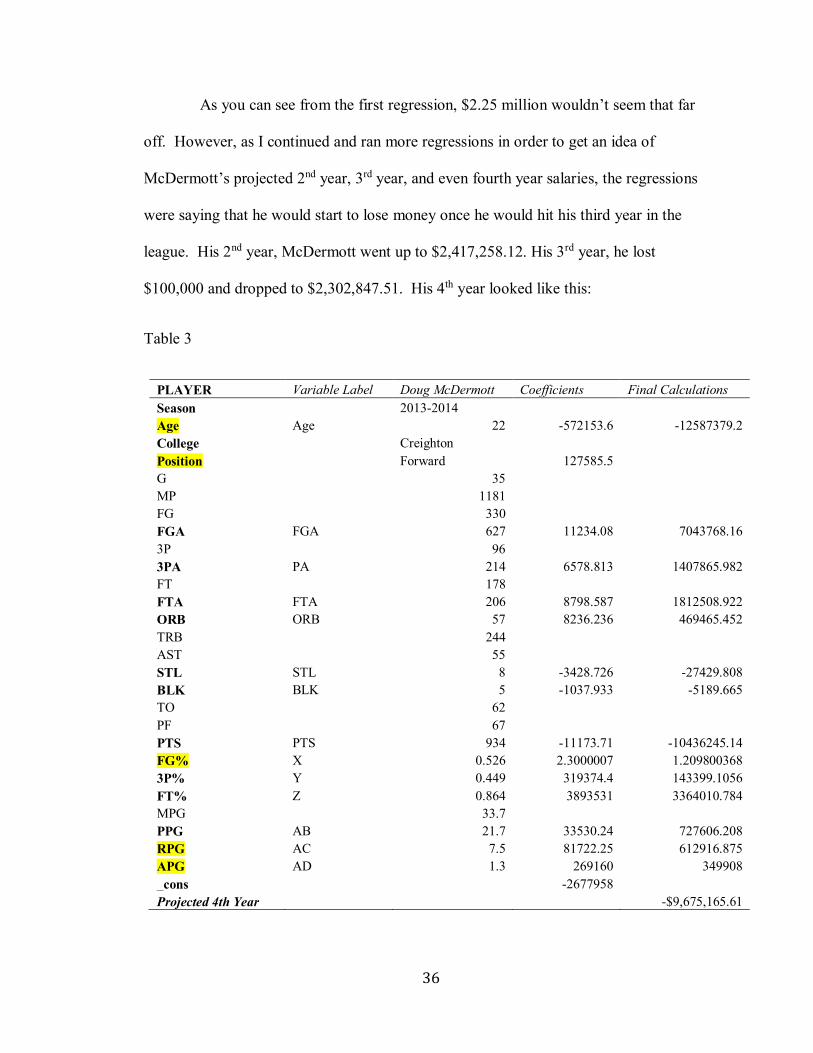
As you can see from the first regression, $2.25 million wouldn’t seem that far
off. However, as I continued and ran more regressions in order to get an idea of
McDermott’s projected 2nd year, 3rd year, and even fourth year salaries, the regressions
were saying that he would start to lose money once he would hit his third year in the
league. His 2nd year, McDermott went up to $2,417,258.12. His 3rd year, he lost
$100,000 and dropped to $2,302,847.51. His 4th year looked like this:
Table 3
PLAYER Variable Label Doug McDermott Coefficients Final Calculations
Season 2013-2014
Age Age 22 -572153.6 -12587379.2
College Creighton
Position Forward 127585.5
G 35
MP 1181
FG 330
FGA FGA 627 11234.08 7043768.16
3P 96
3PA PA 214 6578.813 1407865.982
FT 178
FTA FTA 206 8798.587 1812508.922
ORB ORB 57 8236.236 469465.452
TRB 244
AST 55
STL STL 8 -3428.726 -27429.808
BLK BLK 5 -1037.933 -5189.665
TO 62
PF 67
PTS PTS 934 -11173.71 -10436245.14
FG% X 0.526 2.3000007 1.209800368
3P% Y 0.449 319374.4 143399.1056
FT% Z 0.864 3893531 3364010.784
MPG 33.7
PPG AB 21.7 33530.24 727606.208
RPG AC 7.5 81722.25 612916.875
APG AD 1.3 269160 349908
_cons -2677958
Projected 4th Year -$9,675,165.61

37
Clearly I had a problem with my model. I don’t think my model is good enough
to predict intangible things like what if Doug McDermott developed a terrible gambling
problem entering his 4th year in the league such that he becomes $9.675 million in debt?
Therefore, my next step was to cut down the fat in my model. Looking across my model,
it was clear there were only a couple of variables that were coming up significant
consistently (p-values less than about .10) and they have been highlighted in yellow.
Those were Position, Age, X (field goal percentage), AC (rebounds per game), and AD
(assists per game). Interestingly enough, both total points (PTS) and points per game
(AB) came back highly insignificant. That was probably the most shocking find after
running my first regression. One of the things I was most looking forward to is finding
out how important steals are to getting drafted. For most of the regressions I ran steals
came back significant by itself, however, when I took steals out the other variable’s
coefficients raised. The R^2 between my with-points and without-points are not very
different and the F-stat always rejects the null hypothesis that all of my rhs variables
would equal zero. Because total points never really came back significant I decided to
drop it, along with a couple of other variables.
Table 4
PLAYER Variabe Label Andrew Wiggins Coefficients Final Calculations
Season 2013-2014
Age Age 19 -317529.7 -6033064.3
College Kansas
Position Forward 286129.3
FG% X 0.448 6240542 2795762.816
RPG AC 5.9 121719.9 718147.41
APG AD 1.5 79229.93 118844.895
_cons 4333276
Projected 1st Year $2,219,096.12

38
As Table 4 shows, Andrew Wiggins’ projected 1st year salary came back a little
low at $2,219,096.12, which essentially would project him (based on his stats) at around
the 9th or 10th pick in the draft. A little low for the hype Wiggins is receiving.
McDermott’s projected 1st year came back at $1,932,175.15, which, depending on who
you ask might be a little more accurate projecting him at around the thirteenth pick.
However, once again in their projected 3rd year they started to lose money and in their 4th
year they were in the negative millions. It took me about three or four other regressions
full of different combinations of variables for me to finally find a combo that came back
significant. The one combination of variables that came back significant is Figure 6
below.
Figure 6
1st Year Salary (stYear) = pos3 + pos2 + PA + FTA + X + AC + AD

39
Table 5
Table 6
PLAYER Variabe Label Andrew Wiggins Coefficients Final Calculations
Season 2013-2014
Age Age 19
College Kansas
Position Forward 198927.5
3PA PA 126 1009.633 127213.758
FTA FTA 227 1320.419 299735.113
FG% X 0.448 5900527 2643436.096
RPG AC 5.9 96376.8 568623.12
APG AD 1.5 52940.97 79411.455
_cons -1739168
Projected 1st Year $2,178,179.04
_cons -1739168 1271515 -1.37 0.174 -4256259 777923.9
AD 52940.97 64214.26 0.82 0.411 -74177.57 180059.5
AC 96376.8 51614.26 1.87 0.064 -5798.795 198552.4
X 5900527 2151886 2.74 0.007 1640654 1.02e+07
FTA 1320.419 1497.231 0.88 0.380 -1643.499 4284.336
PA 1009.633 1694.088 0.60 0.552 -2343.984 4363.25
position2 198927.5 258889.5 0.77 0.444 -313570 711425.1
position3 725571.3 384730.1 1.89 0.062 -36040.29 1487183
stYear Coef. Std. Err. t P>|t| [95% Conf. Interval]
Total 1.2583e+14 129 9.7540e+11 Root MSE = 9.4e+05
Adj R-squared = 0.0923
Residual 1.0802e+14 122 8.8540e+11 R-squared = 0.1415
Model 1.7808e+13 7 2.5440e+12 Prob > F = 0.0082
F( 7, 122) = 2.87
Source SS df MS Number of obs = 130
. regress stYear position3 position2 PA FTA X AC AD

40
As you can see from the regression results in Table 5, the three most significant
variables are assists per game, rebounds per game, and field goal percentage.
Fascinating, and yet a little predictable considering the significance of field goal
percentage, as well as assists and rebounds, on the game. What is interesting about this
regression, besides the fact that points aren’t significant at all, is that again Wiggins’
projected 1st year salary came back lower than McDermott’s. McDermott’s projected
salary came out at $2,843,153.74. Projecting McDermott at the 7th pick and Wiggins at
11. However, it all depends on what position you have Wiggins playing in the NBA. I
have seen it both ways; some have him playing a small forward and others have him
playing a shooting guard. Above is the estimate with him being a small forward. If you
consider him a shooting guard his projected salary resulted in about a $600,000
difference at $2,704,822.84 and going about 8th in the draft, right behind McDermott. So
again it all depends on his position but we’ll just call him a forward for the sake of the
model. I will now go through Wiggins’ and McDermott’s projected salaries all the way
up to their 9th year in the league. Table 6 shows both of their projected salaries.
Table 7
Player Doug McDermott Andrew Wiggins
Projected 1st Year Salary $2,843,153.74 $2,178,179.04
Projected 2nd Year Salary $3,040,134.17 $2,327,077.73
Projected 3rd Year Salary $3,158,568.60 $2,238,128.42
Projected 4th Year Salary $3,491,006.81 $2,796,639.20
Projected 5th Year Salary $5,618,424.33 $5,529,101.77
Projected 6th Year Salary $6,871,099.86 $6,599,162.05
Projected 7th Year Salary $8,221,118.15 $8,549,675.36
Projected 8th Year Salary $11,281,945.65 $12,537,194.89

41
As you can see from Table 7, McDermott starts out with the higher salary, but
every year Wiggins gets closer and closer until his 7th year when he passes McDermott in
salary. In order to find out just how accurate my model is I needed to check my errors.
Table 8
Table 8 shows that my model turns out to be pretty close to reality. Essentially
what this table means is that the average error in my model prediction (how much their
predicted salary was different from their actual salary) was around $700,000. The actual
standard deviations in the projected salary across the lottery picks were about $500,000.
What that says is that the variation in my model estimates and the variation in the actual
salaries across players are of the same order of magnitude. Yes, $200,000 is a lot of
money especially to the normal citizen. However, when you look at the average contract
of a lottery pick, $200,000 is not a huge difference or error rate.
I’m sure you’re thinking, “what about athleticism, talent, and potential? Where
are those attributes in your model?” If you were thinking that, you would have a valid
point. In order to take into account all of those things, I did another regression using
NBA mock drafts. I used the ESPN lottery mock draft, Sports Illustrated’s mock draft,
and DraftExpress.com’s mock draft in order to accurately predict both Wiggins’ and

42
McDermott’s draft positions. I ran the ESPN lottery mock draft fifty times and used the
other two websites predictions. I then averaged all of the mock draft’s positions to get
the best possible prediction for where Wiggins and McDermott will be drafted. Out of
the fifty times I used the ESPN lottery simulation, 48 times McDermott came back as the
13th pick and 43 times Wiggins came back as the 1st overall pick. McDermott was 11th
once, going to the Cleveland Cavaliers, and 9th once, again going to the Cavs. The seven
times Wiggins did not come back overall number one, Jabari Parker was the number one
pick going to the Utah Jazz three times, the Detroit Pistons twice, and the New Orleans
Pelicans and Minnesota Timberwolves each once respectively. Sports Illustrated had
McDermott projected as the 20th pick while Draft Express brought him in at the 10th.
Wiggins was first in both.
After I averaged out their mock draft predictions, I then ran an OLS regression
using Figure 7. I took the draft positions of each of the NBA draft lottery picks from the
last ten years and included their salaries. I used the same data I used in my last
regression for salary where I only included salaries that these drafted players had either
already been paid or are guaranteed to be paid. If there are team options or player options
or any sort of deal that is not entirely guaranteed that figure was not included.
Figure 7
1st Year Salary (stYear) = pos3 + pos2 + DraftPosition
Table 9

43
Table 10
Player Doug McDermott Andrew Wiggins
Projected 1st Year Salary $1,525,987.60 $4,234,565.20
Projected 2nd Year Salary $1,635,876.70 $4,518,289.90
Projected 3rd Year Salary $1,635,985.40 $4,753,791.80
Projected 4th Year Salary $2,180,526.30 $5,686,325.10
Table 9 shows the results from my regression using Figure 7 and Table 10 shows
the projections from those results. Again, McDermott was mock drafted to go 13th while
Wiggins took the number one overall pick. Once I got the projected figures using the
mock draft regression, I took both regressions and averaged them out. Unfortunately, my
mock draft regression model only allowed me to project the first four years. Once it
started getting to five years and longer, because of the lack of contracts, there was not
enough proven data so the numbers came out negative. Table 10 represents the average
between both the mock draft regression and the college statistics regression.
_cons -7321137 1.40e+07 -0.52 0.614 -3.90e+07 2.43e+07
AB 302245.5 455238.9 0.66 0.523 -727576.3 1332067
X 6762120 2.60e+07 0.26 0.801 -5.21e+07 6.56e+07
position2 4880043 5494969 0.89 0.398 -7550441 1.73e+07
position3 7059900 6167389 1.14 0.282 -6891703 2.10e+07
deals Coef. Std. Err. t P>|t| [95% Conf. Interval]
Robust
Root MSE = 6.4e+06
R-squared = 0.2481
Prob > F = 0.0469
F( 4, 9) = 3.73
Linear regression Number of obs = 14
. regress deals position3 position2 X AB, robust

44
Table 11
Player Doug McDermott Andrew Wiggins
Projected 1st Year Salary $2,184,570.67 $3,206,372.12
Projected 2nd Year Salary $2,338,005.44 $3,422,683.82
Projected 3rd Year Salary $2,397,277.00 $3,495,960.11
Projected 4th Year Salary $2,835,766.56 $4,241,482.15
However, simple economics will tell you that a dollar next year is not worth the
same as it is this year. Of course, one reason being inflation and another being the fact
that a dollar deposited today can earn interest and become $1 x (1+i) one year from
today. I used a present value calculator2 in order to factor in the discount rate for the
discounted cash flow in order to put the value into today’s dollars. I used a 13% discount
rate simply because that is the exact rate Fantex uses to do this same process. Table 12
displays the conversion. The first four years are the average between the two regressions
while years five through nine are strictly from the original regression model.
Table 12:
Player Doug McDermott Andrew Wiggins
Projected 1st Year Salary $2,045,425.68 $3,002,144.07
Projected 2nd Year Salary $1,937,245.59 $2,835,998.16
Projected 3rd Year Salary $1,757,838.36 $2,563,463.80
Projected 4th Year Salary $1,840,148.00 $2,752,326.30
Projected 5th Year Salary $3,226,401.19 $3,175,107.37
Projected 6th Year Salary $3,491,818.40 $3,353,622.56
Projected 7th Year Salary $3,697,241.64 $3,845,002.00
Projected 8th Year Salary $4,490,063.73 $4,989,636.17
2 Present Value Calculator. (n.d.). What is my future value worth today?. Retrieved April
18, 2014, from http://www.timevalue.com/products/tcalc-financial-calculators/present-
value-calculator.aspx?CURRENTDATE=4%2F23%2F2014&FUTURE

45
Total Projected Career Salary Value
(for first 8 years) $22,486,182.59 $26,517,300.43
Endorsements
During this section I will focus on the endorsement component that can
significantly add to the overall brand value of Doug McDermott and Andrew Wiggins.
As I’ve stated in this thesis, the contract or deal that Arian Foster and the others have
received isn’t just purely for their on-field performance. It is for their brand value. A
very large part of an athlete’s brand value has to do with their endorsements. The rest of
this segment will figure out a projected endorsement value for both Wiggins and
McDermott in order to complete the overall brand value of each individual. This is
essential in order to construct the most accurate contract offer for each player. To figure
out Wiggins’ and McDermott’s projected endorsement value, I took all available
endorsement values I could find online, then ran two different regressions just as I did to
find their projected salaries. The first regression I ran used the value of endorsements the
set of NBA lottery picks I am using were earning compared to their college statistics,
while the other regression followed the exact same process, except I used the NBA
lottery pick’s mock draft position instead of statistics. I will then average out the two
values and put them into present value to get a more precise figure. Figure 9 is the model
used for college statistics, Figure 10 is the model for mock draft position, and Table 13 is
the final projection.
This is where it gets a little tricky. Very little information is released about details
surrounding players’ endorsement deals and the actual figure of them. Forbes does have
a top ten list that they like to call “The NBA’s Endorsement All Stars” that comes out

46
every year. Unfortunately, it only shows the top ten players who tend to be the top tier of
NBA players so it is tough to get an exact estimate. The top ten list, from least to most,
has Chris Paul making $4 million, Blake Griffin making $6 million, Dwight Howard at
$6 million as well, a surprising Amar’e Stoudemire at $6.5 million, Carmelo Anthony
raking in $9 million, Dwyane Wade pulling in $12 million, Kevin Durant with $14
million, Derrick Rose has $21 million, number two is Kobe Bryant with $34 million, and
finally at the top is LeBron James making $42 million (Badenhausen, 2014). The figures
these athletes can bring in can be monstrous. LeBron James’ signature shoes in 2013
amassed $300 million in retails sales in the United States alone. Derrick Rose signed a
13-year, $185 million contract with Adidas in 2012 (Badenhausen, 2014).
Let me start by explaining exactly how shoe deals work as described by an NBA
player himself, Timofey Mozgov. In his own blog, he explains to his Russian faithful
back home how shoe deals in America work. He writes how he signed his contract with
Nike on October 11th, 2004 and played his first game on the 27th. He also explains that it
doesn’t matter how good you are or how many minutes you play, if you’re in the NBA,
you get a shoe deal. The value of deals ranges and obviously the better you are the better
the deal. But in the shoe deals themselves, the manufacturers set up bonuses and
incentives for all sorts of individual achievement from their representing players. For
example, the individual achievements include getting on the list of the top players of the
week, top rookie lists, Rookie of the Year, and so on. They also give incentives for in-
game performance like points, minutes, rebounds, blocked shots and just about every
positive statistic in the box score. He cites a specific example from the playoffs where if
his team, at the time the New York Knicks, reached the Conference Semifinals he would
47
receive extra compensation as long as he averages no less than fifteen minutes
(Chernykh, n.d.). The reason I explain this is simply because regardless of what type of
contract McDermott and Wiggins get they have a chance to boost their income with their
actual play on their floor. It will all be left up to which shoe company they decide to go
to and how much these companies are willing to shell out.
Adidas has been known to shell out big contracts. Especially with Nike
dominating the market in terms of shoe deals in the NBA. Figure 8 below shows how
dominant they truly are.
Figure 83
3 Gaines, C. (2014, March 7). One Chart That Shows How Much Nike Dominates The
NBA. Business Insider. Retrieved April 20, 2014, from
http://www.businessinsider.com/nike-nba-shoe-endorsements-2014-3
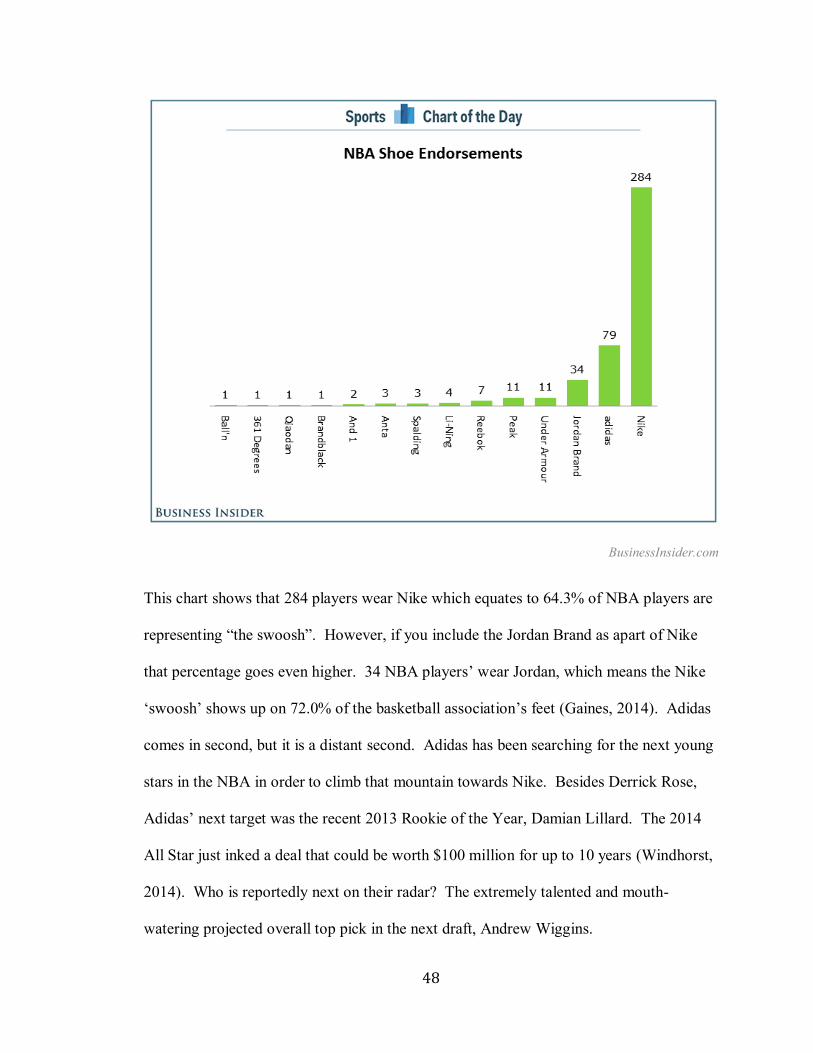
48
BusinessInsider.com
This chart shows that 284 players wear Nike which equates to 64.3% of NBA players are
representing “the swoosh”. However, if you include the Jordan Brand as apart of Nike
that percentage goes even higher. 34 NBA players’ wear Jordan, which means the Nike
‘swoosh’ shows up on 72.0% of the basketball association’s feet (Gaines, 2014). Adidas
comes in second, but it is a distant second. Adidas has been searching for the next young
stars in the NBA in order to climb that mountain towards Nike. Besides Derrick Rose,
Adidas’ next target was the recent 2013 Rookie of the Year, Damian Lillard. The 2014
All Star just inked a deal that could be worth $100 million for up to 10 years (Windhorst,
2014). Who is reportedly next on their radar? The extremely talented and mouth-
watering projected overall top pick in the next draft, Andrew Wiggins.

49
There was a rumor going around before Wiggins had even stepped foot on a
college basketball court that Adidas was going to offer him an enormous contract. How
enormous? Rich Lopez, publisher of the popular sneaker website KixandtheCity.com
recently was quoted saying, “I’ve heard a range for sure, from like $140 to $180 million
for like 10 years. That’s a big deal for a kid coming out of school because most rookie
deals are probably like four years.” (Zwerling, 2013) This supposed offer was later
confirmed to all be a hoax. An Adidas Basketball spokesperson confirmed the hoax
saying, “There is a fraudulent letter that claims to be from our company offering Mr.
Wiggins a contract. Any reasonable review of the letter would determine its lack of
credibility.” He continued, “Beyond this, we do not comment on rumors or speculation
about potential partnerships.” (DePaula, 2013) Whether it is true or not, it shows the
amount of hype surrounding the Canadian native, Andrew Wiggins.
The summer of 2014 should be a hot summer in terms of shoe deals. Many elite
stars will become shoe free agents and will have brands fighting over them. Adidas’ top
stars currently are Derrick Rose, John Wall, Damian Lillard, and Dwight Howard.
Adidas is well represented in the point guard area and in Howard specifically, they have a
key center but it is clear they are missing a wing scorer. Wiggins could be that missing
piece and it has been said by Nick DePaula, Editor-In-Chief of Sole Collector, that a $6-
$8 million deal annually that spans around seven years in length could be more realistic
(DePaula, 2013). That would be a total deal of anywhere between $42 million to $57
million in an Adidas’ endorsement for Wiggins. According to, Quency Phillips, the
president of the Que Agency, “There’s no need to overpay for a basketball player who
has not stepped on the court,” brands appear to prefer to wait until a player proves his

50
marketability before signing them to a monster shoe deal. Basketball shoe sales totaled
an outrageous $4.5 billion in the U.S. last year, with Nike and the Jordan Brand
controlling 92% of that market. James’ signature shoe brings in around $300 million
annually for Nike, while they pay LeBron James $19 million annually (Campbell, 2014).
Morgan Campbell, sports reporter for the Toronto Star, believes that unless Wiggins can
generate $300 million annually in sales, a LeBron-sized deal won’t be in the works for
him.
The previous discussion is about a single shoe deal alone. It doesn’t include, the
implications of which team wins the NBA draft lottery first pick, or which NBA team
drafts him, local sponsorships or endorsements of any other kind. And the order Wiggins
is drafted could determine what type of endorsement deals he gets. The size of the
market he would play in is very important.
Of the 153 NBA draft lottery picks from the last ten years, there were only
seventeen players that had endorsements that were available online. The average amount
was $8,635,294. Obviously that number is pretty high. Most of these guys have been in
the league for at least four years, except for Damian Lillard and John Wall. However,
from what I read and what I stated earlier, sources seem to think that a $6-$8 million deal
for seven years would make sense for Wiggins. Let’s see what the model says and get to
the actual values of projected endorsements for the two up and comers, Wiggins and
McDermott. Figure 9 (below) is the regression run using college box score statistics as
my independent variables and Tables 13 and 14 show the results of the model.
Figure 9:

51
Endorsement Deals (deals) = pos3 + pos2 + X + AB
Table 13:
PLAYER Variable Label Doug McDermott Coefficients Final Calculations
Position Forward 4880043
FG% X 0.526 6762120 3556875.12
PPG AB 21.7 302245.5 6558727.35
_cons -7321137
Projected Endorsement $7,674,508.47
Table 14:
PLAYER Variabe Label Andrew Wiggins Coefficients Final Calculations
Position Forward 4880043
FG% X 0.448 6762120 3029429.76
PPG AB 17.1 302245.5 5168398.05
_cons -7321137
Projected Endorsement $5,756,733.81
Again, this model and the results are based off of their college statistics. Because
there are only seventeen observations, my model had to be short and sweet. So, I used
field goal percentage (X) and points-per-game (AB) along with my dummy variables
pos3 and pos2. As you can see in Tables 13 and 14, McDermott, based off of his college
statistics, is projected to make $7,674,508.47 while Wiggins stands to reel in
$5,756,733.81. These values are before pre-present value calculations. It also wouldn’t
be a realistic projection unless I incorporated their mock draft positions, which can be
shown below in Figure 10 and Table 15.
Figure 10:
Endorsement Deals (deals) = pos3 + pos2 + Mock Draft Position (var51)
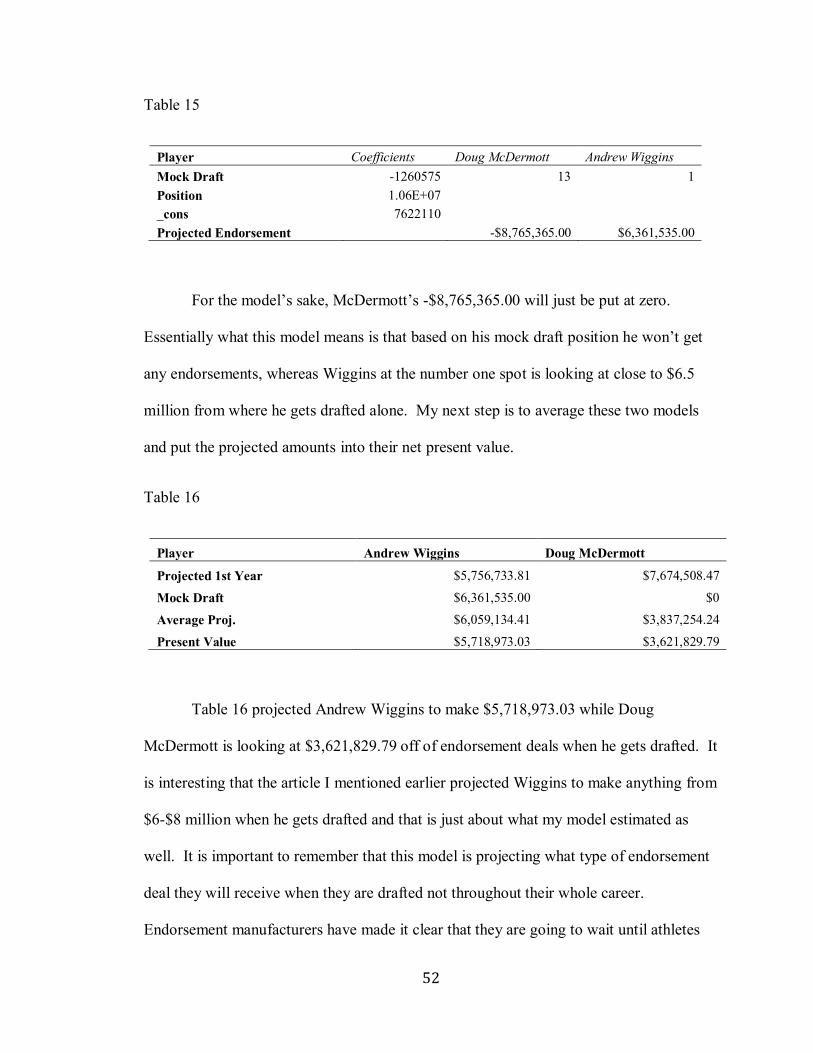
52
Table 15
Player Coefficients Doug McDermott Andrew Wiggins
Mock Draft -1260575 13 1
Position 1.06E+07
_cons 7622110
Projected Endorsement -$8,765,365.00 $6,361,535.00
For the model’s sake, McDermott’s -$8,765,365.00 will just be put at zero.
Essentially what this model means is that based on his mock draft position he won’t get
any endorsements, whereas Wiggins at the number one spot is looking at close to $6.5
million from where he gets drafted alone. My next step is to average these two models
and put the projected amounts into their net present value.
Table 16
Player Andrew Wiggins Doug McDermott
Projected 1st Year $5,756,733.81 $7,674,508.47
Mock Draft $6,361,535.00 $0
Average Proj. $6,059,134.41 $3,837,254.24
Present Value $5,718,973.03 $3,621,829.79
Table 16 projected Andrew Wiggins to make $5,718,973.03 while Doug
McDermott is looking at $3,621,829.79 off of endorsement deals when he gets drafted. It
is interesting that the article I mentioned earlier projected Wiggins to make anything from
$6-$8 million when he gets drafted and that is just about what my model estimated as
well. It is important to remember that this model is projecting what type of endorsement
deal they will receive when they are drafted not throughout their whole career.
Endorsement manufacturers have made it clear that they are going to wait until athletes

53
prove themselves before they unload the big money type of contracts we’ve heard about
recently. McDermott and Wiggins are both very interesting type of players as well as
very marketable because of their personal appeal, the enjoyment people get when they
watch them play and their likeability.
If you look at Wiggins specifically, despite the loss the Jayhawks suffered in the
second-round NCAA loss and the fact that Wiggins had a good but not breakout season,
his hype is still alive. To show the amount of hype Wiggins has, just recently the famous
hip-hop artist Drake released a song entitled “Draft Day”. Why am I now including the
likes of rap music into an economic thesis? I mention it because Andrew Wiggins’ name
is featured several times in the chorus of Drake’s new single. The amount of off-court
exposure this 19-year-old is receiving could be setting the table for endorsements to
come. I think Drake, known as a Toronto Ambassador, could help Wiggins a lot with
endorsements and even more exposure than one hit single. Drake is very well known for
being a Toronto Raptors fan. The fact of the matter is that Wiggins most likely will not
end up on the Raptors, but the fact that they are both from Canada and have Toronto roots
may mean that Wiggins not going to the Raptors won’t matter too much. Interestingly,
Drake was celebrating with the Miami Heat post their recent championship, which
indicates that Drake is co-branding his rap music brand with the NBA in general. I’m
discussing Drake in such detail because I truly think he will be a big part of Wiggins’
brand value.
McDermott finished his career as one of the best college basketball players in
history, racking up every award in sight. With his amazing scoring ability and passion
for the game, he easily became one of America’s favorite college basketball players.

54
Playing for Creighton University in Omaha, Nebraska, McDermott became an enormous
fish in a small pond and the poster boy for the small town schools. His ability to make
big shots and sizzling scoring outbursts make him a crowd favorite. McDermott was on
the cover of Sports Illustrated’s March cover that featured him doing a throwback, Larry
Bird-inspired cover shot. The image on the cover was inspired by the November 28th,
1977 edition featuring Larry Bird on the cover being described as, “College Basketball’s
Secret Weapon.” (Doug McDermott featured, 2014) Both are mid-west legends in their
own right. McDermott has been compared to both Wally Szczerbiak, who was a 6’7”
shooter and averaged 14.1 points for his career (Wasserman, 2014), and Ryan Anderson,
a 6’10” shooter that has knocked down better than 38 percent from behind the arc in his
career and is known as one of the better shooting forwards in the league (Borzello, 2013).
If I personally had to pick a comparison, I think his game could translate to a
Kevin Love (All Star power forward for the Minnesota Timberwolves) type of game.
Now I’m not necessarily saying that McDermott will be an All Star and a max contract
type of player, but I believe his game his comparable. They are both knockdown
shooters and snipers when left open. They’re both high IQ players with offensive
instincts that can’t be taught. McDermott is also such a slippery player. If you have seen
him play at all, you have seen how many easy layup opportunities he gets and that is not
because of luck. That is because of his offensive instincts and his ability to read the
defense. Every opposing team’s game plan is one thing: Stop Doug McDermott. Despite
being double-teamed and face-guarded he gets easy looks because of both his mind and
skill. The only question is whether or not his college scoring prowess and efficiency can
translate to the NBA and if it does, he is in for a big career.

55
SponsorHub did a study to figure out the most sponsor-oriented prospect in the
NCAA Tournament. The data was collected via a proprietary platform that incorporated
both social media reach and emotional resonance in order to assess sponsor value.
McDermott was among the top 3 most sponsor-oriented players in the tournament. Who
were the other two? Shabazz Napier was rated number one after his unbelievable title
run performance. In second was none other than Andrew Wiggins. Wiggins connected
to the largest audience and was top-ranked among players in terms of reach and
favorability (combination of most-loved and most-reacted-to) (Wiggins, Napier,
McDermott, 2014). McDermott and Wiggins are both very marketable players clearly;
the only thing left to figure out is how well they will actually do on the court in the NBA.
The Contracts
This last section will provide a well thought-out conclusion to support my thesis.
I will use all the information and values from these last two sections in order to create a
contract (similar to a Fantex contracts) to offer Andrew Wiggins and Doug McDermott.
Using each player’s projected salaries and projected endorsements, I will now offer a
hypothetical contract that contains an exact dollar figure and upfront price that will be
paid to the athletes. I will also set a percentage to be paid to investors on the future
earnings of the athlete’s brand, the number of shares offered, and the price at which those
shares will be sold on the exchange. However, first I will explain how Fantex creates and
offers their contracts to illustrate how the contracts are constructed before explaining my
contract.

56
First and foremost is to look at each player’s projected salaries and figure out
exactly what to pay them based off of those projections. Fantex looks at a player’s
existing NFL contract and uses a 4.5% discount rate in order to figure out how much to
pay them. Then from there, Fantex analysts use their own formulas to decide the range of
the discount rates they will use for their projected salaries and endorsements. In order to
figure out what discount rates to use, the Fantex analysts base discount rates on specific
observations like (1) yields on CCC-rated bonds have been trading at less than 10%
according to their market research and (2) based on their internal research and
discussions with industry participants, Fantex determined that as of February 2014, the
average weighted average cost of capital for a sample set of 36 then publicly-traded
biotechnology companies was 11.1% (Fantex EJ Manuel Prospectus, n.d.). Fantex
analysts also consider the specific risk profile of the contract party. Once they have
figured out the discount rate, analysts use those discount rates on their current contracts
and endorsements and then on their projected contracts, projected endorsements and
projected post-career income. Finally, they add up the percentage of estimated total
lifetime brand income for the player and multiply it by 10% to get their offer value for
the athlete.
A more specific example is in the case of EJ Manuel of the Buffalo Bills. The
specific figures and information can be seen in his prospectus on the Fantex website, but
I’ll give a brief summary. Manuel’s gross amount, before applying any discount rate, in
his estimated lifetime brand income includes the details I stated above: his current NFL
contract (2014-2016) and current endorsements (2014) in Category A, in Category B they
use his endorsements for 2015 and beyond, and finally in Category C they project his

57
player contracts, his player endorsements and finally his post-career earnings. The total
gross amount pre-discount rate ends up being $104,337,622 (Fantex EJ Manuel
Prospectus, n.d.). Fantex used discount rates from 4.5% to 20%. The net amount, after
applying the discount rates, comes out to $49,750,464 (Fantex EJ Manuel Prospectus,
n.d.). That final number is what the contact analysts estimate Manuel’s total brand value
to be. They then took 10% of the net amount and offered EJ Manuel $4.97 million,
which he would end up accepting.
There is no specific formula that I will use to figure out what type of discount rate
Wiggins and McDermott will receive. I will start with the standard 4.5% for their NBA
rookie contracts because those contracts are guaranteed and the discount rate is low and
fixed due to the low-risk. After that the discount rates continue to get higher any money
past year four is a lower probability (due to the risk of injury), thus the high discount rate.
So this is what I am going to do. I will use a 4.5% discount rate for both Wiggins’ and
McDermott’s entire rookie contract (projected years 1-2). Those are the guaranteed
years. Once an NBA player moves into year three of their contract, NBA team
executives may exercise an option to re-sign the rookie for the third season and if they
do, the team could also keep the player for the fourth season as well (Jessop, 2012). The
odds that Wiggins and McDermott get to year three and four of their contracts are a lot
higher in the NBA than they are for the NFL, but again these are team options in year
three and four and not guaranteed, therefore the discount rate will go up to 6% for those
years.
Years three and four are relatively straightforward; it is in subsequent years that it
gets tricky. In order to figure out the exact discount rate for both Wiggins and

58
McDermott after their fourth year I must determine which NBA rookie will be a more
reliable long-term player. It is all about risk and which player will be riskier. In order to
support my risk determination, I researched and selected six NBA players to use as
comparisons for both Wiggins and McDermott. I then took how many years these
comparable players played and how many games they missed throughout their career.
(Highlighted names indicate the use of the same source)
Table 17
Doug McDermott
Player Comparison Years in the League Total Missed Games Avg Missed Per Year
Wally Szczerbiak4 10 169 16.9
Tracy Murray 12 326 27.16666667
Glen Rice5 15 230 15.33333333
Keith Van Horn 9 163 18.11111111
Chuck Person6 13 205 15.76923077
Jared Dudley* 7 51 7.285714286
Totals 66 1144 100.5660562
Proj. Years 11 190.6666667 16.76100936
Proj. Gms Missed 17.33333333
Table 18
Andrew Wiggins
Player Comparison Years in the League Total Missed Games Avg Missed Per Year
Tracy McGrady7 15 292 19.46666667
4 O'Brien, D. (2014, March 20). NBA Comparisons for Biggest Draft Prospects. Bleacher
Report. Retrieved April 29, 2014, from http://bleacherreport.com/articles/1999148-nba-
comparisons-for-biggest-draft-prospects-of-2014-ncaa-tournament/page/2 5 Miraski, B. (2013, January 18). Comping Doug McDermott Is Not As Easy As You
Would Think. Mid-Major Madness. Retrieved April 29, 2014, from
http://www.midmajormadness.com/features/2013/1/18/3892544/comping-doug-
mcdermott-glen-rice-keith-van-horn-creighton 6 Laney, P. (2014, March 6). 2014 Draft Profile: Mock Draft Target Doug McDermott.
Peachtree Hoops. Retrieved April 29, 2014, from
http://www.peachtreehoops.com/2014/3/6/5474306/2014-nba-mock-draft-doug-
mcdermott-atlanta-hawks-creighton 7 O'Brien, D. (2014, March 20). NBA Comparisons for Biggest Draft Prospects. Bleacher
Report. Retrieved April 28, 2014, from http://bleacherreport.com/articles/1999148-nba-
comparisons-for-biggest-draft-prospects-of-2014-ncaa-tournament/page/11

59
Dominique Wilkins 15 156 10.4
Clyde Drexler8 15 144 9.6
Vince Carter*9 16 161 10.0625
Rudy Gay* 8 71 8.875
Derrick Rose*10 5 213 42.6
Totals 74 1037 101.0041667
Proj. Years 12.33333333 172.8333333 16.83402778
Proj Gms Missed 14.01351351
Note. *Currently Playing in the league*
As you can see from Tables 17 and 18, McDermott is projected, based on his
player comparisons, to play 11 years in the league, miss 191 games total or 17 games a
year. Wiggins is projected to play 12 years in the league, miss 173 games total or 14
games a year. Each player’s projections came out relatively similar although half of
Wiggins’ comparative players are still playing in the league and two of them are
relatively young. So, for me, the question still stands, who is riskier? If you want to look
specifically at injury risk, I would have to say Wiggins is riskier. Wiggins’ playing style
is mainly based on his explosive athleticism. The same style of play could be said for
Derrick Rose of the Chicago Bulls, who has missed an average of 42.6 games a year and
just about the last two full seasons. Vince Carter of the Dallas Mavericks who is still
playing well into his 16th year (with at least a couple more coming) started his career as
an explosive, athletic player, but is currently averaging only 10 missed games a year.
Carter has adjusted his playing style since his early years. Yes he can still get up and
8 Andrew Wiggins Comparison. (2013, May 31). NBADraft.net. Retrieved April 29,
2014, from http://www.nbadraft.net/forum/andrew-wiggins-comparison-1 9 Andrew Wiggins. (n.d.). NBADraft.net. Retrieved April 28, 2014, from
http://www.nbadraft.net/players/andrew-wiggins 10 Harper, Z. (2014, January 31). NBA Draft: Is Andrew Wiggins starting to justify the
hype?. CBSSports.com. Retrieved April 29, 2014, from
http://www.cbssports.com/nba/eye-on-basketball/24426031/nba-draft-is-andrew-wiggins-
starting-to-confirm-the-hype

60
have the occasional poster dunk, but his game has evolved in order to stay healthy. He
has created a legitimate threat from beyond the arc and a decent mid-range game as well.
With age comes adjustment, especially if you want to stick around the league for a while.
That athleticism won’t be there forever.
A contrasting playing style would be Doug McDermott, whose game is very
much below the rim. He has a Dirk Nowitzki-esque mid-range but at the same time he
has Jimmer Fredette range from three. McDermott is also one of the most slippery
offensive players in that he always seems to find a way to get open. The way he moves
without the ball is something that cannot be taught. McDermott’s game is built to last in
the league. However, who has greater upside and a higher chance at stardom? No
question it is Andrew Wiggins. He may be riskier when it comes to injuries but the NBA
isn’t the NFL. NBA players are coming back from just about every injury. Think about
Shaun Livingston in 2007; he sustained one of the nastiest injuries ever seen on the
basketball court and yet he is still a productive player for the Brooklyn Nets seven years
later. Derrick Rose has been struggling with knee problems and if he were in the NFL he
probably would be done, but he has been given plenty of time to recover. So despite
Wiggins being riskier in terms of injuries and the fact that he might actually just be a
riskier player in general, his financial upside is so high that he is worth investing in.
Wiggins knows this as well. He isn’t clueless about the hype surrounding him
and how he is supposed to be the “next big thing”. Therefore, in order to get him to
accept a contract and buy into the Fantex system, Wiggins will want to see big money.
Specifically because of Wiggins’ upside and the fact that he knows it, Wiggins’ discount

61
rate will remain relatively low compared to McDermott’s. Tables 19 and 20 show the
final calculations.
Table 19
Player Doug McDermott Discount Rate
Projected Endorsements $3,621,829.79 4.50%
My Offer For Endorsements $3,458,847.45
Projected 1st Year Salary $2,045,425.68 4.50%
My 1st Year Offer $1,953,381.52
Projected 2nd Year Salary $1,937,245.59 4.50%
My 2nd Year Offer $1,850,069.54
Projected 3rd Year Salary $1,757,838.36 6%
My 3rd Year Offer $1,652,368.06
Projected 4th Year Salary $1,840,148.00 6%
My 4th Year Offer $1,729,739.12
Projected 5th Year Salary $3,226,401.19 8%
My 5th Year Offer $2,968,289.09
Projected 6th Year Salary $3,491,818.40 10%
My 6th Year Offer $3,142,636.56
Projected 7th Year Salary $3,697,241.64 12%
My 7th Year Offer $3,253,572.64
Projected 8th Year Salary $4,490,063.73 14%
My 8th Year Offer $2,238,438.67
Projected Total $26,108,012.38
Net Amount After D.R. $22,247,342.65
3/8 of Net Amount $9,790,504.64 .375
Final Proj Brand Value $32,037,847.29
In order to properly value the three years (McDermott’s projected to play for 11
years) of McDermott’s salary (I wasn’t able to project due to omitted coefficients as well
as an added estimate for endorsements past McDermott’s rookie deal and post-career
income), I took three-eighths of the net amount of his salary after the discount rate (which
includes all projected salaries and endorsements), which came out to $9,790,504.64. The
reason I took three-eighths discount is, again, as an estimate for the three more years of
contracts, more endorsements, and post-career income combined. I then added that
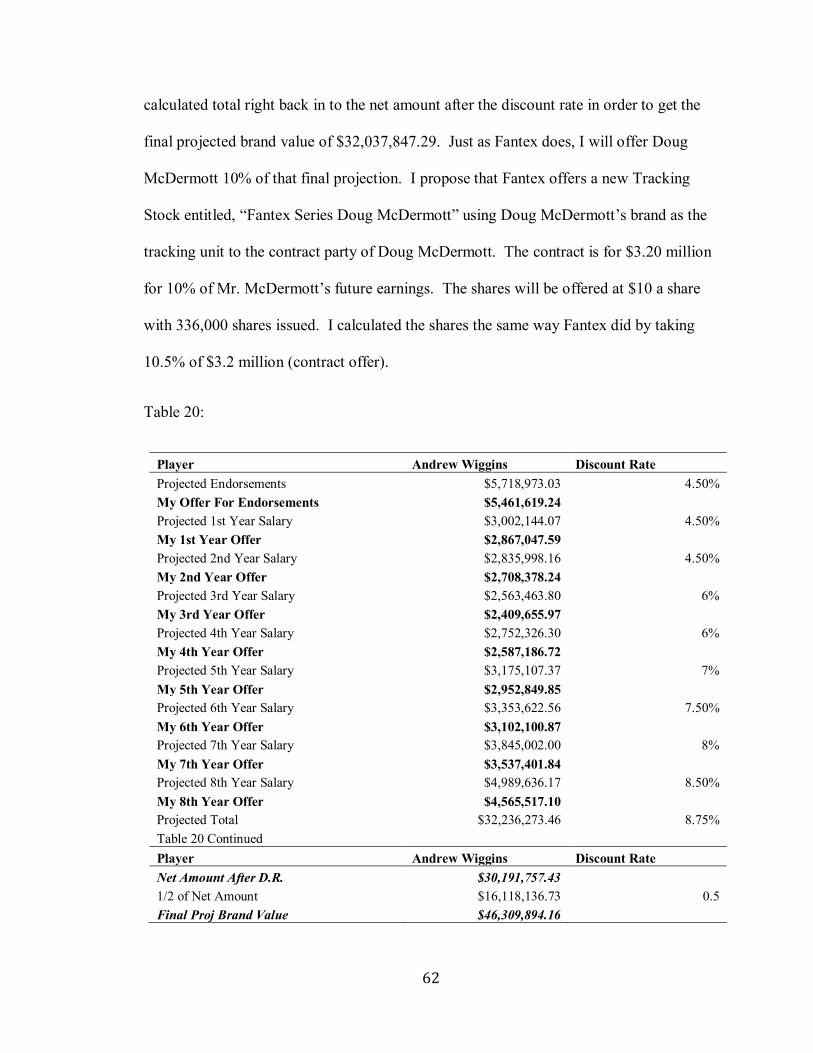
62
calculated total right back in to the net amount after the discount rate in order to get the
final projected brand value of $32,037,847.29. Just as Fantex does, I will offer Doug
McDermott 10% of that final projection. I propose that Fantex offers a new Tracking
Stock entitled, “Fantex Series Doug McDermott” using Doug McDermott’s brand as the
tracking unit to the contract party of Doug McDermott. The contract is for $3.20 million
for 10% of Mr. McDermott’s future earnings. The shares will be offered at $10 a share
with 336,000 shares issued. I calculated the shares the same way Fantex did by taking
10.5% of $3.2 million (contract offer).
Table 20:
Player Andrew Wiggins Discount Rate
Projected Endorsements $5,718,973.03 4.50%
My Offer For Endorsements $5,461,619.24
Projected 1st Year Salary $3,002,144.07 4.50%
My 1st Year Offer $2,867,047.59
Projected 2nd Year Salary $2,835,998.16 4.50%
My 2nd Year Offer $2,708,378.24
Projected 3rd Year Salary $2,563,463.80 6%
My 3rd Year Offer $2,409,655.97
Projected 4th Year Salary $2,752,326.30 6%
My 4th Year Offer $2,587,186.72
Projected 5th Year Salary $3,175,107.37 7%
My 5th Year Offer $2,952,849.85
Projected 6th Year Salary $3,353,622.56 7.50%
My 6th Year Offer $3,102,100.87
Projected 7th Year Salary $3,845,002.00 8%
My 7th Year Offer $3,537,401.84
Projected 8th Year Salary $4,989,636.17 8.50%
My 8th Year Offer $4,565,517.10
Projected Total $32,236,273.46 8.75%
Table 20 Continued
Player Andrew Wiggins Discount Rate
Net Amount After D.R. $30,191,757.43
1/2 of Net Amount $16,118,136.73 0.5
Final Proj Brand Value $46,309,894.16

63
In order to properly for the four years (Wiggins’ projected to play for 12 years) of
Wiggins’ salary, (I wasn’t able to project due to omitted coefficients and as an added
estimate for endorsements past Wiggins’ rookie deal and post-career income), I did
almost exactly the same thing I did for McDermott except I took four-eighths or half of
the net amount after the discount rate (which includes all projected salaries and
endorsements), which came out to $16,118,136.73. The reason I took half is, again, as an
estimate for the four more years of contracts, more endorsements, and post-career income
merged. I then added that calculated total right back in to the net amount after the
discount rate in order to get the final projected brand value of $46,309,894.16. However,
instead of calculating the way Fantex does and offering Mr. Wiggins 10% of that final
projection, I will be offering Andrew Wiggins 25% of that final projection for only 15%
of his future income because of his enormous upside and opportunity at stardom. This
aggressive offer is meant to show Andrew Wiggins the type of brand this company
believes he can become.
I propose that Fantex offers a new Tracking Stock entitled, “Fantex Series
Andrew Wiggins” using Andrew Wiggins’ brand as the tracking unit to the contract party
of Andrew Wiggins. The contract is for $11.577 million for 15% of Mr. Wiggins’ future
earnings. The shares will be offered at $10 a share with 1,214,850 shares issued. I
calculated the shares the same way Fantex did by taking 10.5% of $11.577 million
(contract offer). Andrew Wiggins, being projected as the number one overall pick in this
upcoming NBA draft, has the ability to reach Kevin Durant or even LeBron James brand
recognition and fame. That is the reason for the increase in his contract. This contract is
saying that I believe in Wiggins’ upside and am fully aware of the risk that goes along

64
with it. At the end of the day you can’t just have a solely economic, you have to add
human quality and human decisions to “The biggest risk is not taking any risk… In a
world that’s changing really quickly, the only strategy that is guaranteed to fail is not
taking risks.” – Mark Zuckerberg11.
11 Risk Quotes. (n.d.). BrainyQuote. Retrieved April 29, 2014, from
http://www.brainyquote.com/quotes/keywords/risk.html
65
References
Abraham, S. (2012, January 30). The Pros And Cons Of Sports Investing. Investopedia.
Retrieved March 27, 2014, from
http://www.investopedia.com/articles/fundamental-analysis/12/pros-cons-
investing-sports.asp
Allis, S., & Baumohl, B. (1997). Rock'n'roll is here to pay. Time, 149(7), 70.
Andrew Wiggins. (n.d.). NBADraft.net. Retrieved April 28, 2014, from
http://www.nbadraft.net/players/andrew-wiggins.
Andrew Wiggins Comparison. (2013, May 31). NBADraft.net. Retrieved April 29, 2014,
from
http://www.nbadraft.net/forum/andrew-wiggins-comparison-1
"Arian Foster Injury sidelines Fantex IPO - Cumulus Funding." Cumulus Funding. N.p.,
21 Nov.
2013. Web. 18 Dec. 2013. <http://www.cumulusfunding.com/2013/11/arian-
foster-injury-sidelines-fantex-ipo/>.
Badenhausen, K. (2014, February 17). The NBA's Endorsement All-Stars 2014. Forbes.
Retrieved April 20, 2014, from
http://www.forbes.com/sites/kurtbadenhausen/2014/02/17/the-nbas-endorsement-
all-stars-2014/
Ballard, C. (2012, December 3). Money Ballsy. ROCKETS G.M. DARYL MOREY
TAKES A
MORE ANALYTIC VIEW THAN. Retrieved April 3, 2014, from
http://sportsillustrated.cnn.com/vault/articl
Barrabi, Thomas. "Alleged Arian Foster Baby Mama, 'Brittany,' Claims Texans RB
Pressured
Her To Have Abortion, Sues For Child Support: Report [PHOTO]." International
Business Times. N.p., 13 Jan. 2014. Web. 13 Jan. 2014.
<http://www.ibtimes.com/alleged-arian-foster-baby-mama-brittany-claims-
texans-rb-pressured-her-have-abortion-sues-child>.
Bennett, Dashiell. "The NFL's Official Spin On Average Career Length Is A Joke."
Business
Insider. Business Insider, Inc, 18 Apr. 2011. Web. 1 Apr. 2014.
<http://www.businessinsider.com/nfls-spin-average-career-length-2011-4>.
Borzello, J. (2013, August 1). NBA players think Doug McDermott can translate to next
level.
CBSSports.com. Retrieved April 25, 2014, from
http://www.cbssports.com/collegebasketball/eye-on-college-

66
basketball/22970777/nba-players-think-doug-mcdermott-can-translate-to-next-
level
Campbell, M. (2014, April 2). Draft Day: Drake embraces Andrew Wiggins, but will
brands? |
Toronto Star. thestar.com. Retrieved April 22, 2014, from
http://www.thestar.com/business/2014/04/
Chernykh, Alexander. "Timofey Mozgov explains how shoe contracts work." Rushn
Hoops.
N.p., n.d. Web. 21 Apr. 2014.
<http://chernykh.wordpress.com/2011/04/14/timofey-mozgov-explains-how-
shoe-contracts-work/>.
Corben, Billy . "Broke." ESPN Films: 30 for 30. N.p., n.d. Web. 1 Apr. 2014.
<http://espn.go.com/30for30/film?page=broke>.
DePaula, N. (2013, October 17). The Industry // The $180 Million Andrew Wiggins
adidas Offer
Myth. Sole Collector. Retrieved April 22, 2014, from
http://solecollector.com/news/the-industry-the-180-million-andrew-wiggins-offer-
myth/
Doug McDermott featured in throwback, Larry Bird-inspired cover of Sports Illustrated |
One
And One - SI.com. (2014, March 12). One And One SIcom RSS. Retrieved April
25, 2014, from http://college-basketball.si.com/2014/03/12/doug-mcdermott-
creighton-larry-bird-sports-illustrated-cover/.
Fantex EJ Manuel Prospectus. (n.d.). Fantex. Retrieved April 26, 2014, from
https://fantex.com/fantex-ej-manuel-461919/prospectus#dq10401_management.
Fantex, Inc. Enters Into Brand Contract With EJ Manuel. (2014, February 19). Business
Wire.
Retrieved April 9, 2014, from
http://www.businesswire.com/news/home/20140219005404/en/Fantex-Enters-
Brand-Contract-EJ-Manuel#.U0WBI3DPVvA.
Fantex, Inc. Fantex Series Arian Foster Convertible Tracking Stock Risk Factors. (n.d.).
Fantex:
About. Retrieved December 13, 2013, from https://fantex.com/about.
Florio, M. (2013, November 12). Fantex postpones Arian Foster stock offering.
ProFootballTalk.

67
Retrieved December 14, 2013, from
http://profootballtalk.nbcsports.com/2013/11/12/ fantex-postpones-arian-foster-
stock-offering/.
Gaines, C. (2014, March 7). One Chart That Shows How Much Nike Dominates The
NBA.
Business Insider. Retrieved April 20, 2014, from
http://www.businessinsider.com/nike-nba-shoe-endorsements-2014-3.
Gaylord, C. (2013, November 21). More athlete IPOs to follow on 'jock exchange'?.
CNBC.com.
Retrieved December 18, 2013, from http://www.cnbc.com/id/101226195.
Goldsberry, K. (2012, May 23). The Best Shooters In The NBA, And Why Field Goal
Percentage Can't Identify Them. Deadspin. Retrieved March 25, 2014, from
http://deadspin.com/5912397/the-best-shooters-in-the-nba-and-the-tyranny-of-
field-goal-percentage.
Grier, K., & Cowen, T. (2011, December 9). The Economics of Moneyball. Grantland.
Retrieved
April 2, 2014, from http://grantland.com/features/the-economics-moneyball/.
Grzegorek, Vince . "'64 and Counting: Scene's Sports Blog." Cleveland Scene. N.p., 28
Apr.
2009. Web. 20 Dec. 2013. <http://www.clevescene.com/64-and-
counting/archives/2009/04/28/hey-there-remember-randy-newsom-the-minor-
leaguer-who-sold-shares-of-himself>.
Harper, Z. (2014, January 31). NBA Draft: Is Andrew Wiggins starting to justify the
hype?.
CBSSports.com. Retrieved April 29, 2014, from
http://www.cbssports.com/nba/eye-on-basketball/24426031/nba-draft-is-andrew-
wiggins-starting-to-confirm-the-hype.
James Harden Stats. (n.d.). ESPN NBA. Retrieved April 3, 2014, from
http://espn.go.com/nba/player/stats/_/id/3992/james-harden.
Jessop, A. (2012, June 28). The Structure of NBA Rookie Contracts. Forbes. Retrieved
March
24, 2014, from http://www.forbes.com/sites/aliciajessop/2012/06/28/the-structure-
of-nba-rookie-contracts/.
Laney, P. (2014, March 6). 2014 Draft Profile: Mock Draft Target Doug McDermott.
Peachtree

68
Hoops. Retrieved April 29, 2014, from
http://www.peachtreehoops.com/2014/3/6/5474306/2014-nba-mock-draft-doug-
mcdermott-atlanta-hawks-creighton.
Levitt, Steven. "With the Stock Market Down, Perhaps Diamonds Are a Good Place to
Invest."
Freakonomics RSS. N.p., 28 Jan. 2008. Web. 20 Dec. 2013.
<http://freakonomics.com/2008/01/28/with-the-stock-market-down-perhaps-
diamonds-are-a-good-place-to-invest/>.
Mann, Jake. "Should You Invest in E.J. Manuel, Fantex's Next Publicly Traded
Athlete?." The
Motley Fool. N.p., 25 Feb. 2014. Web. 1 Apr. 2014.
Miraski, B. (2013, January 18). Comping Doug McDermott Is Not As Easy As You
Would
Think. Mid-Major Madness. Retrieved April 29, 2014, from
http://www.midmajormadness.com/features/2013/1/18/3892544/comping-doug-
mcdermott-glen-rice-keith-van-horn-creighton.
Morris, Benjamin. "The Hidden Value of an NBA Steal." FiveThirtyEight. N.p., 25 Mar.
2014.
Web. 3 Apr. 2014. <http://fivethirtyeight.com/features/the-hidden-value-of-the-
nba-steal/>.
NBA Standings - 2013-14. (n.d.). ESPN NBA. Retrieved April 3, 2014, from
http://espn.go.com/nba/standings.
Nine NFL Stars Turned Entrepreneurs. (n.d.). Entrepreneur. Retrieved April 2, 2014,
from
http://www.entrepreneur.com/slideshow/220268#1.
Nine NFL Stars Turned Entrepreneurs. (n.d.). Entrepreneur. Retrieved April 2, 2014,
from
http://www.entrepreneur.com/slideshow/220268#4.
Nine NFL Stars Turned Entrepreneurs. (n.d.). Entrepreneur. Retrieved April 2, 2014,
from
http://www.entrepreneur.com/slideshow/220268#6.
O'Brien, D. (2014, March 20). NBA Comparisons for Biggest Draft Prospects. Bleacher
Report.
Retrieved April 28, 2014, from http://bleacherreport.com/articles/1999148-nba-
comparisons-for-biggest-draft-prospects-of-2014-ncaa-tournament/page/11.

69
"Pave | How It Works." Pave. N.p., n.d. Web. 23 Dec. 2013. <http://www.pave.com/how-
it-
works>.
Present Value Calculator. (n.d.). What is my future value worth today?. Retrieved April
18,
2014, from http://www.timevalue.com/products/tcalc-financial-
calculators/present-value-
calculator.aspx?CURRENTDATE=4%2F23%2F2014&FUTURE.
Queenan, J. (2013, Nov 09). REVIEW --- moving targets: Celebrity IPOs could make us
all rich.
"risk smoothing." - Insurance Glossary. N.p., n.d. Web. 1 Apr. 2014.
<http://www.irmi.com/online/insurance-glossary/terms/r/risk-smoothing.aspx>.
Risk Quotes. (n.d.). BrainyQuote. Retrieved April 29, 2014, from
http://www.brainyquote.com/quotes/keywords/risk.html.
Sailors, J. (2013, November 22). S.F. 49ers' Vernon Davis has Fantex IPO filed. - San
Francisco
Business Times. Retrieved December 15, 2013, from
http://www.bizjournals.com/sanfrancisco/morning_call/2013/11/sf-49ers-vernon-
davis-fantex-ipo.html
Singh, M. (2011). Security analysis with investement [i.e. investment] and protfolio [i.e.
portfolio] management. Delhi: Isha Books.
Skin in the game. (2013). Economist, 409(8859), 82.
Stock market. (2013, December 12). Wikipedia. Retrieved December 13, 2013, from
http://en.wikipedia.org/wiki/Stock_market.
Thomas, J. (2013, July 27). Comparing Quarterback Contracts. The Falcoholic. Retrieved
April
9, 2014, from http://www.thefalcoholic.com/2013/7/27/4560276/comparing-
quarterback-contracts.
Wasserman, J. (2014, January 9). NBA Ceiling for Creighton's Doug McDermott.
Bleacher
Report. Retrieved April 25, 2014, from
http://bleacherreport.com/articles/1916781-projecting-nba-ceiling-for-creighton-
star-doug-mcdermott.
Wiggins, Napier, McDermott Are Most Sponsor-Oriented Players From NCAA Tourney.
(2014,

70
April 4). SportsBusiness Daily. Retrieved April 25, 2014, from
http://www.sportsbusinessdaily.com/Daily/Issues/2014/04/04/Research-and-
Ratings/SponsorHub.aspx.
Willett, Allan H.. "Conclusion." The economic theory of risk and insurance. Philadelphia:
University of Pennsylvania Press, 1951. 142. Print.
Windhorst, B., & Rovell, D. (2014, April 14). Damian Lillard gets new adidas deal.
ESPN.
Retrieved April 21, 2014, from
http://espn.go.com/nba/story/_/id/10781725/damian-lillard-new-adidas-deal-
worth-100m.
Zwerling, J. (2013, October 13). The Epic Race to Sign Wiggins to Shoe Deal. Bleacher
Report.
Retrieved April 21, 2014, from http://bleacherreport.com/articles/1808832-inside-
the-epic-race-to-get-andrew-wiggins-sneaker-endorsement.