investigations into the mechanisms of rock support
TRANSCRIPT

INVESTIGATIONS INTO THE MECHANISMS OF
ROCK SUPPORT PROVIDED BY SPRAYED
LINERS
James Dube
A dissertation submitted to the Faculty of Engineering and the Built
Environment, University of the Witwatersrand, Johannesburg, in
fulfillment of the requirements for the degree of Master of Science
in Engineering.
Johannesburg, 2009

i
DECLARATION
I declare that this dissertation is my own, unaided work. It is being
submitted for the Degree of Master of Science in the University of the
Witwatersrand, Johannesburg. It has not been submitted before for any
degree or examination in any other University.
(Signature of candidate)
day of (year)
at

ii
ABSTRACT
An investigation into the mechanisms of rock support provided by sprayed
liners was carried out practically at three different mines, namely, South
Deep Mine (Gold Fields), Mponeng Mine (Anglo Gold Ashanti) and Impala
Platinum Mine (IMPLATS). The monitored sites included tunnels and
pillars supported by steel fibre reinforced shotcrete and plain shotcrete.
Underground monitoring provided information on the behaviour of
shotcrete over time as the pillars and tunnels responded to mining induced
stress changes. The exercise played a role in the identification of the
possible failure modes of shotcrete in-situ. Underground in-situ bond
strength tests were carried out to give an idea of the shotcrete-rock
interface bond strength. The monitoring methods included measurement
of strains and displacements of the tunnel walls and pillar walls with the
aid of Vibrating Wire Strain Gauges (VWSG), Multi-Point Borehole
Extensometers (MPBX), Single-Point Borehole Extensometers (SPBX)
and laser targets. Inspection boreholes were drilled, and monitored using
camera probes to observe the condition of the rock behind the shotcrete.
Also, photographs were taken to give an idea of the failure modes and
support mechanisms provided to the rock by shotcrete based on field
observations.
Fibre reinforced shotcrete laboratory tests were carried out according to
the EFNARC and ASTM standards for shotcrete panel and beam testing.
The laboratory tests helped in identifying the effects of fibre incorporation
into the shotcrete for the support of underground mining excavations.
The results obtained from the field monitoring exercise, field tests, and
laboratory tests were used to analyse and deduce the possible
mechanisms of rock support provided by sprayed liners in mining
excavations.

iii
ACKNOWLEDGEMENTS
My profound gratitude on the assistance and support for the success in
completing this research work is extended to the following people and
institutions:
Professor T.R. Stacey for his supervision, guidance and encouragement
throughout this research.
SRK Consulting for allowing me to participate in their SIMRAC shotcrete
project. SRK Consulting has also been helpful in providing most of the
literature resources through their well equipped library and past work done
on the shotcrete project.
William Joughin has provided all the information on the past work done on
the project, which includes mapping results of the underground sites. He
also provided invaluable guidance throughout the monitoring exercise.
Jody Thompson for the invaluable input in the processing of the large
volumes of data obtained from the underground monitoring instruments.
Lars Hage of BASF Construction Company and Terry Bean as well as
Phillip Walker of Metalloy Company for donating all the fibres used in the
laboratory tests.
The Managers and Staff at Mponeng Gold Mine, South Deep Gold Mine
and Impala Platinum Mine for the cooperation and affording me the
opportunity to use their premises throughout the study.
Tony Ward of Seismogen and his team for carrying out the monitoring
exercise of the instruments at all of the underground monitoring sites.
My wife Memory and son Cyril, as well as all my family members and
friends for being around in times of need during the research work.

iv
In memory of my mother Esline and brother Komborerai

v
TABLE OF CONTENTS
CONTENTS PAGE
DECLARATION .......................................................................................... i
ABSTRACT.................................................................................................ii
ACKNOWLEDGEMENTS .......................................................................... iii
TABLE OF CONTENTS............................................................................. v
LIST OF FIGURES .................................................................................. xiii
LIST OF TABLES.................................................................................... xxii
LIST OF TERMS.................................................................................... xxiii
CHAPTER 1............................................................................................... 1
INTRODUCTION ....................................................................................... 1
1.1 Background................................................................................... 1
1.2 Definition of the problem............................................................... 3
1.3 Objectives ..................................................................................... 4
1.4 Research methodology ................................................................. 5
1.5 Content of the dissertation ............................................................ 6
CHAPTER 2............................................................................................... 7
LITERATURE REVIEW ............................................................................. 7

vi
2.1 Introduction ................................................................................... 7
2.2 Functions of shotcrete as a sprayed liner ..................................... 7
2.2.1 Supporting the Rock Mass ..................................................... 7
2.2.2 Support Pressure ................................................................. 10
2.2.3 Support of Key Blocks .......................................................... 13
2.2.4 Sprayed liners as a sealant .................................................. 15
2.3 Loading of sprayed liners in underground excavations............... 15
2.3.1 Gravity loading due to loosened blocks or wedges .............. 16
2.3.2 Sprayed liner loading due to in situ stresses and mining
induced stresses............................................................................... 16
2.3.3 Loading of sprayed liners supporting the rock together with
rock bolts .......................................................................................... 17
2.3.4 Loading due to water pressure............................................. 18
2.4 Failure modes for sprayed liners................................................. 18
2.4.1 Adhesion failure.................................................................... 18
2.4.2 Shear failure......................................................................... 20
2.4.3 Flexural failure of a shotcrete beam ..................................... 21
2.4.4 Shotcrete tensile failure........................................................ 22
2.5 Shotcrete Design Methods.......................................................... 23
2.5.1 Empirical design methods .................................................... 23

vii
2.5.2 Analytical methods ............................................................... 24
2.5.3 Numerical modelling............................................................. 25
2.6 Properties of sprayed liners ........................................................ 26
2.6.1 Bond strength....................................................................... 26
2.6.2 Shotcrete strength ................................................................ 28
2.6.3 Shotcrete ductility ................................................................. 29
2.6.4 Shotcrete stiffness................................................................ 30
2.6.5 Shotcrete thickness.............................................................. 30
2.7 Mechanisms of support provided by sprayed liners .................... 31
2.7.1 Promotion of block interlock ................................................. 31
2.7.2 Shotcrete structural arch support mechanism ...................... 31
2.7.3 Shotcrete basket mechanism of rock support ...................... 32
2.7.4 Shotcrete beam support mechanism.................................... 33
2.7.5 Durability enhancement through sealing action as a support
mechanism ....................................................................................... 35
2.7.6 Rock bolt face plate extension support mechanism ............. 35
2.8 Summary .................................................................................... 36
CHAPTER 3............................................................................................. 38
UNDERGROUND FIELD MONITORING AND FIELD TESTING............. 38
3.1 Introduction ................................................................................. 38

viii
3.2 Monitoring objectives .................................................................. 39
3.3 Monitoring instruments................................................................ 39
3.3.1 Ground motion monitor (GMM) ............................................ 39
3.3.2 Vibrating wire strain gauge (VWSG)..................................... 40
3.3.3 Multi-point borehole extensometer (MPBX).......................... 41
3.3.4 Single point borehole extensometer (SPBX) ........................ 41
3.3.5 Laser displacement monitoring ............................................ 42
3.3.6 Borehole monitoring using a borehole video camera ........... 42
3.3.7 Visual monitoring.................................................................. 42
3.4 Monitoring sites........................................................................... 42
3.4.1 Mponeng Gold Mine Level 109 Test Site ............................. 42
3.4.2 Mponeng Gold Mine Level 116 ............................................ 46
3.4.3 South Deep Gold Mine ......................................................... 49
3.4.4 Determination of the in situ shotcrete material properties at
South Deep Mine .............................................................................. 57
3.4.5 Impala Platinum Mine........................................................... 60
3.5 Monitoring Results ...................................................................... 62
3.5.1 South Deep Mine monitoring results .................................... 62
3.5.2 Discussion of the monitoring results at South Deep Mine .... 70
3.5.3 South Deep Laboratory and field test results ....................... 71

ix
3.5.4 Impala Platinum Mine Monitoring Results ............................ 75
3.5.5 Mponeng Mine Level 109 monitoring results........................ 77
3.5.6 Mponeng Mine Level 116 monitoring results........................ 79
3.6 Shotcrete Failure Mechanisms ................................................... 82
3.6.1 Tensile failure....................................................................... 82
3.6.2 Adhesion failure.................................................................... 84
3.6.3 Punching failure.................................................................... 86
3.6.4 Shear failure......................................................................... 87
3.6.5 Bending failure ..................................................................... 89
3.7 Conclusion .................................................................................. 91
CHAPTER 4............................................................................................. 93
LABORATORY TESTS............................................................................ 93
4.1 Introduction ................................................................................. 93
4.2 Objectives of laboratory testing................................................... 93
4.3 Test suitability ............................................................................. 94
4.4 Test programme ......................................................................... 94
4.5 Fibre specifications ..................................................................... 96
4.5.1 Steel Fibres .......................................................................... 96
4.5.2 Polypropylene fibres............................................................. 96

x
4.6 Control of consistency................................................................. 97
4.7 Determination of shotcrete performance..................................... 98
4.7.1 ASTM beams ....................................................................... 98
4.7.2 EFNARC beams................................................................. 101
4.7.3 EFNARC Panels................................................................. 103
4.7.4 ASTM centrally loaded Round determinate Panels............ 103
4.7.5 Uniaxial Compressive Strength (UCS) tests....................... 103
4.7.6 Spraying losses of steel fibres............................................ 103
4.8 Presentation and discussion of results...................................... 103
4.8.1 ASTM beams modulus of rupture....................................... 104
4.8.2 ASTM beams toughness indices........................................ 106
4.8.3 EFNARC beams flexural strength ...................................... 108
4.8.4 EFNARC Beams residual strength..................................... 110
4.8.5 EFNARC panels peak load results ..................................... 112
4.8.6 EFNARC panels energy absorption ................................... 114
4.8.7 ASTM Round determinate panels peak loads .................... 116
4.8.8 ASTM Round Determinate Panels (RDPs) Energy Absorption
…………………………………………………………………...117
4.8.9 Uniaxial compressive strength ........................................... 120
4.8.10 Steel fibre spraying losses .............................................. 122

xi
4.9 Comments on laboratory testing results.................................... 124
4.10 Conclusions........................................................................... 125
CHAPTER 5........................................................................................... 126
INVESTIGATIONS INTO THE MECHANISMS OF ROCK SUPPORT
PROVIDED BY SPRAYED LINERS BASED ON FIELD OBSERVATIONS
............................................................................................................... 126
5.1 Introduction ............................................................................... 126
5.2 Mechanisms of rock support provided by sprayed liners based on
field observations ............................................................................... 126
5.2.1 Promotion of block interlock through bonding .................... 126
5.2.2 Tensile strength of liner ...................................................... 130
5.2.3 Basket mechanism............................................................. 133
5.2.4 Shotcrete structural support mechanism............................ 135
5.2.5 Extended faceplate............................................................. 139
5.2.6 Mechanical protection ........................................................ 140
5.2.7 Durability enhancement...................................................... 141
5.3 Conclusion ................................................................................ 142
CHAPTER 6........................................................................................... 143
CONCLUSIONS AND RECOMMENDATIONS...................................... 143
REFERENCES ...................................................................................... 147

xii
BIBLIOGRAPHY .................................................................................... 158
APPENDIX A: Load deflection graphs for ASTM beams, ASTM RDPs,
EFNARC panels and EFNARC beams .................................................. 159
APPENDIX B: Table showing the strength, peak load, residual strength
and energy absorption results for the laboratory tested shotcrete
specimens.............................................................................................. 176

xiii
LIST OF FIGURES
Figure 2.1 Types of failure which occur in massive, jointed and heavily
jointed rock masses exposed to low and high in situ stress
levels (After Hoek et al, 1995) .............................................. 9
Figure 2.2 Simplified ground-support reaction curve (After Douglas and
Arthur, 1983)....................................................................... 11
Figure 2.3a Shotcrete interaction with ground reaction curve: Difference
between shotcrete applied close to the tunnel face and far
from the tunnel face (After Leach, 1998) ............................ 12
Figure 2.3b Shotcrete interaction with ground reaction curve illustrating
the failure of plain shotcrete (After Leach, 1998)................ 12
Figure 2.3c Shotcrete interaction with ground reaction curve: Stability
with reinforced shotcrete (After Leach, 1998)..................... 13
Figure 2.4 The key block theory diagram illustrating that when the
shaded key blocks are stable, then stability around an
excavation is maintained (After Barrett and McCreath, 1995)
............................................................................................. 14
Figure 2.5 Fallout of shotcrete only indicating poor adhesion (After
Malmgren and Svensson, 1999) .......................................... 19
Figure 2.6 Shotcrete shear failure resulting from loose block movement
(After Leach, 2002)............................................................... 20
Figure 2.7 Shotcrete failing in tension as loosened block movement
occurs causing lining de-bonding (After Leach, 2002).......... 22
Figure 2.8 Simplified shotcrete design chart (Stacey, 2003, modified after
Barton et al, 1974)................................................................ 24

xiv
Figure 2.9 Adhesion testing equipment ................................................. 27
Figure 2.10 Shotcrete rock bearing capacity as an arch (After Stille and
Franzen, 1990) ................................................................... 32
Figure 2.11 Shotcrete support as a beam, supported by adhesion to the
rock or adhesion to the rock and clamping effect offered by
rock bolts (After Stille and Franzen, 1990) ......................... 34
Figure 2.12 Shotcrete support as flexible retaining panels in a tunnel
(After Kaiser and Tannant, 1997) ....................................... 34
Figure 2.13 Illustration of the extended face plate where shotcrete and
rock bolting are used together (After Stacey, 2001) ........... 36
Figure 3.1 Ground motion monitor (GMM) ............................................ 40
Figure 3.2 Strain gauge rosettes ........................................................... 41
Figure 3.3 Mponeng Mine Level 109 South-East wall showing positions
of laser targets and the inspection borehole....................... 44
Figure 3.4 Mponeng Mine Level 109 North-West wall showing the
position of laser targets and the inspection borehole.......... 45
Figure 3.5 Mponeng Mine Level 116 site plan (SRK SIMRAC Internal
report, 2008)......................................................................... 46
Figure 3.6 Mponeng Mine Level 116 wall A showing the position of laser
targets and the Ground Motion Monitor (GMM).................... 47
Figure 3.7 Mponeng Mine Level 116 wall B showing the positioning of
laser targets the Ground Motion Monitor (GMM).................. 48
Figure 3.8 South Deep Mine plan showing location of test site (SRK
SIMRAC Internal report, 2008)............................................. 49

xv
Figure 3.9 Test pillar detail at South Deep Mine Site (SRK SIMRAC
Internal report, 2008)............................................................ 50
Figure 3.10 Face and support mapping of Pillar B and Pillar D (SRK
SIMRAC Internal report, 2008)............................................. 52
Figure 3.11 Photograph showing South Deep Mine Pillar A and
positioning of monitoring instruments, values show the
thickness of shotcrete at the marked position ...................... 54
Figure 3.12 Photograph showing South Deep Mine Pillar B and
positioning of monitoring instruments................................... 55
Figure 3.13 Photograph showing South Deep Mine Pillar D and
positioning of monitoring instruments and shotcrete cracks
marked on the pillar.............................................................. 56
Figure 3.14 Photograph showing South Deep Mine Pillar E positioning of
monitoring instruments ......................................................... 57
Figure 3.15 Photograph showing shotcrete-rock bond strength testing at
South Deep Mine (Pillar A)................................................... 58
Figure 3.16 Photographs showing the location of drilled cores for UCS
testing, bond strength testing and fibre density determination
at South Deep Mine on pillars A, D and E ............................ 59
Figure 3.17 Impala Platinum Mine monitoring site plan (SRK SIMRAC
Internal report, 2008)............................................................ 60
Figure 3.18 Photograph showing the position of the Vibrating Wire Strain
Gauge (VWSG) and the Ground Motion Monitor (GMM) on the
monitored sidewall of the shotcreted tunnel at Impala Platinum
Mine ..................................................................................... 61

xvi
Figure 3.19 South Deep Mine Pillar A displacement and strain results 63
Figure 3.20 South Deep Mine Pillar B displacement results ................ 64
Figure 3.21 South Deep Mine Pillar B laser targets displacement results
.......................................................................................... 65
Figure 3.22 South Deep Mine Pillar D displacement results ................ 66
Figure 3.23 South Deep Mine Pillar D laser targets displacement results
.......................................................................................... 67
Figure 3.24 South Deep Mine MPBX and GMM monitoring results for
Pillar E ................................................................................ 68
Figure 3.25 Fracture zones identified at South Deep Mine site from
borehole inspection (SRK, SIMRAC Internal report, 2008). 69
Figure 3.26 Impala Platinum Mine GMM displacement results ............ 76
Figure 3.27 Impala Platinum Mine vibrating wire strain gauge results . 76
Figure 3.28 Mponeng Mine Level 109 North-West wall displacement
results................................................................................. 78
Figure 3.29 Mponeng Mine Level 109 South-East wall displacement
results................................................................................. 79
Figure 3.30 Laser targets displacement results for Mponeng Mine Level
116 ..................................................................................... 81
Figure 3.31 GMM displacement results for Mponeng Mine Level 116 . 82
Figure 3.32 Photograph showing tensile failure of shotcrete on Pillar B at
South Deep Mine................................................................ 83

xvii
Figure 3.33 Cross-section of a pillar with the solid line showing original
pillar profile and dashed line showing the pillar profile after
expansion due to increased mining induced stresses. ....... 84
Figure 3.34a Photograph showing adhesion failure of shotcrete on Pillar E
at South Deep Mine............................................................ 85
Figure 3.34b Photograph showing adhesion failure between Pillar D and
Pillar E at South Deep Mine ............................................... 86
Figure 3.35 Photograph showing punching failure of shotcrete on Pillar D
at South Deep Mine............................................................ 87
Figure 3.36 Photograph showing shear failure of shotcrete on Pillar B at
South Deep Mine................................................................ 88
Figure 3.37 Relative displacement of shotcrete block A to shotcrete block
B resulting in shotcrete shear failure .................................. 89
Figure 3.38a Photograph showing bending failure of shotcrete on Pillar B
at South Deep Mine............................................................ 90
Figure 3.38b Photograph showing bending failure of shotcrete on Pillar B
at South Deep Mine............................................................ 91
Figure 4.1 Metalloy steel fibre dimensions ............................................ 96
Figure 4.2 Polypropylene fibre dimensions ........................................... 97
Figure 4.3 Determination of toughness indices (ASTM C1018, 1997). 101
Figure 4.4 P values from the Load-Deflection graph for flexural and
residual strengths (EFNARC, 1996) ................................. 102
Figure 4.5 Modulus of rupture for the polypropylene fibre reinforced
shotcrete ASTM beams .................................................... 105

xviii
Figure 4.6 Modulus of rupture for the steel fibre reinforced ASTM
shotcrete beams................................................................. 105
Figure 4.7 Toughness indices for the polypropylene fibre reinforced
shotcrete ASTM beams...................................................... 107
Figure 4.8 Toughness indices for the steel fibre reinforced shotcrete
ASTM beams ..................................................................... 107
Figure 4.9 Flexural strength for the polypropylene fibre reinforced
EFNARC beams................................................................. 109
Figure 4.10 Flexural strength for the steel fibre reinforced shotcrete
EFNARC beams................................................................. 109
Figure 4.11 Residual strength for the polypropylene fibre reinforced
shotcrete EFNARC beams ................................................. 111
Figure 4.12 Residual strength for the steel fibre reinforced shotcrete
EFNARC beams................................................................. 111
Figure 4.13 Peak loads for the polypropylene fibre reinforced shotcrete
EFNARC panels ................................................................. 113
Figure 4.14 Peak loads for the steel fibre reinforced shotcrete EFNARC
panels................................................................................. 113
Figure 4.15 Energy absorption for the polypropylene fibre reinforced
shotcrete EFNARC panels ................................................. 115
Figure 4.16 Energy absorption for the steel fibre reinforced shotcrete
EFNARC panels ................................................................. 115
Figure 4.17 Peak loads for the polypropylene fibre reinforced shotcrete
round determinate panels................................................... 116
xix
Figure 4.18 Peak loads for the steel fibre reinforced shotcrete round
determinate panels............................................................. 117
Figure 4.19 Energy absorption for the polypropylene fibre reinforced round
determinate panels............................................................. 118
Figure 4.20 Energy absorption results for the steel fibre reinforced round
determinate panels............................................................. 118
Figure 4.21 Load-deflection results for the polypropylene fibre reinforced
shotcrete round determinate shotcrete panels ................... 119
Figure 4.22 Load-deflection results for the steel fibre reinforced shotcrete
round determinate shotcrete panels ................................... 120
Figure 4.23 Uniaxial compressive strength test results for the steel fibre
reinforced shotcrete cores.................................................. 121
Figure 4.24 Uniaxial compressive strength test results for the
polypropylene fibre reinforced shotcrete cores................... 122
Figure 4.25 Steel fibre spraying rebound loss results for the steel fibre
reinforced shotcrete specimens........................................ 123
Figure 5.1a Borehole A and Borehole B in Mponeng Level 109 showing
broken rock (about 0.5m) but interlocked in place by the
shotcrete........................................................................... 128
Figure 5.1b Broken and loose rock held back by wire mesh and rope
lacing and broken rock interlocked behind shotcrete at
Mponeng Mine Level 109 ................................................. 129
Figure 5.1c Side view of the loosened blocks (about 0.5m depth) held
back by the mesh and lacing a few meters from the intact
shotcreted section shown in Figure 5.1a and Figure 5.1b 130

xx
Figure 5.2 Fibres sticking out due to tensile stresses on a shotcrete crack
at South Deep Mine............................................................ 132
Figure 5.3a Diagram illustrating the tensile failure of fibres in fibre
reinforced shotcrete............................................................ 132
Figure 5.3b Diagram illustrating the pullout (failure) of fibres in fibre
reinforced shotcrete............................................................ 133
Figure 5.4 Basket mechanism where shotcrete has been applied
together with rock bolts; mesh and lacing support (Mponeng
Mine Level 116).................................................................. 134
Figure 5.5a Demarcation between shotcrete, mesh and lacing support on
Level 109 at Mponeng Mine. Shotcreted section shows no
signs of loosening whereas the mesh and lacing section show
signs of rock loosening....................................................... 136
Figure 5.5b Close view of Mponeng Mine Level 109 mesh and lacing
section (mesh and lace section in Figure 5.5a) showing
loosened rock held back by mesh and lacing support ........ 137
Figure 5.5c Close view of Mponeng Mine Level 109 shotcreted roof
section (shotcreted roof section in Figure 5.5a) still intact and
showing no signs of failure in the shotcrete as the shotcrete
provides support through the beam support mechanism.... 138
Figure 5.6 Cracks observed in a borehole showing a possibility of rock
slabs forming in the tunnel walls due to mining induced
stresses at Impala Platinum Mine....................................... 139
Figure 5.7 Tensioned cable bolting with face plates on the surface of
shotcrete at Mponeng Mine Level 116 ............................... 140

xxi
Figure 5.8 Damaged corner of one of the pillars that were monitored at
South Deep Mine................................................................ 141

xxii
LIST OF TABLES
Table 2.1 Overview of some of the relevant property requirements for
shotcrete depending on ground condition (after Grov and
Blindheim, 1997)................................................................. 26
Table 2.2 The standard test methods to determine the strength
properties of shotcrete.......................................................... 28
Table 3.1 Mponeng Mine site rock mass classification (SRK SIMRAC
Internal report, 2008)............................................................ 43
Table 3.2 South Deep Mine site rock mass classification (SRK SIMRAC
Internal report, 2008)............................................................ 51
Table 3.3 Bulk density, fibre density and UCS test results for cores
drilled out of an EFNARC Panel spayed at South Deep Mine
during pillar shotcreting ........................................................ 72
Table 3.4 In situ shotcrete core drilling and laboratory testing results at
South Deep Mine monitoring site ......................................... 74
Table 4.1 Test programme per fibre density batch............................... 95
Table 4.2 Steel fibre specifications....................................................... 96
Table 4.3 Polypropylene fibre specifications ........................................ 97
Table 4.4 Summary of standard test methods for testing shotcrete
beams and panels ................................................................ 98
Table 4.5 Suggested toughness indices (After Morgan, 1988) .......... 100
Table 4.6 Fibre content losses for shotcrete specimens sprayed
underground and on surface .............................................. 124

xxiii
LIST OF TERMS
ASTM American Society for Testing Materials
GMM Ground motion monitor
GSI Geological strength index
MPBX Multi-point borehole extensometer
N/m2 Newton per square metre
RDP Round determinate panel
RMR Rock mass rating
SIMRAC Safety in Mines Research Advisory Committee
SPBX Single point borehole extensometer
SRK Steffen, Robertson and Kirsten
UCS Uniaxial compressive strength
VWSG Vibrating wire strain gauge
µm micrometre

1
CHAPTER 1
INTRODUCTION
1.1 Background
Sprayed liners are a form of rock support for mining excavations, mainly
underground operations. Hudson and Harrison (1997) defined rock
support as the introduction of structural elements into an excavation for
the purpose of inhibiting displacements at the excavation boundary to
maintain stability. Hoek and Wood (1987) pointed out that the primary
objective of a support system is to mobilize and conserve the inherent
strength of the rock mass so that it becomes self-supporting. Rock support
can be called active support and passive support.
Brady and Brown (1993) defined active support as the type of support that
imposes a predetermined load to the rock surface once installed.
Examples of active support include tensioned rock bolts or tensioned
cables. Passive support is defined as the support that develops its load
while the rock mass surrounding the excavation deforms (Brady and
Brown, 1993). Henderson and Lewis (2001) indicated that sprayed liners,
which are also referred to as containment support, fall into the category of
passive support.
The mechanisms of rock support provided by sprayed liners have not
been well explained in past literature. Various research carried out has
shown that sprayed liners are viewed as ‘containment’ support, as
opposed to ‘retainment’ support provided by rock bolts, cables etc (Stacey
and Ortlepp, 1999; Ortlepp et al., 1999). The sprayed liners used in mining
operations are shotcrete and thin spray-on liners (TSLs).

2
Shotcrete is a mixture of cement, sand, small aggregate and additives
(e.g. accelerators, plasticizers, etc) that is pneumatically sprayed and
compacted under high velocity onto a surface (usually rock). When there
are no fibres incorporated, it is referred to as plain shotcrete and when
there are fibres (mainly steel or polypropylene) incorporated it is called
fibre reinforced shotcrete. Shotcrete prevents or minimizes rock
displacement by filling large open joints and fractures, transferring the rock
load to adjacent stable rock, and sealing the rock face to prevent ravelling
and sloughing (Vandewalle, 1992). There are two types of shotcrete in
use, namely, dry-mix shotcrete and wet-mix shotcrete. The main difference
between the two systems is the stage at which water is applied to the dry
ingredients: at the nozzle for dry-mix shotcrete and during mixing for wet-
mix shotcrete (Hoek et al, 2000).
Thin spray-on liners (TSLs) are polymer based products applied to the
rock with thickness that can be as low as 3mm to 4mm (Spearing and
Hague, 2003). TSLs can be classified into reactive or non-reactive liners.
Non-reactive TSLs once applied to the excavation surface gain strength
over time as a result of hydration. On the other hand, reactive liners once
applied gain strength rapidly due to an exothermic reaction brought on by
a catalyst. Thin spray-on liners, sometimes referred to as super skins,
have been developed to provide replacements to the traditional forms of
containment support. Stacey (2001) states that thin spray-on linings have
the advantages of low volume, rapid application and rapid curing.
All forms of sprayed liner support are largely dependent on the bonding
between the sprayed liner and the rock interface. This calls for thorough
cleaning of the rock surfaces during preparation before the sprayed liner
support can be applied onto the excavation.

3
Sprayed liner support is applicable in both the civil and the mining
engineering industries. The support requirements in these two different
environments differ due to the fact that mining excavation support design
aims at stability not longer than the required life of mine. However, for civil
engineering purposes, long-term stability is crucial due to access by the
public, and the planned cost of support is usually small in relation to the
overall project cost. Also, for civil engineering purposes, excavations must
be designed with a very low probability of failure.
Swan and Henderson (2001) indicated that the sprayed liner alone may
not be adequate for ground support, hence the need to apply sprayed
liners in combination with other forms of support, e.g., rock bolts. When
used with other forms of support, the order of application of the supports
depends on the design preferences and ground conditions.
Stacey (2001) and Tannant (2001) described a range of mechanisms of
sprayed liner support behaviour and their loading behaviour. The support
mechanisms are said to be occurring individually or in combination. The
mechanisms of sprayed liner support behaviour and the common loading
mechanisms need to be reviewed to enhance the understanding for
practical application purposes.
1.2 Definition of the problem
The actual mechanisms of rock support provided by sprayed liners are
extremely complex (Kaiser and McCreath, 1992). Some statements from
the industry such as “the rock starts to behave when it sees the shotcrete”
(Stacey and Yu, 2004), show that there is need for practical research to
investigate some of the mechanisms by which sprayed liners support the
rock.

4
One problem is that most of the mechanisms identified in literature are
based on theoretical reasoning due to lack of field photographic
illustrations to enhance the understanding of the mechanisms of rock
support provided by the sprayed liners. Additionally, there has been
controversy concerning whether shotcrete as a sprayed liner offers
structural support or not.
Stacey and Yu (2004) argue that, due to thin applications of shotcrete in
mining, typically less than 100mm thick, the structural arch support would
be theoretically negligible. Thus the mechanisms of support behaviour of
the shotcrete must be very different from that of the structural arch
assumption on which most designs are said to be based.
Therefore a practically-based approach to investigate the mechanisms of
rock support by means of field monitoring and field testing of sprayed liner
supported excavations as well as laboratory testing, will give an improved
understanding of rock support mechanisms provided by sprayed liners.
1.3 Objectives
The objective of this research is to improve the understanding of the
mechanisms by which sprayed liners support the rock in situ in
underground mining excavations by means of a practically based
approach. The practically based approach shall concentrate on the
analyses of field monitoring results of the shotcreted sites. Laboratory
testing of shotcrete was also carried out to determine the effects of fibre
incorporation in shotcrete on the rock support mechanisms provided by
shotcrete as a sprayed liner.

5
1.4 Research methodology
A literature review of the information relating to the mechanisms of rock
support provided by sprayed liners has been included in the research to
provide the essential background information. This was followed by
underground monitoring of shotcreted tunnels and pillars.
The underground monitoring exercise was carried out at the following
mines: South Deep Gold Mine (Gold Fields Mining Company), Mponeng
Gold Mine (Anglo Gold Ashanti operation) and Impala Platinum Mine
(IMPLATS). At Mponeng Mine, two monitoring sites were established in
tunnels on Level 109 and Level 116. The monitoring site at Impala
Platinum Mine was established in a tunnel at Level 24 Shaft Number 15.
The monitoring site at South Deep Mine was established in a pillar
supported area close to a tipping point. Prior to shotcreting, mapping of
the pillars and tunnels was carried out to estimate the pre-existing rock
mass conditions at each of the underground mine sites.
Various instruments were used to measure strain, displacement and
ground conditions in addition to field observations. The instruments used
were Ground Motion Monitor (GMM), Single Point Borehole Extensometer
(SPBX), Multi-Point Borehole Extensometer (MPBX) and Vibrating Wire
Strain Gauge (SPBX).
Additionally, field tests were carried out at South Deep Mine to determine
the shotcrete-rock interface bond strength. Shotcrete cores were drilled
from the monitored pillars at South Deep Mine for UCS testing and for the
determination of fibre density in the sprayed shotcrete.
Lastly, laboratory testing of shotcrete specimens (panels and beams) was
carried out according to the ASTM and EFNARC standards.

6
1.5 Content of the dissertation
The following chapter reviews information relevant to the mechanisms
involved in sprayed liner support using past literature. Chapter 3 presents
the field monitoring and the field testing activities carried out to determine
the behaviour of shotcrete in situ. Chapter 3 also shows photographic
illustrations of the possible failure modes of shotcrete in the field.
Presented in Chapter 4 are the results of shotcrete laboratory tests carried
out using the ASTM and EFNARC standard test methods to determine the
behaviour of fibre reinforced shotcrete and the effect of fibre incorporation
in the shotcrete. A link between field observations and possible
mechanisms of rock support provided by sprayed liners is presented in
Chapter 5. The findings of this research and conclusions are found in
Chapter 6. Laboratory test results are summarised in Appendix A and
Appendix B.

7
CHAPTER 2
LITERATURE REVIEW
2.1 Introduction
Chapter 1 has provided the definition of rock support; the forms of rock
support; definition of sprayed liners; types of sprayed liners and a brief
description of each type of sprayed liner; and the objectives of the
research as well as the research methodology. It was highlighted in
Chapter 1 that the mechanisms of rock support and loading conditions
need to be reviewed, and these topics form part of this Chapter. Also
reviewed in Chapter 2 are the functions of sprayed liners, load transfer
mechanisms of sprayed liners, failure modes of sprayed liners as well as
useful physical properties of the sprayed liners. The review has a major
focus on shotcrete as a thin sprayed liner for rock support in underground
mining.
2.2 Functions of shotcrete as a sprayed liner
2.2.1 Supporting the Rock Mass
The main function of sprayed liners is to assist the rock mass maintain its
stability to ensure safety in underground excavations. Langille et al (1995)
mentioned that for one to understand how sprayed liners maintain stability
in excavations, it is important for one to first understand how the rock fails.
This is due to the fact that failure of the rock in excavations can be stress
driven and or structurally controlled depending on the rock mass (Hoek et
al, 1995). Figure 2.1 shows tunnels in high and low stress environments

8
with rock mass characteristics ranging from massive rock to heavily
fractured rock mass and the failure associated with each rock mass
condition. However, Leach (1998) argues that the excavation geometry
also contributes to the displacements taking place in excavations which
can result in failure of the excavation boundary.
Langille (2001) pointed out that liner application for ground support in a
massive rock environment is not likely to provide any benefit. However, in
blocky ground sprayed liner support can be very beneficial. Therefore it is
important to understand both the rock mass conditions and the stress
changes that will occur in the given rock mass conditions due to mining
induced stresses. Hoek et al (1995) mentioned that the intention of the
ground control system is not to prevent the failure from occurring by
supporting the dead weight of the rock that has loosened, but to control
and manage the deformations that result from the failure.
Morrison et al (1999) suggested that the ground can be controlled through
the application of support and mining practices such as blasting
techniques, de-stressing requirements, scaling practice, mining
sequencing, orientation and shape of the excavation. In the ground control
system, shotcrete is essential in arresting initial rock mass displacement to
promote stability of the rock mass.

9
Figure 2.1 Types of failure which occur in massive, jointed and
heavily jointed rock masses exposed to low and high in
situ stress levels (After Hoek et al, 1995)

10
2.2.2 Support Pressure
Shotcrete support pressure in support design can be described as the
resistance offered by shotcrete to the excavation boundary to control the
inward displacement of the excavation walls, thereby preventing the
loosening of rock, to ensure stability (Hoek et al, 1995). Mining
excavations disturb the original stress patterns in the rock resulting in
stress rearrangement and instability of the excavation boundary. Leach
(1998) states that support requirements for an excavation can be
assessed in terms of support pressure. He also pointed out that support
pressure is used to contain the rock in its post failure state thereby
attaining the post failure residual strength of the rock mass as the rock
fractures are kept closed.
Hudson and Harrison (1997) mentioned that the support pressure required
to maintain equilibrium of the excavation boundary at a given
displacement value can be presented in a ground-support reaction curve
as shown in Figure 2.2. Equilibrium between the stresses induced onto the
excavation boundary and the support pressure provided by the sprayed
liner is achieved when the support reaction curve intersects the rock mass
displacement curve before either of the two curves has displaced too far
(line 1 and line 2 marked in Figure 2.2). Line 1 in Figure 2.2 illustrates that
if stiff support is installed in an excavation it reaches high support
pressures at low excavation displacements and may be less effective.
However, line 2 in Figure 2.2 illustrates optimum support that has been
installed after some displacement has occurred – it intersects the rock
mass displacement curve thereby indicating stability of the excavation.
Line 3 in Figure 2.2 illustrates soft support installed after the rock has
undergone too much displacement thereby failing to provide effective
support to the excavation boundary.
Leach (1998) pointed out that the ground-support reaction curve is
dependent on a specific set of conditions for a given mining environment

11
which include rock strength, excavation size and shape, stress field etc.
He developed some curves to illustrate the interaction between shotcrete
and the ground reaction curve for a tunnel as illustrated in Figure 2.3a,
Figure 2.3b and Figure 2.3c. Figure 2.3a illustrates stability of an
excavation attained when the shotcrete is applied close to the face and
further away from the face. Figure 2.3c shows the benefit of reinforcement
in shotcrete as stability is attained due to its ductility. This can be
compared to plain shotcrete in Figure 2.3b, where stability of the tunnel is
not attained.
Figure 2.2 Simplified ground-support reaction curve (After Douglas
and Arthur, 1983).

12
Figure 2.3a Shotcrete interaction with ground reaction curve:
Difference between shotcrete applied close to the tunnel
face and far from the tunnel face (After Leach, 1998)
Figure 2.3b Shotcrete interaction with ground reaction curve
illustrating the failure of plain shotcrete (After Leach,
1998)

13
Figure 2.3c Shotcrete interaction with ground reaction curve:
Stability with reinforced shotcrete (After Leach, 1998)
According to the support pressure design theory, shotcrete needs to be
applied as quickly as possible to freshly exposed rock surfaces. Long
delays allow the rock mass to loosen thereby reducing its ability to arch
and increasing the potential for dead loads to develop (Stille and Franzen,
1990). Exceptions may occur in highly stressed ground where application
is usually delayed to allow large stress-induced deformations to dissipate.
2.2.3 Support of Key Blocks
Shi and Goodman (1981) developed a concept for tunnels developed in
blocky ground called the key block theory. The support of key block theory
states that if all potentially unstable blocks surrounding a tunnel are
supported, then, stability of the tunnel is achieved. Figure 2.4 illustrates
the concept of the key block support theory whereby the block numbers
demonstrate the order in which the rock mass would unravel once the
shaded key blocks are removed. Kuijpers and Toper (2002) pointed out
that sprayed liners provide stability to large blocks embedded in relatively

14
competent rock mass. Kuijpers and Toper (2002) emphasized good
adhesion in the sprayed liner-rock interface and provision of sufficient
shear and/or tensile resistance by the sprayed liner. However, due to the
greater dead weight of the larger key blocks, Rose (1985) pointed out that
large blocks are best supported by long rock bolts whereas shotcrete is
necessary for the support of small key blocks in between the rock bolts.
Figure 2.4 The key block theory diagram illustrating that when the
shaded key blocks are stable, then stability around an
excavation is maintained (After Barrett and McCreath,
1995)
Lang (1961) demonstrated the importance of sprayed liners in the support
of small key blocks between rock bolts. Through his inverted bucket
experiment, he showed that stability of small blocks can be achieved by a
hairnet between the rock bolts. When the hairnet was burnt, the rock
collapsed. However, Pells (2008) argued that conclusions drawn from

15
Lang’s experiment can be questioned using simple applied mechanics. He
goes on to say that in the experiment, the stresses induced on the rock
bolts are too small by several orders of magnitude to have any effect on
the rock mass strength in underground excavations.
2.2.4 Sprayed liners as a sealant
Egger (1981) and Morgan and Mowatt (1984) mentioned that shotcrete
can help maintain the integrity of the rock by sealing open joints, as it
penetrates into the joints during spraying. On the other hand, Speers
(1998) considered sprayed liners as a sealant to intact rock that is prone
to deterioration by weathering. Some rock types like Kimberlite are prone
to deterioration once exposed to water. Stacey (2001) and Bartlett and
Borejszo (2002) described the importance of the coating action provided
by thin spray-on liners to the exposed Kimberlite as they protect it from
water and therefore prevent its decomposition.
2.3 Loading of sprayed liners in underground excavations
The creation of excavations underground through mining activities disturbs
the once stable rock in various ways. Supporting the excavations becomes
a necessity to restore that stability. Therefore it has been found worthwhile
to review the loading of sprayed liners by the rock as the loading
determines the mechanism of support and the eventual failure mode of the
sprayed liners.

16
2.3.1 Gravity loading due to loosened blocks or wedges
When blocky ground is excavated, structurally controlled instability of
wedges and blocks may take place. The wedges or blocks may displace
into the excavation due to gravity when they loosen thereby loading the
liner (Stacey and Yu, 2004 and Malmgren, 2005). Kaiser and Tannant
(1997) proposed a simplified method whereby the load acting on the
shotcrete layer can be estimated as the weight of the loose block or
wedge. Failure of the shotcrete takes place when the load bearing
capacity of the liner is exceeded by the load exerted by the loose rock.
2.3.2 Sprayed liner loading due to in situ stresses and mining
induced stresses
The rock is subjected to uniformly distributed virgin stresses before an
excavation is opened up. Once an excavation is made, the original rock
stress state is disturbed resulting in the redistribution of stresses in the
immediate vicinity of the tunnel (Hoek et al, 1995). Depending on the
magnitude of the stresses and the jointing in the rock, stress driven failure
of the rock surrounding the excavation may load the sprayed liner applied
to the excavation boundary. However, if there is no stress driven rock
displacement taking place, only the rock will be stressed and not the
sprayed liner. Stacey and Yu (2004) indicated that if there is good
adhesion between the shotcrete-rock interface, when the shotcrete is
stiffer than the fractured rock, it may result in the premature failure of the
shotcrete. Malmgren et al (2004) pointed out that shotcrete applied in high
stress environments should be able to deform freely to accommodate
some excavation boundary displacements before failure.
When shotcrete has been reinforced with fibres and used together with
rock bolts, mining induced stresses may cause distributed loads to act on
the shotcrete. Stacey and Yu (2004) pointed out that the distributed loads

17
may cause the liner to support the rock with a “basket” support mechanism
due to the ductility resulting from fibre incorporation which enables the
shotcrete to accept some displacement before failure. High stresses on
the excavation walls may induce bending loading on the shotcrete.
Stacey and Yu (2004) stated that support in excavations is normally
placed on the roof and sidewalls. As a result, high stresses may cause the
floor to converge faster than the roof thereby inducing bending loading
onto the shotcrete, especially in the haunch areas of the excavation
(Stacey and Yu, 2004).
Stresses can also result in a cantilever loading mechanism onto the
sprayed liner. Cantilever loading of the sprayed liner support was first
discussed by Tannant et al (1999) after carrying out field investigations
underground on Thin Spray-on Liners (TSLs). From field observations,
Tannant et al (1999) noted two different occasions when the sprayed liner
failed due to continuous tearing apart caused by rock slabs that had
rotated and cantilevered from the back. Tannant (2002) pointed out that
cantilever loading resulting in tearing of the liner can be avoided when
there is full areal coverage of the excavation by the sprayed liner.
2.3.3 Loading of sprayed liners supporting the rock together with
rock bolts
When rock bolts and shotcrete are used together for rock support,
Humphries and Funkhouser (1993) and Malmgren (2001) pointed out that
the interaction between the rock bolts and the shotcrete is achieved when
face plates are attached to the rock bolts with the face plates placed on
the surface of shotcrete. The face plates play a crucial role for effective
load transfer between the shotcrete and the rock bolts.

18
2.3.4 Loading due to water pressure
Aagaard et al (1997) mentioned that water may build up behind the
sprayed liner supported excavations thereby loading the sprayed liner. In
order to avoid surface support failure due to water pressure loading,
Aagaard et al (1997) and Stacey (2001) indicated that provision for
draining water collecting behind the sprayed liner is the best solution to
ensure there is no water build up behind the sprayed liner.
2.4 Failure modes for sprayed liners
Failure modes for sprayed liners range from adhesion failure, bending
failure, shear failure, compressive failure and tensile failure. Fernandez-
Delgado et al (1981), Holmgren (1987) and Vandewalle (1992) explored
modes of shotcrete failure using falling block tests to simulate the load
applied on shotcrete. Their test results indicated that for steel fibre-
reinforced and mesh-reinforced linings, direct shear failure tends to occur
when adhesion to the rock mass is good, whereas flexural and punching
shear failure occur when adhesion is poor and de-bonding has occurred.
2.4.1 Adhesion failure
Adhesion between the sprayed liner and the substrate plays a key role in
defining the limiting failure mechanism, provided that cracking parallel to
the bonded surface does not occur in the substrate itself (Barrett and
McCreath, 1995). If adhesion is maintained, failure of the shotcrete will be
controlled by direct shear. However, adhesion loss due to the sprayed
liner peeling off from the rock or slabbing of the substrate will see the
flexural failure mechanism becoming kinematically possible.

19
Hahn and Holmgren (1979) and Fernandez-Delgado et al (1976) pointed
out that shotcrete-rock interface bond strength is poor on surfaces that
have not been cleaned thoroughly with high pressure water. However,
Egger (1981) added that adhesion is very much dependent on the type
and quality of rock, following a series of tests on different rocks. On the
other hand, Kumar et al (2002) proved through a series of tests that the
bond strength of shotcrete varies directly with the joint roughness of the
rock.
Malmgren and Svensson (1999) and Kuchta (2002) illustrated that
adhesion failure occurs when the shotcrete-rock bond strength is weak
relative to the dead weight of the shotcrete, resulting in the fallout of
shotcrete as shown in Figure 2.5.
Figure 2.5 Fallout of shotcrete only indicating poor adhesion (After
Malmgren and Svensson, 1999)

20
2.4.2 Shear failure
Barrett and McCreath (1995) indicated that shear failure can occur in two
forms, namely direct shear failure or punch shear failure. They described
direct shear failure of shotcrete as a process that occurs when the applied
loads exceed the shear strength of the shotcrete as illustrated in Figure
2.6. Kuchta (2001) and Barrett and McCreath (1995) highlighted that the
shotcrete-rock bond strength should be strong enough such that no bond
failure occurs for direct shear of the shotcrete to take place.
Figure 2.6 Shotcrete shear failure resulting from loose block
movement (After Leach, 2002)
Point loading or concentrated loading on the shotcrete by a loosened
block which is squeezed out from the excavation boundary due to high
stresses may cause punching shear failure of the shotcrete. Punching
shear failure usually occurs when the adhesion failure of the shotcrete-
rock interface occurs. Failure would occur close to the rock bolts where
shear forces are at a maximum. Failure occurs along planes inclined at
approximately 45˚ to the horizontal (Barrett and McCreath, 1995).

21
2.4.3 Flexural failure of a shotcrete beam
Failure in flexure occurs once adhesion between shotcrete and the rock
has been lost. When the bond between the rock and the shotcrete
interface is strong, the flexural capacity of the rock-shotcrete system may
be increased due to the formation of a composite beam, with the
reinforced shotcrete on the outside and mechanically interlocked broken
rock on the inside.
Barrett and McCreath (1995) estimated that a 50mm thick plain shotcrete
lining, having flexural strength of 6 MPa at 28 day strength and supported
by 1.2m x 1.2m bolt spacing, could support a bending moment of 1.5 kNm
in pure bending.
Steel fibre reinforcement in shotcrete helps to improve the post peak
strength of shotcrete in flexure. Morgan and Mowatt (1984) carried out
tests on steel fibre reinforced shotcrete slabs to see the effects of steel
fibre incorporation. The results obtained from the tests revealed that the
steel fibre reinforcement in the shotcrete permits the slab to continue
supporting approximately 80% of the peak load over small deformations
(less than 10mm) and approximately 60% of the peak load over large
deformations of 10 to 50mm. Holmgren (1983) developed the following
relationship for the flexural capacity of a steel fibre-reinforced, statically
indeterminate concrete slab:
Cflex = 0.9 {(R10/5 + R30/10) / 200} σflex t2/6 s/2
Where:
Cflex = the resistance to moments
R10/5 + R30/10 are the toughness factors defined in ASTM C1018 (1997)
s = bolt spacing
t = shotcrete thickness

22
Despite being developed for a concrete slab, Holmgren’s equation
provides a logical starting point for designing the quantity and type of
reinforcement required in a reinforced shotcrete lining (Barrett and
McCreath, 1995). Additionally, Holmgren’s equation provides a starting
point for designing the shotcrete thickness and bolt spacing.
2.4.4 Shotcrete tensile failure
Kuchta (2002) pointed out that good adhesion is important for the overall
support characteristics of shotcrete. Therefore if the adhesion strength is
low, the weight of loose blocks of rock pushing down on the shotcrete
layer may cause sections to separate and gaps can be formed between
the shotcrete layer and the rock surface. Kuchta (2002) further indicated
that the subsequent bending of the shotcrete will result in pure tensile
failure of the shotcrete as shown in Figure 2.7.
Figure 2.7 Shotcrete failing in tension as loosened block movement
occurs causing lining de-bonding (After Leach, 2002)

23
2.5 Shotcrete Design Methods
This section presents some of the support design methods that can be
adopted to determine the thickness of shotcrete and the reinforcement
required. In general, design methods were classified by Whittaker and
Frith (1990) into three different categories, namely:
(a) Empirical methods,
(b) Analytical methods and
(c) Computational or numerical methods
2.5.1 Empirical design methods
Empirical design methods are based on in situ observations or
measurements made on prototype rock (Obert and Duvall, 1967). An
example of the empirical design method of shotcrete support is that
developed and subsequently refined by Barton et al (1974) and Barton
(2002). A simplified version of this empirical design was published by
Stacey (2003) for application in the mining environment as shown in
Figure 2.8. The design chart encompasses rock mass rating (RMR) and
the Q-System of rock mass classification, as well as the span of the
excavation to estimate the shotcrete thickness requirements.

24
Figure 2.8 Simplified shotcrete design chart (Stacey, 2003,
modified after Barton et al, 1974)
2.5.2 Analytical methods
Analytical design methods for shotcrete design consist of resolving a
problem into its simplest elements and representing the problem by
tractable equations and then solving them (Brown and Bray, 1987). An
example is that of the yield line theory first developed by Johansen (1962).
The yield line theory provides a simple method to calculate the ultimate
load bearing capacity of shotcrete or alternatively the required plastic
moment resistance for a given load on a shotcrete panel.
Yield line theory is based on the principle that internal work done by yield
lines rotating must equal the external work done by the load moving. A
yield line in this context is a line of cracked shotcrete serving as an axis of

25
rotation for an un-cracked shotcrete panel. Only the energy absorbed by
the yield lines rotating is considered, the amount of the energy absorbed
by shear or elastic deformation is ignored for calculation purposes. In
reinforced shotcrete design, the error introduced by this assumption is
very small but in shotcrete, the rock-shotcrete interface may absorb large
amounts of energy in shear possibly leading to conservative results.
Malmgren et al (2004) compared panel test results with predicted results
and found that in general the yield line theory provides conservative
estimates of ultimate capacity in panel tests. The under-estimation of the
ultimate load bearing capacity was assumed to be the result of arching in
the shotcrete panel. In practice this arching effect may not always be
relied upon and the results may be less conservative. Detailed information
on the topic is available in Johansen (1962) and Kennedy and Goodchild
(2004).
2.5.3 Numerical modelling
Numerical modelling in rock engineering can be used for support design.
The software packages are available in 2 dimensional and 3 dimensional
versions.
Whittaker and Frith (1990) argue that the assumptions made in formulating
a mathematical solution as introduced in the previous subsection, are far
too simple to provide a solution to the real situation. However, support
design using a combination of empirical methods, analytical methods and
numerical analysis can give a solution best suited to reality (Whittaker and
Frith, 1990).

26
2.6 Properties of sprayed liners
The relative importance of shotcrete material properties for ground support
purposes depends on the type of ground stability problem. A summary of
some of the relevant shotcrete properties has been prepared by Grov and
Blindheim (1997) and is reproduced in Table 2.1.
Table 2.1 Overview of some of the relevant property requirements
for shotcrete depending on ground condition (after Grov
and Blindheim, 1997)
Ground Good High High
conditions bond stiffness ductility
Jointed Required Required Not
required and blocky
Squeezing Required Not
required Required Ground Spalling Required Not wanted Required
Water
seepage Required Not
applicable Not
applicable
2.6.1 Bond strength
Saiang et al (2004) have indicated that the shotcrete-rock interface bond
strength is one of the most important sprayed liner properties. However,
Melbye (1994) indicated that little control can be exercised as far as the
bond strength value is concerned since it largely depends on the nature
and roughness of the surface on which the shotcrete is applied. Bond
strength is also dependent on the mixing process and the application
techniques (Malmgren, 2001). However, Melbye (1994) and Kuchta et al
(2004) indicated that control should not only focus on the application
process but also on the level of cleaning the face before application.

27
There are various physical tests to determine bond strength which include
the EFNARC (1996) standard test method whereby an in situ core of
shotcrete is drilled to a certain depth together with the rock. Still bonded
together, the shotcrete-rock core is then taken to the laboratory to
determine the bond strength by pull testing. Another method, illustrated in
Figure 2.9, involves drilling a shotcrete core until the rock is reached. Then
a metal disc is installed onto the shotcrete core using high strength glue.
Once the glue sets, the disc is pulled out and the bond strength value is
read off the equipment. Bond strength tests carried out by various
researchers have indicated that shotcrete-rock bond strength varies
between 0.5 – 3.0 MPa. At the moment, design is not based on bond
strength since it is difficult to measure and varies over short distances
(Grov and Blindheim, 1997 and Melbye et al., 1995).
Figure 2.9 Adhesion testing equipment

28
2.6.2 Shotcrete strength
The most commonly used strength properties of shotcrete are
compressive strength, flexural strength and tensile strength. There are
standard test methods for each of the above mentioned strength
properties and these are summarised in Table 2.2.
The compressive strength of shotcrete on its own is regarded as a less
important property but provides a measure of the Young’s modulus of
shotcrete (Grov and Blindheim, 1997). Grov and Blindheim (1997) and
Melbye et al (1995) indicated that the Young’s modulus of shotcrete
follows the shotcrete compressive strength closely. However, MacKay and
Trottier (2004) argue that compressive strength is the primary factor in
structural concrete design. This may be true for civil engineering where the
sprayed liners are designed for structural support purposes. However, in
mining, since the thicknesses of shotcrete are typically less than 100mm,
structural support offered by shotcrete is often negligible (Stacey and Yu,
2004). MacKay and Trottier (2004) indicated that fibre addition may
increase the compressive strength of concrete by 20 percent. However,
Morgan (1988) has noted that the compressive strength of shotcrete is not
significantly influenced by the addition of fibres.
Table 2.2 The standard test methods to determine the strength
properties of shotcrete
Strength Property Standard Test Method
Compressive strength ASTM C39
Flexural strength ASTM C496
Tensile strength ASTM C1018
Flexural strength is a measure of the bending capacity of shotcrete at first
crack. Knowing first crack stress enables the designer to perform the
correct design calculation for the expected shotcrete failure mechanism.

29
MacKay and Trottier (2004) have pointed out that the flexural strength of
fibre reinforced shotcrete is known as residual strength post the first crack.
Residual strength is not a true strength because it is based on a linear
elastic response and uses the gross properties of the uncracked section in
the beam testing of shotcrete (MacKay and Trottier, 2004). Ray (1997) has
pointed out that the flexural strength is the most ideal design criterion for
plain shotcrete. Ray’s (1997) argument was based on the fact that once
the plain shotcrete section has cracked, its load carrying capacity is
destroyed and the brittle failure is almost instantaneous. However, Morgan
(1988) performed several flexural strength tests and concluded from the
results he obtained that the flexural strength of shotcrete slightly improves
with the addition of fibres in the shotcrete. Additionally, Morgan (1988)
indicated that a remarkable improvement in the shotcrete flexural strength
of shotcrete can be achieved by the addition of super plasticisers.
The third strength property of shotcrete is its tensile strength. The tensile
strength of shotcrete indicates its capacity to resist forces pulling the
shotcrete in opposite directions. Melbye (1994) has pointed out that the
tensile strength of the shotcrete is not so important due to the likelihood of
shrinkage cracks that may develop while the sprayed shotcrete cures.
2.6.3 Shotcrete ductility
Shotcrete ductility provides an indication of its ability to maintain load while
undergoing deformation (Ratcliffe, 1999). The main reason for
incorporating fibres in shotcrete is to impart ductility to an otherwise brittle
shotcrete thereby improving the fibre reinforced shotcrete load bearing
capacity (Papworth, et al., 1996). Vandewalle (1998) indicated that the
load bearing capacity of shotcrete is improved by the process of load
redistribution as a result of fibre incorporation. Grov and Blindheim (1997)
and Ray (1997) also pointed out that the ductility of shotcrete is affected
by fibre type, shape, length and quantity.

30
Ductility of shotcrete can be measured as residual strength, toughness or
energy absorption. Energy absorption is defined as the area under the
load-deflection curve of a beam or panel test. Energy absorption is also
called toughness. The residual strength provides the load bearing capacity
post the peak strength or peak load of shotcrete. The methods for testing
ductility include ASTM C1018, JSCE-SF4 Japanese Standard, Norwegian
Standard and the Template Method proposed by Morgan et al (1995). The
strengths and weaknesses of each of the above mentioned methods were
discussed by Ray (1997) and Papworth et al (1996).
2.6.4 Shotcrete stiffness
The stiffness of shotcrete indicates its resistance to bending. Stiffness
increases with an increase in shotcrete compressive strength. Also, an
increase in stiffness is related to increased brittleness of shotcrete (Ray,
1997). Stiffer shotcrete in blocky ground mainly helps to arrest initial rock
movement (Stacey and Yu, 2004). However, stiffer shotcrete is less
effective in squeezing ground conditions where sustained resistance,
toughness or ductility are most required (Ray, 1997). Stacey and Yu
(2004) also pointed out that the stiffer the sprayed liner the smaller the
rock movements it can withstand before failure. Therefore design
considerations should cater for ground condition assessment before the
final support design can be implemented.
2.6.5 Shotcrete thickness
Chen et al (1994) indicated that the thickness of a shotcrete layer is
important in that it dictates the maximum width of cracks occurring during
failure thereby influencing the performance of the shotcrete. The thickness
of shotcrete in situ can be determined by using depth pins or probing of
the shotcrete while still wet. The thickness of dried shotcrete can be
tested using a Hilti drilling machine. The drawback for this method is that
31
sometimes it can be difficult to determine the inter-change from shotcrete
to rock thereby jeopardising the accuracy of the method. A more accurate
method would involve measuring the thickness of in situ drilled cores. The
thickness of shotcrete may determine whether the support offered to the
rock is structural or not.
2.7 Mechanisms of support provided by sprayed liners
2.7.1 Promotion of block interlock
Shotcrete is applied to the rock under high pressure. As a result, mortar
and fines penetrate into joints and cracks thereby producing a wedge
effect between the rock blocks (Egger, 1981, Melbye, 1994 and Stacey,
2001). The wedge effect interlocks the rock blocks thereby inhibiting rock
displacement. Stacey (2001) also explained how good bonding on the
shotcrete-rock interface, shear strength and tensile strength properties of
shotcrete assist in the promotion of block interlock to maintain excavation
stability. The promotion of block interlock by sprayed liners may not be
feasible where there are large loose blocks which may require much stiffer
support.
2.7.2 Shotcrete structural arch support mechanism
Sutcliffe and McClure (1969) and Stille and Franzen (1990) pointed out
that sprayed liners can support the rock through the structural arch
support mechanism. Melbye (1994) explained that shotcrete prevents the
differential movement of crushed rock thereby causing a generally even
inward displacement of the rock. As the rock moves inwards, the length of
the excavation contour decreases resulting in compressive forces acting
on the shotcrete-rock composite as illustrated in Figure 2.10. Sutcliffe and

32
McClure (1969) pointed out that the early strength of the liner plays an
important role if the shotcrete is to achieve a structural arch support
mechanism. Stacey (2001) also mentioned that such a liner should have
high flexural rigidity. Stille and Franzen (1990) indicated that the arch
would be stressed by pure compression and that the stability of the
excavation relies on the strength of the arch. However, Fredriksson and
Stille (1992) and Alberts and Backstrom (1971) have indicated that the
shotcrete only prevents the loosening of the rock thereby transforming the
surrounding rock into a self supporting arch. Each of the explanations may
be true, but this suggests considerable uncertainty in the structural arch
support mechanism.
Figure 2.10 Shotcrete rock bearing capacity as an arch (After Stille
and Franzen, 1990)
2.7.3 Shotcrete basket mechanism of rock support
The basket mechanism of rock support provided by sprayed liners occurs
when the sprayed liners develop some form of basket into which the failed

33
rock is collected (Stacey, 2001). The sprayed liner needs to have ductility
so that it has the capability to undergo some deflection without failing. The
incorporation of fibres in the shotcrete is important in offering the shotcrete
increased ductility.
2.7.4 Shotcrete beam support mechanism
An illustration of shotcrete acting as beam is shown in Figure 2.11. When
shotcrete supports the rock as a beam, Banton et al (2004) pointed out
that the shotcrete can be treated as a beam in bending. As a result, beam
theory can be used to estimate the driving moments and the resisting
moments to determine bending capacity of the shotcrete in design.
Melbye (1994) pointed out that shotcrete adhesion to the rock is essential
when the shotcrete enhances the bending capacity of the rock. He added
that rock bolting with face plates clamping the shotcrete to the rock will
improve the bearing capacity provided by the combined support.
Kaiser and Tannant (1997) suggested that the beam action support by
shotcrete can be enhanced when the shotcrete is applied in the form of
flexible panels as illustrated in Figure 2.12. The flexible panels prevent the
generation of tangential stresses in the shotcrete thereby preserving its
bending capacity. When there is good bonding between the shotcrete and
the rock, the result can be a stronger rock-shotcrete composite beam.

34
Figure 2.11 Shotcrete support as a beam, supported by adhesion to
the rock or adhesion to the rock and clamping effect
offered by rock bolts (After Stille and Franzen, 1990)
Figure 2.12 Shotcrete support as flexible retaining panels in a tunnel
(After Kaiser and Tannant, 1997)
Banton et al (2004) described how a rock-shotcrete composite beam can
be formed resulting in a much stronger beam compared to the beam
consisting of the layer of shotcrete only. Banton et al (2004) mentioned

35
that the improvement in carrying capacity is a result of the increase in the
thickness of the rock-shotcrete composite beam.
2.7.5 Durability enhancement through sealing action as a support
mechanism
Sprayed liners can be used to protect support units from equipment
damage or the rock mass itself from the damage by equipment. Player
(2004) reported the success in using fibre reinforced shotcrete in
protecting pillars and the previously installed mesh and bolt support from
damage by remote controlled loaders underground. Finn et al (1999),
Bartlett and Nesbitt (2000) and Stacey (2001) also indicated that rocks like
Kimberlite, which is prone to weathering on exposure to wetting and
drying, will have their life prolonged by the coating action provided by
sprayed liners.
2.7.6 Rock bolt face plate extension support mechanism
Humphries and Funkhouser (1993) and Malmgren (2001) have shown that
the interaction between shotcrete and rock bolts can be improved when a
face plate connected to the rock bolt is placed on the outer surface of the
sprayed liner. Stacey (2001) demonstrated how the area of influence of
the rock bolt is increased when the face plate interacts with the shotcrete
as illustrated in Figure 2.13.
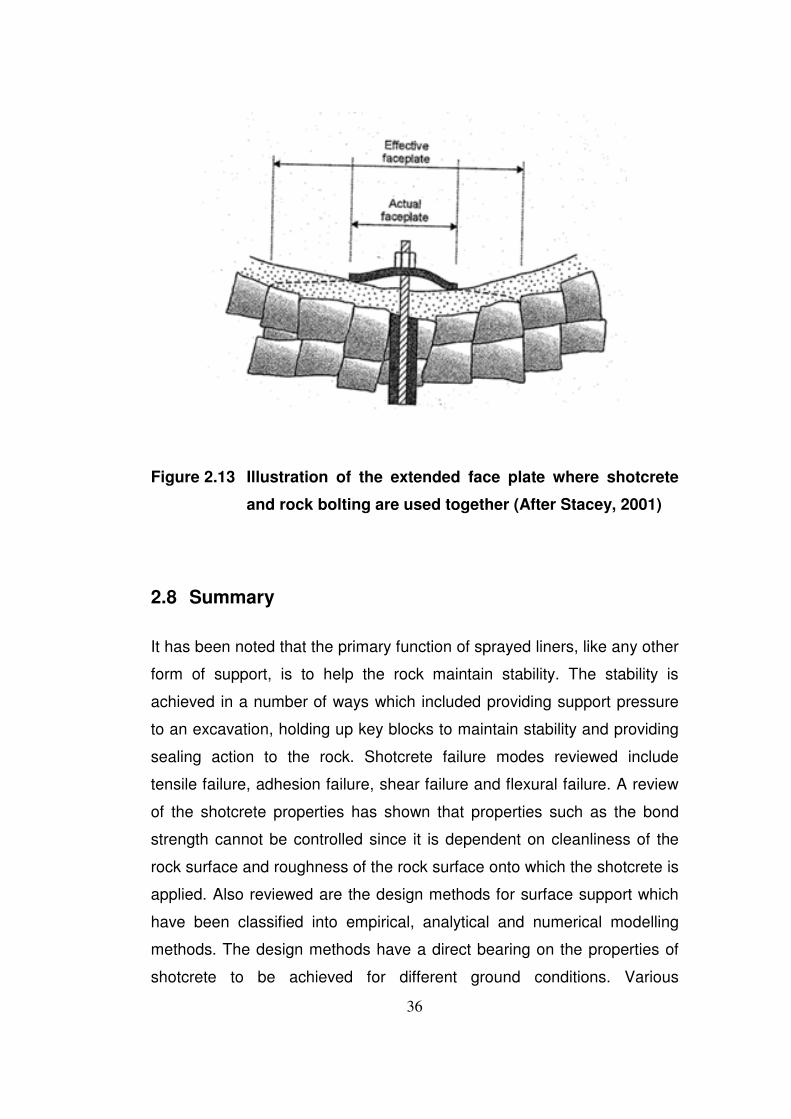
36
Figure 2.13 Illustration of the extended face plate where shotcrete
and rock bolting are used together (After Stacey, 2001)
2.8 Summary
It has been noted that the primary function of sprayed liners, like any other
form of support, is to help the rock maintain stability. The stability is
achieved in a number of ways which included providing support pressure
to an excavation, holding up key blocks to maintain stability and providing
sealing action to the rock. Shotcrete failure modes reviewed include
tensile failure, adhesion failure, shear failure and flexural failure. A review
of the shotcrete properties has shown that properties such as the bond
strength cannot be controlled since it is dependent on cleanliness of the
rock surface and roughness of the rock surface onto which the shotcrete is
applied. Also reviewed are the design methods for surface support which
have been classified into empirical, analytical and numerical modelling
methods. The design methods have a direct bearing on the properties of
shotcrete to be achieved for different ground conditions. Various

37
mechanisms of rock support provided by sprayed liners have been
identified in literature. They shall be used in analysing the mechanisms of
rock support provided by sprayed liners in the field. Therefore the literature
survey has provided invaluable information for use in the subsequent
chapters.

38
CHAPTER 3
UNDERGROUND FIELD MONITORING
AND FIELD TESTING
3.1 Introduction
The previous chapter has provided a review of the aspects that have been
found relevant to the investigation of the mechanisms of rock support
provided by spayed liners. Some of these aspects include failure modes of
shotcrete, methods of shotcrete design, mechanisms of surface support
loading and the identified mechanisms of support provided by the sprayed
liners. The review has provided information useful for the practical
underground monitoring of shotcreted sites at three different mine sites,
namely, South Deep Mine, Impala Platinum Mine and Mponeng Mine. This
chapter starts by identifying the objectives of the field monitoring exercise
and giving a brief description of the instruments used for the in situ
monitoring. Additionally, a brief description is provided for each monitoring
site followed by the monitoring results. Rock-shotcrete bond strength tests
were carried out at South Deep Mine. Cores were drilled from South Deep
Mine pillars for fibre content determination and uniaxial compressive
strength testing. Of the two EFNARC panels that were sprayed at the time
of spraying the South Deep Mine pillars, one was used for energy
absorption testing and shotcrete cores were drilled for UCS testing and
fibre content determination from the other.

39
3.2 Monitoring objectives
Monitoring of the test sites was carried out to achieve the following
objectives:
• To identify the failure mechanisms of shotcrete in situ,
• To identify the mechanisms of rock support provided by sprayed
liners.
3.3 Monitoring instruments
3.3.1 Ground motion monitor (GMM)
The GMMs are high precision digital extensometers used to measure
sidewall displacement of the shotcreted pillars. They were end-anchored
at a depth of 3.5m into the pillars. Figure 3.1 shows a section through a
GMM installed in a hole. Displacement results from the GMM can be read
directly using a manual readout unit that will be connected to the GMM.
Alternatively, the GMM can be connected to a data logger or slug, which is
an instrument that can continuously store displacement measurement
results at user pre-set time intervals. The slug or data logger has the
facility to download the stored results into a computer database. Two data
loggers or slugs can be used interchangeably to enable continuous
monitoring using the GMMs when one slug has been taken to surface for
the purpose of downloading the recorded displacement results.

40
Figure 3.1 Ground motion monitor (GMM)
3.3.2 Vibrating wire strain gauge (VWSG)
Vibrating wire embedment strain gauges are normally used to measure
strain in shotcrete. However, during the monitoring exercise, the strain
gauges were used to measure strain in the rock. Figure 3.2 shows a strain
gauge rosette configuration showing three gauges (flanges) oriented in
three different directions. The gauges were installed in the vertical plane
with each rosette consisting of 3 gauges installed at depths of 1.5 m,
2.5 m and 3.5 m respectively. Strain was then calculated by applying
calibration factors to the frequency measurement.

41
Figure 3.2 Strain gauge rosettes
3.3.3 Multi-point borehole extensometer (MPBX)
The MPBX is used to determine the stability and movement behaviour of
the rock. A typical rod extensometer consists of a reference head, usually
installed at the collar of each drill hole and one or more in-hole anchors.
Each anchor is fixed in place at a known depth in the borehole namely,
1.8m, 2.8m and 3.8m depths. As the rock deforms, the distance between
the individual anchors change. Displacement will be determined by the
difference between the initial reading and successive readings. The results
are taken using a manual readout unit that reads data directly in mm. This
allows an accurate determination of the magnitude, rate and acceleration
of deformation in the rock.
3.3.4 Single point borehole extensometer (SPBX)
The Single point borehole extensometer has the same principle of
operation as the multi-point borehole extensometer. The only difference is
that the SPBX has one anchor whereas the MPBX has more than one.
They both provide displacement as output. The SPBXs were end
anchored at 3.5m depth.

42
3.3.5 Laser displacement monitoring
Laser displacement monitoring was carried out using a laser distometer
which was set at a fixed position, with distance being measured using a
laser beam directed at fixed targets on a pillar or tunnel sidewall. During
the monitoring exercise, laser targets were mounted on pillars of interest
and each target displacement was recorded over a period of time.
3.3.6 Borehole monitoring using a borehole video camera
Boreholes with a diameter of 100mm were drilled into pillars and tunnel
sidewalls to a depth of 10m and a borehole video camera was used for
profiling the boreholes over a period of time. This was done to observe
changes in the rock behind the applied shotcrete, to assist in the
interpretation of the results from the other monitoring instruments.
3.3.7 Visual monitoring
Visual monitoring involved taking photographs using a digital camera to
record the changes in the state of the shotcreted pillars and tunnels over
time. The photographs were routinely taken from set positions on each site
to create a database for the visual state of the shotcrete, and the dates
were recorded.
3.4 Monitoring sites
3.4.1 Mponeng Gold Mine Level 109 Test Site
The test site was established at the end of 2005 and is located on 109
Level 44 cross-cut, which is a 4.5m x 4.5m crosscut at 3037m below the

43
surface. Steel fibre-reinforced dry-mix shotcrete was sprayed on a
selected 10m portion of the crosscut adjacent to areas supported by wire
mesh and lacing. The test site was chosen because it was expected that it
would be subjected to increased levels of stress due to mining. However,
changes in the mining sequence after initial site establishment resulted in
the expected stress levels not being reached. The site has instead been
exposed to a reducing stress field as the crosscut was over-stoped. This
site was closed in September 2007. Mapping of both sides of the tunnel
was carried out to determine the rock mass characteristics.
The rock type at the Mponeng Mine site is very hard unweathered
Alberton lava. The rock mass classification ratings are shown in Table 3.1.
Table 3.1 Mponeng Mine site rock mass classification (SRK
SIMRAC Internal report, 2008)
Rock mass classification method Rock mass rating
Laubscher Mining Rock Mass Rating 55
Bieniawski Mining Rock Mass Rating 54
Q-system 3.1
The site was sprayed with steel fibre reinforced shotcrete. However,
before the shotcrete was applied, the following support could be noted:
• 20 mm thick re-bars spaced on a 1.4m by 1.3m pattern and
• Swellex with a square pattern of 1.4m spacing.
Figure 3.3 and Figure 3.4 show the position of the laser targets and the
boreholes.

44
Figure 3.3 Mponeng Mine Level 109 South-East wall showing
positions of laser targets and the inspection borehole
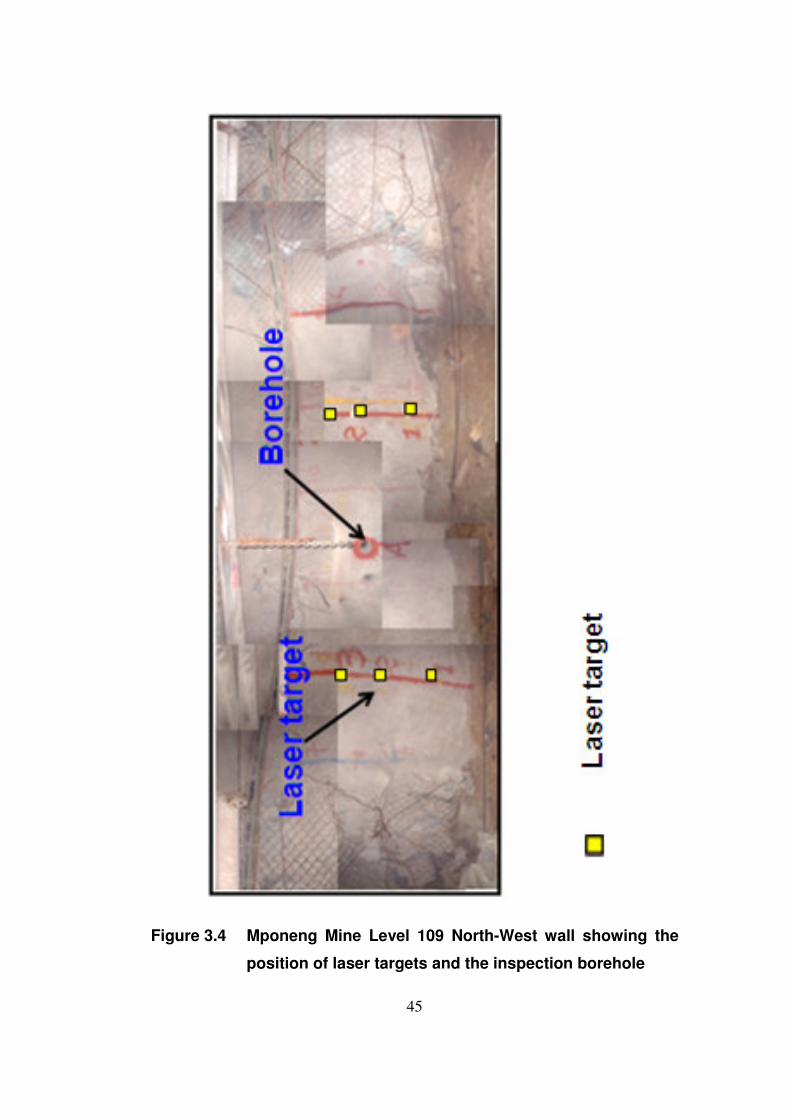
45
Figure 3.4 Mponeng Mine Level 109 North-West wall showing the
position of laser targets and the inspection borehole

46
3.4.2 Mponeng Gold Mine Level 116
The second monitoring site at Mponeng Mine was set up on Level 116, 45
cross-cut in October 2006. Mponeng Mine Level 116 is situated at 3271m
below the surface in a highly seismically active area. This location was
chosen specifically to measure shotcrete performance under dynamic
loading. The area was supported with 50mm steel fibre reinforced
shotcrete that was covered by wire mesh and tensioned lacing and 38
tonne anchors. 116 Level 45 cross-cut has rock mass and rock conditions
similar to those for Mponeng Mine Level 109. The location of the site is
shown in Figure 3.5.
Figure 3.5 Mponeng Mine Level 116 site plan (SRK SIMRAC Internal
report, 2008)

47
The position of boreholes, laser targets and the Ground Motion Monitor
(GMM) are shown in Figure 3.6 and Figure 3.7.
Figure 3.6 Mponeng Mine Level 116 wall A showing the position of
laser targets and the Ground Motion Monitor (GMM)
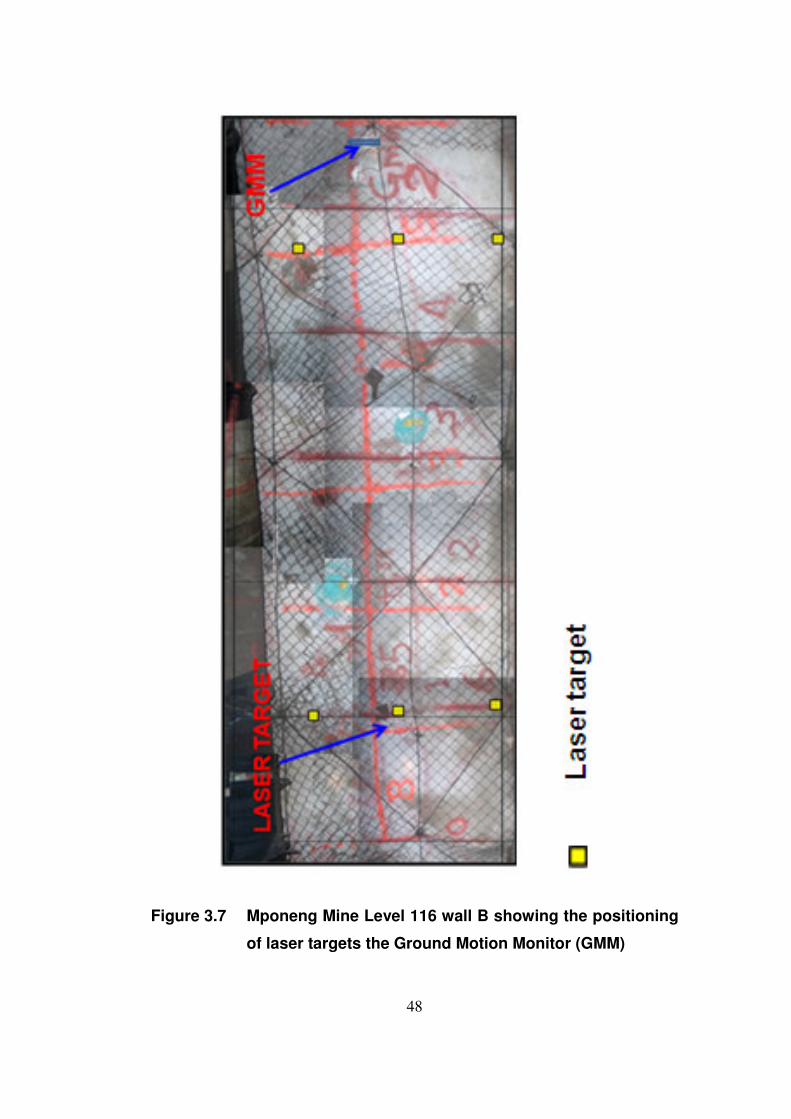
48
Figure 3.7 Mponeng Mine Level 116 wall B showing the positioning
of laser targets the Ground Motion Monitor (GMM)

49
3.4.3 South Deep Gold Mine
The test site was situated on Level 87-2 West. This site was established in
February 2007 and is situated in a trackless mechanized mining area that
was in the final stages of extraction. The site is approximately 2600m
below the surface. The test site was also situated close to a tipping area.
Stresses in the remaining pillars were high making the South Deep Mine
site the most ideal site for the monitoring of failure mechanisms of
shotcrete in situ. High stress levels were indicated by dog earing of drilled
boreholes as well as numerous locations of sidewall spalling on nearby
pillars. Seismic events were also recorded in the area and some seismic
damage was evident in some areas. Figure 3.8 shows a regional plan of
the test site and the four pillars that were monitored. Figure 3.9 shows the
pillars that were monitored and their dimensions.
Figure 3.8 South Deep Mine plan showing location of test site (SRK
SIMRAC Internal report, 2008)

50
Figure 3.9 Test pillar detail at South Deep Mine Site (SRK SIMRAC
Internal report, 2008)
The mechanised trackless section is mined above a 1.8m wide tabular de-
stress cut that has been backfilled. Backfilling was applied to help reduce
the vertical field stress acting on the 3 pillars in order to prevent violent
seismic failure of the pillars during pillar extraction. The pillars were
extracted using the mechanised drift and fill mining method. Despite the
significant reduction in field stress brought on by the de-stressing, pillar
stresses in the trackless sections were high as noted during the monitoring
exercise of the pillars.
The pillars were located in brittle, massive conglomerate. Pillars B and D
were classified using the following rock mass classification methods: Rock
Mass Rating after Laubscher (1990) and Bieniawski (1989), the Q-System
after Barton et al (1974) and the Geological Strength Index (GSI). The
results obtained are shown in Table 3.2. According to Barton et al (1974),
the rock condition can be described as good.

51
Mapping of the pillars was carried out and Figure 3.10 shows the profiles
of the mapped structure and the initial rock support on pillars B and D. Flat
dipping bedding planes were found to be common in all the pillars. All the
pillars had natural weakness planes and sidewalls showed stress induced
fracturing with varying degrees of fracture intensity.
Table 3.2 South Deep Mine site rock mass classification (SRK
SIMRAC Internal report, 2008)
Rock mass Rating Method Pillar B Pillar D
RMRL after Laubscher (1990) 71 66
Q after Barton et al (1974) 25 25
RMRB after Bieniawski (1989) 73 73
GSI = RMRB - 5 68 68

52
Figure 3.10 Face and support mapping of Pillar B and Pillar D (SRK
SIMRAC Internal report, 2008)

53
The mapped locations showed 20mm diameter, 2.4m long resin rebar
support units in the sidewall of the test pillars. In both Pillars A and B,
support units were approximately on a 1.5 m x 1.5 m support grid pattern.
The height of the pillars ranged between 5m and 6m. The site was
sprayed with steel fibre-reinforced shotcrete. Photographs of the
shotcreted pillar faces are shown in Figure 3.11 to Figure 3.14. In Figure
3.11, the thickness of the shotcrete is indicated and was determined using
a battery operated hand held Hilti Drilling machine. The thickness was
measured using the probe end of a vernier callipers and the results
showed that the thickness ranged between 41 and 81mm on all pillars.
However, the average sprayed thicknesses of 55, 66, 59 and 53
millimetres apply to pillars A, B, D and E respectively.

54
Figure 3.11 Photograph showing South Deep Mine Pillar A and
position of monitoring instruments, values show the
thicknesses of shotcrete at the marked position

55
Figure 3.12 Photograph showing South Deep Mine Pillar B and
positioning of monitoring instruments
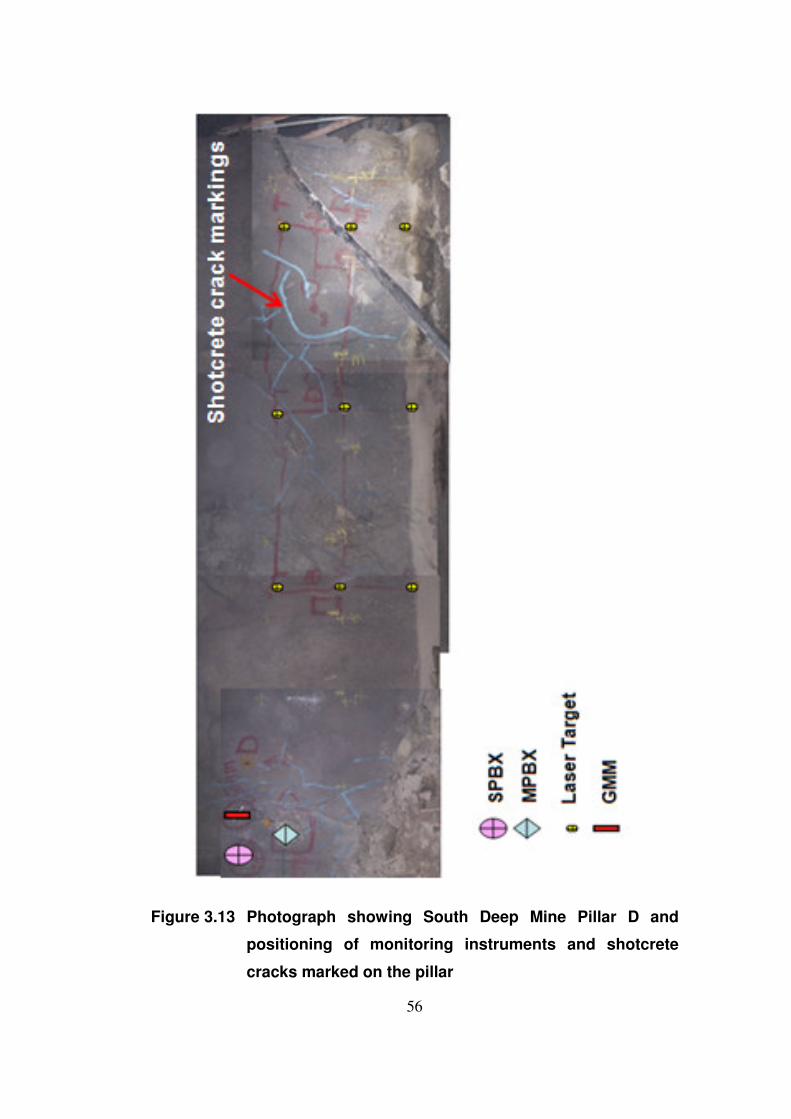
56
Figure 3.13 Photograph showing South Deep Mine Pillar D and
positioning of monitoring instruments and shotcrete
cracks marked on the pillar

57
Figure 3.14 Photograph showing South Deep Mine Pillar E
positioning of monitoring instruments
3.4.4 Determination of the in situ shotcrete material properties at
South Deep Mine
Two EFNARC panels were sprayed underground at the time of spraying
the pillars with shotcrete for laboratory testing. The first panel was tested
for energy absorption according to the EFNARC (1996) standard. Results
obtained indicate that the shotcrete had an energy absorption of 393
joules. Shotcrete cores were drilled from the second EFNARC panel to
determine UCS, bulk density and steel fibre density of the shotcrete mix.
The samples were tested more than a year after spraying. UCS, bulk
density and steel fibre content results for the six core samples drilled from
the second panel are presented in Table 3.3 in Section 3.5.3.

58
Shotcrete cores were drilled from pillars A, D and E. Cores for steel fibre
content were drilled using a 50 mm diameter barrel. The cores for UCS
testing were drilled using a 75 mm diameter barrel. Due to safety
considerations, no cores were drilled from pillar B. UCS, steel fibre
density and in situ adhesion (bond) strength tests were conducted on
cores obtained from the pillars.
Bond strength testing cores were drilled using a 50mm diameter barrel.
The bond strength tests were performed in situ. Figure 3.15 (a) and (b)
shows the adhesion (bond) strength testing. The bond strength value was
read off the bond strength testing machine shown in Figure 3.15b. The
positions from which the bond strength tests were carried out are shown in
Figure 3.16 for pillars A, D and E.
Figure 3.15 Photograph showing shotcrete-rock bond strength
testing at South Deep Mine (Pillar A)

59
Figure 3.16 Photographs showing the location of drilled cores for
UCS testing, bond strength testing and fibre density
determination at South Deep Mine on pillars A, D and E

60
3.4.5 Impala Platinum Mine
The site was located at Number 14 Shaft and was established in March
2006. The site is a 3m x 3m footwall drive at 1200m below the surface on
Level 24. It is separated from the stope above by a 7m middling. The
tunnel was sprayed with wet-mix plain shotcrete on both sidewalls at an
average thickness of 50mm. Figure 3.17 shows the test site location on a
regional plan and Figure 3.18 shows the test site sidewall that was being
monitored.
Figure 3.17 Impala Platinum Mine monitoring site plan (SRK SIMRAC
Internal report, 2008)

61
Figure 3.18 Photograph showing the position of the Vibrating Wire
Strain Gauge (VWSG) and the Ground Motion Monitor
(GMM) on the monitored sidewall of the shotcreted
tunnel at Impala Platinum Mine

62
The test site was located in spotted anorthosites which have a high
feldspar content. Intense sidewall fracturing and “onion peeling”, was
noticeable on the sidewalls, which may indicate high vertical stresses, was
effectively controlled using a systematic application of shotcrete close to
the tunnel face.
3.5 Monitoring Results
Monitoring results obtained from each mine site have been presented in
graphical format showing changes in strain or displacement over time.
Also presented are the boreholes monitoring results for South Deep Mine
only, as the other sites experienced very little or no changes from the time
when the monitoring exercise commenced. Visual monitoring results are
presented in Section 3.6, which gives attention to the failure modes of
shotcrete observed during the monitoring exercise.
3.5.1 South Deep Mine monitoring results
Monitoring results from South Deep Mine are presented in Figures 3.19 –
3.24. The borehole monitoring results are shown in Figure 3.25.
Figure 3.19 shows the single point borehole extensometer (SPBX), ground
motion monitor (GMM) and the vibrating wire strain gauge (VWSG) results
for pillar A. The GMM and the SPBX results show a similar displacement
trend throughout the monitoring period. They also show a sudden jump in
displacement between July 2007 and August 2007. The sudden jump in
displacement resulted from the mining of benches close to the monitoring
area between July 2007 and August 2007, which increased the mining
induced stresses in the pillars. However, the GMM recorded a larger
displacement compared to the SPBX. The larger displacement recorded

63
by the GMM may be attributed to the difference in positioning of the
instruments.
Figure 3.19 South Deep Mine Pillar A displacement and strain
results
The vibrating wire strain gauges (VWSG) were inserted in boreholes to
measure strain in the pillars. Only two of the VWSG for pillar A were
functional as the third was discovered to be faulty after installation. The
results for the two gauges show a sudden jump in the strain readings
between February 2007 and March 2007. The reason for this sudden jump
is not known, but may be a result of the cement grout curing used when
installing the vibrating wire strain gauges in the borehole. The distribution
of the readings, and the response of the other instruments, indicate that
the initial jump does not represent real behaviour. The strain gauge results
show no significant change in strain between March 2007 and June 2007.
However, between mid-June 2007 and mid-July 2007, there is a gradual
increase in strain which is more noticeable in gauge number 3. The
increase in strain between mid-June 2007 and mid-July 2007 is likely to

64
have resulted from an increase in mining induced stresses as the mining
of benches close to the monitoring site took place.
Pillar B monitoring results are shown in Figure 3.20 and Figure 3.21. The
single-point borehole extensometer (SPBX), multi-point borehole
extensometer (MPBX), ground motion monitor (GMM) and laser
displacement monitoring results in Figure 3.20 and Figure 3.21 show
similar trends. They all show a gradual increase from February 2007 to
July 2007. They also show a sudden jump between July and August 2007
when benches close to the monitoring site were mined resulting in
increased mining induced stresses in the pillars. The GMM, laser
monitoring, MPBX and SPBX B1 show greater displacement compared to
the displacement measured by SPBX B2. The SPBX B2 was positioned
close to the backfill confined section of the pillar whereas the other
instruments were positioned in the middle of the pillar where more
displacement could be experienced.
Figure 3.20 South Deep Mine Pillar B displacement results

65
The vibrating wire strain gauge (VWSG) for pillar B was inserted in a
borehole to measure strain in the pillar. The VWSG results shown in
Figure 3.20 show a sudden jump in strain between February 2007 and
March 2007. As indicated above, these sudden changes are not
considered to be real, but probably have resulted from the curing of the
cement grout used when installing the vibrating wire strain gauges in the
boreholes. VWSG number 1 shows no increase in strain throughout the
monitoring period. The lack of strain increase in VWSG number 1 may be
due to the fact that at 3.5m depth into the pillar there was stability and this
location did not experience any appreciable deformation. However, VWSG
number 2 anchored at 2.5m depth and therefore closer to the surface of
the pillar shows an increase in strain between July 2007 and August 2007
when the MPBX, SPBX and the GMM also start showing an increase in
displacement. The increase in strain between July and August resulted
from the increase in mining induced stresses as the mining of benches
close to the monitoring site commenced.
Figure 3.21 South Deep Mine Pillar B laser targets displacement
results

66
Pillar D results shown in Figure 3.22 indicate lower displacement results
compared to the displacement results obtained from laser monitoring of
the pillar shown in Figure 3.23. The laser targets show displacements
above 70mm whereas the SPBX, MPBX and the GMM results show
displacements less than 8mm.The difference is likely to have been caused
by the smaller pillar C onto which the laser distometer was mounted, with
the laser beam directed at the laser targets placed on the larger pillar D.
Therefore the displacement results may represent the relative closure of
both pillar D and pillar C.
Figure 3.22 South Deep Mine Pillar D displacement results

67
Figure 3.23 South Deep Mine Pillar D laser targets displacement
results
The displacement results obtained for pillar E are shown in Figure 3.24.
The displacement results show that the pillar experienced the least
deformation as the MPBX and the GMM recorded less than 2mm change
in displacement. The GMM results in Figure 3.24 show a sudden increase
in displacement of about 1.4mm in March 2008. The sudden increase may
be attributed to the mining of a tunnel situated about 10m from pillar E.
Pillar E instruments recorded the lowest displacement results because
pillar E was the largest pillar of those monitored and the instruments were
located in the concave section of the pillar which may be more resistant to
displacement.

68
Figure 3.24 South Deep Mine MPBX and GMM monitoring results for
Pillar E
Borehole monitoring results at South Deep Mine are shown in Figure 3.25.
The condition of the rock was classified into three distinct zones, namely,
zone 1 consisting of crushed material; zone 2 which comprised of
fractured material and zone 3 consisting of intact rock.
Figure 3.25 shows that in pillar A, crushed rock (zone 1 category) was to a
depth of 0.9m. Fractured rock falling in zone 2 was between 0.9 and 2.2m
in the borehole and beyond 2.2m the rock was intact.
Pillar D borehole monitoring results in Figure 3.25 show crushed rock to a
depth of 0.3m and fractured rock between 0.3m and 1.4m depths. Beyond
1.4m depth, the borehole showed intact rock.
Pillar E borehole monitoring results in Figure 3.25 show that crushed rock
was noticed to a depth of 0.1m. Fractured rock was noticed between 0.2m
and 0.9m. Beyond 0.9m, the rock was intact.

69
Pillar A had a larger proportion of crushed and fractured rock due to its
smaller size relative to pillar D and pillar E. Therefore it experienced higher
average pillar stresses than pillar D and pillar E. Pillar E recorded the least
fracturing since the borehole was located in a more stable concave section
of the pillar which experienced less deformation due to mining induced
stresses.
Figure 3.25 Fracture zones identified at South Deep Mine site from
borehole inspection (SRK, SIMRAC Internal report,
2008).

70
3.5.2 Discussion of the monitoring results at South Deep Mine
The displacement results for pillars A, B, D and E show that most
instruments recorded a sudden jump between the months of July and
August 2007 as the mining of the benches close to the monitoring site
commenced. It was also noted that between July and August 2007
shotcrete cracks started forming on pillars B and D. Pillar B instruments
recorded the greatest displacement at the South Deep Mine site and this
could be due to its smaller size compared to the other pillars and its
location closer to the benches that were mined.
When mining of the benches close to the monitoring site started between
July and August 2007, various failure modes of the shotcrete were
identified and they are presented and discussed in section 3.6.
Borehole monitoring results show that pillar E experienced the least
deformation compared to pillar A and pillar D. Monitoring results also
showed that pillar E experienced the least displacement amongst the other
pillars at South Deep Mine site. However, pillar A borehole, which showed
the greatest damage of the rock, showed little cracking in the shotcrete at
the end of the monitoring exercise. This could be an indication that the
shotcrete was able to hold back the fractured rock thereby maintaining the
strength of the pillar. Alternatively, the rock was fractured and therefore
destressed before the application of the shotcrete. Therefore shotcrete
was not subjected to stresses as the pillar deformed.
Amongst the pillars that were monitored, Pillar B experienced the greatest
damage due to mining induced stresses compared to the other pillars.
Firstly, pillar B was the smallest of all the pillars which is likely to have
caused it to have higher average pillar stresses compared to the other
pillars. Therefore the high average pillar stress contributed to the damage
of the pillar as the mining of benches close to the site was being carried
out.

71
The vibrating wire strain gauges were placed at different depths in the
pillars to measure strain changes in the pillars. However, they did not
show significant changes in strain except for the period between July 2007
and August 2007 when there was a slight increase recorded by some of
the gauges. The slight increase was a result of the mining of benches
close to the test site. Probably, the pillar experienced greater deformation
at the periphery as compared to the centre of the pillar resulting in low
strain values being recorded by the vibrating wire strain gauges at 1.5m,
2.5m and 3.5m depths.
3.5.3 South Deep Laboratory and field test results
Table 3.3 shows the bulk density, fibre density and the uniaxial
compressive strength results of the shotcrete used at South Deep Mine.
The steel fibre density in the shotcrete varies between 19 – 23 kg/m3. The
applied steel fibre density during spraying was 30 kg/m3, therefore
spraying fibre losses experienced in the shotcrete range between 23 –
37%.
The shotcrete applied to the pillars had a designed uniaxial compressive
strength (UCS) of 30MPa. The results in Table 3.3 show that the shotcrete
sprayed at South Deep Mine, after 1 year of curing had UCS results
ranging from 30 – 45 MPa, showing an increase in UCS of up to 50%
greater than the design value. UCS tests on plain shotcrete would have
indicated the effect of fibre addition in the shotcrete. However, no tests on
plain shotcrete were carried out. The panel from which the cores were
drilled was stored on surface in shade which may have played a role in
preserving the compressive strength of the shotcrete.
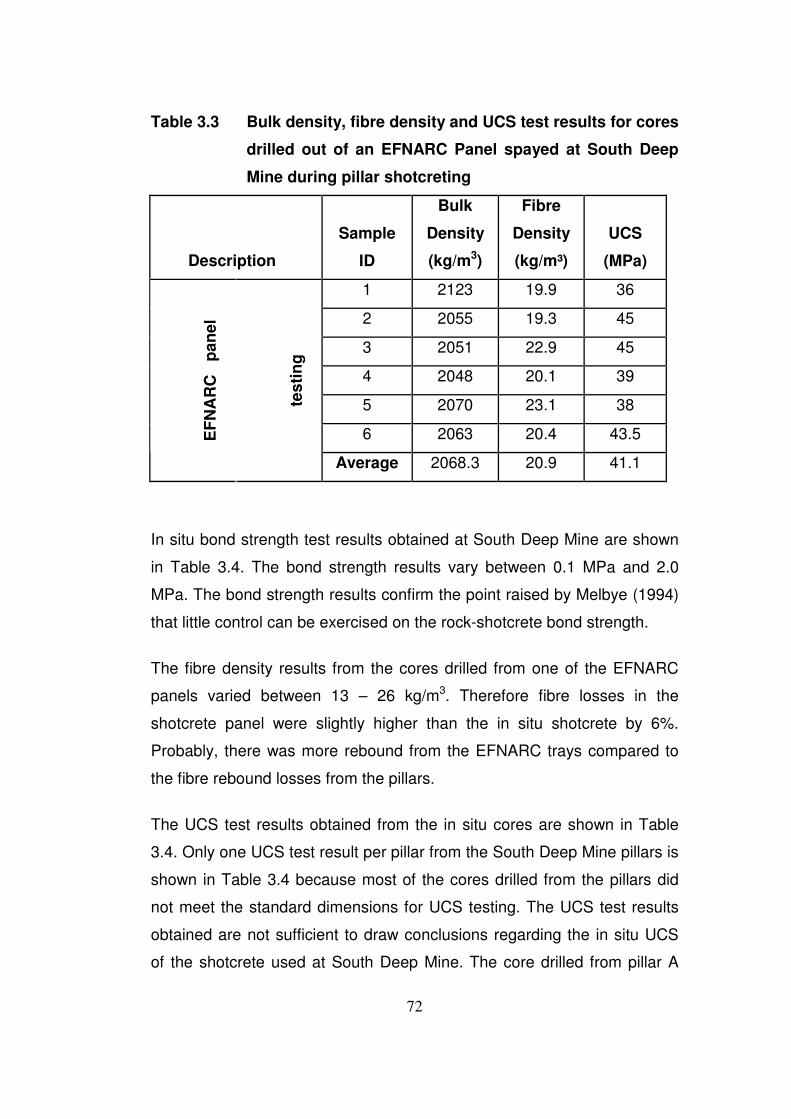
72
Table 3.3 Bulk density, fibre density and UCS test results for cores
drilled out of an EFNARC Panel spayed at South Deep
Mine during pillar shotcreting
Description
Sample
ID
Bulk
Density
(kg/m3)
Fibre
Density
(kg/m³)
UCS
(MPa)
1 2123 19.9 36
2 2055 19.3 45
3 2051 22.9 45
4 2048 20.1 39
5 2070 23.1 38
6 2063 20.4 43.5 EF
NA
RC
p
an
el
tes
tin
g
Average 2068.3 20.9 41.1
In situ bond strength test results obtained at South Deep Mine are shown
in Table 3.4. The bond strength results vary between 0.1 MPa and 2.0
MPa. The bond strength results confirm the point raised by Melbye (1994)
that little control can be exercised on the rock-shotcrete bond strength.
The fibre density results from the cores drilled from one of the EFNARC
panels varied between 13 – 26 kg/m3. Therefore fibre losses in the
shotcrete panel were slightly higher than the in situ shotcrete by 6%.
Probably, there was more rebound from the EFNARC trays compared to
the fibre rebound losses from the pillars.
The UCS test results obtained from the in situ cores are shown in Table
3.4. Only one UCS test result per pillar from the South Deep Mine pillars is
shown in Table 3.4 because most of the cores drilled from the pillars did
not meet the standard dimensions for UCS testing. The UCS test results
obtained are not sufficient to draw conclusions regarding the in situ UCS
of the shotcrete used at South Deep Mine. The core drilled from pillar A
73
had a UCS of 30 MPa, the core drilled from pillar D had a UCS of 46 MPa
and the core drilled from pillar E had a UCS of 25 MPa. More samples are
required for better UCS interpretation of the shotcrete in situ. However, the
UCS results from the cores drilled from one of the EFNARC panels
sprayed at the time of shotcreting the pillars averaged 41 MPa which is
higher than the design compressive strength of 30 MPa.
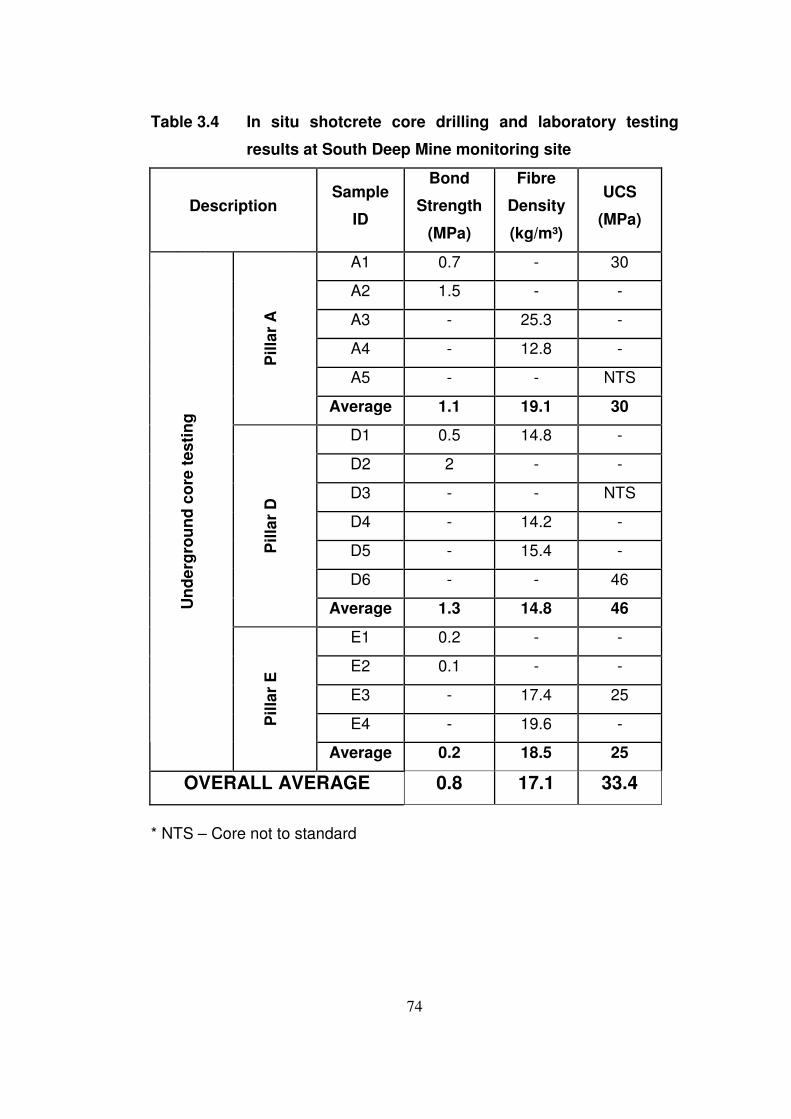
74
Table 3.4 In situ shotcrete core drilling and laboratory testing
results at South Deep Mine monitoring site
Description Sample
ID
Bond
Strength
(MPa)
Fibre
Density
(kg/m³)
UCS
(MPa)
A1 0.7 - 30
A2 1.5 - -
A3 - 25.3 -
A4 - 12.8 -
A5 - - NTS
Pil
lar
A
Average 1.1 19.1 30
D1 0.5 14.8 -
D2 2 - -
D3 - - NTS
D4 - 14.2 -
D5 - 15.4 -
D6 - - 46
Pil
lar
D
Average 1.3 14.8 46
E1 0.2 - -
E2 0.1 - -
E3 - 17.4 25
E4 - 19.6 -
Un
de
rg
ro
un
d c
ore
tes
tin
g
Pil
lar
E
Average 0.2 18.5 25
OVERALL AVERAGE 0.8 17.1 33.4
* NTS – Core not to standard

75
3.5.4 Impala Platinum Mine Monitoring Results
The ground motion monitor (GMM) displacement and the vibrating wire
strain gauge (VWSG) monitoring results for Impala Platinum Mine are
shown in Figures 3.26 and 3.27 respectively.
Figure 3.26 showing results for GMM1 and GMM2 indicate a gradual
increase in displacement results over time. However, both GMMs show
displacement results that are less than 1mm in total. Mining of the stope
above was abandoned after bad ground conditions were encountered and
the anticipated stress changes did not occur in the tunnel that was being
monitored. As a result, minimal displacement results were recorded.
The vibrating wire strain gauges (VWSG) at Impala Platinum Mine were
installed at a depth of 3.5m in the borehole, with gauge 1 oriented
horizontally, gauge 2 oriented at 45˚ to the horizontal and gauge 3 oriented
vertically. The strain gauges were used to measure strain changes in the
rock and not in the shotcrete. Figure 3.27 shows the VWSG results
obtained from Impala Platinum Mine monitoring site. As found for the
VWSG results described previously, the results in Figure 3.27 show a
sudden jump in strain a month after installation of the strain gauges,
probably caused by the curing of the cement grout used in the installation
of the strain gauges in the boreholes. However, further monitoring shows
no further increases in strain in the rock behind the shotcrete. The
expected stress changes due to mining were not experienced because the
planned mining of a stope above the tunnel being monitored stopped
several metres away from the tunnel. Therefore due to lack of mining
induced stress changes around the tunnel, no significant strain changes
would be expected, and none were recorded by the vibrating wire strain
gauges. Also, no signs of shotcrete cracking were observed throughout
the monitoring period.
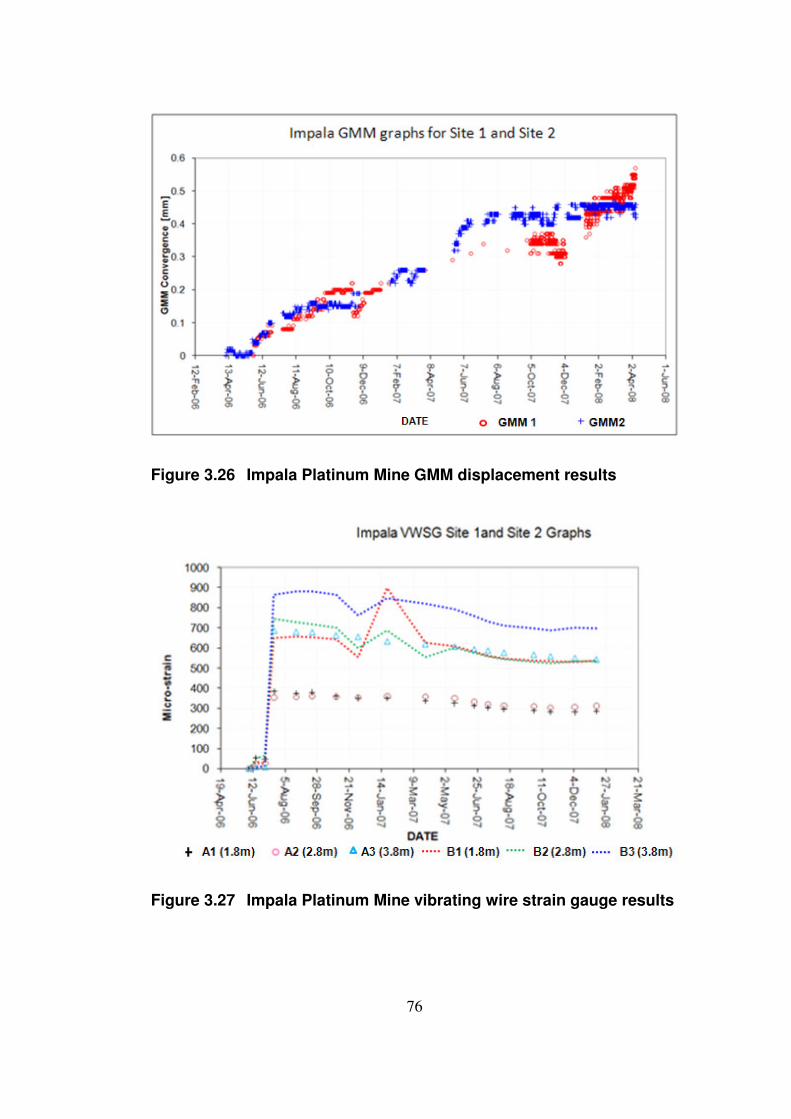
76
Figure 3.26 Impala Platinum Mine GMM displacement results
Figure 3.27 Impala Platinum Mine vibrating wire strain gauge results

77
3.5.5 Mponeng Mine Level 109 monitoring results
Displacement monitoring results for Mponeng Mine Level 109 are shown
in Figure 3.28 for the North-West wall and in Figure 3.29 for the South
East Wall. The displacement results in these figures display an almost
linear trend in displacement with time for both the North-West wall and the
opposite South-East wall. Both graphs in Figure 3.28 and Figure 3.29
show that the laser targets in the middle row experienced the greatest
displacement compared to the top row and the bottom row laser targets.
When the tunnel is exposed to high compressive stresses, the middle
section is likely to deform more than the bottom corner or top corner of the
tunnel sidewall. The monitoring results therefore conform to the expected
behaviour. The top row laser targets and the bottom row laser targets
experienced almost similar displacements for both sides of the tunnel.
Very little cracking of the shotcrete was observed throughout the
monitoring period as there were no mining induced stress changes. The
tunnel was in a destressed state since mining of the stope above had
progressed past the tunnel when shotcreting was done and monitoring
started.

78
Figure 3.28 Mponeng Mine Level 109 North-West wall displacement
results
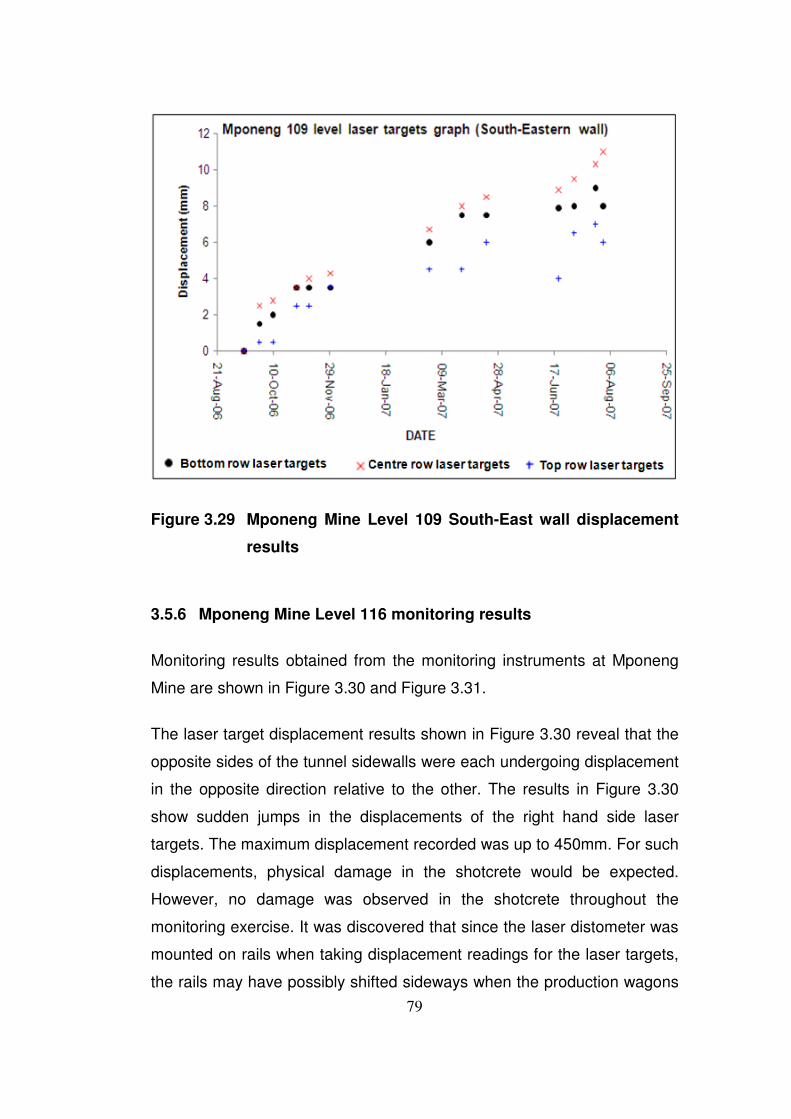
79
Figure 3.29 Mponeng Mine Level 109 South-East wall displacement
results
3.5.6 Mponeng Mine Level 116 monitoring results
Monitoring results obtained from the monitoring instruments at Mponeng
Mine are shown in Figure 3.30 and Figure 3.31.
The laser target displacement results shown in Figure 3.30 reveal that the
opposite sides of the tunnel sidewalls were each undergoing displacement
in the opposite direction relative to the other. The results in Figure 3.30
show sudden jumps in the displacements of the right hand side laser
targets. The maximum displacement recorded was up to 450mm. For such
displacements, physical damage in the shotcrete would be expected.
However, no damage was observed in the shotcrete throughout the
monitoring exercise. It was discovered that since the laser distometer was
mounted on rails when taking displacement readings for the laser targets,
the rails may have possibly shifted sideways when the production wagons

80
pass through the monitoring site during the ore handling shifts. Therefore
the results obtained do not reflect the true sidewall movement but rather,
the sideways movement of rails. Also, after the first jump, the laser targets
displacements are almost constant. This is probably due to the fact that
the rock was in a destressed state when the shotcrete was applied and no
significant displacement occurred in the tunnel sidewalls. This is confirmed
by the two ground motion monitor (GMM) results that show very small
displacements. These reflect the true displacement of the tunnel sidewalls,
as there was no physical damage noted on the shotcrete.
There was no major mining of the areas surrounding Mponeng Mine Level
116 monitoring site. Therefore there were no major stress changes
anticipated around the tunnel. Rather, Mponeng Mine Level 116
monitoring site was located in a seismically active section and the reason
for the location was to observe the changes in the behaviour of the
shotcrete after a seismic event. However, there were no remarkable
seismic events recorded during the monitoring exercise and the shotcrete
was in good condition at the end of the monitoring exercise.
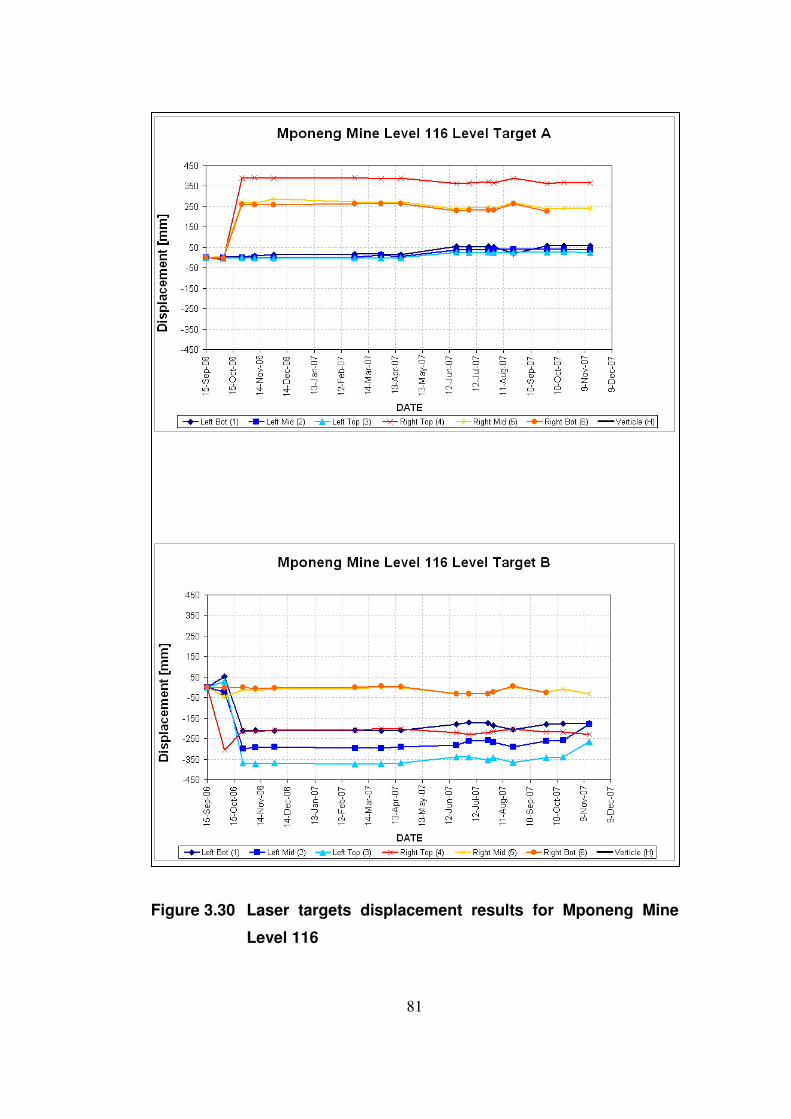
81
Figure 3.30 Laser targets displacement results for Mponeng Mine
Level 116

82
Figure 3.31 GMM displacement results for Mponeng Mine Level 116
3.6 Shotcrete Failure Mechanisms
Shotcrete failure mechanisms were observed mainly at the South Deep
Mine site which underwent the expected stress changes due to mining of
the surrounding benches. The dominant failure mode of the shotcrete
observed on most pillars was tensile failure.
3.6.1 Tensile failure
Figure 3.32 shows a shotcrete crack that runs from the bottom of the pillar
upwards. The crack is likely to have developed from pure tension in the
shotcrete since the shotcrete layer shows that it has been pulled apart
horizontally. Figure 3.32 shows an offset in the red line crossing the crack
which may imply shear failure of the shotcrete. However, the fibres sticking
out between the cracks were oriented perpendicular to the crack which
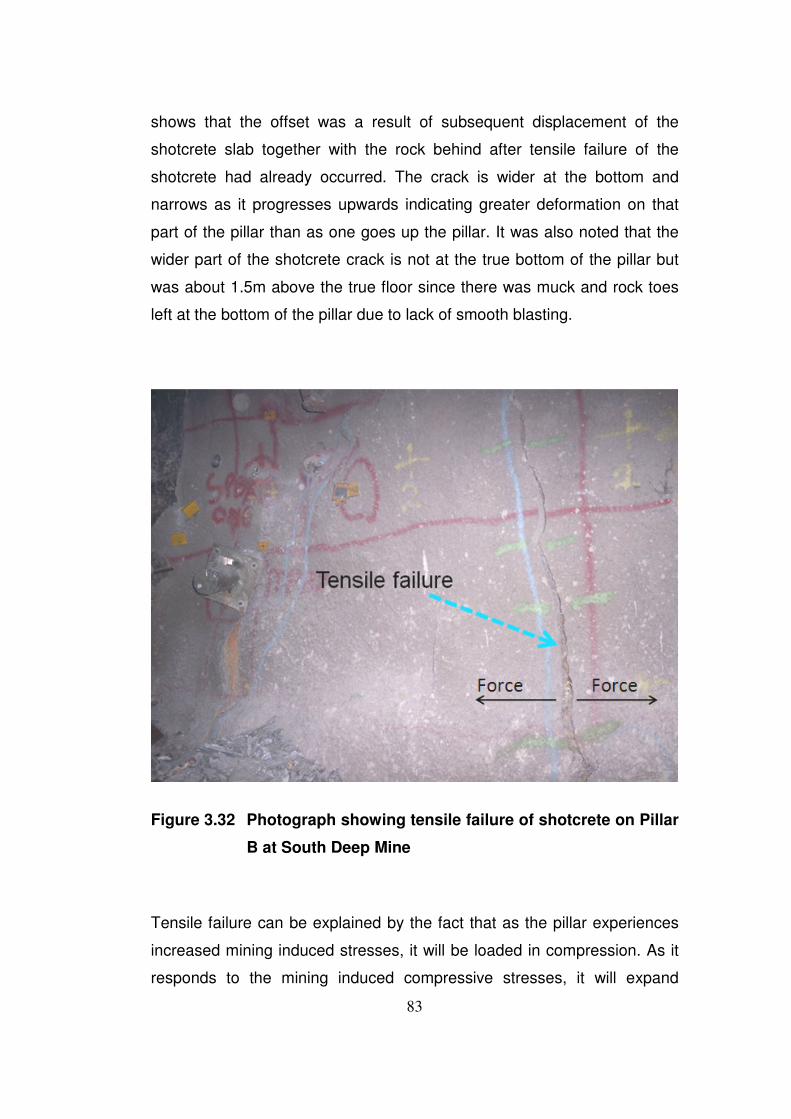
83
shows that the offset was a result of subsequent displacement of the
shotcrete slab together with the rock behind after tensile failure of the
shotcrete had already occurred. The crack is wider at the bottom and
narrows as it progresses upwards indicating greater deformation on that
part of the pillar than as one goes up the pillar. It was also noted that the
wider part of the shotcrete crack is not at the true bottom of the pillar but
was about 1.5m above the true floor since there was muck and rock toes
left at the bottom of the pillar due to lack of smooth blasting.
Figure 3.32 Photograph showing tensile failure of shotcrete on Pillar
B at South Deep Mine
Tensile failure can be explained by the fact that as the pillar experiences
increased mining induced stresses, it will be loaded in compression. As it
responds to the mining induced compressive stresses, it will expand

84
laterally outwards as indicated by the dashed lines in Figure 3.33. The
lateral expansion of the pillar stretches the outer skin of the pillar thereby
inducing a tensile stress in the shotcrete. The tension induced in the
shotcrete may have caused the tensile failure indicated in Figure 3.32. The
crack in Figure 3.32 is wider at the bottom because the shotcrete was not
applied on the lower part of the pillar but only from about 1.5m above the
actual floor.
Figure 3.33 Cross-section of a pillar with the solid line showing
original pillar profile and dashed line showing the pillar
profile after expansion due to increased mining induced
stresses.
3.6.2 Adhesion failure
Adhesion failure of the shotcrete-rock interface occurs when the shotcrete
separates from the rock as shown in Figure 3.34a and 3.34b. In both of
these figures, adhesion failure could have resulted from poor surface
preparation of the pillar prior to shotcreting. Alternatively, shrinkage
cracking of the shotcrete as the shotcrete cured may have resulted in the
weakening of the shotcrete-rock bond strength. Therefore the weak

85
adhesion strength on the shotcrete-rock interface resulted in shotcrete
adhesion failure.
Figure 3.34a Photograph showing adhesion failure of shotcrete on
Pillar E at South Deep Mine

86
Figure 3.34b Photograph showing adhesion failure between Pillar D
and Pillar E at South Deep Mine
3.6.3 Punching failure
Punching failure of shotcrete is illustrated in Figure 3.35. Punching failure
of the shotcrete is likely have resulted from localised squeezing of some
loosened rocks behind the shotcrete due to high stresses as the mining of
benches close to the monitoring site took place. In Figure 3.35, small
broken rocks behind the shotcrete can be observed showing that the
stresses were quite high in that portion of the pillar. However, this failure
mode was not common to most pillars.

87
Figure 3.35 Photograph showing punching failure of shotcrete on
Pillar D at South Deep Mine
3.6.4 Shear failure
Shear stresses in the rock can cause shear failure of the shotcrete as
illustrated in Figure 3.36. Shown in Figure 3.36 is a sub-vertical crack that
was observed on pillar B at South Deep Mine. The shotcrete crack is likely
to have been formed when a block of shotcrete labelled A moved out
relative to the block labelled B. The shotcrete crack can be seen
outcropping between the two blocks of shotcrete labelled A and B. Due to
the increase in mining induced stresses, the pillar may have deformed
resulting in rock blocks forming. One block of failed rock may have been
squeezed out, shearing through the shotcrete layer. The relative
movement of the shotcrete blocks A and B has been illustrated in Figure
3.37.
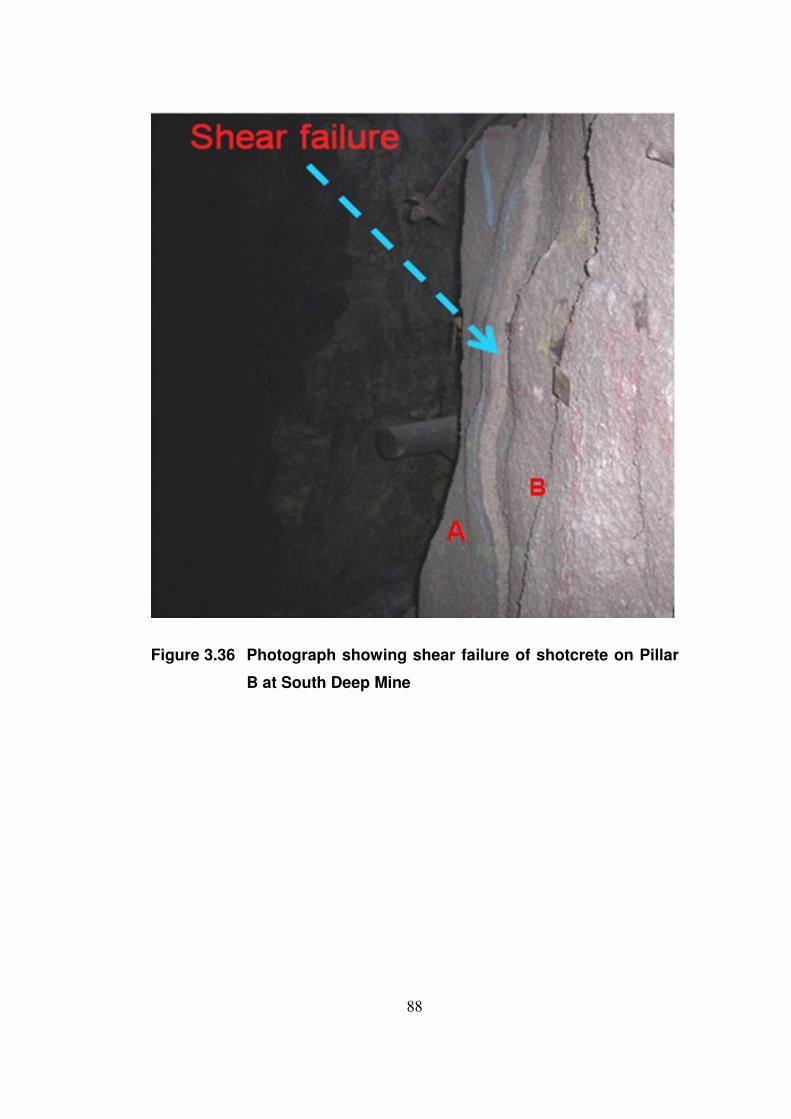
88
Figure 3.36 Photograph showing shear failure of shotcrete on Pillar
B at South Deep Mine

89
Figure 3.37 Relative displacement of shotcrete block A to shotcrete
block B resulting in shotcrete shear failure
3.6.5 Bending failure
Shotcrete failure due to bending is illustrated in Figure 3.38a. Figure 3.38b
shows a closer view of the bending failure. The failure of shotcrete in
bending may have occurred as the pillar became exposed to increased
mining induced stresses. Tensile failure of the shotcrete is likely to have
occurred first resulting in the crack marked A in Figure 3.38a. The
orientation of the fibres was found to be perpendicular to the crack as
illustrated in Figure 3.38b. The tensile failure may have been due to the
outward expansion of the pillar. Thereafter, broken rocks seen behind the
shotcrete are likely to have been squeezed out causing localised bending
of the shotcrete. The crack marked B in Figure 3.38a is likely to have been
caused by the localised bending of the shotcrete as the broken rocks were
squeezed out due to increasing mining induced stresses in the pillar. The
mining induced stresses increased due to the mining of benches close to
the monitoring site.

90
Figure 3.38a Photograph showing bending failure of shotcrete on
Pillar B at South Deep Mine

91
Figure 3.38b Photograph showing bending failure of shotcrete on
Pillar B at South Deep Mine
3.7 Conclusion
Monitoring of the shotcreted pillars and tunnels have enhanced the
understanding of the behaviour of shotcrete in situ as the pillars and
tunnels deformed due to mining induced stresses. The pillars at South
Deep Mine experienced the greatest mining induced stresses after the
mining of benches surrounding the monitoring site commenced. Various
modes of shotcrete failure were identified and possible causes for the
failure were discussed. However, the challenge remaining is that the
deformation of pillars is a slow process and therefore the actual

92
mechanism of shotcrete failure may be different from the observational
conclusions. However, the monitoring exercise provided a step in the
learning curve regarding the in situ behaviour of shotcrete. The next
chapter describes the laboratory tests carried out to determine the
influence of fibres on sprayed shotcrete as it supports the rock in mining
excavations.

93
CHAPTER 4
LABORATORY TESTS
4.1 Introduction
Chapter 3 has provided in situ monitoring results using various in situ
monitoring instruments. The previous chapter has also enabled the
identification of shotcrete failure mechanisms as the pillars and tunnels at
South Deep Mine site responded to mining induced stresses. The
monitoring exercise has provided invaluable information in identifying the
most likely failure modes of sprayed shotcrete in situ. This chapter
presents laboratory tests carried out to improve the understanding of
shotcrete behaviour due to fibre reinforcement. The laboratory testing of
sprayed shotcrete samples was done using the EFNARC standards and
the ASTM standards for panels and beams tested for their 28th day
strength. The chapter indicates the objectives of performing the laboratory
tests, test suitability and the test programme followed. A review of the
laboratory test methods was carried out. Results have been presented
graphically showing load deflection, energy absorption, toughness, peak
load, and residual strength trends. Also presented are the results for UCS
and fibre content analysis on cores drilled from surface sprayed EFNARC
panels.
4.2 Objectives of laboratory testing
Shotcrete laboratory tests were done to achieve the following objectives:
94
• To improve the understanding of the support capacity and mechanisms
of support by fibre reinforced shotcrete (FRS).
• To determine the effect of fibre addition on fibre reinforced shotcrete
performance.
4.3 Test suitability
The suitability of a test can be related to a number of issues (Bernard,
1999):
• A post crack test must produce results that are structurally relevant to
the intended application for the material. Relevance here should relate
to the shotcrete when it is sprayed underground.
• A toughness test must be based on specimens that are representative
of the shotcrete used in the finished structure. This will enable correct
evaluation of results for similar sprayed shotcrete underground.
• Results obtained from the test must be a reliable indication of the
material performance. This entails following the test procedures as well
as ensuring that all the specimens for a given test undergo similar
conditions up to the testing stage.
• A test must be economical. Economy is determined by cost of
procedure, production, transportation and reliability.
4.4 Test programme
The sprayed samples consisted of 40MPa shotcrete obtained from
Concrete Lining Products (CLP).
Sprayed samples included the following batches:

95
• Eight batches using polypropylene fibre with fibre densities of 1kg/m³
up to 8kg/m³ and
• Three batches using steel fibre having fibre densities of 40kg/m³, 55
kg/m³ and 70kg/m³.
Table 4.1 shows the spray set up per fibre density for the samples
sprayed. A total of 220 samples were tested from the eight batches of
polypropylene fibre reinforced shotcrete specimens and from the three
batches of steel fibre shotcrete specimens. All specimens were sprayed
and tested for 28 day strength.
Table 4.1 Test programme per fibre density batch
INDEX DIMENSIONS (mm)
Length Width Depth Diameter
Number
of
panels
Number of
samples
available
Number of
samples
tested
EFNARC
Panels
600 600 100 4 4 4
*EFNARC
Beams
600 125 75 4 3
RDPs 75 800 4 4 4
*ASTM
Beams
450 100 100 4 3
*UCS
Cores
100 100 3 3
*Fibre
density
cores
100 100 3 3
Total 22 20
*Beams, Uniaxial Compressive Strength (UCS) cores and fibre density
cores were cut or drilled out of the surface sprayed EFNARC Panels.
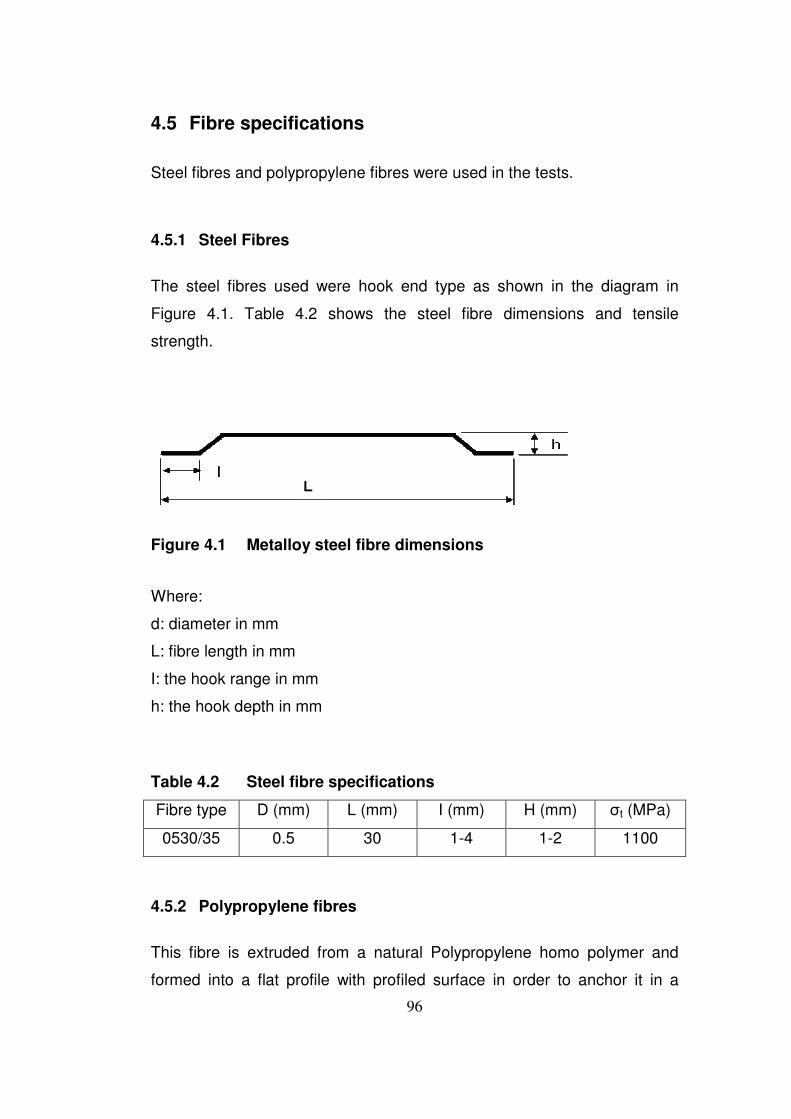
96
4.5 Fibre specifications
Steel fibres and polypropylene fibres were used in the tests.
4.5.1 Steel Fibres
The steel fibres used were hook end type as shown in the diagram in
Figure 4.1. Table 4.2 shows the steel fibre dimensions and tensile
strength.
Figure 4.1 Metalloy steel fibre dimensions
Where:
d: diameter in mm
L: fibre length in mm
I: the hook range in mm
h: the hook depth in mm
Table 4.2 Steel fibre specifications
Fibre type D (mm) L (mm) I (mm) H (mm) σt (MPa)
0530/35 0.5 30 1-4 1-2 1100
4.5.2 Polypropylene fibres
This fibre is extruded from a natural Polypropylene homo polymer and
formed into a flat profile with profiled surface in order to anchor it in a

97
cementitious matrix. The dimensions of the fibre are shown in Table 4.3
and Figure 4.2.
Table 4.3 Polypropylene fibre specifications
Length,
L (mm)
Width,
w (mm)
Thickness,
t (mm)
Elongation
at yield (%)
σt
(MPa)
E
(MPa)
50 1.8 0.13 24.4 100 1550
Figure 4.2 Polypropylene fibre dimensions
4.6 Control of consistency
Every attempt was made to produce specimens in a consistent manner
using the 40 MPa shotcrete.

98
All the samples were cured in curing tanks under controlled temperature
conditions at 20 +/- 2°C.
All the samples were tested to determine their strength on the 28th day
after spraying.
4.7 Determination of shotcrete performance
The standards used for the determination of fibre reinforced shotcrete
performance are summarised in Table 4.4.
Table 4.4 Summary of standard test methods for testing shotcrete
beams and panels
Specimens Standard test method
ASTM Beams ASTM C1018 (1997) EFNARC Beams EFNARC Specifications for beams (1996) EFNARC Panels EFNARC Specifications for panels (1996)
RDPs ASTM C 1550 (2005)
4.7.1 ASTM beams
Performance was measured in terms of:
a) Modulus of rupture (R): is defined as the maximum surface stress in a
bent beam at the instant of failure (first crack stress) and is given by the
following formula according the ASTM C1018 (1997) standard:
R = 3 P L / (2 b d²)

99
Where:
R = modulus of rupture (N/mm²)
b = average specimen width (mm)
P = peak load (N),
d = average specimen depth (mm) and
L = span length (mm)
(b) Toughness index: is defined as the ratio of the absorbed energy up to
a given deflection to the absorbed energy up to first crack deflection.
Toughness indices i.e. I5, I10, I20, I30 and I50 are calculated as specified in
the ASTM C1018 (1997) Standard where:
(i) Toughness index I5 is the number obtained by dividing the area under
the load-deflection curve up to at a deflection of 3.0 times the first-crack
deflection by the area up to first crack.
(ii) Toughness index I10 is the number obtained by dividing the area under
the load-deflection curve up to a deflection of 5.5 times the first-crack
deflection by the area up to first crack.
(iii) Toughness index I20 is the number obtained by dividing the area under
the load-deflection curve up to a deflection of 10.5 times the first-crack
deflection by the area up to first crack.
(iv) Toughness index I30 is the number obtained by dividing the area under
the load-deflection curve up to a deflection of 15.5 times the first-crack
deflection by the area up to first crack.
(iv) Toughness index I50 is the number obtained by dividing the area under
the load-deflection curve up to a deflection of 25.5 times the first-crack
deflection by the area up to first crack.

100
Figure 4.3 shows graphically how the toughness indices are estimated
under the ASTM load-deflection curve.
From Figure 4.3, the toughness indices are obtained by doing the
following calculations:
I5 = OACD/OAB,
I10 = OACEF/OAB
I20 = OACEGH/OAB
I30 = OACEGIJ/ OAB
I50 = OACEGIKL/OAB
Therefore toughness index is a dimensionless quantity. For the idealised
perfectly elasto-plastic material, the toughness indices have the following
values:
I5 = 5, I10 = 10, I20 = 20 and I30 = 30 and I50 = 50 (Papworth et al, 1996).
However, for steel fibre reinforced shotcrete, Morgan (1988) performed
several tests and based on the results obtained, suggested the following
ratings shown in Table 4.5.
Table 4.5 Suggested toughness indices (After Morgan, 1988)
Category Rating I10 I30
I Marginal <4 <12
II Fair 4 12
III Good 6 18
IV Excellent 8 24
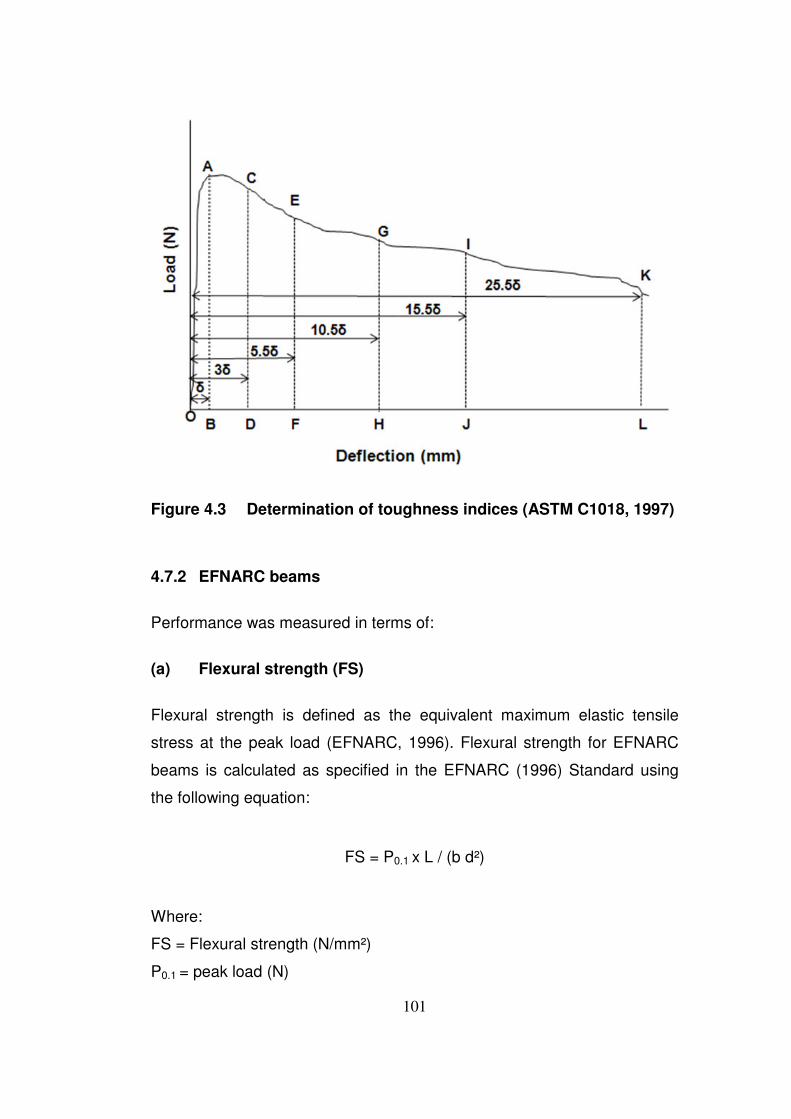
101
Figure 4.3 Determination of toughness indices (ASTM C1018, 1997)
4.7.2 EFNARC beams
Performance was measured in terms of:
(a) Flexural strength (FS)
Flexural strength is defined as the equivalent maximum elastic tensile
stress at the peak load (EFNARC, 1996). Flexural strength for EFNARC
beams is calculated as specified in the EFNARC (1996) Standard using
the following equation:
FS = P0.1 x L / (b d²)
Where:
FS = Flexural strength (N/mm²)
P0.1 = peak load (N)

102
L = span length (mm)
b = actual beam width
d = actual beam depth
(b) Residual strength: The residual flexural strength (RS) was
determined as specified in the EFNARC (1996) Standard at displacements
of 0.5mm, 1.0mm, 2.0mm and 4.0mm using the equation below:
RS = Px *L / (b d²)
Where:
Px = load at x =0.5; 1.0; 2.0; and 4.0mm respectively.
L = span length (mm)
b = actual beam width
d = actual beam depth
Figure 4.4 P values from the Load-Deflection graph for flexural and
residual strengths (EFNARC, 1996)

103
4.7.3 EFNARC Panels
Performance was measured in terms of:
(a) Peak loads and
(b) Energy absorption
4.7.4 ASTM centrally loaded Round determinate Panels
Performance was measured in terms of:
(a) Peak loads and
(b) Energy absorption
4.7.5 Uniaxial Compressive Strength (UCS) tests
UCS testing cores were drilled out of EFNARC Panels. The cores had a
diameter and a length of 100mm, giving a diameter to length ratio of 1.
4.7.6 Spraying losses of steel fibres
Fibre losses were only determined for steel fibres as the laboratory used
did not have the capacity to determine the polypropylene fibre losses for
polypropylene fibre reinforced shotcrete specimens.
4.8 Presentation and discussion of results
The results obtained from all the tests have been presented graphically in
the form of load-deflection and energy absorption-deflection curves as
shown in Appendix A. Also, the results for the performance parameters of

104
beams and panels have been summarised and tabulated in Appendix B.
The following sub-sections present a discussion of the test results for all
the fibre reinforced shotcrete tests for beams and panels.
4.8.1 ASTM beams modulus of rupture
The modulus of rupture results in Figure 4.5 and Figure 4.6 show that fibre
incorporation has little effect on the modulus of rupture of the ASTM
beams. The modulus of rupture for most of the polypropylene fibre
reinforced shotcrete and steel fibre reinforced shotcrete ranges between 7
and 10MPa. However, the 2kg/m3 polypropylene fibre reinforced shotcrete
had a modulus of rupture less than 5MPa. This anomalous lower value
could be a factor of cracking in the beam before testing. The 55kg/m3 for
the steel fibre reinforced shotcrete specimens show a lower value
compared to the 40Kg/m3 with a lower density. The lower modulus of
rupture for the 55kg/m3 may be attributed to pump problems experienced
during the spraying of the 55kg/m3 fibre reinforced shotcrete specimens.

105
Figure 4.5 Modulus of rupture for the polypropylene fibre
reinforced shotcrete ASTM beams
Figure 4.6 Modulus of rupture for the steel fibre reinforced ASTM
shotcrete beams

106
4.8.2 ASTM beams toughness indices
The general trend of the toughness indices shown in Figure 4.7 and Figure
4.8 is that the toughness index value increases as the deflection increases
from 3δ to 25.5δ (δ = deflection at first crack) per fibre density, for both
steel and polypropylene fibre reinforced shotcrete ASTM beams. However,
Figure 4.7 and Figure 4.8 show that I5 and I10 toughness values do not
increase significantly as the fibre density in shotcrete increases. Probably,
this is because I5 and I10 values are calculated at very low deflections
when the fibres in the shotcrete are less effective. Also, this could be a
result of the scatter in the load-deflection results (shown in Appendix A),
reflecting lack of repeatability of the test method in giving consistent
results; or the challenge in determining the first crack, which greatly
influences the toughness value calculation when using the ASTM standard
test method.
I20 to I50 toughness values for steel fibre reinforced shotcrete specimens
are higher than those of polypropylene fibre reinforced shotcrete
specimens. The higher toughness values for the steel fibre reinforced
shotcrete specimens is likely to be due to the higher tensile strength of
steel fibres which is about 1100MPa compared to the 100MPa of
polypropylene fibres, as indicated in Table 4.2 and Table 4.3 in section
4.52 and section 4.53 respectively.

107
Figure 4.7 Toughness indices for the polypropylene fibre
reinforced shotcrete ASTM beams
Figure 4.8 Toughness indices for the steel fibre reinforced
shotcrete ASTM beams

108
4.8.3 EFNARC beams flexural strength
Flexural strength gives an indication of the resistance to bending. The
flexural strength results obtained are shown in Figure 4.9 and Figure 4.10.
The polypropylene fibre reinforced shotcrete specimens with densities
ranging from 1kg/m3 to 5kg/m3 have been omitted from the discussion
since they were mistakenly tested on a span length of 300mm instead of
the standard 450mm for the EFNARC beams. Only the 6kg/m3 to 8kg/m3
polypropylene fibre reinforced shotcrete specimens and the steel fibre
reinforced shotcrete specimens, which were tested on the correct span
length of 450mm, have been incorporated in this discussion.
Figure 4.9 and Figure 4.10 show that steel fibre reinforced shotcrete has
slightly higher flexural strength than polypropylene fibre reinforced
shotcrete. The higher flexural strength for the steel fibre reinforced
shotcrete may be attributed to the superior tensile strength of steel fibres
compared to that of polypropylene fibres, as shown in Table 4.2 and Table
4.3. Also, steel fibres have a much higher modulus of elasticity of about
200GPa compared to the 1.6GPa of the polypropylene fibres used in the
experiment. However, the density of fibres, whether steel or
polypropylene, has a negligible effect on the shotcrete flexural strength.
This is due to the fact that the flexural strength is estimated using the peak
loads at very low deflections when the shotcrete matrix itself has more
influence than the fibres incorporated in the shotcrete. The fibres become
more “engaged” after the shotcrete experiences the first crack.

109
Figure 4.9 Flexural strength for the polypropylene fibre reinforced
EFNARC beams
Figure 4.10 Flexural strength for the steel fibre reinforced shotcrete
EFNARC beams

110
4.8.4 EFNARC Beams residual strength
The residual strength gives an indication of the post peak performance of
the fibre reinforced shotcrete. Figure 4.11 and Figure 4.12 show the
residual strength results obtained for both steel and polypropylene fibre
reinforced shotcrete EFNARC beams. The polypropylene fibre reinforced
shotcrete beams which were tested on a shorter span length of 300mm
rather than the standard 450mm have been omitted from this discussion
for consistency purposes when using the standard test method.
Figure 4.11 and Figure 4.12 show that the steel fibre reinforced beams
have a higher residual strength than the polypropylene fibre reinforced
beams. The higher residual strength of steel fibre reinforced shotcrete
beams may also be attributed to the higher tensile strength of steel fibres,
which is about 1100MPa compared to that of polypropylene fibres of about
100MPa.
The polypropylene fibre reinforced shotcrete beams in Figure 4.11 display
effectively a constant residual strength as the deflection increases from
0.5mm to 4.0mm per fibre density. This may be attributed to their ability to
elongate about 24%, which result in an almost constant load capacity as
deflection increases (Appendix A).
The residual strengths for steel fibre reinforced beams shown in Figure
4.12 display a much clearer linear trend which shows, as could be
expected, an increase in residual strength as the fibre density increases.
The magnitude of the residual strength decreases as the deflection
increases from 0.5mm to 4.0mm per fibre density. Probably, it was due to
the steel fibres yielding, pulling out of the shotcrete, or breaking as the
deflection increases thereby causing the beam capacity to decrease.

111
Figure 4.11 Residual strength for the polypropylene fibre reinforced
shotcrete EFNARC beams
Figure 4.12 Residual strength for the steel fibre reinforced shotcrete
EFNARC beams

112
4.8.5 EFNARC panels peak load results
The EFNARC panels peak load capacity results are shown in Figure 4.13
and Figure 4.14. The polypropylene fibre reinforced shotcrete panels peak
loads range from 35 kN to 71 kN whereas those of steel fibre reinforced
shotcrete panels range from 75 kN to about 100 kN. The higher tensile
strength and much greater modulus of elasticity of the steel fibres
compared with the polypropylene fibres again probably contributed to the
higher peak strength of the steel fibre reinforced shotcrete panels.
The irregularity in the shape of the graph in Figure 4.13 may be attributed
to a number of reasons. Firstly, the testing laboratory did not have the
capacity to measure the true fibre content of the polypropylene specimens.
Figure 4.13 reflects the fibre densities specified in the mix rather than the
measured. It is possible that during the spraying process, the percentage
of fibre losses may have been inconsistent resulting in lower actual fibre
densities in some specimens than in others. Further explanations may
include differences in panel thicknesses, as it is impossible to produce
perfect standard sizes when cutting the specimens; hair line cracks formed
during curing that were noticed in some of the specimens may have also
contributed to the irregularity in the trend in Figure 4.13; lastly, some of the
specimens could not be placed perfectly flat on the testing machine stand
due to the slightly irregular shape produced from the cutting process.
Although there are only three results, the steel fibre reinforced shotcrete
EFNARC panels in Figure 4.14 show the expected linear trend as the
peak load capacity increases with the increase in fibre density.

113
Figure 4.13 Peak loads for the polypropylene fibre reinforced
shotcrete EFNARC panels
Figure 4.14 Peak loads for the steel fibre reinforced shotcrete
EFNARC panels

114
4.8.6 EFNARC panels energy absorption
The energy absorption results for the EFNARC panels are shown in Figure
4.15 for the polypropylene fibre reinforced shotcrete panels and in Figure
4.16 for the steel fibre reinforced shotcrete panels. Generally, both steel
and polypropylene fibre reinforced shotcrete specimens show a linear
variation as the energy absorption increases due to an increase in fibre
content. Therefore the more the fibres added to the shotcrete, the greater
the energy absorption capability of the fibre reinforced shotcrete.
Energy absorption results in Figure 4.15 show that the 5kg/m3 density and
the 7kg/m3 show some irregularity in the shape of the graph. As explained
above, no actual fibre density measurements were done for the
polypropylene fibre reinforced panels, and inconsistent fibre contents may
have been a cause of the irregularity. Also, the shapes of the load
deflection graphs for the 7kg/m3 polypropylene fibre reinforced shotcrete
specimens in Appendix A display clearer single peak loads except for only
one of the specimens compared to other specimens. The flatness of the
7kg/m3 panels is likely to have influenced the shape of the load deflection
graphs and the energy absorption graphs in Appendix A, relative to the
other specimens.

115
Figure 4.15 Energy absorption for the polypropylene fibre reinforced
shotcrete EFNARC panels
Figure 4.16 Energy absorption for the steel fibre reinforced
shotcrete EFNARC panels

116
4.8.7 ASTM Round determinate panels peak loads
The peak load results for the Round Determinate Panels (RDPs) are
shown in Figure 4.17 and Figure 4.18. Figure 4.17, showing the
polypropylene fibre reinforced shotcrete panels peak loads, displays a
downward trend in the peak loads graph as the fibre content increases
from 1 kg/m3 to 8 kg/m3. The downward trend may be attributed to the
irregularities in the shapes and measured thicknesses of the panels
causing a reduction in the peak load capacity as the specified fibre density
in the shotcrete mix increases. The expected trend would have been a flat
graph since the peak load is reached at low deflections when the fibres
are not “engaged”. Since the fibres are not engaged at low deflections, the
peak load capacity of the shotcrete is largely dependent on the shotcrete
matrix strength as mentioned by Stacey (2004).
Figure 4.17 Peak loads for the polypropylene fibre reinforced
shotcrete round determinate panels

117
Figure 4.18 Peak loads for the steel fibre reinforced shotcrete round
determinate panels
4.8.8 ASTM Round Determinate Panels (RDPs) Energy Absorption
The average energy absorption results for the RDPs are shown in Figure
4.19 and Figure 4.20 for the polypropylene and the steel fibre reinforced
shotcrete panels. Results for both the steel and polypropylene round
determinate shotcrete panels show a positive linear trend. Since energy
absorption has an effect on the residual carrying capacity of shotcrete, it
has been found worthwhile to present the average RDP load-deflection
results for both the polypropylene and steel fibre reinforced shotcrete
specimens as shown in Figure 4.21 and Figure 4.22. Of major interest is
the shape of the graphs post the peak load.

118
Figure 4.19 Energy absorption for the polypropylene fibre reinforced
round determinate panels
Figure 4.20 Energy absorption results for the steel fibre reinforced
round determinate panels

119
Figure 4.21 shows that after the peak load, there is a sharp drop in the
load-deflection graphs to the point when crack arrest by the polypropylene
fibres comes into effect. After the sharp drop, the load deflection graphs
display an almost flat trend in the residual load capacities which drop
slightly as deflection increases to 40mm deflection. The ability of
polypropylene fibres to elongate to about 24% their original length may
have enabled them to maintain this residual load capacity with increase in
deflection.
The steel fibre reinforced RDP shotcrete panels in Figure 4.22 display a
gradual decrease in the load capacity, after reaching the peak load as the
deflection increases. The trend displayed by the steel fibre reinforced
shotcrete RDPs could be attributed to the tensile properties of the steel
fibres in the shotcrete which influence the load-deflection behaviour in the
shotcrete.
Figure 4.21 Load-deflection results for the polypropylene fibre
reinforced shotcrete round determinate shotcrete panels

120
Figure 4.22 Load-deflection results for the steel fibre reinforced
shotcrete round determinate shotcrete panels
4.8.9 Uniaxial compressive strength
The uniaxial compressive strength (UCS) test results are presented in
Figure 4.23 and Figure 4.24 for the polypropylene and steel fibre
reinforced shotcrete specimens respectively.
Figure 4.23 shows that the UCS of the steel fibre reinforced shotcrete
specimens ranges between 50 MPa and 65 MPa. From Figure 4.23, the
density of steel fibre has a negligible effect on the UCS of shotcrete.
During the spraying of 55 kg/m3 steel fibre density shotcrete, clogging
problems were encountered due to pump failure. These clogging problems
encountered appear to have slightly affected the UCS of one of the
55kg/m3 steel fibre density shotcrete specimens.
From Figure 4.24, the UCS results for polypropylene fibre reinforced
shotcrete specimens range between 40 MPa and 60 MPa. The increase in

121
polypropylene fibre density has a negligible effect on UCS as displayed in
Figure 4.24.
The UCS results show that steel fibre reinforced shotcrete specimens
have a slightly higher UCS compared to the polypropylene fibre reinforced
shotcrete specimens.
These UCS results may not be comparable to the UCS results obtained
from field tests shown in Table 3.3 and Table 3.4 in section 3.53, because
the latter were tested at different ages – a year after curing for the field
specimens, while the specimens in this chapter were tested on the 28th
day after spraying. The age factor may play a major role in the
performance capacity of the shotcrete specimens.
Figure 4.23 Uniaxial compressive strength test results for the steel
fibre reinforced shotcrete cores

122
Figure 4.24 Uniaxial compressive strength test results for the
polypropylene fibre reinforced shotcrete cores
4.8.10 Steel fibre spraying losses
The determination of the actual density of fibres in the final shotcrete
product was carried out to give an estimate of the fibre rebound losses
due to spraying. Due to the limitation in fibre determination by the testing
laboratory used in the laboratory tests, only the steel fibre densities were
determined for the final fibre reinforced shotcrete product and the results
are shown in Figure 4.25. The measured results showed variation
between 15 % and 30 % fibre rebound losses for the 40kg/m3 and the
70kg/m3 shotcrete specimens (see Figure 4.25). The average fibre
rebound loss for the 40kg/m3 and the 70kg/m3 shotcrete specimens was
22%. Clogging problems caused by pump failure while spraying the
55kg/m3 specimens are likely to be the cause for their increased fibre
losses which ranges between 20 – 45%. However, the steel fibre rebound
losses for the 40kg/m3 and the 70kg/m3 densities in the laboratory tests
are higher than those reported by Banthia et al (1994), which were

123
indicated to range between 12 – 18%. The difference in fibre losses may
be due to the difference in operator skills or differences in the efficiencies
of the mixing and spraying equipment used.
Figure 4.25 Steel fibre spraying rebound loss results for the steel
fibre reinforced shotcrete specimens
Fibre spraying losses for the specimens obtained from the field in section
3.53 have been summarised in Table 4.6 together with the fibre losses for
the surface sprayed shotcrete specimens reported in this section. Table
4.6 shows that the average fibre losses for the cores drilled from pillars are
higher than those of cores drilled from the EFNARC panel sprayed in the
field and the EFNARC panels sprayed on surface. The higher fibre losses
for the cores drilled from field pillars may be due to the fact that the
EFNARC tray sides may have slightly influenced the lower fibre losses
during spraying in the EFNARC trays compared to spraying on the rock.
The maximum and minimum fibre losses help in indicating the range of
fibre losses for each set of specimens tested. The cores drilled from the

124
pillars have the highest range of 23% which may be a good indication of
poor distribution of the actual fibres in the sprayed shotcrete due to
spraying losses.
Table 4.6 Fibre content losses for shotcrete specimens sprayed
underground and on surface
Fibre losses
(%)
Maximum Minimum Average
Cores drilled from a field sprayed EFNARC panel 36 23 30 Cores drilled from pillars in the field 59 16 48 Cores drilled from a surface sprayed EFNARC panel 44 16 26
4.9 Comments on laboratory testing results
The post peak load behaviour of shotcrete was displayed through
toughness for the ASTM beams, residual strength for the EFNARC beams
and energy absorption for RDPs and EFNARC panels.
The Round Determinate Panels (RDP) displayed less scattered load-
deflection results compared to the EFNARC panels. Therefore the RDP
testing method appears to produce better results in terms of repeatability
of the test method and may be the best method for use in the post-peak
load bearing capacity assessment of shotcrete during design. The design
of shotcrete could be based on the post peak load bearing capacity, which
has a direct influence on the energy absorption of shotcrete.
The toughness indices results obtained from the ASTM beam tests have
shown that the increase in fibre density in shotcrete has a negligible effect

125
on the toughness of shotcrete. Probably, this is because the ASTM beam
testing method has a very low deflection range of up to 2mm and the
range may not give a clear picture on the influence of fibres. This may
require the use of a testing machine that loads the beam to complete
failure. For the current ASTM test method, the toughness indices results
may be used to check whether the shotcrete meets set standards, for
example, the toughness category ratings by Morgan (1988) reproduced in
Table 4.4 in Section 4.7.
The residual strength values obtained from the polypropylene fibre
reinforced EFNARC beams show no linear trend as the fibre density
increases. This may also be attributed to the deflection of the beams
which was done up to 4mm according to the test method. At low
deflections, the increase in fibre density may not be easily noticeable
hence the need to load the beam to destruction during testing.
4.10 Conclusions
Various properties of fibre reinforced shotcrete were assessed in this
chapter. The laboratory test results have revealed that the incorporation of
fibres in shotcrete has little effect on the modulus of rupture and the
uniaxial compressive strength of shotcrete. However, the incorporation of
fibres improves the post peak performance of shotcrete by offering it
residual strength and energy absorption capacities. The shape of the
specimens has an effect on the performance of shotcrete. This is
especially the case with EFNARC panels due to the nature of the testing
method, which requires the panel base to be flush with the stand on which
the panel is placed during testing. It has been noted that the performance
of fibre reinforced shotcrete depends on the types of fibres used in the
shotcrete. The next chapter provides an investigation into the mechanisms
of rock support provided by sprayed liners, based on field observations.
126
CHAPTER 5
INVESTIGATIONS INTO THE
MECHANISMS OF ROCK SUPPORT
PROVIDED BY SPRAYED LINERS BASED
ON FIELD OBSERVATIONS
5.1 Introduction
The previous chapter dealt with the laboratory testing of shotcrete
reinforced with steel or polypropylene fibres. The laboratory testing
exercise has shown the benefits in shotcrete performance obtained from
the incorporation of fibres. The laboratory testing results, together with
field observations made during the monitoring of shotcreted pillars and
tunnels in Chapter 3, will be used to investigate the possible mechanisms
of rock support provided by shotcrete as a sprayed liner. Most of the
mechanisms identified in Chapter 2 have been useful in the discussion of
the possible mechanisms that were observed in the field as the shotcrete
responded to loading by the pillars and tunnels due to mining induced
stresses.
5.2 Mechanisms of rock support provided by sprayed
liners based on field observations
5.2.1 Promotion of block interlock through bonding
Stacey (2001) indicated that block interlock is promoted by the bonding of
the thin sprayed liners to the rock. During the research, bond strength

127
tests carried out at the South Deep Mine monitoring site have shown that
the bond strength between the shotcrete and rock interface ranged from
0.2 MPa to 2.0 MPa. At Mponeng Mine, there was evidence of block
interlock where the rock was observed to be broken, but still held in
position by the shotcrete.
Borehole observations, as shown in Figure 5.1a at Mponeng 109 Level,
show that the depth of loosened rock blocks was up to about 0.5m behind
the shotcrete. Figure 5.1b shows the loose rock blocks held back by the
wire mesh and lace support adjacent to the intact shotcreted section.
Figure 5.1c shows a broken section of the mesh and lacing which is 10m
away from the shotcreted section at Mponeng Mine Level 109. Also shown
in Figure 5.1c is the depth of loosened rock blocks which is approximately
0.5m. The shotcrete played a major role in keeping the loosened rocks in
place, thereby maintaining the integrity of the tunnel.

128
Figure 5.1a Borehole A and Borehole B in Mponeng Level 109
showing broken rock (about 0.5m) but interlocked in
place by the shotcrete

129
Figure 5.1b Broken and loose rock held back by wire mesh and rope
lacing and broken rock interlocked behind shotcrete at
Mponeng Mine Level 109

130
Figure 5.1c Side view of the loosened blocks (about 0.5m depth)
held back by the mesh and lacing a few metres from the
intact shotcreted section shown in Figure 5.1a and
Figure 5.1b
5.2.2 Tensile strength of liner
Unreinforced shotcrete has low tensile strength properties and low strain
capacity at fracture. However, the incorporation of fibres into the shotcrete
improves the strain capacity of shotcrete as fibre addition improves the
ductility of the shotcrete. As a result, the gradual nature in which the fibres
pull out from the shotcrete imparts post crack ductility properties to the
shotcrete that would otherwise fail in a brittle manner. Shotcrete laboratory
testing results have shown that an improvement in ductility depends on the
density of fibres and the type of fibres added to the shotcrete. Laboratory

131
test results in Chapter 4 have shown that the compressive strength of
steel fibre reinforced shotcrete is slightly higher than that of polypropylene
fibre reinforced shotcrete. For shotcrete, it follows that high compressive
strength means high elastic modulus (Grov and Blindheim, 1997 and
Melbye, 1994). Hook ended fibres provide improved anchorage thereby
increasing the resistance to pullout compared to straight fibres.
Underground observations noted that steel fibres sticking out between
cracks were perpendicular to the crack as indicated in Figure 5.2. There
are various explanations related to the sticking out of fibres. Firstly, the
fibres may have failed in tension as they offered resistance to the tensile
stresses in the shotcrete as illustrated in Figure 5.3a. Alternatively, the
fibres could be sticking out due to fibre pull out as the bond between the
shotcrete and the fibre fails when the shotcrete responds to loading by the
rock as illustrated in Figure 5.3b.
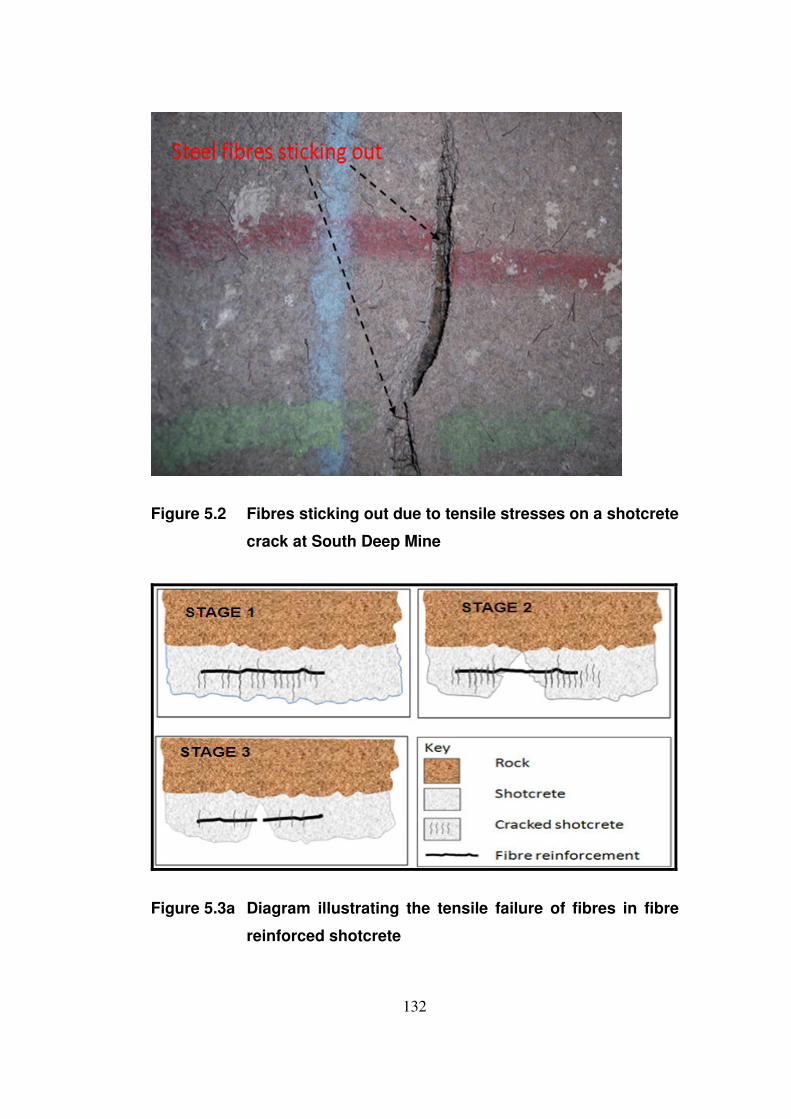
132
Figure 5.2 Fibres sticking out due to tensile stresses on a shotcrete
crack at South Deep Mine
Figure 5.3a Diagram illustrating the tensile failure of fibres in fibre
reinforced shotcrete

133
Figure 5.3b Diagram illustrating the pullout (failure) of fibres in fibre
reinforced shotcrete
5.2.3 Basket mechanism
Stacey (2001) pointed out that when the sprayed liners support the rock in
the form of a basket, the sprayed liner will be acting mainly in tension.
Stacey (2001) also indicated the importance of ductility when the sprayed
liner supports the rock through this mechanism. The load-deformation
results in Chapter 4 have shown that the incorporation of fibres in the
shotcrete helps improve the post peak load bearing capacity of shotcrete
by offering it some ductility. The improvement in the post peak load
performance was also illustrated through the energy absorption which
improved with an increase in fibre density for both the steel fibre and
polypropylene fibre reinforced round determinate panels. Therefore the
ductility which is necessary for the basket mechanism to be effective has
been demonstrated in the laboratory testing of fibre reinforced shotcrete
specimens. The importance of ductility in the basket mechanism is

134
illustrated in Figure 5.4 where the fibre reinforced shotcrete was used
together with mesh and lacing. Figure 5.4 shows that the shotcrete tensile
strength has been exceeded, but that the shotcrete is being assisted by
the mesh and lacing to hold back the loosened rock behind.
Figure 5.4 Basket mechanism where shotcrete has been applied
together with rock bolts; mesh and lacing support
(Mponeng Mine Level 116)
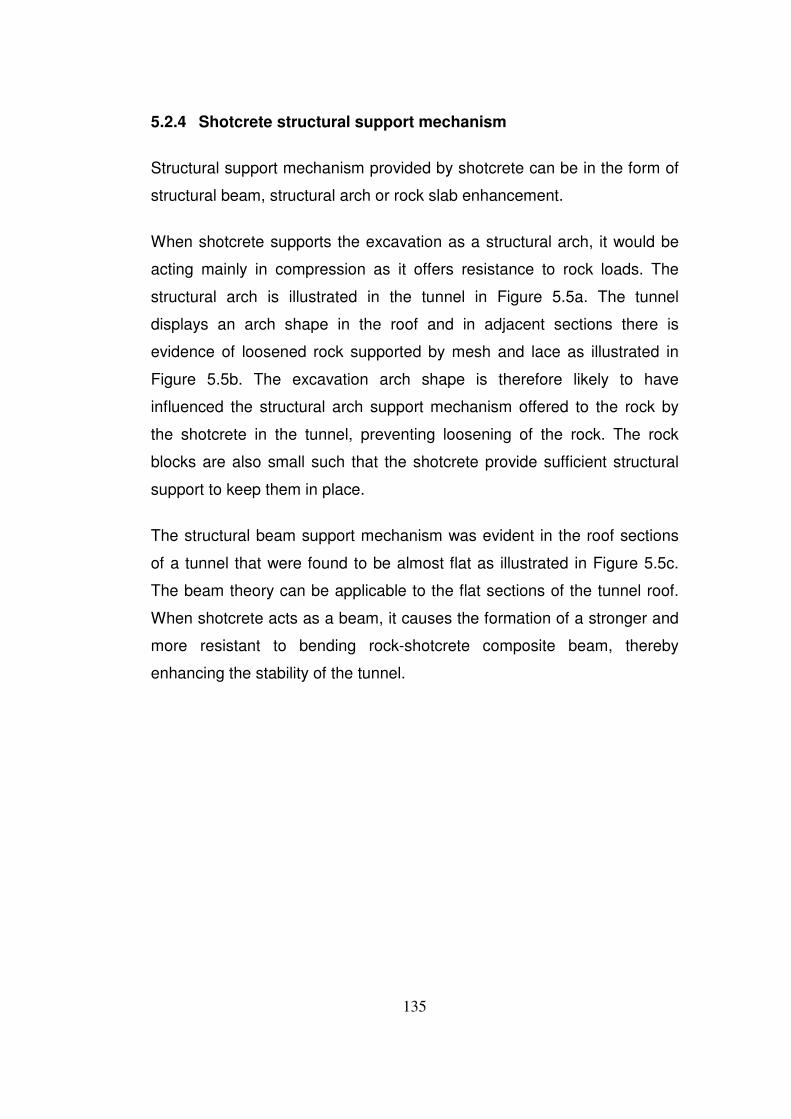
135
5.2.4 Shotcrete structural support mechanism
Structural support mechanism provided by shotcrete can be in the form of
structural beam, structural arch or rock slab enhancement.
When shotcrete supports the excavation as a structural arch, it would be
acting mainly in compression as it offers resistance to rock loads. The
structural arch is illustrated in the tunnel in Figure 5.5a. The tunnel
displays an arch shape in the roof and in adjacent sections there is
evidence of loosened rock supported by mesh and lace as illustrated in
Figure 5.5b. The excavation arch shape is therefore likely to have
influenced the structural arch support mechanism offered to the rock by
the shotcrete in the tunnel, preventing loosening of the rock. The rock
blocks are also small such that the shotcrete provide sufficient structural
support to keep them in place.
The structural beam support mechanism was evident in the roof sections
of a tunnel that were found to be almost flat as illustrated in Figure 5.5c.
The beam theory can be applicable to the flat sections of the tunnel roof.
When shotcrete acts as a beam, it causes the formation of a stronger and
more resistant to bending rock-shotcrete composite beam, thereby
enhancing the stability of the tunnel.

136
Figure 5.5a Demarcation between shotcrete, mesh and lacing
support on Level 109 at Mponeng Mine. Shotcreted
section shows no signs of loosening whereas the mesh
and lacing section show signs of rock loosening.

137
Figure 5.5b Close view of Mponeng Mine Level 109 mesh and lacing
section (mesh and lace section in Figure 5.5a) showing
loosened rock held back by mesh and lacing support

138
Figure 5.5c Close view of Mponeng Mine Level 109 shotcreted roof
section (shotcreted roof section in Figure 5.5a) still
intact and showing no signs of failure in the shotcrete as
the shotcrete provides support through the beam
support mechanism
Observations made in two boreholes at Impala Platinum Mine revealed
that the rock was cracked a few centimetres behind the shotcrete as
illustrated in Figure 5.6. The shotcrete bonded to the rock has helped
maintain stability by enhancing the slab bending resistance due to the
formation of a strong rock-shotcrete composite beam.

139
Figure 5.6 Cracks observed in a borehole showing a possibility of
rock slabs forming in the tunnel walls due to mining
induced stresses at Impala Platinum Mine
5.2.5 Extended faceplate
Stacey (2001) mentioned that all surface support will increase the area of
influence of face plates attached to rock bolts or cable bolts. The face
plate extension mechanism is achieved when face plates are installed as
illustrated in Figure 5.7, where the tensioned cable bolt face plates were
installed on top of the shotcrete. Tensioning of the cable bolts improved
the direct contact between the shotcrete and the face plates which is
necessary for the face plate mechanism to be valid. However, there was
no photographic evidence showing partial failure of shotcrete to illustrate
the extended face plate during the period of this research.

140
Figure 5.7 Tensioned cable bolting with face plates on the surface
of shotcrete at Mponeng Mine Level 116
5.2.6 Mechanical protection
Stacey (2001) pointed out the importance of mechanical protection offered
by sprayed liners to the rock. Mechanical protection is offered to the rock
by the sprayed liner mainly where heavy underground machinery is being
used for production and other underground purposes. As the equipment
moves from one place to another, it can come into direct contact with the
walls of an excavation. The extent of damage to shotcreted excavations
would be lower relative to those that are not shotcreted. Figure 5.8 shows
an illustration of the protection offered to one of the pillars at South Deep
Mine where a loosened slab of shotcrete was observed after underground
heavy equipment in motion came into contact with the pillar. An
unprotected pillar would have experienced the damage itself rather than
the shotcrete support as shown in Figure 5.8.

141
Figure 5.8 Damaged corner of one of the pillars that were
monitored at South Deep Mine
5.2.7 Durability enhancement
Stacey (2001) pointed out that some rocks deteriorate on exposure and
when subjected to wetting and drying. Sprayed liners help protect the
rocks from deteriorating by providing a protective layer to weathering. It is
mainly the water flowing through openings like joints in the rock that the
sprayed liner will not be able to protect the rock against. Unfortunately,
there was no photographic evidence to support the durability
enhancement in the monitored sites. However, Bartlett and Borejszo
(2002) evidence of durability enhancement in Kimberlite environments.

142
5.3 Conclusion
The field monitoring exercise afforded the opportunity to observe
practically some of the mechanisms of rock support provided by the
sprayed liners. These include promotion of block interlock, structural arch
support and the basket mechanisms. Not all mechanisms found in the
literature review in Chapter 2 could be identified in the three underground
monitoring sites assessed during this study. However, the observed
mechanisms provided a step in improving the understanding of the
mechanisms of rock support provided by sprayed liners in the field.

143
CHAPTER 6
CONCLUSIONS AND
RECOMMENDATIONS
The research described in this dissertation has been able to identify,
practically, some of the mechanisms of rock support provided by sprayed
liners through field monitoring, field tests and laboratory tests. Based on
the study, the following conclusions can be drawn regarding the
mechanisms of rock support provided by the sprayed liners:
• Sprayed liners can offer structural support to loosened rock blocks
in an excavation provided that the excavation is not exposed to high
mining induced stresses, and provided that the block sizes are
small such that the dead weight of an individual block does not
exceed the capacity of the sprayed liner. Structural support
mechanisms offered to the rock by sprayed liners have been found
to be in the form of rock slab enhancement, beam enhancement
and structural arch support. It has also been noted that the shape of
the excavation plays a crucial role in determining the form of the
structural support mechanism offered by shotcrete.
• The Mponeng Mine site afforded the opportunity to understand the
promotion of key block interlock since there was a shotcreted
section in the tunnel monitored, and adjacent to this shotcreted
section the tunnel was supported by wire mesh and lacing. Small
blocks of loosened rock could be seen in the wire mesh and lace
supported section, and in the shotcreted section loose blocks were
identified behind the shotcrete via the boreholes. The fractured
blocks in the shotcreted section were held back by the shotcrete.

144
This was possible because the tunnel was in a destressed state as
the stope above had progressed past the tunnel and no further
mining induced stresses affected the stability of the excavation.
• Other mechanisms of rock support provided by sprayed liners
identified in the field were the basket mechanism and mechanical
protection offered to the rock by shotcrete.
• The instruments used during the field monitoring exercise at the
three underground mine sites helped identify the period in which
displacement of the pillars and tunnels took place at increased
rates. Signs of shotcrete cracking could be seen during this period
and when further displacement was recorded, failure of the
shotcrete at the South Deep Mine site could be identified. The
monitoring exercise was useful in identifying some of the failure
modes of shotcrete in situ. The modes of shotcrete failure identified
in the field include tensile failure, adhesion failure, punching failure,
shear failure and bending failure.
• Laboratory tests showed that the addition of fibres to shotcrete
increases its ductility. The ductility rendered to the shotcrete
improves its energy absorption, toughness and residual strength
capacity. Also, it was noticed that the fibre content and fibre types
have a direct influence on the shotcrete properties, which in turn
play an important role in the mechanisms of rock support provided
by the sprayed liners.
In order to improve on the understanding of the mechanisms of rock
support provided by sprayed liners, the following recommendations are
made for further study:

145
• More field monitoring exercises of shotcreted pillars need to be
carried out at various mine sites to see how the shotcrete behaves
in different environments.
• This research work focussed on shotcrete only as a sprayed liner.
More field monitoring should be carried out on thin spray-on liners
(TSL) to improve the understanding of the mechanisms by which
they support the rock.
• The laboratory work carried out during the course of this research
did not include plain shotcrete specimens. Therefore the tests
should be repeated for both plain and fibre reinforced shotcrete for
comparison purposes.
• During the field monitoring exercise, no stress measurements were
taken to give an indication of the actual stress changes in the pillars
and tunnels. Stress measurement in the pillars and tunnels should
be included for further study to enable the observed rock
deformations and shotcrete failures to be related to the stress
changes in the supported rock. The correlation may help to improve
the understanding of shotcrete behaviour in those mining
environments.
• When further field monitoring of sprayed liners is carried out,
systematic photographs of the sites need to be taken routinely and
stored in a database such that the observed condition of the
sprayed liner can be correlated with results from the displacement,
stress and strain results.
• Strain measurements during the monitoring exercise were carried
out in the rock and not in the shotcrete. Inside the rock, strain
changes may be lower compared to those on the excavation
periphery. Therefore further study should include strain

146
measurements in the shotcrete so that the strain in the shotcrete is
known for use in the analyses of shotcrete behaviour.

147
REFERENCES
Aagaard, B., Grov, E., and Blindheim, O,T.,(1997), Sprayed concrete as
part of rock support systems for adverse rock mass conditions.
Proceedings of the International Symposium on Rock Support – Applied
Solutions for Underground Structures, Lillehammer, Norway, pp. 13 – 24.
Alberts, C., and Backstrom, S., (1971), Instant shotcrete support in rock
tunnels. Tunnels and Tunnelling, Unknown source.
ASTM C1018-97, (1997), Standard test method for flexural toughness and
first-crack strength of fibre-reinforced concrete (Using beam with third
point loading).
ASTM C1550-05, (2005), Standard test method for flexural toughness of
fibre reinforced concrete (Using centrally loaded round panel).
Banthia, N., Trottier, J.F., Baupre, D., and Wood, D., (1994), Influence of
fibre geometry in steel fibre reinforced wet mix shotcrete. Concrete
International, Vol. 16, pp. 27 – 32.
Banton, C., Diederichs, M.S., Hutchinson, D.J., and Espley S., (2004),
Mechanisms of shotcrete roof support. Proceedings of the 2nd International
Conference on Engineering Developments in Shotcrete, Cairns,
Queensland, Australia, pp. 39 – 45.
Barrett, S.V.L., and McCreath, D.R., (1995), Shotcrete support design in
blocky ground: Towards a deterministic approach. Tunneling and
Underground Space Technology, Vol. 10, No. 1, pp. 79 – 89.
Bartlett, P., and Borejszo, R., (2002), Tunnelguard in the mining industry.
SAIMM 2nd International Seminar on Surface Support Liners: Thin Sprayed
Liners, Shotcrete, Mesh, Sandton, South Africa.

148
Bartlett, P., and Nesbitt, K., (2000), Durability of Kimberlite and its effect
on drilling and support in tunnels, Proc. AITES-ITA 2000 World Tunnel
Congress, Tunnels Under Pressure, ed. T.R. Stacey, South African
Institute of Mining and Metallurgy, pp. 37–40.
Barton, N., Lien, R., and Lunde, J., (1974), Engineering classification of
rock masses for the design of tunnel support. Rock Mechanics, Vol. 6, No.
4, pp. 189 – 236.
Barton, N., (2002), Some new Q-value correlations to assist in site
characterisation and tunnel design. International Journal of Rock
Mechanics and Mining Sciences, Vol. 39, pp. 185 – 216.
Bernard, E.S., (1999), Correlations in the performance of fibre reinforced
shotcrete beams and panels, Engineering Report CE9, School of Civil
Engineering and Environment, University of Western Sydney, Nepean
Kingswood, Australia.
Bieniawski, Z.T., (1989), Engineering rock mass classifications. John
Wiley and Sons, New York.
Brady, B.H.G., and Brown, E.T., (1993), Rock Mechanics for Underground
Mining. 2nd Edition, Allen and Unwin, London.
Brown, E.T., and Bray, J., (1987), Analytical and computational methods in
engineering rock mechanics. London; Boston, Allen & Unwin.
Chen, L., Mindess, S., and Morgan, D.R., (1994), Specimen geometry and
toughness of steel fibre reinforced concrete. Journal of Materials in Civil
Engineering, Vol. 6, No. 4, pp. 529 – 541.
Douglas, T.H., and Arthur, L.J., (1983), A guide to the use of rock
reinforcement in underground excavations. London, CIRIA Research
Report 101.

149
EFNARC, (1996), European specification for sprayed concrete,
www.efnarc.org
Egger, H.R., (1981), The role of shotcrete in underground construction.
Symposium on Modern Techniques in Underground Construction and
Tunnelling Works, Bangkok, Thailand, pp. 76 – 97.
Fernandez-Delgado, G., Mahar, J.W., Parker, H.W., (1976), Structural
behaviour of thin shotcrete liners obtained from large scale tests.
Proceedings of the Engineering Foundation Conference, Shotcrete for
Ground Support, Easton, Maryland, USA, American Concrete Institute SP-
54, pp. 399 – 442.
Fernandez-Delgado, G., Cording, E.J., Mahar, J.W., and Van Sint Jan,
M.L., (1981), Thin shotcrete linings in loosening rock. The Atlanta
Research Chamber: Applied Research for Tunnels, US Department of
Transportation Report: UMTA-GA-06-0007-81-1, Monograph 21.
Finn, D.J., Teasedale, P., and Windsor, C.R., (1999), In situ trials and field
testing of two polymer restraint membranes. Proceedings of Rock Support
and Reinforcement Practice in Mining, E. Villaescusa, C.R. Windsor, and
A.G. Thompson (ed.), Kalgoorlie , Australia, A.A. Balkema, pp. 139 – 153.
Fredriksson, A., and Stille, H., (1992), Bergforstarkningsprinciper for olika
typfall i svenska gruvor. Gruvteknik 2000, report no. 92:07 (in Swedish).
Grov, E., and Blindheim, O.T., (1997), Selecting properties of sprayed
concrete for different rock support applications. Proceedings of the
International Symposium on Rock Support – Applied Solutions for
Underground Structures, Lillehammer, Norway, pp. 68 – 82.

150
Hahn, T., and Holmgren, J., (1979), Adhesion of shotcrete to various types
of rock surfaces. Proceedings of the 4th International Congress on Rock
Mechanics, Rotterdam: Balkema, pp. 431 – 439.
Henderson, N.B., and Lewis, B.P., (2001), Mondi Rock-hold, development
and application of a structural membrane support system. Journal of The
South African Institute of Mining and Metallurgy, Vol. 101, No. 7, pp. 343 –
351.
Hoek, E., and Wood, D.W.F., (1987), Rock support in underground mines.
In Underground Support Systems, ed. J.E. Udd, Montreal: Canadian Inst.
Min. Metall. 35, pp. 1 – 6.
Hoek, E., Kaiser, P.K., and Bawden, W.F., (1995), Support of underground
excavations in hard rock, AA Balkema.
Hoek, E., Kaiser, P.K., and Bawden, W.F., (2000), Support of underground
excavations in hard rock. Balkema, Rotterdam.
Holmgren, J., (1983), Tunnel linings of steel fibre reinforced shotcrete.
Proc. 5th International Congress on Rock Mechanics, pp. D311 – D314,
Rotterdam: Balkema.
Holmgren, J., (1987), Bolt anchored steel reinforced shotcrete linings.
Tunnelling and Underground Space Technology, Vol. 2, pp. 319 – 333.
Hudson, J.A., and Harrison, J.P., (1997), Engineering rock mechanics: An
introduction to the principles. Oxford, Pergamon.
Humphries,W.R., and Funkhouser, M.R., (1993), The use of shotcrete on
recent tunnel projects in the South and East, USA. Proceedings of
Shotcrete for Underground Support VI, American Society for Civil
Engineers, pp. 138 - 149.

151
Johansen, K.W., (1962), Yield line theory. London, Cement and Concrete
Association.
Kaiser, P.K. and McCreath, D.R., eds., (1992), Proceedings of the
International Symposium on Rock Support: Rock support in mining and
underground construction. Rotterdam, NE: Balkema.
Kaiser, P.K., and Tannant, D.D., (1997), Use of shotcrete to control rock
mass failure. International Symposium on Rock Support – Applied
Solutions for Underground Structures, Lillehammer, Norway, pp. 580 –
595.
Kennedy, G., Goodchild, C.H., (2004), Practical yield line design. The
Concrete Centre. www.concretecentre.com.
Kuchta, M.E., (2001), The use of high-pressure water for scaling of loose
rocks in mine openings. 32nd Annual Conference, Institute on Mining
Health, Safety & Research, August 5-7, Salt Lake City, Utah.
Kuchta, M.E., (2002), Quantifying the increase in adhesion strength of
shotcrete applied to surfaces treated with high pressure water. Society for
Mining, Metallurgy, and Exploration (SME) Annual Meeting, Phoenix
Arizona.
Kuchta, M.E., Hustrulid, W.A., and Lorig, L.J., (2004), The importance of
rock surface preparation in shotcreting operations. Surface Support in
Mining, ed. Y. Potvin, D. Stacey and J. Hadjigeorgiou. Australian Centre
for Geomechanics, Western Australia, pp. 283 – 290.
Kuijpers, J.S., and Toper, Z., (2002), Towards a better understanding of
the support function of thin sprayed liners. SAIMM 2nd International
Seminar on Surface Support Liners: Thin Sprayed Liners, Shotcrete, Mesh
and Lace, Sandton, South Africa.

152
Kumar, D., Behera, P.K., and Singh, U.K., (2002), Shotcrete adhesion
strength, EJGE Paper, http://www.ejge.com/2002/Ppr0203/Ppr0203.htm
Lang, T.A., (1961), Theory and practice of rock bolting. Transaction of the
American Institute of Mining, Metallurgy and Petroleum Engineers,
Transaction Vol. 220, pp. 333 – 348.
Langille, C., Espley, S., and McCreath, D., (1995), Innovative liner support
trials in underground hard rock mines, CIM Bulletin Vol. 88 No. 992, pp. 66
– 74.
Langille, C., (2001), Shotcreting, In Advanced Rock Mechanics Practice
for Underground Mines, Australian Center for Geomechanics Short
Course.
Laubscher, D.H., (1990), A geomechanics classification system for the
rating of rock mass in mine design. Journal of the South African Institute of
Mining and Metallurgy, Vol. 90(10), pp. 257 – 273.
Leach, A.R., (1998), Specifications of shotcrete for deep gold mine
conditions (beam and slab tests), ITASCA Internal Report.
Leach, A.R., (2002), Comparison of support requirement performance
characteristics of sprayed cementitious coatings. SAIMM 2nd International
Seminar on Surface Support Liners: Thin Sprayed Liners, Shotcrete,
Mesh, Sandton, South Africa.
MacKay, J., and Trottier, J.F., (2004), Post-crack creep behaviour of steel
and synthetic fibre reinforced concrete under flexural loading. Shotcrete:
More Engineering Developments, Proceedings of the 2nd International
Conference on Engineering Developments in Shotcrete, ed. E.S. Bernard,
Taylor and Francis Group, London, pp. 183 – 192.
Malmgren, L., and Svensson, T., (1999), Investigation of important
parameters for unreinforced shotcrete as rock support in the Kiirunavaara
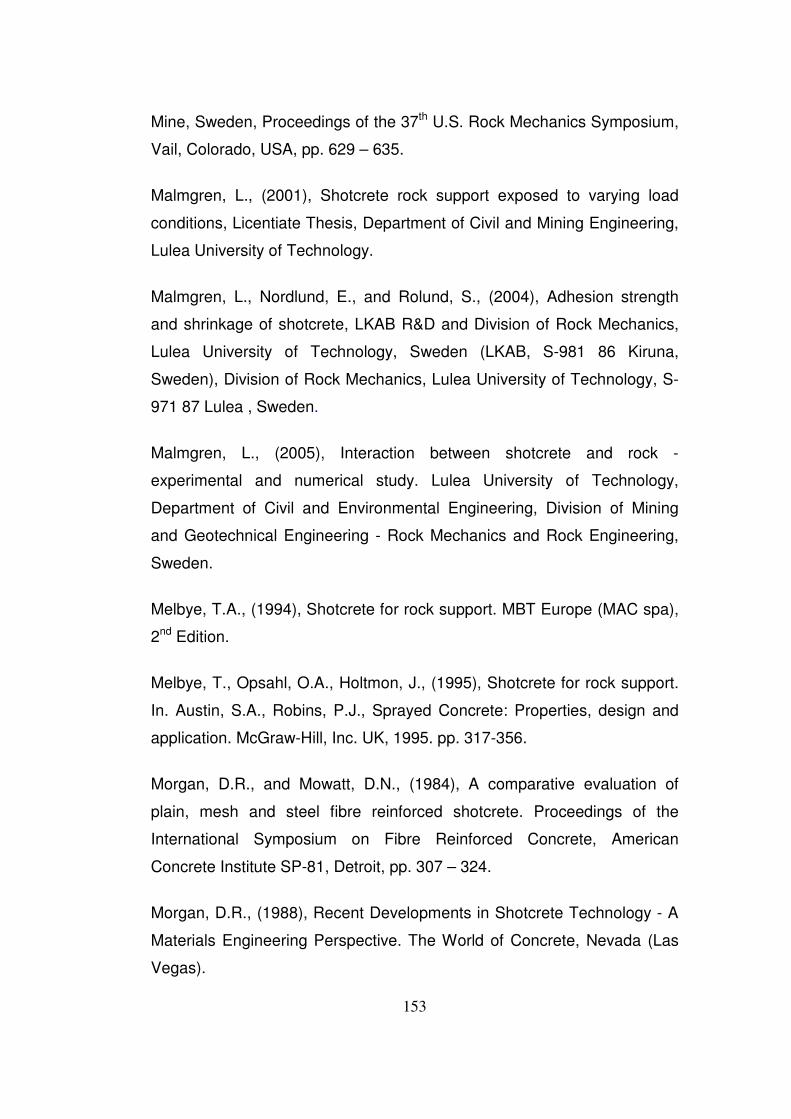
153
Mine, Sweden, Proceedings of the 37th U.S. Rock Mechanics Symposium,
Vail, Colorado, USA, pp. 629 – 635.
Malmgren, L., (2001), Shotcrete rock support exposed to varying load
conditions, Licentiate Thesis, Department of Civil and Mining Engineering,
Lulea University of Technology.
Malmgren, L., Nordlund, E., and Rolund, S., (2004), Adhesion strength
and shrinkage of shotcrete, LKAB R&D and Division of Rock Mechanics,
Lulea University of Technology, Sweden (LKAB, S-981 86 Kiruna,
Sweden), Division of Rock Mechanics, Lulea University of Technology, S-
971 87 Lulea , Sweden.
Malmgren, L., (2005), Interaction between shotcrete and rock -
experimental and numerical study. Lulea University of Technology,
Department of Civil and Environmental Engineering, Division of Mining
and Geotechnical Engineering - Rock Mechanics and Rock Engineering,
Sweden.
Melbye, T.A., (1994), Shotcrete for rock support. MBT Europe (MAC spa),
2nd Edition.
Melbye, T., Opsahl, O.A., Holtmon, J., (1995), Shotcrete for rock support.
In. Austin, S.A., Robins, P.J., Sprayed Concrete: Properties, design and
application. McGraw-Hill, Inc. UK, 1995. pp. 317-356.
Morgan, D.R., and Mowatt, D.N., (1984), A comparative evaluation of
plain, mesh and steel fibre reinforced shotcrete. Proceedings of the
International Symposium on Fibre Reinforced Concrete, American
Concrete Institute SP-81, Detroit, pp. 307 – 324.
Morgan, D.R., (1988), Recent Developments in Shotcrete Technology - A
Materials Engineering Perspective. The World of Concrete, Nevada (Las
Vegas).

154
Morgan, D. R., Chen, L., and Beaupré, D., (1995), Toughness of fibre
reinforced shotcrete. ASCE Shotcrete for Underground Support VII, Telfs,
Austria, pp. 66-87.
Morrison, J. A., Madsen, P. H., and Carayol, S., (1999), Ground control
program for the Río Piedras Project, Tren Urbano, San Juan, Puerto Rico,
Proc. Rapid Excavation and Tunneling Conference, Orlando, SME, pp.
415 – 435.
Obert, L., and Duvall, W.I., (1967), Rock mechanics and the design of
structures in rock, John Wiley, New York.
Ortlepp, W.D., Stacey, T.R., and Kirsten, H.A.D., (1999), Containment
support for large static and dynamic deformations in mines. Rock Support
and Reinforcement Practice in Mining, Karlgoorlie, Western Australia, ed.
Villaescusa, E., Windsor, C.R., and Thompson, A.G., A.A
Balkema/Rotterdam/Brookfield, pp. 359 - 364.
Papworth, F., Ratcliffe, R., and Grant, B., (1996), Design of steel fibre
reinforced concrete slabs on ground and shotcrete linings. The New
Zealand Concrete Society, Making Innovations Happen Conference,
Taupo, New Zealand.
Pells, P.J.N., (2008), What happened to the mechanics in rock mechanics
and geology in engineering geology? The Journal of The Southern African
Institute of Mining and Metallurgy, Vol. 108, pp. 309 – 323.
Player, J.R., (2004), Field performance of cone bolts at Big Bell mine.
Proceedings of the 5th International Symposium on Ground Support in
Mining and Underground Construction, Perth, Western Australia, ed.
Villaescusa, E., and Potvin, Y., A.A. Balkema Publishers, Taylor and
Francis Group, London.

155
Ratcliffe, R., (1999), The important properties of steel fibre reinforced
shotcrete (SFRC) used in mining. Rock Support and Reinforcement
Practice in Mining, Proc. Int. Symp. on Ground Support, ed. E.
Villaescusa, C.R. Windsor, and A.G. Thompson. Karlgoorlie, Western
Australia, Balkema, Rotterdam, Brookfield, pp. 209 – 218.
Ray, J., (1997), Shotcrete performance assessment. 3rd National
Shotcrete Workshops, Kalgoorlie, Brisbane and Sydney, Unknown
Source.
Rose, D., (1985), Steel fibre reinforced shotcrete for tunnel linings: The
state of the art. In Proceedings of the Rapid Excavation and Tunnelling
Conference, New York, Vol. 1, pp. 319 – 412.
Saiang, D., Malmgren, L., and Nordlund, E., (2004), Strength and stiffness
of shotcrete-rock interface – a laboratory study. Proceedings of the Fifth
International Symposium on Ground Support in Mining and Underground
Construction, Perth, Western Australia, ed. E. Villaescusa, and Y. Potvin.
Balkema, pp. 555 – 565.
Shi, G.H., and Goodman, R.E., (1981), A new concept for support of
underground and surface excavations in discontinuous rocks based on the
keystone principle, In Rock mechanics from Research to Applications,
Proc. 22nd U.S. Symp. for Rock Mechanics, Massachusetts Institute for
Technology, Cambridge, pp. 290 – 296.
Spearing, A.J.S., and Hague, I., (2003), The application of underground
support liners reaches maturity, ISRM, Technology Roadmap for Rock
Mechanics, South African Institute of Mining and Metallurgy, pp. 1127 –
1132.
Speers, C.R., (1998), Shallow excavation requirements. School: Shotcrete
and its Application, The South African Institute of Mining and Metallurgy,
Mintek, Randburg.

156
SRK Consulting Company, SIMRAC Internal Report, (2008), Shotcrete
project.
Stacey, T.R., and Ortlepp, W.D., (1999), Retainment support for dynamic
events in mines. Proceedings of the International Symposium on Ground
Support, Kalgoorlie, Western Australia, pp. 329- 333.
Stacey, T.R., (2001), Review of membrane support mechanisms, loading
mechanisms, desired membrane performance, and appropriate test
methods. Journal of The South African Institute of Mining and Metallurgy,
Vol. 101, No. 7, pp. 343 – 351.
Stacey, T.R., (2003), Presidential Address: Rock engineering – Good
design or good judgement? Journal of the South African Institute of Mining
and Metallurgy, Vol. 103, pp. 411 – 421.
Stacey, T.R., and Yu, X., (2004), Investigations into the mechanisms of
rock support provided by sprayed liners. Ground Support in Mining and
Underground Construction, ed. E. Villaescusa, and Y. Potvin. Taylor and
Francis Group, London, pp. 565 – 569.
Stacey, T.R., (2004), Shotcrete in mines: State-of-the-art in South Africa.
Surface Support in Mining, ed. Y. Potvin, D. Stacey and J. Hadjigeorgiou.
Australian Centre for Geomechanics, Western Australia, pp. 247 – 253.
Stille, H., and Franzen, T., (1990), Design of shotcrete support from a rock
mechanical point of view. Shotcrete for Underground Support. Proc. Eng.
Found. Conf. Uppsala, pp. 1 – 9.
Sutcliffe, H., and McClure, C.R., (1969), Large aggregate shotcrete
challenges steel ribs as a tunnel support. American Society for Civil
Engineering Publication.
Swan, G. and Henderson, A., (2001). Water-based spray-on liner
implementation at Falconbridge Limited. Proceedings of the 15th Mine

157
Operators’ Conference, Sudbury (Ontario), The Canadian Institute of
Mining, Metallurgy and Petroleum (CIM), CIM Editor/Publisher.
Tannant, D.D., Swan, G., Espley, S., and Graham, C., (1999), Laboratory
test procedures for validating the use of thin spray-on liners for mesh
replacement. Canadian Institute of Mining and Metallurgy Annual General
Meeting, Calgary, published on CD ROM.
Tannant, D.D., (2001), Thin spray-on liners for underground rock support.
17th Int. Mining Congress and Exhibition of Turkey. IMCET 2001, ed.
Unal, E., Unver, B., and Tercan, E., Ankara, Turkey, pp. 57–65.
Tannant, D.D., (2002), Thin spray-on liners for underground rock support-
testing and design issues. Surface Support in Mining, ed. Potvin, Y.,
Stacey, D., and Hadjigeorgiou, J. pp. 51 – 59.
Vandewalle, M., (1992), Dramix tunneling the world (2nd edition), An N.V.
Bekeart SA publication, Zwevegem, Belgium.
Vandewalle, M., (1998), The use of steel fibre reinforced shotcrete for the
support of mine openings. School: Shotcrete and its Application, South
African Institute of Mining and Metallurgy, Randburg, South Africa.
Whittaker, B.N., and Frith, R.C., (1990), Tunnelling design, stability and
construction. The Institution of Mining and Metallurgy, London.

158
BIBLIOGRAPHY
ASTM 506R-C90, (1990), Guide to shotcrete.
ASTM A820-90, (1990), Standard specification for steel fibres for
reinforced concrete.
ASTM C1140 - 89, (1989) Standard specification for preparing and testing
specimens from shotcrete prepared panels.
ASTM C31 Practice for Making and Curing Concrete Test Specimens in
the field; and
ASTM C42 – 91, (1991), Standard test method for obtaining and testing
drilled cores and sawed beams of concrete
www.efnarc.org
www.yieldpoint.com
ASTM 1550 – 05, (2005), Standard test method for flexural toughness of
fibre reinforced concrete (Using centrally loaded round panel)

159
APPENDIX A: Load deflection graphs for
ASTM beams, ASTM RDPs, EFNARC
panels and EFNARC beams
Load deflection
Energy absorption

160
ASTM BEAMS

161
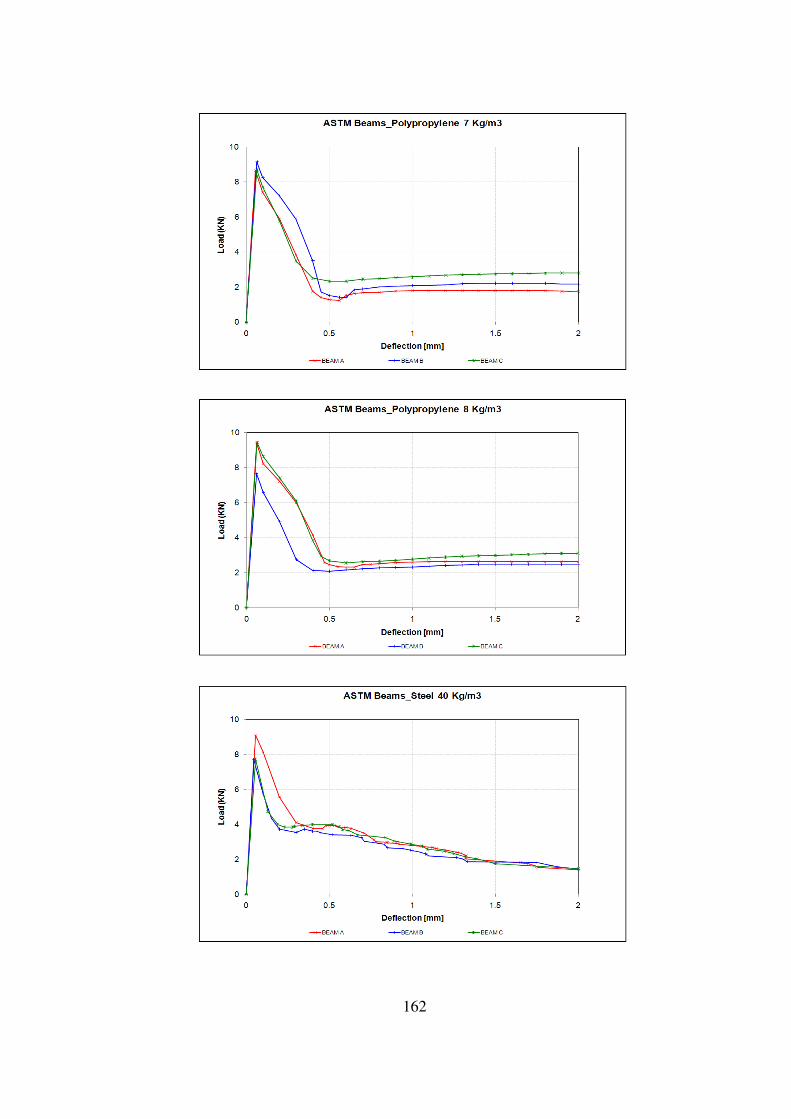
162

163
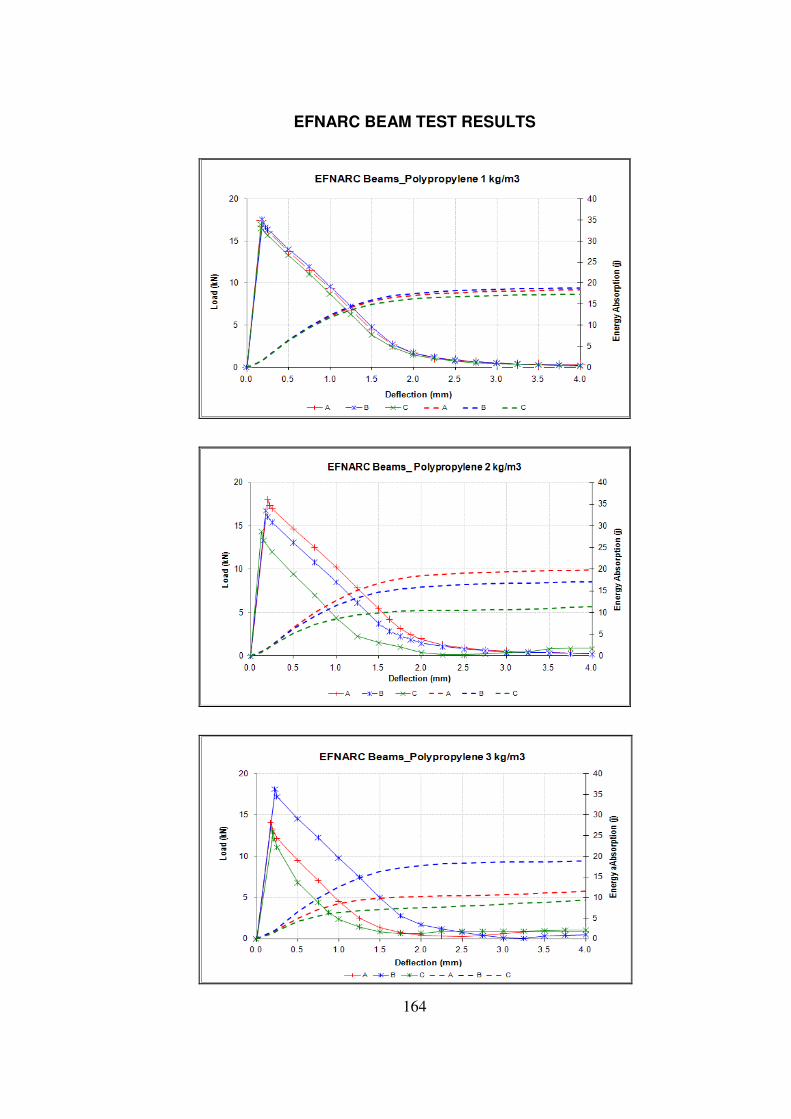
164
EFNARC BEAM TEST RESULTS

165

166

167

168
EFNARC PANEL TEST RESULTS

169

170

171

172
ROUND DETERMINATE PANELS

173
174

175

176
APPENDIX B: Table showing the strength,
peak load, residual strength and energy
absorption results for the laboratory
tested shotcrete specimens

EFNARC BEAMS ASTM BEAMS EFNARC PANELS RDP
Fibre Type Fibre density Fibre UCS Flexural Residual strength (N/mm²) Energy Modulus Toughness indices Energy Peak Energy Peak Energy
content strength absorption of rupture absorption Load absorption Load absorption
(Kg/m³) (Kg/m³) (Mpa) (N/mm²) 0.5mm 1.0mm 2.0mm 4.0mm (joules) (N/mm²) I5 I10 I20 I30 I50 (joules) (KN) (joules) (KN) (joules)
1 - 45.00 8.86 5.18 1.57 0.20 0.07 18.74 6.69 4.39 7.05 9.27 9.78 10.15 8.25 46.00 94.00 42.30 90.001 - 47.00 9.50 6.19 1.87 0.22 0.07 19.21 7.04 4.32 6.82 8.91 9.59 10.88 8.00 53.00 188.00 45.60 75.00
Polypropylene 1 - 46.00 9.16 5.55 1.44 0.14 0.07 17.66 6.49 4.64 8.34 13.20 15.44 17.12 7.40 70.00 401.00 38.10 90.001 47.00 452.00
2 - 45.50 9.81 6.40 2.03 0.22 0.07 20.26 4.30 4.65 8.32 12.95 15.15 17.10 14.31 37.00 262.00 46.20 153.002 - 45.00 8.71 5.30 1.39 0.21 0.07 17.40 4.55 4.38 7.08 9.67 10.59 11.28 15.69 64.00 320.00
Polypropylene 2 - 42.00 7.97 3.50 0.30 0.45 0.45 13.19 4.29 4.46 7.45 10.68 12.02 13.12 13.40 83.00 926.00 28.50 139.002 87.00 227.00 40.70 182.00
3 - 45.00 9.92 4.44 0.85 0.66 0.76 13.59 8.07 4.54 7.83 11.33 12.69 14.97 35.04 37.00 318.00 60.10 260.003 - 58.00 10.73 6.79 1.97 0.08 0.47 20.42 7.04 4.46 7.53 11.06 12.82 15.69 29.51 62.00 464.00 60.10 310.00
Polypropylene 3 - 46.00 9.07 2.55 0.47 0.66 0.94 11.86 9.72 4.65 8.40 12.73 13.84 15.02 42.40 88.00 711.00 55.50 280.003 - 46.60 274.00
4 - 47.50 9.41 3.49 1.18 1.60 1.81 25.94 9.91 4.54 7.80 10.77 11.49 13.24 36.58 30.00 326.004 - 54.00 9.94 5.69 1.10 1.37 1.85 28.31 7.17 4.43 7.31 10.31 11.84 14.83 32.10 60.00 717.00 46.60 256.00
Polypropylene 4 - 47.00 8.17 2.90 1.15 1.08 1.35 20.88 8.42 4.59 8.13 12.21 13.89 16.83 37.62 57.00 579.00 24.50 265.004 - 77.00 893.00
5 - 49.00 9.07 3.94 1.58 0.59 0.89 13.19 9.44 4.77 8.92 15.48 18.73 22.02 67.19 28.00 559.00 32.00 279.00Polypropylene 5 - 49.50 9.72 5.01 2.11 0.90 1.10 16.20 8.94 4.66 8.43 13.46 15.59 16.37 53.67 49.00 450.00 32.40 294.00
5 - 55.00 9.01 4.00 1.60 0.60 0.07 12.87 9.07 4.69 8.55 13.87 16.31 18.90 52.52 28.00 447.00 25.40 294.005 - 37.50 548.00
6 - 52.00 7.01 1.90 1.50 1.70 2.10 13.94 8.85 4.63 8.38 13.92 16.58 19.30 19.12 64.00 825.00 42.70 377.00Polypropylene 6 - 50.50 7.25 1.73 1.73 1.95 1.84 16.10 9.23 4.65 8.42 12.76 14.35 17.23 19.01 80.00 858.00 29.00 348.00
6 - 47.50 7.57 2.09 1.30 1.49 1.40 15.63 7.00 4.22 7.12 12.73 18.65 30.10 29.42 36.00 687.00 30.90 383.006 - 41.00 746.00 29.80 439.00
7 - 52.50 6.98 1.60 1.40 1.70 1.80 14.52 8.65 4.52 7.76 11.12 12.82 16.84 16.25 62.00 1238.00 36.90 455.00Polypropylene 7 - 50.50 6.94 1.88 1.53 1.77 2.12 13.77 9.14 4.62 8.09 11.75 13.65 18.35 21.50 58.00 1246.00 25.80 451.00
7 - 54.00 6.28 1.68 1.68 1.91 2.02 14.00 8.68 4.42 7.05 10.14 13.01 19.13 21.75 38.00 799.00 33.30 440.007 - 24.90 349.00
8 - 47.00 6.50 1.83 2.03 2.24 2.24 17.54 9.42 4.58 7.98 12.08 14.65 20.17 23.63 60.00 1019.00 23.10 209.00Polypropylene 8 - 44.00 6.49 1.70 1.38 1.60 1.81 13.56 7.65 4.34 6.80 9.80 12.72 18.92 20.35 85.00 1153.00 27.40 506.00
8 - 48.00 6.58 2.03 1.32 1.22 1.32 12.33 9.44 4.63 8.13 12.42 15.22 21.27 27.01 59.00 1195.00 31.90 670.008 - 83.00 788.00 36.80 540.00
40 29.54 61.00 5.89 3.12 3.47 3.12 2.08 20.92 9.09 4.46 7.46 11.95 15.75 21.68 22.93 75.00 538.00 25.00 343.00steel fibres 40 30.50 59.00 6.60 3.41 3.53 2.96 1.71 20.68 7.71 4.30 7.09 11.75 16.27 23.80 20.59 58.00 520.00 25.00 343.00
40 30.52 62.50 6.01 2.51 2.62 2.29 1.09 16.35 7.72 4.05 6.63 11.44 15.51 21.34 23.26 79.00 897.0040 56.00 639.00
55 30.59 59.50 5.64 4.04 4.68 4.47 2.02 27.72 6.24 4.59 8.71 17.34 25.96 40.85 37.64 130.00 1047.00 32.30 605.00steel fibres 55 42.02 59.50 5.89 2.85 2.95 2.55 1.57 20.00 7.27 4.42 7.76 14.01 20.30 32.73 30.66 54.00 866.00 27.40 466.00
55 36.77 52.50 5.82 3.30 3.85 3.41 1.87 22.54 8.46 4.34 7.52 13.61 19.27 28.32 29.24 70.00 1018.0055 104.00 1051.00
70 55.79 60.50 8.16 5.14 5.25 5.37 3.35 34.76 8.38 4.70 9.17 18.39 27.04 41.51 37.53 84.00 1245.00 44.40 664.00steel fibres 70 54.10 62.50 9.07 5.70 4.75 3.59 2.00 27.74 9.31 4.23 7.03 12.19 17.10 25.44 28.50 110.00 1404.00 47.70 678.00
70 58.93 60.50 8.12 5.28 4.75 3.69 2.11 28.09 9.52 4.43 7.99 14.85 20.84 29.74 37.61 85.00 1206.00 40.80 568.0070 130.00 1446.00 38.90 696.00