investigation report crowded house - shelter...
TRANSCRIPT

Investigation report
Crowded houseCramped living in England’s housing
From the Shelter policy library
28 October 2004
www.shelter.org.uk
By Liam Reynolds, Nicola Robinson, and Rita Diaz.
Census data is used with permission and is Crown Copyright.Bedroom standard data is used with thanks to the ODPM.
© 2004 Shelter. All rights reserved. This document is only for your personal, non-commercial use.You may not copy, reproduce, republish, post, distribute, transmit, or modify it in any way.
This document contains information and policies that were correct at the time of publication.

Crowded house
DOWNLOADED FROM THE SHELTER WEBSITE www.shelter.org.uk2004 Shelter© 2
Contents
Foreword Page 3
Key research findings Page 4
Policy background Page 7
Research background and methodology Page 9
How big is the problem? Page 10
Who is most likely to suffer overcrowding? Page 11
Families with children Page 17
Trends in overcrowding Page 21
Why hasn’t more progress been made? Page 26
Is the redistribution of under-occupied or empty housing the answer? Page 31
Policy recommendations Page 33
Appendix one: The three main ways of measuring overcrowding Page 35
Appendix two: Additional charts and tables Page 36
Appendix three: Local authority duties Page 37

Crowded house
DOWNLOADED FROM THE SHELTER WEBSITE www.shelter.org.uk2004 Shelter© 3
Foreword
Nearly one child in ten is living in overcrowded housing, a problem that affects at least half
a million households in England. In the social housing sector in London, nearly one child
in three lives in overcrowded housing, and, among black and minority ethnic (BME)
groups, up to one in five households lacks sufficient rooms.
Overcrowding matters because it impacts on all aspects of people’s lives. For children, it
means increased risk of infections and a lack of space and privacy, which can affect how
they do at school. For parents, it is a barrier to providing positive opportunities for their
children and a constant cause of anxiety and depression.
Despite the Government’s ambitious target on child poverty, and the raft of measures that
are beginning to make an impact, in the last seven years there has been no reduction in
the proportion of overcrowded households. In the worst affected areas – London and in
the social housing sector – the proportion of overcrowded households has risen since
1997. Severe overcrowding in London increased by 60 per cent between the 1991 and
2001 Censuses.
The reasons behind this are simple. The number of social-sector homes built seven years
ago, in 1996/97, was nearly double the number completed in 2003/04. In addition, the
stock of family-sized homes has been reduced under Right to Buy policies while house-
price rises have excluded more and more families from suitable, affordable housing in the
private sector.
In a country increasingly obsessed with house prices and home improvement, the growing
inequality in housing is marginalising a whole section of society, with consequences that
are only just beginning to register in the political arena.
Shelter is undertaking a major investigation into this national crisis, beginning on October
28, 2004. Journalist Fiona Millar will chair the investigation panel as it tours the country,
visiting families suffering in bad housing, and taking evidence from the professionals and
politicians who see the reality of the housing crisis every day.
This research report for Shelter’s Housing Investigation is the first in a series of four, each
tackling a different aspect of the housing crisis. It calls for a significant investment boost
for affordable housing, to tackle overcrowding. Until that happens, hundreds of thousands
of families will continue to suffer.

Crowded house
DOWNLOADED FROM THE SHELTER WEBSITE www.shelter.org.uk2004 Shelter© 4
Key research findings
The extent of the overcrowding problem is difficult to measure. The existing measure thatthe Government uses is out of date and must be changed. For the purposes of this report,figures and statistics will be based on the widely used bedroom standard, unlessotherwise stated. This decides how rooms can be shared, taking into account the age,gender, and marital status of occupants. More detail on overcrowding measurements canbe found in Appendix one.
How big is the overcrowding problem and who does it affect?
• There are over half a million overcrowded households in England. Close to 50,000 ofthese are severely overcrowded, needing at least two more rooms to adequatelyaccommodate all household members.
• Close to three-quarters of overcrowded households are families with children.
• Nearly one child in every ten in England – 900,000 children – lives in overcrowdedconditions. More than 100,000 are in severely overcrowded housing.
• Over a third (35 per cent) of overcrowded households live in London, with parts ofinner and east London worst affected.
• In London’s social housing, nearly one child in every three lives in an overcrowdedhome. It is little better in London’s private-rented sector, where one child in every fourlives in overcrowded conditions.
• Black and minority ethnic (BME) households are more than six times more likely to beovercrowded than white households. More than half of the overcrowded households inLondon have a household member from a BME group. Bangladeshi, Pakistani, andBlack African families are particularly likely to be overcrowded.
• While BME groups have a higher likelihood of living in a large household or in theLondon social sector, other factors such as social deprivation1 and discrimination inhousing2 are likely to play a part in these high rates.
• Although the highest rates of overcrowding are found in London and in the socialsector, there are more than 330,000 overcrowded households outside London. Also,more than 200,000 owner-occupied households are overcrowded.
1 National Strategy for Neighbourhood Renewal (Social Exclusion Unit 2000) and Social ExclusionUnit website: http://www.neighbourhood.gov.uk2 Office of the Deputy Prime Minister (May 2003): Housing and Black and Minority EthnicCommunities: Review of the evidence base

Crowded house
DOWNLOADED FROM THE SHELTER WEBSITE www.shelter.org.uk2004 Shelter© 5
What impact does overcrowding have on families?
Living in cramped conditions can have a detrimental affect on children’s health, education,and general well-being. Overcrowding can increase the spread of illness and causeunsettled sleep patterns. It impacts on privacy for all family members, and can make itharder for children to find a quiet space to read or do their homework. It can also affect thequality of relationships between parents and children, and between siblings.
Is the overcrowding problem getting smaller?
• No. The latest data from 2002/03 showed the same proportion (2.5 per cent) ofovercrowded households in England as there was in 1996/97.
• The number of severely overcrowded households in London increased by 60 percent between 1991 and 2001 on the measure of persons per room from the Census.
• While the rate of overcrowding among some groups, such as owner-occupiers andthose living in the South of England, outside of London, has decreased in the lastseven years, since 1997 there has been an increase in overcrowding in the socialsector, the private-rented sector, and in London.
• Family-sized properties are in great demand in the social rented sector, with close toa quarter of the 1.25 million households on local authority housing registers inEngland specifically requiring properties with three or more bedrooms.
Why is this problem continuing?
• Social housing, as a proportion of England’s total housing stock, has contracted byaround a third over the last 20 years. There were 300,000 fewer homes in the socialsector in 2003 than in 1997.
• The number of newly constructed units of social housing is low and has decreasedeach year from 1995/96 to 2002/03. The number built in 2003/04 (13,800) was onlyjust over half the number built seven years previously in 1996/97 (25,200).
• Properties with four or more bedrooms constituted only one in 14 of the newlyconstructed social homes completed in the last seven years.
• Some 373,000 homes have been lost from the social sector via the Right to Buyinitiative since 1997/98. Over 71,000 of these were in London.
Is the redistribution of under-occupied or empty homes the answer?
• Redistributing under-occupied housing will not solve overcrowding. In the Londonsocial sector, where overcrowding is most acute, overcrowded households outnumberunder-occupied households by nearly two to one. However, there is limited scope toprovide incentives for households to move to smaller properties or lower-demandareas.
• It is not practically or politically possible to propose large-scale redistribution ofhouseholds, not least because close to 90 per cent of under-occupied homes areprivately owned.
Crowded house
DOWNLOADED FROM THE SHELTER WEBSITE www.shelter.org.uk2004 Shelter© 6
• Government initiatives to bring empty homes into use are widely welcomed. However,as the majority are privately owned and rates of disrepair and neglect are high, there islimited scope for significantly reducing overcrowding.
Policy recommendations
Real improvement on overcrowding will only be brought about through a long-termstrategy that aims to tackle overcrowding against measures acceptable by today’s modernliving standards. This requires:
• greater provision of affordable, family-sized homes
• an emergency programme of acquisitions and other initiatives to increase socialhousing
• a nationally recognised measure of overcrowding, based on the bedroom standard,which is acceptable by today’s living standards
• an overcrowding target (similar to the decent homes standard) that could be workedtowards over the next ten years
• incorporating the needs of BME communities into regional and local housing strategies
• ensuring that the funding criteria and the planning system encourage the provision ofthe larger, three- and four-bedroom properties that are desperately needed
• greater financial incentives to persuade people who are under-occupying in the socialsector to move and free up larger homes
• more initiatives to persuade people to move from high-demand to lower-demand areas
• measures to discourage private owners from leaving their properties empty for longperiods of time.

Crowded house
DOWNLOADED FROM THE SHELTER WEBSITE www.shelter.org.uk2004 Shelter© 7
Policy background
What is wrong with the existing standard?
Under the existing definition of statutory overcrowding, children under the age of 12months are not counted as members of the household, and those between one, and ten,years old are counted as half a person. The definition includes living rooms, and evenlarge kitchens, as acceptable places to sleep. Unlike the bedroom standard, it does notconsider reasonable levels of bedroom-sharing in accordance with modern livingstandards. It has remained unchanged since its introduction in 1935, in response to theneed to improve the slum living conditions of the inter-war period.The result is that familieswith children must endure very high levels of overcrowding before the statutory thresholdis breached.
Case study
Melanie and Colin live in a two-bedroom property with a separate living room and kitchen.The household includes the couple’s five children – two girls and three boys – who are allunder ten, plus Melanie’s two teenage nieces. This amounts to nine people living in a two-bedroom property, but the existing statutory overcrowding measure only recognises sixand a half of them. It also deems it acceptable for members of the household to sleep inthe living room or the kitchen, so they may not technically be overcrowded.This demonstrates that the existing statutory standard is completely outdated andbears no relation to modern living standards.
Shelter London Housing Aid Centre
What is the Government doing about it?
During the course of the current Housing Bill, the Government introduced an amendmentgiving a power to enable the statutory definition of overcrowding (outlined above) to be setby regulations. The amendment was accompanied by a literature review of research onthe link between overcrowding and poor health and educational attainment, and newanalysis on the extent of overcrowding throughout England based on the bedroomstandard.
The bedroom standard incorporates assumptions about acceptable levels of sharing – astandard which the ODPM research outlined as being at the ‘margin of acceptability’ bytoday’s living standards.3 The bedroom standard is explained fully in Appendix one.
However, the Government has concerns about introducing a measure based on thebedroom standard as, in contrast to only 20,000 households breaching the existingstandard, applying the bedroom standard increases the number of overcrowdedhouseholds to over 500,000 (2.4 per cent of the population). Their main opposition is thatthis increase will place added pressure on local authorities.
3 ODPM, Overcrowding in England 2000-2003, April 2004

Crowded house
DOWNLOADED FROM THE SHELTER WEBSITE www.shelter.org.uk2004 Shelter© 8
What is Shelter’s view?
Whilst Shelter welcomes the Government’s commitment to change, in order to worktowards creating a system that makes a real difference to the people suffering inovercrowded conditions, we believe regulations must introduce a nationally acceptedmeasure based on the bedroom standard.
Unless this opportunity is taken, the Government will not deliver on its commitmentto end child poverty and will fail to meet the housing needs of black and minorityethnic communities.
We recognise that this has been a difficult decision for the Government and that somelocal authorities have expressed concern that it might add to the pressure on socialhousing and distort allocations policies. However, as the Minister, Keith Hill, made clear inanswer to a recent Parliamentary Question, statutorily overcrowded households are onlygiven ‘reasonable preference’ and not extra priority ahead of others in more immediatehousing need.4
Neither will statutory overcrowding be anything more than ‘a relevant consideration’ inreaching a decision on whether it is reasonable for an overcrowded household, applyingas homeless under section 175 of the Housing Act 1996, to continue to occupy theircurrent accommodation. Clearly, the general circumstances prevailing in relation tohousing in the district will continue to constitute the most important consideration in thelocal authority’s decision, and so a higher standard would not lead to an increase in thenumbers of overcrowded households being accepted as homeless.
Instead, these changes could ensure that the problem of overcrowding can be properlymeasured. This would establish a true picture of the extent of modern day overcrowdingand assist in making more accurate assessments of housing need, particularly thenumbers of family-sized homes required. (A full explanation of the current legislation andlocal authority duties that relate to overcrowding are outlined at Appendix three).
In order to tackle overcrowding, we believe the new standard should form the basisfor a target (similar to the decent homes standard) that could be worked towardsover the next ten years.
A consultation paper, setting out options for defining new overcrowding standards, is likelyto be published later this year.
4 House of Commons, Official Report, 18 November 2003: Column 807W (see Annex B)

Crowded house
DOWNLOADED FROM THE SHELTER WEBSITE www.shelter.org.uk2004 Shelter© 9
Research background and methodology
Research can explain the overcrowding problem in two ways:
• measuring the size of the problem among different groups, through housing surveys
and the Census
• understanding its impact through interviews and stories from families suffering
overcrowding.
The most commonly used way of measuring the size of the overcrowding problem is byusing the bedroom standard, which is used in Government housing surveys. This is themeasure on which Shelter is basing its recommendations for a new way of measuringovercrowding, as discussed in the policy background section. The bedroom standardtakes family relationships, and the ways in which bedrooms can be shared, into account.
The Census has the advantage of collecting data from almost every household in Englandand Wales, but the measures of overcrowding it uses are different to the bedroomstandard. The occupancy rating from the Census is over-generous, as it allows everyhousehold two common rooms and counts some one-person households as beingovercrowded. The measure of persons per room used on the Census, is not sensitive tothe way in which bedrooms can be shared.
This report mainly uses the bedroom standard to estimate the size of the overcrowdingproblem. Census data is included where it helps to show the full extent of the problem.
Appendix one, at the end of the report, provides more detail on the most commonly usedmeasures of overcrowding, along with the benefits and limitations of each.
This report also:
• shows findings from existing qualitative research, to understand the impact ofovercrowding on the everyday routines, health, work, and education of familiesand children
• illustrates this further with case studies from Shelter’s clients
• examines the trends in some of the many factors that have contributed, andcontinue to contribute, to the overcrowding problem.
Shelter will be undertaking new, primary research into overcrowding, and the findings fromthis will be published next year.

Crowded house
DOWNLOADED FROM THE SHELTER WEBSITE www.shelter.org.uk2004 Shelter© 10
How big is the problem?
How many households are overcrowded in England?
Table 1, below, shows that just over half a million households lack one or more roomsaccording to the bedroom standard. Of these, just under 50,000 are severely overcrowded– lacking two or more rooms.
This estimate is based on an aggregation of data from the most recent four years ofhousing surveys conducted by the Government. The columns on the right-hand side showthe number of overcrowded households, using the persons-per-room measure from theCensus.
Table 1: Number and proportion of overcrowded and severely overcrowdedhouseholds in England, bedroom standard, and persons-per-room measures.
Bedroom standard Census – persons-per-roomOvercrowded:lacking oneroom or more
Of whichseverelyovercrowded:lacking two ormore rooms
Overcrowded:more than oneperson perroom
Of which severelyovercrowded:more than 1.5persons per room
Number andproportion ofhouseholds
510,000 (2.4%) 48,000 (0.2%) 387,000 (1.9%) 117,000 (0.6%)
Sources: ODPM ‘Overcrowding in England’ 2000-2003, and Census 2001, figures roundedto nearest thousand.

Crowded house
DOWNLOADED FROM THE SHELTER WEBSITE www.shelter.org.uk2004 Shelter© 11
Who is most likely to suffer overcrowding?
Which areas have the most overcrowded households?
Table 2 shows that the number and rate of overcrowded households is significantly higherin London than the rest of England and Wales. London households are more than threetimes more likely to be overcrowded than most other regions. London households accountfor just over a third of all overcrowded households (37 per cent on the persons-per-personmeasure and 35 per cent on the bedroom standard).
The north west, the West Midlands, and the south east of England contain relatively highnumbers of overcrowded households, with more than 50,000 lacking one room or more onthe bedroom standard.
Table 2: Number and proportion of overcrowded households by region,bedroom standard, and persons per room.
Region Overcrowded: lackingone room or more onbedroom standard
Overcrowded: morethan one person perroom
England 510,000 (2.4%) 387,000 (1.9%)North east 18,800 (1.7%) 12,798 (1.2%)North west 60,000 (2.1%) 40,700 (1.4%)Yorkshire and the Humber 40,300 (1.9%) 32,200 (1.6%)East Midlands 30,000 (1.7%) 21,000 (1.2%)West Midlands 51,800 (2.4%) 39,000 (1.8%)East 35,900 (1.6%) 27,300 (1.2%)London 174,200 (5.9%) 150,000 (5.0%)South east 57,500 (1.8%) 43,000 (1.3%)South west 33,000 (1.6%) 21,000 (1.0%)Sources: Census 2001, and ODPM ‘Overcrowding in England’ 2000-2003, figuresrounded to nearest hundred.
Where, exactly, is overcrowding most common?
The three local authorities with the highest rates of overcrowding are the same on bothmeasures, see Table 3. These areas are all in the inner and east part of London.Additional analysis by London Housing5 shows that there are some wards where close toone in five households are overcrowded on the persons-per-room measure, with the mostextreme example being a ward in Newham, where 21 per cent of households containabove one person per room.
5 ‘Overcrowding in London - briefing’ (Gleeson), London Housing (ALG), March 2004

Crowded house
DOWNLOADED FROM THE SHELTER WEBSITE www.shelter.org.uk2004 Shelter© 12
Table 3: The three local authorities with the highest rates of overcrowding inEnglandLocal authority Overcrowded: lacking one
room or more onbedroom standard
Overcrowded: more thanone person per room
Newham 15,000 (15%) 11,000 (12.0%)Tower Hamlets 12,000 (14%) 9,800 (12.5%)Hackney 9,000 (10%) 7,800 (9.1%)Sources: ODPM ‘Overcrowding in England’ 2000-2003, and Census 2001. Bedroomstandard figures are adjusted estimates and rounded to nearest thousand, persons-per-room figures rounded to nearest hundred.
The ten local authorities with the highest rates of overcrowding on the bedroom standardare all in London. Seventeen of the top 20 are in London. Despite this, there are some330,000 overcrowded households outside of London. Table 4 shows the areas outsideLondon that have the highest rates of overcrowding.
Table 4: Areas outside London with the highest rates of overcrowding, bedroomstandard, and persons per room.
Area Overcrowded: lackingone room or more onbedroom standard
Overcrowded: more thanone person per room
Leicester 7,000 (6%) 4,200 (3.8%)Slough 3,000 (6%) 2,700 (6.0%)Birmingham 19,000 (5%) 14,100 (3.6%)Sandwell (West Midlands) 5,000 (4%) 2,900 (2.5%)Knowsley (Merseyside) 3,000 (4%) 1,100 (1.8%)Luton 4,000 (3%) 3,000 (4.2%)Sources: ODPM ‘Overcrowding in England’ 2000-2003, and Census 2001. Bedroomstandard figures are adjusted estimates, and rounded to nearest thousand, persons-per-room figures rounded to nearest hundred.
Which types and sizes of household are most likely to be overcrowded?
Table 5, on the next page, shows particularly high rates of overcrowding amongst loneparents with dependent children. This group accounts for nearly a quarter of allovercrowded households, whereas they account for less than seven per cent of allhouseholds in England.
Couples with dependent children constitute close to half of all overcrowded households,whilst less than a quarter of all households in England are of this type. Multi-personhouseholds, which are likely to be comprised of single people sharing, are also likely to beovercrowded.
The section focusing on families with children, on page 17, provides more detail onovercrowding amongst families with children.

Crowded house
DOWNLOADED FROM THE SHELTER WEBSITE www.shelter.org.uk2004 Shelter© 13
Table 5: Number and proportion of overcrowded households by householdtype, bedroom standard.
Household type Overcrowded: lacking one room ormore on bedroom standard
Couple, no dependent children 39,500 (0.5%)Couple with dependent children 240,600 (5.4%)Lone parent with dependent children 121,100 (9.0%)Other/ multi-person 100,500 (7.5%)Total households 510,000 (2.4%)Sources: ODPM ‘Overcrowding in England’ 2000-2003, figures rounded to nearesthundred, total households figure rounded to the nearest thousand. One-personhouseholds are not included.
Table 6, below, shows that the likelihood of being overcrowded increases sharply whenthe number of people in the household reaches five or more.
Table 6: Number and proportion of overcrowded households by household size,bedroom standard, and persons per room.
Household size Overcrowded: lackingone room or more onbedroom standard
Overcrowded: more thanone person per room
One or two people inhousehold
48,500 (0.4%) 30,900 (0.2%)
Three or four people inhousehold
179,700 (3.0%) 99,000 (1.7%)
Five or more people inhousehold
274,900 (19.7%) 246,000 (17.3%)
Sources: ODPM ‘Overcrowding in England’ 2000-2003, and Census 2001, figuresrounded to nearest hundred.
Do rates of overcrowding differ by tenure?
Table 7, on the next page, shows that the highest rates of overcrowding, on bothmeasures, are found in the social-rented sector. In London, nearly one in eight (93,700;12 per cent) of households renting from councils and registered social landlords (RSLs)are overcrowded, based on the bedroom standard.

Crowded house
DOWNLOADED FROM THE SHELTER WEBSITE www.shelter.org.uk2004 Shelter© 14
Table 7: Number and proportion of households overcrowded on bedroom standardand persons-per-room measures, by tenure, bedroom standard and persons-per-room.
Tenure Overcrowded: lackingone room or more onbedroom standard
Overcrowded: more thanone person per room
Social rented 218,200 (5.4%) 158,000 (4.0%)Owner–occupied 204,000 (1.4%) 157,700 (1.1%)Private rented 80,300 (3.8%) 71,100 (2.9%)Sources: ODPM ‘Overcrowding in England’ 2000-2003, and Census 2001, figuresrounded to nearest hundred.
In Yorkshire and the north east of England, the private-rented sector has a higherproportion of households lacking a room on the bedroom standard than other tenures.Within the social sector, households renting from councils have been slightly more likely tobe overcrowded than those renting from RSLs, in each of the last four years.
Although the rate of overcrowding is relatively low amongst owner-occupiers in England,they account for four in every ten (41 per cent) of households lacking one room or more inaccordance with the bedroom standard; some 200,000 households.
Do rates of overcrowding differ by ethnic group?
Table 8, below, shows that black and minority ethnic (BME) groups are more than sixtimes more likely than white households to be overcrowded. BME households account fornearly a third (32 per cent) of overcrowded households on the bedroom standard, despitethe 2001 Census showing that BME households account for just under seven per cent ofall households in England.
More than half (51 per cent) of overcrowded households in London are from BME ratherthan white ethnic groups. These households accounted for 23 per cent of the total Londonpopulation in the 2001 Census.
Table 8: Number and proportion of overcrowded households by white and BMEgroups, England and London, bedroom standard.
Ethnic group ofhousehold referenceperson
Overcrowded: lacking oneroom or more on bedroomstandard – England
Overcrowded: lacking oneroom or more on bedroomstandard – London
White (inc. White Irish) 339,600 (1.8%) 83,600 (3.6%)BME 159,200 (11.1%) 87,600 (12.6%)Sources: ODPM ‘Overcrowding in England’ 2000-2003, figures rounded to nearest hundred.Numbers of London households derived from Census population statistics.
Reliable data by individual ethnic group is more difficult to obtain, because of the samplesizes involved. The ODPM has produced data for Shelter that aggregates four years ofhousing survey results, to give a good indication of the numbers and rates ofovercrowding amongst specific BME groups.

Crowded house
DOWNLOADED FROM THE SHELTER WEBSITE www.shelter.org.uk2004 Shelter© 15
Table 9, below, shows the results of this analysis. From this, we can see that theaggregated BME data in table 4 disguises significant differences between individual ethnicgroups. Nearly a third (30.5 per cent) of Bangladeshi households are lacking at least oneroom on the bedroom standard, and a Bangladeshi household is close to 18 times morelikely to be overcrowded than a white household. The rate of severe overcrowdingappears to be even higher amongst Pakistani households than Bangladeshi households(five per cent).
Table 9: Number and proportion of households overcrowded and severely
overcrowded by individual ethnic group, bedroom standard.
Ethnic group ofhousehold referenceperson
Overcrowded: lackingone room or more onbedroom standard
Of which severelyovercrowded: lacking two ormore rooms on bedroomstandard
Bangladeshi 19,100 (30.5%) 2,600 (4.1%)Pakistani 37,200 (21.2%) 8,700 (5.0%)Black: African 23,100 (13.5%) 2,600 (1.6%)Indian 27,200 (8.8%) 4,300 (1.4%)Chinese 4,500 (7.7%) 300 (0.5%)Other or mixed 33,600 (7.6%) 3,400 (0.8%)Black: Caribbean 17,000 (6.8%) 2,100 (0.8%)Black: Other 2,700 (6.4%) -White 327,100 (1.7%) 22,100 (0.1%)Sources: ODPM data from Survey of English Housing 2000-2003 combined, figuresrounded to nearest hundred.
Although people in BME groups are more likely to form larger households and live inLondon and in the social sector, similarly-sized white households in the same areaand housing sector are less likely to be overcrowded. So it is not the case that certainBME groups are overcrowded just because they have larger families or are more likelyto live in areas where overcrowding is already a problem.
Case study
Mrs Wek’s family is made up of two adults and four children. The family lives in a one-bedroom council flat and is Somali speaking. One of the children, Aziza, suffers fromepilepsy. They have been told that they are 62nd on the register to be re-housed, which, inLondon, means they are likely to have to wait for at least five years.
Mrs Wek is concerned that her children have no space to play or learn.
Shelter London Housing Aid Centre

Crowded house
DOWNLOADED FROM THE SHELTER WEBSITE www.shelter.org.uk2004 Shelter© 16
Case study
Mr Khan, a housing association tenant in the north-west of England approached Shelterafter waiting two years for a transfer from the one bedroom flat he shared with his wifeNazreen and their two young children. The property was also damp and the health of thefamily was beginning to suffer. Shelter helped the client access a larger property after afurther six months.
Shelter Lancashire Housing Aid Centre

Crowded house
DOWNLOADED FROM THE SHELTER WEBSITE www.shelter.org.uk2004 Shelter© 17
Families with children
How many families with children are overcrowded?
Table 10, below, shows that 362,000 families with children are overcrowded according tothe bedroom standard. This is likely to be a slight underestimate, as it may not includehouseholds where a dependent child is living with people who are not their parents.
Table 10 also shows the number of children living in overcrowded households. Thefigures for regions outside London are derived estimates. Table 11, on the next page,provides more detail on children living in overcrowded conditions in England and inLondon.
Families with children constitute around three-quarters (at least 72 per cent) of allovercrowded households, despite accounting for little more than a quarter (28 per cent) ofall households in England. They are more than twice as likely as all households to beovercrowded (6.3 per cent of families with children are overcrowded, national average is2.4 per cent).
In London, one in every seven (13.8 per cent) families with children is overcrowded.
Table 10: Number and proportion of families with children and children lackingrooms on the bedroom standard, by region.Region Families with children
lacking one or morerooms on bedroomstandard
Children lacking one ormore rooms on bedroomstandard
England 361,800 (6.3%) 905,000 (9.2%)North-east 11,800 (3.9%) 31,400 (6.3%)
North-west 46,700 (5.6%) 123,800 (8.9%)Yorkshire and the Humber 32,400 (5.5%) 86,000 (8.5%)
East Midlands 21,900 (4.6%) 57,900 (6.9%)West Midlands 36,700 (6.0%) 97,300 (8.9%)
East 26,600 (4.3%) 70,400 (6.5%)London 118,700 (13.8%) 261,000 (18.1%)South-east 41,100 (4.6%) 109,000 (6.9%)South-west 25,800 (4.6%) 68,200 (7.3%)Source: ODPM data from Survey of English Housing 2000-2003 combined, figuresrounded to nearest hundred. Figures for children in regions other than London arederived estimates, and proportions are calculated using Census data.
How many children live in overcrowded households?
Table 11, on the next page, combines two years of housing survey data to show thenumber of children living in overcrowded and severely overcrowded conditions in Englandand in London. It is likely to be a slight underestimate, as only children up to the age of 15are counted.

Crowded house
DOWNLOADED FROM THE SHELTER WEBSITE www.shelter.org.uk2004 Shelter© 18
Table 11, below, shows that over 900,000 (close to one in ten) children in England lackrooms according to the bedroom standard. Of these, over a hundred thousand are lackingtwo or more rooms and are severely overcrowded.
In London, over a quarter of a million (close to one in five) children are overcrowded onthe bedroom standard. Over 40,000 are severely overcrowded. The likelihood of a child inLondon living in an overcrowded household is almost double the average for all children inEngland.
Table 11: Number and proportion of children (0 – 15-years-old) lacking rooms onthe bedroom standard, England and London.Region Overcrowded: lacking one or
more rooms on bedroomstandard
Of which severelyovercrowded: lacking two ormore rooms
England 905,000 (9.2%) 109,000 (1.1%)London 261,000 (18.1%) 41,000 (2.8%)
Source: ODPM, Survey of English Housing 2002 and 2003 combined.
Additional data reveals that children living in social and privately rented housing in Londonare particularly likely to live in overcrowded conditions. Close to one in every three (30per cent) children in social housing in London live in an overcrowded household. In theLondon private-rented sector, one child in every four (26%) suffers overcrowding.
Case study
Rachel lives with her husband and their two sons, Laurie and Tom (13 and three), in aone-bedroom, housing association flat. Despite the size of their accommodation and theirkitchen being too small for a table, they may not be statutorily overcrowded. There are sixflights of stairs up to her flat and there is no lift.
Tom has epilepsy triggered by stress and there is nowhere secluded for him to go whenfitting. Laurie has Irritable Bowel Syndrome. Stress and overcrowding aggravates thiscondition.
Rachel suffers from inflammatory bowel disease and Crohn’s disease, causing frequentproblems with vomiting and diarrhoea. She needs to get up in the night and often wakesthe family. Rachel is concerned that there isn’t a quiet place in the home for Laurie tostudy and feels that overcrowding is having an adverse affect on his schooling.
Shelter London Housing Aid Centre

Crowded house
DOWNLOADED FROM THE SHELTER WEBSITE www.shelter.org.uk2004 Shelter© 19
Case study
Mick, a single parent, and his daughter Zoe visited Shelter’s outreach service. They hadbeen sharing the bedroom in a small one–bedroom flat for 18 months. They are on thehousing register, but have been told that their living arrangements are ‘suitable’ and thatthey are only halfway up the waiting list.
Shelter Somerset & Dorset Housing Aid Centre
What impact does overcrowding have on families?
Living in cramped conditions can have a detrimental effect on children’s health, educationand general well-being. Overcrowding can increase the spread of illness, make it harderfor children to find a quiet space to read or do their homework and cause unsettled sleeppatterns, particularly if different age siblings have to share rooms with each other or withtheir parents. It can also have a detrimental impact on the quality of relationships betweenparents and children, and between siblings.
Health
In May 2004, the Government published a literature review of existing research whichidentified the impact of overcrowding on people’s physical and mental health, education,child development and growth6. The review concluded that there were strong linksbetween overcrowding and particular health conditions, in both children and adults;including respiratory conditions, meningitis and helicobacter pylori which is a cause ofstomach ulcers.
‘Evidence from good quality large scale studies points to a relationship between
overcrowding in childhood and respiratory conditions in adulthood.’7
Studies have also found possible associations between overcrowding and child mortality.8
Well-being
The stress of sharing bedrooms and inadequate cooking, cleaning, and toilet facilities iswell documented as a cause of tension between family members in overcrowded homes.In some circumstances, it can lead to a breakdown in family relationships and tohomelessness for older ‘children’. The lack of privacy is a major concern for adults9, butcan be a particular problem for teenage girls sharing bedrooms with brothers or older
6 The Impact of Overcrowding on Health and Education, A Review of evidence and Literature,
ODPM, May 2004 (Centre for Comparative Housing Research and the Health Policy Research
Unit, De Montfort University)7 Ibid8 Ibid9 Elaine Kempson, Overcrowding in Bangladeshi households – A case study of Tower Hamlets,
Policy Studies Institute, 1999

Crowded house
DOWNLOADED FROM THE SHELTER WEBSITE www.shelter.org.uk2004 Shelter© 20
male relatives. Disturbed sleep patterns can be a particular problem for people having tosleep in communal rooms.10
Living in overcrowding conditions can make it difficult for families to spend their mealtimes together. A study of overcrowding in Tower Hamlets revealed problems with havingto prepare meals in kitchens that were too small, and families having to eat in shifts or intheir bedrooms.11
The tension and stress in an overcrowded environment can worsen existing healthproblems and often leaves parents, particularly mothers, suffering from anxiety anddepression.
Education
Living in cramped conditions can also affect children’s educational attainment.Overcrowding can make it hard for children to find a quiet space to read or do theirhomework, which becomes even more acute for those sitting GCSEs or A levels.12
Children sharing bedrooms or sleeping in living rooms often have their sleep disrupted byother family members. The Tower Hamlets study showed this to be a particular problem,where older siblings were arriving late from work and disrupting the sleep patterns of theiryounger siblings who were still at school.13
A French study on the links between overcrowding and children’s school performancefound a clear correlation between the two. It showed that ‘children who grow up in a homewith at least two children per bedroom are both held back and drop out of school beforeearning a diploma much more often than other children.’14 Using a sample of 15 year-olds, it also showed that 60 per cent of those living in overcrowded conditions had beenheld back a grade in primary or middle school.15
10 Elaine Kempson, Overcrowding in Bangladeshi households – A case study of Tower Hamlets,
Policy Studies Institute, 199911 Ibid12 Ibid13 Ibid14 Dominique Goux and Eric Maurin, The effects of overcrowded housing on children’s performance
at school, Paris, Centre for Economic Policy Research, March 200315 Ibid

Crowded house
DOWNLOADED FROM THE SHELTER WEBSITE www.shelter.org.uk2004 Shelter© 21
Trends in overcrowding
Overall trends
Chart 1 shows that little progress has been made in reducing overcrowding over the lastseven years.
Table 12, below, shows that the number of overcrowded households reduced significantlyin the 1980s and early 1990s. Despite this, the same proportion of households (2.5 percent) were below the bedroom standard in 2002/03 as they were in 1996/97. Morehouseholds (54,000) were lacking two or more rooms in comparison with the bedroomstandard in 2002/03 than in 1996/97 (52,000).
Chart 1: Trend in proportion of households lacking rooms on the bedroom standard, 1996/97 - 2002/03
0.0%
0.5%
1.0%
1.5%
2.0%
2.5%
3.0%
3.5%
4.0%
4.5%
5.0%
1996/7 1997/8 1998/9 1999/00 2000/1 2001/2 2002/3
Lack one room
Lack two ormore rooms
Table 12: Key data from Chart 1 – trend in number and proportion of householdsbelow bedroom standard (selected years)Rooms below bedroomstandard
1996/97 2002/03
Lack one room 456,000 (2.3%) 447,000 (2.2%)Lack two or morerooms
52,000 (0.3%) 54,000 (0.3%)
All lacking rooms 508,000 (2.5%) 501,000 (2.5%)Source for chart and table: Survey of English Housing 2002/03, ODPM website tableS132/A1.29. Figures rounded to nearest thousand.

Crowded house
DOWNLOADED FROM THE SHELTER WEBSITE www.shelter.org.uk2004 Shelter© 22
Have trends in overcrowding varied by tenure?
Table 13, below, shows that the proportion of households lacking one or more rooms onthe bedroom standard has decreased significantly since 1984 in all but the council-ownedsocial-rented sector and the private-rented sector, over the last seven years.
Table 13: Trend in number and proportion of households lacking one or more
rooms on the bedroom standard by tenure (selected years).
Tenure 1996/97 2002/03
Social rented (council) 181,000 (5.2%) 152,000 (5.6%)Social rented (RSL) 45,000 (4.5%) 54,000 (4.3%)Private rented 67,000 (3.3%) 87,000 (4.2%)Owner-occupier 216,000 (1.6%) 208,000 (1.4%)Source: Survey of English Housing 2002/03, ODPM website table S132/ A1.29. Figuresrounded to nearest thousand.
Have trends in overcrowding differed by region?
The regional trend on the bedroom standard is only readily available from 1999/00 to date.Table 14, below, shows that outside of London the rate of overcrowding has, at worst,remained steady, with indications of slight downward trends in the north and south-east,over the last four years. The rate of households falling below the bedroom standard inLondon, however, has increased by nearly one per cent over the last four years and therewere around 23,000 more overcrowded households in London in 2002/03 than in 1999/00.
Table 14: Trend in number and proportion of households lacking rooms on the
bedroom standard by region (selected years).
Region 1999/00 2000/01 2002/03
London 164,000 (5.4%) 178,000 (5.9%) 187,000 (6.3%)
South Engl (not inc. London) 134,000 (1.8%) 137,000 (1.8%) 114,000 (1.5%)
Midlands 80,000 (2.0%) 85,000 (2.2%) 86,000 (2.2%)
North England 126,000 (2.1%) 117,000 (1.9%) 115,000 (1.9%)
Source: Survey of English Housing 2002/03, ODPM website table S140. Figures rounded
to nearest thousand.
Is it possible to track trends in overcrowding amongst BME groups?
The small size of some BME groups makes trending, on the sample-based methodologyof the bedroom standard, difficult. The ODPM has produced an analysis for Shelter, whichshows a comparison between a combination of four years of data from the mid 1990s andthe most recent four years, split by BME group. This should still be treated as indicative,due to the sample sizes involved. A summary of this analysis is in Table 15 (next page)and it suggests that whilst the rates of overcrowding have decreased for most groups, thenumber of households affected by overcrowding have remained similar, or only increasedslightly, in most BME groups.

Crowded house
DOWNLOADED FROM THE SHELTER WEBSITE www.shelter.org.uk2004 Shelter© 23
Table 15: Trend in number and proportion of households lacking one or more
rooms on the bedroom standard by ethnic group, mid 1990s compared to latest
four years.
BME group 1993 - 1996 2000 - 2003
Bangladeshi 19,200 (42.4%) 19,100 (30.5%)
Pakistani 28,100 (23.7%) 37,200 (21.2%)
Black African 20,000 (17.9%) 23,100 (13.5%)
Indian 32,900 (12.5%) 27,200 (8.8%)
Chinese 3,100 (7.0%) 4,500 (7.7%)
Other or mixed 17,100 (8.0%) 33,600 (7.6%)
Black other 4,400 (10.0%) 2,700 (6.4%)
Black Caribbean 16,600 (6.8%) 17,000 (6.8%)
White 383,700 (2.0%) 327,100 (1.7%)
Source: ODPM data from Survey of English Housing, 2000-2003 and 1993-1996
combined and compared, figures rounded to nearest hundred.
What does comparing the 2001 Census results with the 1991 Census tell us about
the trend in overcrowding?
The Census data backs up the picture that emerges from the trends on the bedroomstandard above. Total overcrowding, in England as a whole, appears to be static. Thereare, however, more than 24,000 more households experiencing extreme overcrowding, onthe persons-per-room measure, in 2001 than in 1991 (see Chart 2, and the table beneathit, on the following page).
Chart 2, using Census data, also shows that London has experienced the sharpestincreases in overcrowding between 1991 and 2001. In 2001 there were more than 36,000more overcrowded households in London than there were in 1991, and the number ofhouseholds suffering severe overcrowding in London has increased by nearly 23,000households (a rise of 60 per cent).

Crowded house
DOWNLOADED FROM THE SHELTER WEBSITE www.shelter.org.uk2004 Shelter© 24
Chart 2: Trend in number of households overcrowded and severely overcrowded on persons-per-room measure
0
100,000200,000
300,000400,000
500,000
More than oneperson per room -
England
More than oneperson per room -
London
More than 1.5persons per room -
England
More than 1.5persons per room -
London
1991
2001
Table 16: Data from Chart 2, trend in number and proportion of households
overcrowded and severely overcrowded, on persons-per-room measure from Census.
Overcrowded – more than one
person per room
Of which severely overcrowded –
more than 1.5 persons per room
Year England London England London
1991 396,400 (2.1%) 94,500 (0.5%) 113,900 (4.1%) 38,200 (1.4%)
2001 386,800 (1.9%) 116,800 (0.6%) 150,000 (5.0%) 61,000 (2.0%)
% Change
1991 - 2001
- 2.4% + 31.7% + 23.6% + 59.7%
Source: 1991 and 2001 Census.
Waiting-lists for social housing
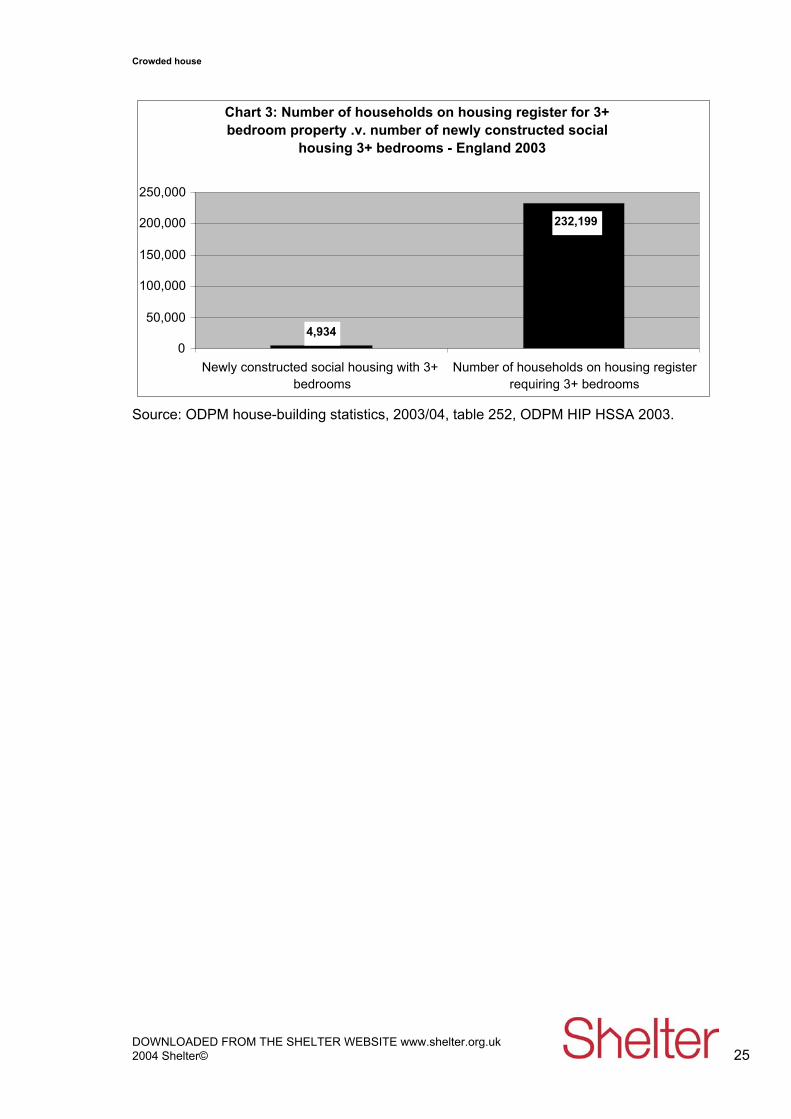
Data on the numbers of households on local authority housing registers and their sizerequirements can be analysed to give a further sense of the amount of demand-ledpressure on social housing. This is not intended to be an accurate predictor of the level ofovercrowding, as the current circumstances and size of these households is not knownfrom this data.
In 2003, there were over 1.25million households registered on the local authority waiting-lists for social housing in England, and this number has risen from just over a millionhouseholds in 2000. Close to a quarter of a million of these households requireproperties with three or more bedrooms. Less than 5,000 units of social housing withthree or more bedrooms were completed in 2003.16 Chart 3, on the next page, comparesthe demand for larger properties with the rate of newly constructed larger properties.
16 ODPM, HIP Housing Strategy Statistical Appendix, 2003
Crowded house
DOWNLOADED FROM THE SHELTER WEBSITE www.shelter.org.uk2004 Shelter© 25
Chart 3: Number of households on housing register for 3+ bedroom property .v. number of newly constructed social
housing 3+ bedrooms - England 2003
4,934
232,199
0
50,000
100,000
150,000
200,000
250,000
Newly constructed social housing with 3+bedrooms
Number of households on housing registerrequiring 3+ bedrooms
Source: ODPM house-building statistics, 2003/04, table 252, ODPM HIP HSSA 2003.

Crowded house
DOWNLOADED FROM THE SHELTER WEBSITE www.shelter.org.uk2004 Shelter© 26
Why hasn’t more progress been made?
The social-housing sector has the highest rates of overcrowding and should be an area inwhich the Government is more able to intervene. Therefore, this section focuses on socialhousing.
Chart 4, below, shows the decline in the social-housing sector stock as a proportion of thetotal housing stock in England. Data on the size of dwellings in the social sector is notavailable. Fewer households living in the social-rented sector should not in itself adverselyaffect rates of overcrowding; but, as the amount of stock has reduced, the chance ofallocating suitably sized properties to those households who remain in social housing, andto new households requiring it, is reduced.
Chart 4: Social housing as a proportion of total housing stock in England, 1981 - 2003
10%12%14%16%18%20%22%24%26%28%30%
1981
1983
1985
1987
1989
1991
1993
1995
1997
1999
2001
2003
Table 17 (from Chart 4): Social-sector dwellings by volume, and as a
proportion of all dwellings, 1981 - 2003, selected years.
Year Number of social-sectordwellings, and as a proportionof all dwellings, in England
1981 5.2 million (28.9%)
1997 4.4 million (21.3%)
2000 4.3 million (20.3%)
2001 4.2 million (20.0%)
2002 4.2 million (19.6%)
2003 4.1 million (19.0%)
% reduction in stock 1981 - 2003 27.7%
% reduction in stock 1997 - 2003 7.6%
Source: ODPM housing statistics, November 2003, table 104, figures
rounded to nearest hundred thousand.

Crowded house
DOWNLOADED FROM THE SHELTER WEBSITE www.shelter.org.uk2004 Shelter© 27
Why is there less social housing now?
Two significant factors since the early 1990s have made major contributions to this: theRight to Buy initiative and the decline in new constructions.
Over one and a half million social-sector properties have been lost from the social sectorvia the Right to Buy initiative, since its introduction in the Housing Act 1980. As chart 5,below, shows, although the number of properties leaving the social sector in this wayappeared to peak in the 1980s, the numbers are still significant and have been on a slightupward trend through the 1990s, with more than 50,000 lost in each of the last five years.The table beneath Chart 4 shows the actual figures for 1997 to date.
Chart 5: Number of properties sold via Right to Buy, each year since 1981
0
25,000
50,000
75,000
100,000
125,000
150,000
175,000
200,000
1981/82
1983/84
1985/86
1987/88
1989/90
1991/92
1993/94
1995/96
1997/98
1999/2000
2001/02
2003/04
Table 18 (from Chart 5): Volume of Right to Buy sales each year,since 1997.Year Number of properties sold via Right
to Buy
1997/98 41,300
1998/99 40,300
1999/00 54,300
2000/01 52,400
2001/02 52,000
2002/03 63,400
2003/04 69,600
Total lost since 1997 373,200Source: Sales of local authority stock, ODPM, figures rounded tonearest hundred.
More homes have been lost to the social sector via Right to Buy in London than in anyother region (271,000 since 1981; 72,100 since 1997).
Nearly a third (32.4 per cent) of the volume of social-sector stock as it was in 1981 hasbeen lost via the Right to Buy initiative.

Crowded house
DOWNLOADED FROM THE SHELTER WEBSITE www.shelter.org.uk2004 Shelter© 28
Although data showing breakdowns of the size and type of properties lost via Right to Buyis unavailable, studies have shown that it is often the largest properties that have beensold off. Shelter's report on reforming the Right to Buy17, showed that although higherdiscounts were introduced in 1987 to encourage the sale of flats, houses still make uparound 80 per cent of sales, with three- or four-bedroom homes and those with gardensbeing particularly popular. In Reading, for example, between 1980 and 1995, over 40 percent of the council's stock of houses were sold, including nearly 60 per cent of its four-bedroom houses.18
In March 2003, the Government introduced a reduction in the discount for Right to Buy.Shelter welcomed this initiative, but expressed concern that this could result in a short-term increase in the number of sales before the change takes effect.
New building in the social sector
On the supply side, the number of new homes being built in the social sector is low whencompared to the number of overcrowded households in the sector, and it has fallen overthe last ten years. Chart 6, below, shows the number of new homes constructed in thesocial sector for each year since 1991.
Chart 6: Number of newly constructed homes, social housing 1991-2003
0
10,000
20,000
30,000
40,000
50,000
60,000
1991/92
1992/93
1993/94
1994/95
1995/96
1996/97
1997/98
1998/99
1999/00
2000/01
2001/02
2002/03
2003/04
Source: ODPM House-building statistics, 2003/04, table 252.
Little more than one in twenty (five per cent) of these newly constructed social-sectorhomes have had four or more bedrooms. Chart 7, below, shows the number of newlyconstructed social-sector homes with four or more bedrooms since 1995. Property size isonly known for RSL-builds, but these have constituted at least 97 per cent of all newlyconstructed social-sector homes in each year since 1995, so the data is not skewed bythe absence of figures on the size of homes built by local authorities.
17 Patrick South, Time for Change: Reforming the Right to Buy, Shelter report, 200218 Jones C and Murie A, Reviewing the Right to Buy, Joseph Rowntree Foundation, 1999

Crowded house
DOWNLOADED FROM THE SHELTER WEBSITE www.shelter.org.uk2004 Shelter© 29
Chart 7: Newly constructed homes with four or more bedrooms - RSLs, 1995 - 2003
0
500
1,000
1,500
2,000
2,500
1995/96
1996/97
1997/98
1998/99
1999/00
2000/01
2001/02
2002/03
2003/04
Source: ODPM House-building statistics, 2003/04, table 252.
Chart 8, on the next page, shows how the rate of new constructions in the social sectorcompares to the numbers of overcrowded households.

Crowded house
DOWNLOADED FROM THE SHELTER WEBSITE www.shelter.org.uk2004 Shelter© 30
Chart 8: Trend in number of overcrowded households in social sector v. number of all new homes constructed in social sector
0
25,000
50,000
75,000
100,000
125,000
150,000
175,000
200,000
225,000
250,000
275,000
1996/97 1997/98 1998/99 1999/00 2000/01 2001/02 2002/03 2003/04
Overcrowded(bedroom standard)
Newly constructedhomes
Sources: ODPM Survey of English Housing 2002/03 and ODPM House-building statistics2003/04, table 252.

Crowded house
DOWNLOADED FROM THE SHELTER WEBSITE www.shelter.org.uk2004 Shelter© 31
Is the redistribution of under-occupied or emptyhousing the answer?
Under-occupation is commonly defined as a household that has two or more rooms abovethe number required in the bedroom standard. Being one room above the standard, doesnot, in many cases, equate to an actual spare room.
While there is limited scope to give households incentives to move to smaller properties orlow-demand areas, this will not solve overcrowding. The vast majority (close to 90 percent) of under-occupied homes are privately owned.
How do overcrowding and under-occupancy compare in the social sector, whereredistribution may be more achievable?
Table 19, below, shows that, whilst in the social sector nationally there are more thantwice as many under-occupied households as overcrowded households, regionalvariances complicate any argument for simple redistribution of homes. In London, even ifall the households that are two rooms or more above the bedroom standard were movedto smaller-sized accommodation, and all these homes were used to place overcrowdedhouseholds, little more than half of the overcrowding problem would be solved. Scenariossuch as this are, of course, theoretical and ignore the practical and political difficulties ofredistributing social housing.
Table 19: Overcrowding compared with under-occupancy in the social sector inEngland and in LondonRegion All lacking rooms on
bedroom standard
(overcrowded)
Two rooms or more above
bedroom standard (under-
occupied)
England 218,200 (5.4%) 497,600 (12.2%)
London 93,700 (12.0%) 58,200 (7.4%)
Source: ODPM ‘Overcrowding in England’ 2000 - 2003, figures rounded to nearest
hundred and derived from the Survey of English Housing. See Appendix two for a full
regional breakdown.
In addition, making the case for redistributing homes in the social sector is morecomplicated in practice. As outlined in a recent London Housing article, the bare statisticscan be a little misleading. ‘Just because a household has too many rooms according tothe bedroom standard, it doesn’t mean the rooms are actually empty.’19 For example, twoteenage boys may have their own room, even though the ‘bedroom standard’ would showthe household as having an extra room since teenagers of the same sex can share. Inaddition, some households who are under-occupying at present but may not be in thefuture, as their needs will change as their children grow up.
What about empty homes?
19 James Gleason, London Housing (Association of London Government publication), June 2004
Crowded house
DOWNLOADED FROM THE SHELTER WEBSITE www.shelter.org.uk2004 Shelter© 32
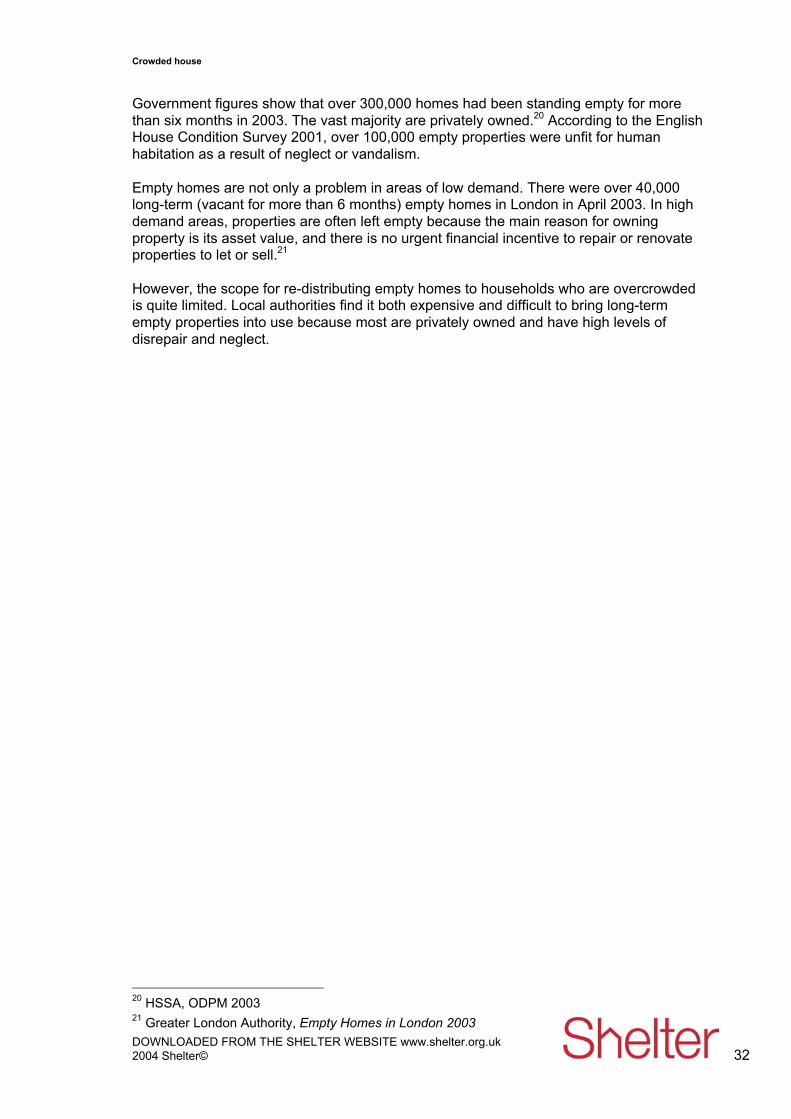
Government figures show that over 300,000 homes had been standing empty for morethan six months in 2003. The vast majority are privately owned.20 According to the EnglishHouse Condition Survey 2001, over 100,000 empty properties were unfit for humanhabitation as a result of neglect or vandalism.
Empty homes are not only a problem in areas of low demand. There were over 40,000long-term (vacant for more than 6 months) empty homes in London in April 2003. In highdemand areas, properties are often left empty because the main reason for owningproperty is its asset value, and there is no urgent financial incentive to repair or renovateproperties to let or sell.21
However, the scope for re-distributing empty homes to households who are overcrowdedis quite limited. Local authorities find it both expensive and difficult to bring long-termempty properties into use because most are privately owned and have high levels ofdisrepair and neglect.
20 HSSA, ODPM 200321 Greater London Authority, Empty Homes in London 2003

Crowded house
DOWNLOADED FROM THE SHELTER WEBSITE www.shelter.org.uk2004 Shelter© 33
Policy recommendations
The evidence from this report demonstrates the scale of the overcrowding problem andthe devastating impacts it can have on people’s childhood and adulthood. While Shelterwelcomes the Government’s renewed focus on the needs of overcrowded families, realimprovement will only be brought about through a long-term strategy which aims to tackleovercrowding against measures acceptable by today’s modern living standards. Theemphasis must be on more resources being available to provide more homes of the rightsize.
• Greater provision of affordable, family-sized homes.
• An emergency programme of acquisitions and other initiatives to increase socialhousing, as new-build social housing could take many years to acquire planningpermission and be completed.
• The introduction of a nationally recognised overcrowding measure based on the‘bedroom standard’ which is acceptable by today’s living standards. We believethis measure will not overburden local authorities, since it will not create newduties or make existing statutory duties significantly more onerous.
• A national overcrowding standard would ensure that the problem of overcrowdingcan be properly measured. This would establish a true reflection of the problemand assist in making more accurate assessments of housing need and, inparticular, the numbers of family-sized homes required.
• The introduction of a target to end overcrowding (similar to the decent homesstandard) that could be worked towards over the next ten years.
• The needs of BME communities must be incorporated in regional and localhousing strategies.
• Carry out a review of the funding and financial practices of both social-housingfunders and providers, to ensure that the funding and ‘value for money’ criteria donot mitigate against providing the larger, three- and four-bedroom properties thatare desperately needed. For example, value for money criteria could be measuredby ‘grant per bed space’ rather than ‘grant per unit’, to encourage the building oflarger homes.
• Ensure that the planning system provides a better match between what size andtype of affordable homes are needed, and what is delivered.
• Introduce more generous and positive financial incentives to persuade people,who are under-occupying in the social sector, to move and free up larger homes.Such incentives must be sensitively administered, and be considerate to people’sindividual needs and future needs.

Crowded house
DOWNLOADED FROM THE SHELTER WEBSITE www.shelter.org.uk2004 Shelter© 34
• Introduce more initiatives to persuade people to move from high-demand to lower-demand areas, similar to the LAWN22 scheme and the Seaside and CountryHomes23 scheme.
• Shelter supports the use of Empty Dwelling Management Orders (due to beintroduced through the Housing Bill), which provide local authorities with powers tobring private-sector empty homes into use and to meet housing need on atemporary basis. However we would also like to see fiscal and other measures todiscourage private owners from leaving their properties empty for long periods oftime.
22 LAWN is an inter-regional mobility scheme that helps families move to a new home by promoting
partnerships between councils and housing associations who have empty homes, or available
properties, with those who have a shortage of housing.
23 The Seaside & Country Homes Scheme, which allows pensioners to swap their council home for
a smaller flat or bungalow outside London, has for many years been a useful way of freeing up
family-sized accommodation. It remains popular with pensioners, and there is a long waiting-list for
a move. One-bed flats and bungalows on the coast are much cheaper to build than three-bed
homes in inner London. Therefore an expanded Seaside & Country Homes Scheme could have an
important part to play, easing overcrowding in the short and medium-term.

Crowded house
DOWNLOADED FROM THE SHELTER WEBSITE www.shelter.org.uk2004 Shelter© 35
Appendix one: The main three ways of measuring overcrowding
Measure: The bedroom standard Number of personsper room
Occupancy rating
Definition A standard number of bedroomsrequired is calculated for eachhousehold in accordance with itsage/sex/marital status composition,and the relationship of the members toone another. A separate bedroom isrequired for each married or cohabitingcouple, for any other person aged 21or over, for each pair of adolescentsaged ten to 20 of the same sex, andfor each pair of children under ten. Anyunpaired person aged ten to 20 ispaired, if possible, with a child underten of the same sex, or, if that is notpossible, he or she is counted asrequiring a separate bedroom, as isany unpaired child.
A simple division of thenumber of people in ahousehold by the numberof rooms in the property.Bathrooms, toilets, halls/landings and storagespaces are excluded.
A room standard, muchlike the bedroomstandard, but moregenerous because allhouseholds are assumedto require two commonrooms. The number ofbedrooms required iscalculated by taking agesand relationships intoaccount, much like thebedroom standard.
How to usethemeasure
Overcrowded households are definedas those falling one or more roomsshort of the bedroom standard. Two ormore rooms below is often describedas ‘severe overcrowding’.
More than one personper room defines anovercrowded household,and over one-and-a-halfpersons per room definesa ‘severely overcrowded’household.
One room below theoccupancy rating definesovercrowded households,but this is sometimesover-generous. Two orthree rooms below therating give a moreaccurate approximation ofovercrowding, but theserarely appear on theavailable data.
Source Originated in Government socialresearch surveys of the 1960s. Usedin ODPM housing surveys for the lastten years.
Censuses, 2001 and1991.
Census 2001 only.
Benefits Widely acknowledged as the mostaccurate predictor of overcrowding.
Trend data on larger groups in thesample available.
A Census rather thansample-based research,allowing small groups tobe analysed.
Some data from previousCensus (1991) available.
A Census rather thansample-based research,allowing small groups tobe analysed.
Limitations Used only in sample-based research,so figures are estimates rather thancounts, and it can be difficult toanalyse small groups such as severelyovercrowded households andindividual BME groups.
Amount of analysis possible isrestricted to available data only,although ODPM developing new waysof looking at the data and able toprovide some basic new cuts of data.
A less accurate measure,as the way householdsshare rooms is notaccounted for. Amount ofanalysis possible isrestricted to availabledata only – long waitingtimes for new cuts ofdata.
Overly generous whenlooking at all households,as many one-personhouseholds are countedas overcrowded andprovision for two commonrooms is made.
Only available for 2001.Amount of analysispossible is restricted toavailable data – longwaiting times for new cutsof data.

Crowded house
DOWNLOADED FROM THE SHELTER WEBSITE www.shelter.org.uk2004 Shelter© 36
Appendix two: Additional charts and tables
Chart 9: Numbers of households overcrowded and under-occupied by region (social-rented sector), 2002/03
010,00020,00030,00040,00050,00060,00070,00080,00090,000
100,000
North East NorthWest
Yorks &Humb
East Mids West Mids East London South East SouthWest
Lackingrooms
2 rooms +abovestandard
Source: ODPM Survey of English Housing 2002/03.

Crowded house
DOWNLOADED FROM THE SHELTER WEBSITE www.shelter.org.uk2004 Shelter© 37
Appendix three: Local authority duties
This appendix outlines the current legislation and local authority duties that relate toovercrowding.
Enforcement
The role of local authorities in enforcing contraventions of the rules on overcrowding,whether in terms of prosecuting offences or serving notices, is entirely a matter of eachauthority’s discretion. In our experience, there appear to be few, if any, prosecutions forstatutory overcrowding. With regard to overcrowding notices (or other notices), there is inpractice no means of compelling an authority to take action. There is a theoreticalprospect of judicial review if an authority can be accused of failing to act or actingirrationally, unfairly, or in bad faith. But, other than in highly exceptional circumstances,the Administrative Court will not interfere in decisions that Parliament has left to the wide-ranging discretion of authorities.
Homelessness
‘Reasonableness to occupy’
Under the 1996 Housing Act, a person making a homelessness application shall not betreated as having accommodation unless it is accommodation which it would bereasonable for him/her to continue to occupy (s.175(3), HA 1996). But in deciding whetherit is reasonable for a person to continue to occupy accommodation, a local authority mayhave regard to the ‘general circumstances prevailing in relation to housing’ within its area(s.177(2)). Homelessness Code of Guidance
The Code of Guidance on Homelessness (para. 6.26) states ‘Overcrowding must beconsidered in relation to general housing circumstances in the district. Statutoryovercrowding … may not of itself be sufficient to determine reasonableness, but it can bea contributory factor if there are other factors which suggest unreasonableness.’ Thus,even where a household is statutorily overcrowded, this does not mean that it isnecessarily to be treated as homeless.
As the overview of case law indicates, local authorities have a similarly wide discretion indeciding whether accommodation is not ‘reasonable to continue to occupy’, such as torender a person homeless under the 1996 Act. Authorities are entitled to perform a‘balancing exercise’, which involves comparing the applicant’s circumstances with generalhousing conditions within the authority’s district. Assuming that an authority’s decision-making process is fair, and addresses the correct factors, and is not perverse on themerits of the case, the courts will not intervene.
Allocations
The 1996 Act requires only that ‘reasonable preference’ is given to those living inunsatisfactory or overcrowded accommodation. The reference to ‘overcrowding’ here isgeneralised (as opposed to statutory overcrowding). It is for authorities to frame theirallocation schemes as they think fit, provided that they give some priority to persons in the
Crowded house
DOWNLOADED FROM THE SHELTER WEBSITE www.shelter.org.uk2004 Shelter© 38
respective classes of preference. Each authority is able to decide for itself both therelative priorities they allow to each class of ‘reasonable preference’ and the criteria theyuse to differentiate between people within the broad bands of housing need. Again,assuming that an authority has acknowledged the statutory framework in devising itsallocation scheme, there is no prospect of persuading a court to interfere.
As the Minister, Keith Hill, made clear in answer to a recent Parliamentary Question,statutorily overcrowded households are only given ‘reasonable preference’ and not extrapriority ahead of others in more immediate housing need.24
We believe, therefore, that the incorporation of the bedroom standard would have nosignificant implications for the legal duties of local authorities, since many decisionsrelating to overcrowding are made subject to other discretionary factors such as'reasonableness to occupy' and giving people 'reasonable preference' (as outlined above).However, introducing a national measure based on the bedroom standard would allowauthorities to use their existing range of powers and options to greater effect. In addition,introducing the bedroom standard would not impact upon the potential to create anincremental overcrowding target.
24 House of Commons, Official Report, 18 November 2003: Column 807W (see Annex B)