investigation on gas-liquid two-phase flow centrifugal
TRANSCRIPT
HAL Id: hal-02164952https://hal.archives-ouvertes.fr/hal-02164952
Submitted on 25 Jun 2019
HAL is a multi-disciplinary open accessarchive for the deposit and dissemination of sci-entific research documents, whether they are pub-lished or not. The documents may come fromteaching and research institutions in France orabroad, or from public or private research centers.
L’archive ouverte pluridisciplinaire HAL, estdestinée au dépôt et à la diffusion de documentsscientifiques de niveau recherche, publiés ou non,émanant des établissements d’enseignement et derecherche français ou étrangers, des laboratoirespublics ou privés.
Investigation on gas-liquid two-phase flow centrifugalpump performances for different rotational speeds
Q L Cui, Q R Si, G Bois, S Q Yuan, J P Yuan
To cite this version:Q L Cui, Q R Si, G Bois, S Q Yuan, J P Yuan. Investigation on gas-liquid two-phase flow centrifugalpump performances for different rotational speeds. IOP Conference Series: Earth and EnvironmentalScience, 2019, 240, pp.032016. �hal-02164952�

IOP Conference Series: Earth and Environmental Science
PAPER • OPEN ACCESS
Investigation on gas-liquid two-phase flow centrifugal pumpperformances for different rotational speedsTo cite this article: Q L Cui et al 2019 IOP Conf. Ser.: Earth Environ. Sci. 240 032016
View the article online for updates and enhancements.
This content was downloaded from IP address 193.51.49.230 on 29/05/2019 at 13:50

Content from this work may be used under the terms of the Creative Commons Attribution 3.0 licence. Any further distributionof this work must maintain attribution to the author(s) and the title of the work, journal citation and DOI.
Published under licence by IOP Publishing Ltd
29th IAHR Symposium on Hydraulic Machinery and Systems
IOP Conf. Series: Earth and Environmental Science 240 (2019) 032016
IOP Publishing
doi:10.1088/1755-1315/240/3/032016
1
Investigation on gas-liquid two-phase flow centrifugal pump
performances for different rotational speeds
Q L Cui1, Q R Si1, G Bois2, S Q Yuan1, J P Yuan1 1 National Research Center of Pumps, Jiangsu University, Zhenjiang, 212013, China.
E-Mail: [email protected] 2LMFL, FRE CNRS 3723, ENSAM, 8 boulevard Louis XIV, 59046 Lille Cedex,
France
Visiting Professor Jiangsu University. National Research Center of Pumps; Zhenjiang,
China
Visiting Professor Key Laboratory of Fluid and Power Machinery, Xi Hua University,
Chengdu
E-Mail: [email protected]
Abstract. Performance characteristics of a centrifugal pump under gas-liquid mixture are
presented, using a direct coupled single-stage, single-suction centrifugal pump. Both
experimental and numerical simulations comparison are carried out, for three different rotational
speeds and different inlet gas volume fractions, the results of which are presented, based on
dimensionless coefficients from similarity laws. The numerical results show that good agreement
is obtained with experimental data at nominal rotational speed for several flow coefficients. It is
found that the running of the pump is near the sudden break down of the present pump when the
inlet void fraction is below 7%. However, numerical results are less sensitive to rotational speed
effects compared with experiment ones; the influence of decreasing rotational speed on pump
performances is more and more pronounced when inlet gas void fraction increases and flow
coefficient decreases. Froude number effects are taken into account in order to explain part of
these differences.
Nomenclature
b: Impeller blade width
D: Diameter
H: Pump head
n: Rotational speed
Q: Volume water flow rate
R: Radius
bRe : Bubble Reynolds number, based on the
bubble velocity and bubble diameter and air
viscosity
w: The relative velocities inside the impeller
Z: Impeller blade number
u: Peripheral velocity
φ: Flow coefficient
α: Air volume void fraction

29th IAHR Symposium on Hydraulic Machinery and Systems
IOP Conf. Series: Earth and Environmental Science 240 (2019) 032016
IOP Publishing
doi:10.1088/1755-1315/240/3/032016
2
v: Water kinematic viscosity
ω : Angular velocity
rpm: Revolution per minute
ρ: Density of mixed fluid
η: Global efficiency of the pump
ψ: Head coefficient
Ωs: Specific speed
IGVF: Inlet gas void fraction (the inlet pressure
is close to 0.2 bar (2 m of water))
Subscripts
d: Design condition
1: Inlet diameter of impeller
2: Outlet diameter of impeller
l: Liquid
g: Gas
1. Introduction
Pump performances are decreasing under two-phase flow condition compared to single-phase one. The
degradation level depends on pump specific speed, local geometry, fluid physical properties and thermal
conditions. With increasing inlet gas void fraction, the performance of centrifugal pump deteriorates
gradually, until the flow seriously affects the safe and stable operation of the system (Lu.J et al. [1]). It
is still important for engineering and scientific purposes, to study, understand and evaluate how pump
performances decrease, looking on most important parameters that are involved. Several experimental
results have been published such as Murakami and Minemura [2], [3]. The results present pressure heads,
power consumption and flow rates chart for a given pump geometry. Design approach has been proposed
by Kim et al. [4]. Local flow visualization, bubble sizes measurements and void fraction distribution
have been also performed by several researchers like Suryawijaya and Kosyna [5], Thum et al. [6],
Thomas et al. [7], using different optical techniques.
In the 80’s, two-phase semi-empirical approaches were developed first by Mikielewicz et al. [8]
for a given specific speed type pumps. Later, several one dimensional models based on homogenous
gas-liquid mixture have also been proposed by Minemura et al. [9], Furuya et al. [10] and Clarke et al.
[11]. These models are considered to be valid for low void fraction values (max. 6%) and so, far from
surge operating conditions.
Numerical simulations using URANS approach have been also performed in order to determine
local phenomena more precisely in such flow pattern. Caridad and Kenyery [12] simulated two phase
flow in an electrical submersible pump (ESP) using a 3D CFD model. Barrios and Prado [13] studied
the dynamic behavior of the multiphase flow inside an ESP by setting the bubble size through high speed
camera measurement results. This numerical method get better fit to experiment results in ESP research
field, which will help us apply it to centrifugal pumps investigation. However, modern computational
fluid dynamics meanwhile offers some capacity to simulate the flow characteristic. Reliable two-phase
flow simulations are difficult to find mainly due to lack of suitable models, difficulties in experimental
data acquisition can reliable benchmark procedures.
Main open literature experimental and numerical results are obtained for a given rotational speed
corresponding to each pump nominal rotational speed value. Some authors analyzed geometrical effects
like Minemura et al. [14] and Sato et al. [15] for example.
For varying rotational speeds, only a few papers are available. Li Qingping et al. [16] carried out
high-speed and medium speed prototype tests on the spiral axial flow multiphase pump. It was found
that reducing the inlet angle of attack and increasing outlet angle appropriately were beneficial to
improve the performance of multiphase pump. Matsushita et al. [17] and [18] perform a study, under the
condition of gas-liquid two-phase, on impeller diameter, blade height and two rotational speeds. They

29th IAHR Symposium on Hydraulic Machinery and Systems
IOP Conf. Series: Earth and Environmental Science 240 (2019) 032016
IOP Publishing
doi:10.1088/1755-1315/240/3/032016
3
found the blade height has a significant effect. However the two rotational speed values were too closed
to each other to show any possible effects on pump performance degradations. In the present paper,
some more analysis is proposed concerning previous published works performed by the same research
team: SI et al [19]. It is mainly focus on the rotational speed effects on the pump performances in two
phase inlet conditions. Overall pump characteristic tests, under different inlet gas void fraction from 0%
(single water phase) up to 10% and three different rotational speeds (2910, 2300, 1800 rpm) are
presented. Comparison between experiment and numerical simulation results is proposed, based on the
dimensionless coefficient evolutions versus inlet void fraction values. Some additional suggestions for
two phase flow pump testing rules are also proposed.
2. The Experimental Setup
2.1 Test Rig
Figure 1 shows a sketch of the open test rig that is used. The main test system consists of three parts:
liquid delivery pipelines, gas transmission pipelines and data acquisition system. The liquid delivery
pipelines mainly consists of two 1m diameter and 2.5m height tanks, ball valves, electric gate valves for
regulating flow, two electromagnetic flow-meters, model pump, gas-liquid mixing devices and related
pipelines. Gas transmission pipeline mainly includes compressor, gas dryer, gas storage tank, gas
pressure regulating valve, gas mass flow-meter and check valve, and is connected to the gas-liquid
mixing device through the inlet pipeline.
During the test, the ball valve was completely opened, and the water in tank (6) goes into the model
pump after mixing the air discharged by the compressor unit in the gas-liquid mixer. Downstream of the
pump, flow goes through an electromagnetic flow-meter device (8), then to a second tank (5). Both
water tanks (5) and (6) are open to atmospheric conditions and are connected through a flexible
connecting. The gas-liquid two-phase flow testing procedure is carried out by ensuring the flow rate of
water remains at a constant value, the inlet gas flow rate value being controlled through a regulating
valve coupled with a gas flow meter. Figure 2(a) shows the gas mass flow-meter picture, which allows
maintaining the air flow rate at a given value. The gas-liquid mixer is shown in Figure 2(b), which is
supposed to deliver a homogeneous gas-liquid two phase flow mixture. Four ventilation pipes are
distributed around the pipe.
(a). Schematic diagram of experimental setup. (b). Picture of experimental setup.
1. Model pump 2、8. Electromagnetic flow-meter 3. Gate valve 4、6. Water tank 5. Flexible connecting
pipe 7. Ball valve 9. Gas-liquid mixer 10. Control air valve 11. Air mass flow-meter 12. Gas tank 13.
Air supply compressor
Figure 1. Pump test rig.
1 9
13
10
12
2 3
8 7
4
11
5
6

29th IAHR Symposium on Hydraulic Machinery and Systems
IOP Conf. Series: Earth and Environmental Science 240 (2019) 032016
IOP Publishing
doi:10.1088/1755-1315/240/3/032016
4
(a). Gas mass flowmeter. (b). Gas-liquid mixer.
Figure 2. Air delivery device.
The diameter’s hole of each ventilation pipe is 0.2 mm, and the direction of ventilation injection is
the same as the main flow direction. The liquid inlet pipeline is horizontal and the air injection system
is located upstream from the pump inlet section; its location is 20 times the inlet pipe diameter upstream
the pump inlet section.
2.2 Model Pump
The model pump is a medium specific speed single stage and single suction centrifugal pump with a
specific speed Ωs = 0.68.
s is defined as 0.5
0.75( )
Qs
gH (1)
The initial design parameters are as follows: flow Qd=50.6 m3/h, head Hd=20.2 m, rotational speed
nd=2910 rpm, pump inlet diameter Di=65mm, pump outlet diameter Ds=50mm, impeller inlet diameter
D1=79mm, impeller outlet diameter D2=140mm. The blade is three-dimensional twisted blade shape.
The number of blades is Z= 6, and the volute law evolution obeys to the Archimedes spiral shape.
3. The Numerical Setup
3.1 Model and mesh
Three-dimensional modeling software Pro/E 5 is used for 3D modeling and assembly. The
computational domain includes inlet extension, ring, impeller domain, volute domain and chamber. The
hexahedron structured mesh can be used to control the density of each node flexibly, and adjust the
nodes properly. In order to improve the accuracy of simulation, the boundary layer grid is added to the
volute shell wall after local encryption of the volute tongue. After verifying by grid independence, the
total number of grid cells is 2 775 915, and the total number of grid nodes is 2 945 000 (see reference
[19] for more information about mesh independence on results). The model pump computational domain
is illustrated with the structured grid as shown in Figure.3.
3.2 Numerical model and boundary conditions
The Eulerian-Eulerian heterogeneous flow model is used for the URANS numerical simulations. No
temperature effects are considered. The model considers not only the velocity slip but also the interphase
mass and momentum transfer.
It is assumed that the gas-liquid two-phase flow pattern is a uniform bubbly flow and satisfies the
continuity equation and momentum equation. The liquid phase is the continuous phase, using the k-ε
turbulence model; the gas phase is the discrete phase, using the zero-equation theoretical model and the
phase-transfer unit using the particle model.

29th IAHR Symposium on Hydraulic Machinery and Systems
IOP Conf. Series: Earth and Environmental Science 240 (2019) 032016
IOP Publishing
doi:10.1088/1755-1315/240/3/032016
5
The action between two phases only takes into account the resistance, which the resistance equation
acting on the liquid phase (also called interfacial friction coefficient) is expressed as:
3( )
4
ll g D g g l g l
B
M M c w w w wd
(2)
where
0.687b b
b
b
24(1 0.15Re ) (Re 1000)
Re
0.44 (Re 1000)Dc
and bRel g l
B
l
w wd
(3)
Taking into account the requirements of the test, the inlet boundary conditions are set according to
the pressure actually measured in the experiment. A certain amount of gas is imported into the inlet and
the outlet boundary conditions are set as the mass flow rate. The liquid boundary adopts the non-slip
solid wall condition, and the gas boundary adopts the free-slip solid wall condition.
0
10
20
30
40
50
60
70
80
0
0.1
0.2
0.3
0.4
0.5
0.6
0 0.02 0.04 0.06 0.08 0.1 0.12 0.14
η/%
ψ
φ
1. Inlet 2. Ring 3. Chamber 4. Impeller 5.Volute
Figure 3. Computational domain and mesh.
Figure 4. Performance curves of numerical
simulation and experiment with IGVF=0.
4. Overall pump performances
4.1 Comparisons between experimental and numerical results for single flow conditions (IGVF=0)
IGVF value is defined as: air
air water
IGVF inletQ
Q Q
(4)
For the nominal rotational speed nd=2910 rpm and IGVF=0, it can be seen from figure 4 that the
numerical simulation results are in quite good agreement with the experimental data. In previous work
[19], if has been verified that pump head and global efficiency curves were independent of rotational
speed from the range 1800-2910 rpm.
Efficiency is defined as: watergQ H
P
(5)
with water air1 (6)
● EXP ψ
● CFD ψ
■ EXP η
■ CFD η
2
4
3
5
1
29th IAHR Symposium on Hydraulic Machinery and Systems
IOP Conf. Series: Earth and Environmental Science 240 (2019) 032016
IOP Publishing
doi:10.1088/1755-1315/240/3/032016
6
The largest rotational speed of 2910 rpm corresponds to the nominal one. This is achieved taking into
account that the maximum experimental error is 6% for the head at partial flow rates and 2 % around
the maximum efficiency point.
4.2 When two-phase pump inlet conditions are present, the main conclusions that were proposed, in
previous team published work, were the following:
a) Pump performance degradation is more pronounced for low flow rates compared to high flow
rates. The starting point of severe pump degradation rate is related a specific flow coefficient
corresponding to a strong modification of the negative slope of the theoretical head coefficient
that corresponds to the onset of inlet impeller recirculating swirl flow as shown by SI et al.
[19].
b) The numerical methods using the combined k-e turbulence and inhomogeneous two-phase
models to adapt the Eulerian-Eulerian multiphase flow in this pump are believable to evaluate
pump performance degradation up to IGVF values of 7%. However, numerical approach always
fails using high IGVF inlet conditions.
c) Bubble size plays a key role in CFD results modification for pump two-phase performance but
seem to have less importance when experiments are performed.
- According to the previous study’s conclusion given in a), analysis are done for three flow
coefficient values equal and higher than φ= 0.038 (for this pump, this value is considered
as a limiting one, looking to this aspect).
φ is defined as : φ=Q/(2π·R2·b2·u2) (7)
- According to b), the present analysis is limited for IGVF values lower than 7%, because
experimental pump performance generally exhibits a sharp and sudden drop off for higher
values of IGVF with strong unsteadiness as already shown by many authors.
- Another reason is linked to the fact that numerical solutions cannot correctly converged for
high values of inlet void fraction as pointed out before (see section 4.2.b).
In the next section, a specific focus is now related to rotational speed effects.
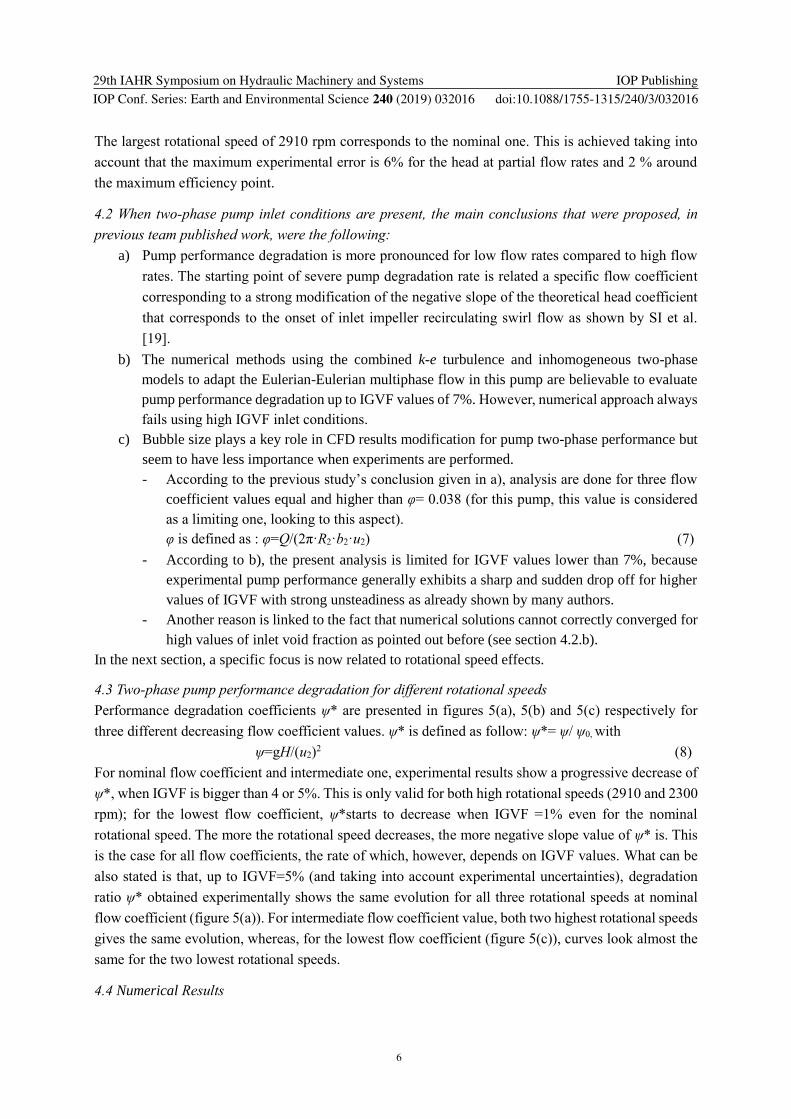
4.3 Two-phase pump performance degradation for different rotational speeds
Performance degradation coefficients ψ* are presented in figures 5(a), 5(b) and 5(c) respectively for
three different decreasing flow coefficient values. ψ* is defined as follow: ψ*= ψ/ ψ0, with
ψ=gH/(u2)2 (8)
For nominal flow coefficient and intermediate one, experimental results show a progressive decrease of
ψ*, when IGVF is bigger than 4 or 5%. This is only valid for both high rotational speeds (2910 and 2300
rpm); for the lowest flow coefficient, ψ*starts to decrease when IGVF =1% even for the nominal
rotational speed. The more the rotational speed decreases, the more negative slope value of ψ* is. This
is the case for all flow coefficients, the rate of which, however, depends on IGVF values. What can be
also stated is that, up to IGVF=5% (and taking into account experimental uncertainties), degradation
ratio ψ* obtained experimentally shows the same evolution for all three rotational speeds at nominal
flow coefficient (figure 5(a)). For intermediate flow coefficient value, both two highest rotational speeds
gives the same evolution, whereas, for the lowest flow coefficient (figure 5(c)), curves look almost the
same for the two lowest rotational speeds.
4.4 Numerical Results
29th IAHR Symposium on Hydraulic Machinery and Systems
IOP Conf. Series: Earth and Environmental Science 240 (2019) 032016
IOP Publishing
doi:10.1088/1755-1315/240/3/032016
7
Looking now the results of ψ* obtained from numerical simulation, good agreements with experiments
can be seen for nominal rotational speed as shown in figure 5, except for IGVF= 7% and φ=0.038 in
figure 5(c) (scale is different compared with figure 5(a) and 5(b)). In figure 5(c), numerical results give
a lower values of ψ* than the experimental one probably due to the combination of high local void
fraction and flow recirculation onset at pump inlet section.
0.6
0.7
0.8
0.9
1
0% 2% 4% 6% 8%
ψ/ψ
0
IGVF
φ=0.077
EXP 2910 rpm
EXP 2300 rpm
EXP 1800 rpm
CFD 2910 rpm 0.2mm
CFD 2300 rpm
CFD 1800 rpm
0.6
0.7
0.8
0.9
1
0% 2% 4% 6% 8%
ψ/ψ
0
IGVF
φ=0.058
EXP 2910 rpm
EXP 2300 rpm
EXP 1800 rpm
CFD 2910 rpm 0.2mm
CFD 2300 rpm
CFD 1800 rpm
0.5
0.6
0.7
0.8
0.9
1
0% 2% 4% 6% 8%
ψ/ψ
0
IGVF
φ=0.038
EXP 2910 rpm
EXP 2300 rpm
EXP 1800 rpm
CFD 2910 rpm 0.2mm
CFD 2300 rpm
CFD 1800 rpm
(a) (b) (c)
Figures 5. Comparison of experimental and numerical results.
All other numerical simulations, performed for several flow coefficients and rotational speeds,
show no influence (or weak differences) of rotational speeds for a given flow coefficient, because of
similarity laws are applied for homogeneous bubbly flow hypothesis used in the numerical simulations.
Since experimental results show quite big differences when rotational speed decreases, a particular focus
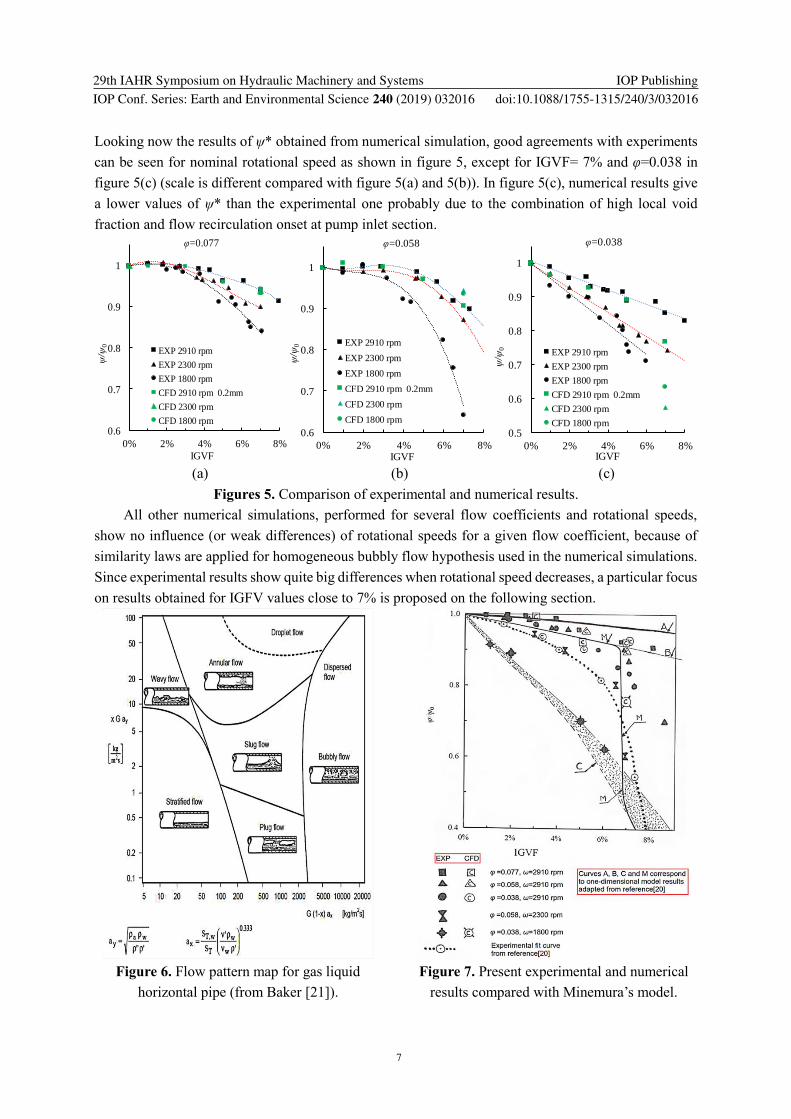
on results obtained for IGFV values close to 7% is proposed on the following section.
Figure 6. Flow pattern map for gas liquid
horizontal pipe (from Baker [21]).
Figure 7. Present experimental and numerical
results compared with Minemura’s model.

29th IAHR Symposium on Hydraulic Machinery and Systems
IOP Conf. Series: Earth and Environmental Science 240 (2019) 032016
IOP Publishing
doi:10.1088/1755-1315/240/3/032016
8
5. Analysis on present experimental and numerical results comparison with existing model
Strong performance drop in pump head coefficient has been modelled by the interesting one dimensional
approach developed by Minemura et al [20]. This sudden head drop off is predicted when the local void
fraction reach a certain value corresponding to the transition to churn or slug flow inside the impeller
pump channel passage. This is not captured by the models that are used in the present numerical
simulation. In this section, an evaluation of specific physical phenomena that are related to the Froude
Number effects is performed simply by taking into account Baker’s charts [21], as shown in figure 6.
Reynolds number effects are not considered here; the reason is because it has been found in [19], that it
has no effect on the (φ – ψ) performance coefficient chart, at least for IGVF=0, whatever the rotational
speed is.
When flow coefficient decreases, both by reducing flow rate for a given rotational speed and/or
reducing both rotational speed and flow rate, keeping flow coefficient at constant value, then inlet pipe
mean velocity decreases accordingly. In the present test pump inlet pipe, the limiting value of the inlet
velocity, for which transition from bubbly flow to plug or slug flow occur is: 2 m/s.
This means that such a transition may happen not only inside the impeller channels but inside the
incoming pump pipe, with non-uniform and no more homogeneous inlet flow conditions. According to
this analysis, all experimental results obtained for the nominal rotational speed are considered to be in
fair agreement with bubbly flow regime assumption (up to a certain value of IGVF around 7-8%), except
below a flow coefficient value φ = 0.045 which is evaluated as a limiting value. For 2300 rpm, the limit
value of φ is 0.06, and for 1800 rpm’s set of results, only the ones corresponding to φ=0.07 can be
considered to fulfill this hypothesis.
On figure 7, (extracted from Minemura’s paper [20]), results issued from present experiments and
calculations are added. They all give the same performance deterioration ratio than the model used by
Tomiyama et al. [21](see curve A), corresponding to equation (3), for all flow coefficients at nominal
speed (2910 rpm) and the two highest ones for 2300 rpm. The model used corresponds to the drag
coefficient calculated using equation (3), which is also used in the present numerical simulation.
All other additional results, given in the same figure 7, are devoted to experimental results: both
present and Minemura’s ones [20] are plotted and compared with the one-dimensional model he
developed, for the same head coefficient (note that Minemura assumes no inlet swirl at pump inlet in
his approach). The resulting evolution obtained by Minemura’s approach is given by the solid line curve
named M in figure 7. Minemura’s experiment results [20] are always located between the two curves
(called curve A and B in figure 7), corresponding respectively to the two drag coefficient proposed by
Tomiyama et al. [22] and Hench and Johnston [23] (the last one only depends on bubble diameter value).
This means that the flow pattern probably never corresponds either to bubble or churn flow owing to
the fact that inlet mean velocity is quite small for the case reported in his paper.
However, present results obtained for reduced rotational speed, closed to Minemura’s ones, exhibit
quite the same evolution in pump degradation ratio. Finally, for the smallest rotational speed and flow
coefficient values (φ =0.038), the evolution of ψ* looks quite similar to the curve corresponding to the
churn flow regime used for the drag coefficient proposed by Zuber-Hench [24] for churn flows, the
value of which depends on bubble diameter and local void fraction (see curve C, on figure 7). It is so
believed that flow structure should be taken into account not only inside the impeller but at inlet pump
section as well. Possible combinations of bubble and churn flow may arise due to internal flow structure

29th IAHR Symposium on Hydraulic Machinery and Systems
IOP Conf. Series: Earth and Environmental Science 240 (2019) 032016
IOP Publishing
doi:10.1088/1755-1315/240/3/032016
9
and void fraction inside the impeller, but also in front of it when flow rate and/or rotational speed are
too low especially for the case of horizontal inlet pipe configuration which is the case in the present
work. Some additional effects must be taken in consideration when flow coefficient is more reduced, as,
for example, pressure level effects on bubble diameter, which is not discussed in the present work.
Concerning this particular point, previous work have shown that main of the loss coming from two phase
flow character appear in the first 20% of the blade passage where pressure increase is generally low.
There is probably an effect when rotational speed is decreasing but it has not been yet evaluated in the
present analysis.
6. Conclusions
Experimental and numerical analysis have been performed in a centrifugal pump with particular focus
on the rotational speed effects for different flow coefficients and inlet void fraction up to 10%. The main
conclusions are the following:
1. The numerical method using the combined inter-fluid transfer two phase flow model to adapt the
Eulerian-Eulerian multiphase flow in this pump is adequate to estimate the pump performance
degradation for the nominal speed value for flow coefficient is bigger than 0.04 (45% of, the
nominal flow rate coefficient), when choosing the right initial bubble diameter.
2. The more the rotational speed decreases, the more the experimental pump performances is affected
for a given inlet void fraction value.
3. For increasing inlet void fractions, the degradation slope curves increases (with negative sign) with
degreasing flow coefficients.
4. When rotational speed decreases, numerical calculations fail, mainly because the model that is
introduced in the simulation is related to a bubbly flow regime.
5. The difference between experimental and numerical results exist, not because of rotational speed,
but its consequence on local velocity values that decreases according to the flow coefficient and
more specifically in the pump inlet tube and at the pump inlet section.
6. Numerical simulations must take into account churn flow characteristics in order to be able to get
better results. Both bubbly and churn flow conditions may be present for inlet flow conditions
depending on the experimental setup, the rotational speed and the pump flow coefficient even at
nominal conditions.
7. Existing efficient one dimensional models such as developed by Minemura et al. and numerical
simulations should be conducted first when using non dimensional flow coefficients for two-phase
flow analysis. One dimensional models give an indication based on mean values along one
streamline, whereas numerical simulation can provide more local 3D information.
Acknowledgements
The authors would like to thank National Natural Science Foundation of China (No. 51509108、
51609164、51779107) and Natural Science Foundation of Jiangsu Province (No. BK20150516、
BK20160574).
References
[1] Lu Jin-Ling 2001 Review of research on gas-liquid two-phase flow pumps Journal Fluid Machinery
29(12):12-15 (in Chinese with English abstract).

29th IAHR Symposium on Hydraulic Machinery and Systems
IOP Conf. Series: Earth and Environmental Science 240 (2019) 032016
IOP Publishing
doi:10.1088/1755-1315/240/3/032016
10
[2] Murakami M and Minemura K 1974a Effects of entrained air on the performance of a centrifugal
pump Bulletin of the ASME 1047-1055.
[3] Murakami M and Minemura K 1974b Effects of entrained air on the performance of a centrifugal
pump (Second report, effects of number of blades) Bulletin of the ASME 1286-1295.
[4] Kim J H, Duffey R B and Belloni P 1985 On centrifugal pump head degradation in two-phase flow
Design method for two-phase flow in turbomachinery ASME Mechanics Conference 26,
Albuquerque, NM.
[5] Suryawijaya P and Kosyna G 2001 Unsteady Measurement of Static Pressure On the Impeller Blade
Surfaces and Optical Observation on Centrifugal Pumps Under Varying Liquid/Gas Two-Phase
Flow Condition Journal of Computational and Applied Mechanics 51 3-4 pp 1-10
[6] Thum D, Hellmann H and Sauer M 2006 Influence of the Patterns of Liquid-Gas Flows on
Multiphase-Pumping of Radial Centrifugal Pumps 5th North American Conference on Multiphase
Technology 79-90.
[7] Thomas S, André B, Martin N and Uwe H 2015 Application of gamma-ray computed tomography
for the analysis of gas holdup distributions in centrifugal pumps Flow Measurement and
Instrumentation 46 pp 262-267.
[8] Mikielewicz J, Wilson D G, Chan T C and Goldfinch A L 1978 A method for correlating the
characteristics of centrifugal pumps in two-phase flow ASME Journal of fluids Engineering p 395
[9] Minemura K, Murakami M and Katagiri H 1985 Characteristics of Centrifugal Pumps Handling Air-
Water Mixtures and Size of Air Bubbles in Pump Impellers Bulletin of JSME 28 244 pp 2310-
2318.
[10] Furuya O 1985 An analytical model for prediction of two-phase (non condensable) flow pump
performance ASME Journal of Fluid Engineering 107 1 pp 139-147.
[11] Clarke A P and ISSA R I 1995 Numerical prediction of bubble flow in a centrifugal pump
Multiphase Flow 1995 pp 175-181.
[12] Caridad J and Kenyery F 2004 CFD Analysis of electric submersible pumps (ESP) handling two-
phase mixtures Journal of Energy Resources Technology (ASME) 126 2 pp 99-104.
[13] Barrios L and Prado M G 2009 Modeling two phase flow inside an electrical submersible pump
stage Journal of Energy Resources Technology 133 4 pp 227-231.
[14] Minemura K, Kinoshita K, Ihara M, Furukawa H and Egashira K 1995 Effects of outlet blade angle
of centrifugal pump on the pump performance under air-water two-phase flow conditions ASME
energy sources technology conference and exhibition, Houston, TX, Pipeline Engineering 69 pp
113-117
[15] Sato S, Furukawa A and Takamatsu Y 1996 Air-Water Two-Phase Flow Performance of
Centrifugal Pump Impellers with Various Blade Angles Bulletin of the JSME 39 2 pp 223-229.
[16] LI Qing-Ping, XUE Dun-Song, LI Zhong-Fang, ZHU Hong-Wu and BAN Yue-Tao 2004 Optimize
of the helicon-axial multiphase pump prototype and its experimental studies on performances
Journal of Engineering Thermophysics 25 6 pp 962-964. (in Chinese with English abstract)
[17] Matsushita N, Furukawa A, Watanabe S, Okuma K and Hasui T 2009 Study on design of air-water
two-phase flow centrifugal pump based on similarity law International Journal of Fluid
Machinery & Systems 2 2 pp 499-506.

29th IAHR Symposium on Hydraulic Machinery and Systems
IOP Conf. Series: Earth and Environmental Science 240 (2019) 032016
IOP Publishing
doi:10.1088/1755-1315/240/3/032016
11
[18] Matsushita N, Okuma K, Furukawa A, Watanabe S 2005 Influence of impeller diameter and
diffuser blades on air-water two-phase flow performance of centrifugal pump ASME Fluids
Engineering Division Summer Meeting and Exhibition 33 pp 59-64.
[19] Si Q, Bois G, Zhang K and Yuan J 2017 Air-water two-phase flow experimental and numerical
analysis in a centrifugal pump Proceedings of 12th European Conference on Turbomachinery
Fluid Dynamics and Thermodynamics, ETC 12 - Paper ID ETC2017-54, April 3-7th; Stockholm,
Sweden.
[20] Minemura K, Uchiyama T, Shoda S and Egashira K 1998 Prediction of Air-Water two-Phase Flow
Performance of a Centrifugal Pump Based on One-Dimensional Two-Fluid Model Journal of
Fluid Engineering 120 pp 237-334.
[21] Baker O 1954 Simultaneous Flow of Oil and Gas Oil Gas Journal 53 pp 185-190.
[22] Tomiyama A, Kataoka I and Sakaguchi T 1995 Drag Coefficients of Bubbles (1st Report, Drag
Coefficients of a Single Bubble in a Stagnant Liquid) Nihon Kikai Gakkai Ronbunshu B
Hen/transactions of the Japan Society of Mechanical Engineers Part B 61 587 pp 2357-2364.
[23] Hench J E and Johnston J P 1972 Two-Dimensional Diffuser Performance with Subsonic, Two-
Phase, Air-Water Flow ASME Journal of Basic Engineering 107 1 pp 105-121.
[24] Zuber N and Hench J E 1962 Steady State and Transient Void-Fraction of Bubbling Systems and
Their Operating Limits GE Report 62GL100.