investigation of visualized solid-liquid phase … · the solubility of a solid in a liquid is...
TRANSCRIPT

P#
012
1
Investigation of Visualized Solid-Liquid Phase
Equilibria for Pure and Mixed Refrigerants
C. Lee1
, J. Lee1
, J. Yoo1
, S. Jeong1
, J. Jung2
1
Cryogenic Engineering Laboratory
KAIST, Daejeon, Republic of Korea 305-701
2
Energy System R&D Institute, Daewoo Shipbuilding & Marine Engineering Co.
Ltd., Seoul, Republic of Korea 135-010
ABSTRACT
A pure-refrigerant Joule-Thomson (J-T) refrigerator has constraints on cooling capacity and
operating temperature defined by the thermodynamic characteristics of the chosen refrigerant. The
use of a mixed refrigerant (MR), which can efficiently overcome the limitations of a pure coolant,
has attracted people’s attention due to the high performance of its J-T effect and the variety of
cooling temperatures available. Although MR have earned general acceptability for various J-T
refrigerator applications, they have a significant operating challenge: that of clogging in the J-T
expansion part, which is caused by a freezing problem. In this paper, the freezing points, i.e. solid-
liquid phase equilibria of various MR have been examined using a visualization apparatus and
analyzed by regular solution theory in the temperature range from 89 K to 182 K.
The visualization experimental apparatus was developed and tested to observe the freezing
point with a camcorder while the temperature was monitored using instrumentation inside the glass
test tube. The experimental apparatus consisted of three parts: 1) a cold part cooled using liquid
nitrogen (LN2
), 2) a MR test part fabricated with a glass tube, and 3) a helium base part with glass
bell jar to prevent frosting on the glass apparatus. The apparatus detected the freezing points of the
selected pure refrigerants (R14, R218, R125 and N2O) and a binary mixture of N
2O
/ R125 with a
maximum error of 0.33% and 1.4%, respectively. Also, a multiple component MR made up of Ar,
R14, R23, and R218 with various compositions was tested to search for the mole fraction which has
the lowest freezing temperature.
INTRODUCTION
Recently, cryogenic refrigeration has been recognized as an important enabling technology in
many areas such as natural gas liquefaction, sensor cooling, and superconducting applications. The
Joule-Thomson (J-T) refrigeration cycle is one of the most fundamental refrigeration cycles for
industrial applications because of its ease of fabrication, adjustability of cooling capacity, and high
reliability due to no moving parts.1,2
However, the low efficiency of a pure-refrigerant J-T refrig-
eration cycle—due to an irreversible process on the expansion valve—is a clear disadvantage.3 In
addition, the high pressure ratio, which is related to a specific refrigerant's characteristics, is also a
challenge to achieve for a pure-refrigerant cryogenic J-T refrigerator. To make up for these short-
comings, mixed refrigerant (MR) J-T refrigerators have been developed.
372 J-T and Sorption Cryocooler Developments
397Cryocoolers 18, edited by S.D. Miller and R.G. Ross, Jr.©¶International Cryocooler Conference, Inc., Boulder, CO, 2014

P#
012
2The MR J-T refrigeration cycle typically has high and low working pressure conditions of
2,000-3,000 kPa and 100-400 kPa, respectively.1 Also, a wide range of cooling temperatures has
been achieved using different compositions of working fluids.4 The specific composition of the
mixed refrigerant is commonly determined to maximize the efficiency and boost the potential re-
frigeration power with various freezing and boiling temperatures.5 Although a well-designed MR
can achieve high efficiency in the J-T refrigeration cycle, the component with the highest freezing
temperature may clog or block the J-T expansion part, especially in the case of non-flammable
mixed refrigerants (NF MR). Therefore, the freezing point of the MR at low pressure needs to be
predicted and considered before finalization of a MR J-T refrigeration cycle.
The freezing points of pure refrigerants and binary MRs have generally been established by
solid-liquid phase equilibria in past research. Nicola et al. investigated the freezing point of numer-
ous binary mixtures using a closed vessel.6,7,8
They applied the Rossini-method corrections to
determine the freezing point from the experimental results. This method analyzed the solid-liquid
equilibria using the time-temperature curve for the target MR. On the other hand, the Universal
Functional-group Activity Coefficients (UNIFAC) method or the Universal Quasi-chemical Activ-
ity Coefficients (UNIQUAC) method are applied to calculate the solid liquid equilibria (SLE) of
organic compounds and hydrocarbon mixtures.9,10
The above methods are well established to characterize the freezing point of binary mixtures or
pure refrigerants. However, an SLE visualization apparatus has not yet been developed for visual
investigation of the freezing phenomena under cryogenic conditions. Furthermore, there is little
research that investigates the freezing temperature of mixtures containing more than three compo-
nents.
In the research effort described in this paper, a visualization apparatus was fabricated to ex-
plore the solid-liquid phase equilibria of various MR candidates and was tested with pure refriger-
ants, binary MRs, and selected multicomponent MRs. To improve the accuracy of the experiments,
video recording was conducted and interpreted frame by frame. The tested freezing point was com-
pared with the analytical results calculated to verify the accuracy of the experimental procedure.
Subsequently, numerous sets of MR (Ar, R14, R23, R218) were examined to obtain the lowest
temperature without solidification (i.e. SLE). This information on SLE should be valuable for
those designing an MR J-T refrigeration system with the described MR sets.
SOLID-LIQUID EQUILIBRIA ESTIMATION REGULAR SOLUTION THEORY
The SLE for a mixture can be estimated by numerous calculation methods. Commonly, the
solubility characteristic of solids in liquids is applied to estimate the SLE. The solubility of a solid
in a liquid is determined not only by the intermolecular forces between the solute and the solvent,
but also by the melting point and the enthalpy of fusion of the solute.11
In a binary solution or a
binary mixture, the solubility of a solid x2
at temperature T is given by,
(1)
where, â2 is the activity coefficient for solute, Óh
f is the enthalpy of fusion of the solute at the triple
point temperature Ttp
, and ÓCP is the molar heat capacity difference between the subcooled liquid
solute and the solid solute. To simplify this equation, the normal melting temperature Tm
can be
substituted for the triple-point temperature Ttp
. Also, the terms related to molar heat capacity are
not as important as the other terms, therefore a simplified form of the equation is11
,
(2)
In the ideal solution, the activity coefficient â2
is unity; however, for a non-ideal solution it may
373SOLID-LIQUID PHASE EQUILIBRIA FOR PURE & MIXED REFRIG J-T and Sorption Cryocooler Developments 398398 J-T AND SORPTION CRYOCOOLER DEVELOPMENTS
P#
012
3
(a) (b)
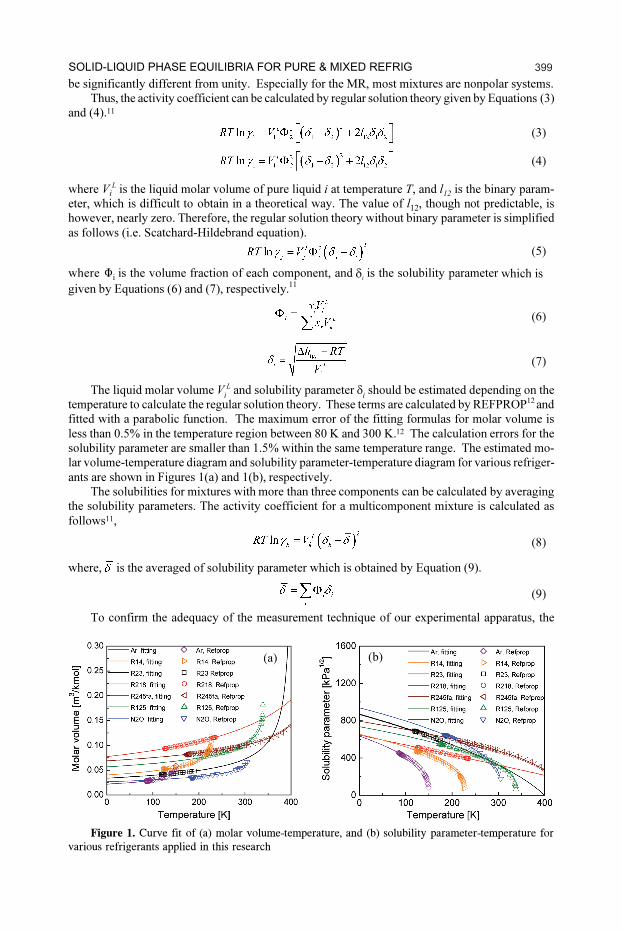
Figure 1. Curve fit of (a) molar volume-temperature, and (b) solubility parameter-temperature for
various refrigerants applied in this research
be significantly different from unity. Especially for the MR, most mixtures are nonpolar systems.
Thus, the activity coefficient can be calculated by regular solution theory given by Equations (3)
and (4).11
(3)
(4)
where Vi
L
is the liquid molar volume of pure liquid i at temperature T, and l12
is the binary param-
eter, which is difficult to obtain in a theoretical way. The value of l12
, though not predictable, is
however, nearly zero. Therefore, the regular solution theory without binary parameter is simplified
as follows (i.e. Scatchard-Hildebrand equation).
(5)
where
Öi is the volume fraction of each component, and Û
i
is the solubility parameter which is
given by Equations (6) and (7), respectively.11
(6)
(7)
The liquid molar volume Vi
L
and solubility parameter Ûi
should be estimated depending on the
temperature to calculate the regular solution theory. These terms are calculated by REFPROP12
and
fitted with a parabolic function. The maximum error of the fitting formulas for molar volume is
less than 0.5% in the temperature region between 80 K and 300 K.12
The calculation errors for the
solubility parameter are smaller than 1.5% within the same temperature range. The estimated mo-
lar volume-temperature diagram and solubility parameter-temperature diagram for various refriger-
ants are shown in Figures 1(a) and 1(b), respectively.
The solubilities for mixtures with more than three components can be calculated by averaging
the solubility parameters. The activity coefficient for a multicomponent mixture is calculated as
follows11
,
(8)
where, is the averaged of solubility parameter which is obtained by Equation (9).
(9)
To confirm the adequacy of the measurement technique of our experimental apparatus, the
374 J-T and Sorption Cryocooler Developments SOLID-LIQUID PHASE EQUILIBRIA FOR PURE & MIXED REFRIG 399399SOLID-LIQUID PHASE EQUILIBRIA FOR PURE & MIXED REFRIG

P#
012
4Table 1. Triple point temperature for pure refrigerants
aforementioned estimation methods will be applied for checking the experimental results.
Test Refrigerant Selection
Table 1 displays the target pure refrigerants used in this investigation. Non-flammable pure
refrigerants were selected to confirm the accuracy of the measurement method of the experimental
apparatus over the temperature range from 89 K to 182 K. These refrigerants were also utilized in
the binary mixed refrigerants and multicomponent mixtures.
From previous research, it is known that the freezing temperatures of a few sets of binary
mixed refrigerants are well predicted with the ideal solution (whose the activity coefficient is equal
to one).6 For example, research results for the R125 + N
2
O binary mixture reveal that this mixture
obeys the ideal solution. In this paper, the R125 + N2
O binary mixed refrigerant is therefore used to
verify the accuracy of the experimental procedures for MRs. In contrast, the R245fa + R125 binary
MR is utilized in this experimental apparatus to find the acceptance of the regular solution theory.
For multicomponent MR, various mixtures of Ar, R14, R23, R218 were explored in this re-
search. This set of MR (Ar, R14, R23 and R218) is one of the most suitable combinations for a
cryogenic MR J-T refrigerator with the aim of cooling below 120 K—such as natural gas liquefac-
tion. For reference, the freezing point of Ar:R14:R23:R218 = 0.17:0.30:0.20:0.33 is obtained as
116 K from previous research.13
Various compositions of this MR were analyzed in this research to
further determine the multicomponent mixture with the lowest achievable freezing point.
EXPERIMENT
Experimental Apparatus
A visualization experimental setup was developed and is introduced in this paper. Figure 2
shows a schematic of the experimental apparatus. A photograph of the whole experimental appara-
tus is shown in Figure 3(a), and the test part of the experimental apparatus is shown in Figure 3(b).
Figure 2. Schematic diagram of visualized experimental apparatus for freezing point detection
375SOLID-LIQUID PHASE EQUILIBRIA FOR PURE & MIXED REFRIG J-T and Sorption Cryocooler Developments 400400 J-T AND SORPTION CRYOCOOLER DEVELOPMENTS

P#
012
5
(a) (b)
Figure 3. Photograph of experimental apparatus (a) complete view and (b) test part
The experimental apparatus contains three parts: 1) the helium base part, 2) the liquid nitrogen
(LN2
) container, and 3) the MR test tube.
The helium base part is fabricated with a glass bell jar that is positioned above the machined
aluminum support. Helium gas is charged to approximately 130 kPa during the experiment to pre-
vent frost formation at the surface of the LN2
container. The LN2
container is composed of a double-
layered vacuum insulation glass dewar made by KGW-Isotherm. The surface of the glass dewar is
completely transparent without silver coating because transparency of the test section is required.
The top of the glass dewar is covered by a stainless steel plate that holds the LN2
supply line, test
tube, and the LN2
vent line. The test tube of the MR is attached by soldering with a glass-to-metal
adapter. The top side of the test tube is sealed with a stainless steel stopper and indium wire seal.
The MR supply line, MR vent line, and temperature sensor feedthrough line are made with
1/8-inch stainless steel tube. These lines are brazed to the stainless steel stopper to construct the
sealing inside of the test tube. Two Lakeshore silicon-diode DT-670-SD temperature sensors are
applied to measure the temperature of the inside and the outside of the test tube. In particular, the
two temperature sensors are positioned inside of the test tube to enhance the accuracy of the mea-
surement. A Honeywell model FP2000 pressure transducer with an operating range of 75 psi is
used at the inlet of the test tube to determine the precise thermodynamic state of the refrigerant. The
accuracy of the temperature sensor is ±0.02 K, and that of the pressure transducer is ± 0.5 kPa.
The entire suite of measurement instrumentation is connected to a data acquisition system
(National Instrument NI-USB-6343) to collect the experimental results. A SONY camcorder HXR-
MC50N is used to visually capture an image of the freezing and melting phenomena. This allows
the SLE of the various refrigerants and MRs to be analyzed by both the recorded image and the
temperature-pressure data.
To conveniently demonstrate the SLE of the refrigerants, LN2
was selected as the coolant to
freeze them. The experimental procedure of the visualization apparatus is as follows:
A. Evacuate the test tube and MR buffer until 6 ´10-4
kPa (5 mTorr) by vacuum pump.
B. Close MR supply valve and prepare the target MR with the required molar composition.
C. Charge the target MR into the test tube.
D. Feed LN2
into the LN2
container.
E. Freeze the target MR.
F. Stop feeding LN2
when the level of LN2
is reached to the top of the frozen MR in the test tube.
G. Record the temperature of the whole solidified MR until it melts completely.
H. Repeat the same experiment to establish the reliability of the experimental results.
376 J-T and Sorption Cryocooler Developments SOLID-LIQUID PHASE EQUILIBRIA FOR PURE & MIXED REFRIG 401401SOLID-LIQUID PHASE EQUILIBRIA FOR PURE & MIXED REFRIG

P#
012
6
Figure 4. Diagram for MR charging method: (a) schematics, and (b) Pressure-time diagram of actual
charging condition
A MR buffer was utilized to produce the exact composition of MR in the experiments. As
stated above, the tested MR obeys the ideal gas equation at room temperature; therefore, the com-
position of MR is simply proportional to the pressure ratio. In this manner, the composition of MR
is determined proportionally to the pressure ratio of pure refrigerant to total pressure of MR buffer.
Figure 4(a) displays a schematic of the mixing method for the target MR, and Figure 4(b) shows the
pressure-time diagram obtained under experimental conditions for an actual four-component MR.
Experimental Results for Pure Refrigerant and Binary MR
As mentioned above, pure refrigerants and binary MR were tested in the experiment to verify
the accuracy of experimental method. Table 2 represents the experimental results of pure refriger-
ants and binary MRs. The measurement error with a pure refrigerant was less than 0.6% in this
experimental apparatus. Furthermore, the maximum experimental error was 1.4% for a binary MR.
The experimental error for the R125+N2
O binary MR was obtained by comparing it to the
calculation results for an ideal solution. By contrast, that of the R245fa + R125 binary MR was
compared with the calculation results for a regular solution. Figures 5(a) and (b) display compari-
sons of the experimental results and the calculation results for R125+N2
O and R245fa + R125,
respectively. The experimental results for the R125 + N2
O binary MR are well matched with the
other literature in the error of 1.4%.6 Similarly, the experimental results for the R245fa + R125
binary MR have errors less than 1.32% when compared to the calculation results for a regular
solution. Thus, the visualization experimental procedure in this paper is considered appropriate for
measuring the freezing point of both a pure refrigerant and a MR.
Table 2. Experimental results of pure refrigerants and binary mixed refrigerants
377SOLID-LIQUID PHASE EQUILIBRIA FOR PURE & MIXED REFRIG J-T and Sorption Cryocooler Developments 402402 J-T AND SORPTION CRYOCOOLER DEVELOPMENTS

P#
012
7
(a) (b)
Figure 5. Comparisons of experimental results and calculation results for (a) R125+N2
O binary
MR, and (b) R245fa+R125 binary MR
Experimental Results for Multi-Component MR
The measurement accuracy of the SLE by the visualization experimental apparatus was veri-
fied by the preliminary experimental results. The next step was to measure the SLE for the four-
component MR set of Ar, R14, R23, and R218 using the same experimental apparatus. Firstly, the
MR composition of Ar:R14:R23:R218 = 0.17:0.30:0.20:0.33 was selected to compare with mea-
surements in previous research.13
The calculation result using regular solution theory for this com-
position is shown in Table 3. The results are expressed as the maximum mole fraction of the target
MR of each component that can exist in the liquid state. The shaded part in Table 3 denotes that the
refrigerant should be solidified at the corresponding temperature. According to the calculation re-
sults, the liquid-only temperature for the target MR may be limited by the component of R23.
Consequently, reducing the mole fraction of R23 should be an effective method to lower the tem-
perature of SLE. Figure 6 shows the calculation result with the same ratio for the rest of the MR
while the molar composition of R23 is varied. The calculation results using regular solution theory
suggest that the temperature of SLE for the target MR could be decreased up to 46 K in the absence
of R23.
Additional experiments were conducted using several sets of molar composition. The tested
MR had a variation scale of 0.025 mole fraction of R23. For example, the MR set which had the
second largest composition of R23 is composed of the mole fraction of Ar:R14:R23:R218 =
0.17:0.30:0.175:0.33. The aforementioned mole fraction is converted as Ar:R14:R23:R218 =
0.17:0.31:0.18:0.34. Similarly, nine sets of MR which had these variations of R23 fraction were
measured for SLE using the visualization experimental apparatus.
Table 3. Calculation result of regular solution theory for Ar:R14:R23:R218 = 0.17:0.30:0.20:0.33
378 J-T and Sorption Cryocooler Developments SOLID-LIQUID PHASE EQUILIBRIA FOR PURE & MIXED REFRIG 403403SOLID-LIQUID PHASE EQUILIBRIA FOR PURE & MIXED REFRIG

P#
012
8
Figure 6. Calculation results of regular solution and ideal solution for various mole fraction of R23
Figure 7. Recorded image of the experiment with Ar:R14:R23:R218 = 0.17:0.30:0.10:0.33
(Ar:R14:R23:R218 = 0.19:0.33:0.11:0.37) (a) solid (freezing) state and (b) liquid (melting) state
Figure 8. Measurement data of the experiment for Ar:R14:R23:R218 = 0.17:0.30:0.10:0.33
A representative experimental image of the MR (Ar:R14:R23:R218 = 0.17:0.30:0.10:0.33) is
presented in Figure 7. Figures 7(a) and (b) show the recorded image during the experiments in solid
state and liquid state, respectively. The experimental temperature-time data are shown in Figure 8.
The temperature history shows a slight gradient change, although this small transition is difficult to
notice. This non-separable temperature transition occurs by the temperature glide of the two-phase
state of the MR. Thus, the melting temperature is identified by the recorded image when the whole
frozen MR changed into liquid phase.
Figure 9 provides a comparison of the experimental results and the analytical calculation re-
sults. The measurement errors of the experiment are also depicted with the experimental results.
The maximum error of mole fraction in the experimental results is 0.0025; this is determined by the
pressure transducer error and the maximum error of temperature measurement (0.5 K) from the
379SOLID-LIQUID PHASE EQUILIBRIA FOR PURE & MIXED REFRIG J-T and Sorption Cryocooler Developments 404404 J-T AND SORPTION CRYOCOOLER DEVELOPMENTS

P#
012
9
variation of temperature sensors inside of the test tube. Both analytical results (regular and ideal
solution) display the gradual reduction of temperature of the SLE when the R23 mole fraction is
decreased to 0.05. However, the experimental results demonstrate little change by R23 fraction
when the molar composition of R23 is larger than 0.05. Moreover, the calculation result by the
regular solution theory predicts 89 K, whereas the experimental result indicates 110 K when the
mole fraction of R23 is 0.025. Furthermore, the temperature of SLE in the case of the MR that has
no R23 composition shows a large gap between the experimental result (96 K) and the result of
regular solution theory (46 K).
The largest discrepancy between the experimental results and the analytical calculations ap-
pears when the R23 composition is small. These errors may occur due to the absence of accurate
binary parameters for each component. If the solubility parameter Û is similar between those com-
ponents, then the contribution of the binary parameter l12
is important in the SLE.11
Therefore, in
the case of the Ar, R14, R23, R218 mixture, the six binary parameters in the regular solution theory
should be investigated to predict a more accurate freezing temperature.
CONCLUSIONS
A visualization experimental apparatus was developed to estimate the SLE of the desired tar-
get MR. This apparatus successfully satisfied the prediction criteria with a maximum error of 0.4%
for pure refrigerants when compared with literature, and a maximum error 1.4% for binary MRs in
comparison to the analytical models. The MR set of Ar, R14, R23, and R218 was examined in this
experimental apparatus to verify the lowest temperature without freezing problems for a cryogenic
MR J-T refrigerator. The tested MR set indicates the lowest temperature of SLE as 96 K without
R23, while the SLE temperature is approximately 116 K with more than 5% of R23. According to
the measurement results in this paper, a MR J-T refrigerator which uses this set of MR should
operate at temperatures above 120 K.
ACKNOWLEDGMENT
This research was supported by the Converging Research Center Program funded by the Min-
istry of Education, Science and Technology (2013K000406).
REFERENCES
1. Walimbe, N.S., Narayankhedkar, K.G., and Atrey, M.D., “Experimental investigation on mixed refrig-
erant Joule-Thomson cryocooler with flammable and non-flammable refrigerant mixtures,” Cryogen-
ics, vol. 50, no. 10 (2010), pp. 653-659.
2. Baek, S., Hwang, G., and Jeong, S., “Development of the hybrid JT-expander cycle for NG liquefac-
tion cycle,” Advances in Cryogenic Engineering 55, Melville, New York (2010), pp. 1113- 1120.
Figure 9. Comparison of experimental results and calculation results of regular
solution and ideal solution
380 J-T and Sorption Cryocooler Developments SOLID-LIQUID PHASE EQUILIBRIA FOR PURE & MIXED REFRIG 405405SOLID-LIQUID PHASE EQUILIBRIA FOR PURE & MIXED REFRIG

P#
012
103. Lee, J., Hwang, G., Jeong, S., Park, B. J., and Han, Y. H., “Design of high efficiency mixed refrigerant
Joule-Thomson refrigerator for cooling HTS cable,” Cryogenics, vol. 51, no. 7 (2011), pp. 408-414.
4. Wu, Y., Zalewski, D. R., Vermeer, C. H., and ter Brake, H. J. M., “Optimization of the working fluid
for a sorption-based Joule-Thomson cooler,” Cryogenics, vol. 58, no. 0 (2013), pp. 5-13.
5. Lin, M. H., Bradley, P. E., Huber, M. L., Lewis, R., Radebaugh, R., and Lee, Y. C., “Mixed refrigerants
for a glass capillary micro cryogenic cooler,” Cryogenics, vol. 50, no. 8 (2010), pp. 439- 442.
6. Di Nicola, G., Santori, G., and Stryjek, R., “Solid-Liquid Equilibria for the Carbon Dioxide + 1,1-
Tetrafluoroethane and Nitrous Oxide + 1,1-Tetrafluoroethane Systems,” Journal of Chemical & Engi-
neering Data, vol. 53, no. 8 (2008), pp. 1980-1983.
7. Nicola, G. D., Giuliani, G., Polonara, F., Santori, G., and Stryjek, R., “Solid–Liquid Equilibria for the
CO2 + R23 and N2O + R23 Systems,” International Journal of Thermophysics, vol. 31, no. 10 (2008),
pp. 1880-1887.
8. Nicola, G., Moglie, M., Santori, G., and Stryjek, R., “Solid–Liquid Equilibria for the CO2 + R143a and
N2O + R143a Systems,” International Journal of Thermophysics, vol. 30, no. 4 (2009), pp. 1155-
1164.
9. Jakob, A., Joh, R., Rose, C., and Gmehling, J., “Solid-liquid equilibria in binary mixtures of organic
compounds,” Fluid Phase Equilibria, vol. 113, no. 1-2 (1995), pp. 117-126.
10. Coutinho, J. A. P., “Predictive UNIQUAC: A New Model for the Description of Multiphase Solid-
Liquid Equilibria in Complex Hydrocarbon Mixtures,” Industrial & Engineering Chemistry Research,
vol. 37, no. 12 (1998), pp. 4870-4875.
11. Reid, R.C., Prausnitz, J.M., and Poling, B.E., The properties of gases and liquids. 4th ed., New York
(1987).
12. Lemmon, E.W., Huber, M.L., and M.O. McLinden, NIST Standard Reference Database 23: Reference
fluid thermodynamic and transport properties-REFPROP. 2010, National Institute of Standards and
Technology, Standard Reference Data Program: Gaithersburg, MD.
13. Lee, C.L., J., Yoo, J., and Jeong, S. “Analysis of the freezing possibility for non-flammable dual mixed
refrigerant cycle (Korean),” The 8th Korean Congress of Refrigeration Seoul (2014), pp. 150-153.
381SOLID-LIQUID PHASE EQUILIBRIA FOR PURE & MIXED REFRIG J-T and Sorption Cryocooler Developments 406406 J-T AND SORPTION CRYOCOOLER DEVELOPMENTS