investigation of the seasonal variations of aerosol
TRANSCRIPT

University of North Dakota
UND Scholarly Commons
Theses and Dissertations Theses, Dissertations, and Senior Projects
January 2014
Investigation Of The Seasonal Variations OfAerosol Physicochemical Properties And TheirImpact On Cloud Condensation Nuclei NumberConcentrationTimothy Logan
Follow this and additional works at: https://commons.und.edu/theses
This Dissertation is brought to you for free and open access by the Theses, Dissertations, and Senior Projects at UND Scholarly Commons. It has been
accepted for inclusion in Theses and Dissertations by an authorized administrator of UND Scholarly Commons. For more information, please contact
Recommended CitationLogan, Timothy, "Investigation Of The Seasonal Variations Of Aerosol Physicochemical Properties And Their Impact On CloudCondensation Nuclei Number Concentration" (2014). Theses and Dissertations. 1679.https://commons.und.edu/theses/1679

INVESTIGATION OF THE SEASONAL VARIATIONS OF AEROSOL PHYSICO-
CHEMICAL PROPERTIES AND THEIR IMPACT ON CLOUD CONDENSATION
NUCLEI NUMBER CONCENTRATION
by
Timothy S. Logan
Bachelor of Arts, University of Virginia, 1993
Master of Science, University of North Dakota, 2009
A Dissertation
Submitted to the Graduate Faculty
of the
University of North Dakota
in partial fulfillment of the requirements
for the degree of
Doctor of Philosophy
Grand Forks, North Dakota
August
2014

ii
Copyright 2014 Timothy S. Logan

iii
This dissertation, submitted by Timothy S. Logan in partial fulfillment of the
requirements for the Degree of Doctor of Philosophy from the University of North
Dakota, has been read by the Faculty Advisory Committee under whom the work has
been done and is hereby approved.
_____________________________________
Dr. Baike Xi
_____________________________________
Dr. Xiquan Dong
_____________________________________
Dr. Jianglong Zhang
_____________________________________
Mike Poellot
_____________________________________
Dr. Zhanqing Li
_____________________________________
Dr. Michael Mann
This dissertation meets the standards for appearance, conforms to the style and
format requirements of the Graduate School of the University of North Dakota, and is
hereby approved.
_______________________________
Dr. Wayne Swisher, Dean
_______________________________
Date

iv
PERMISSION
Title Investigation of the Seasonal Variations of Aerosol Physico-chemical
Properties and Their Impact on Cloud Condensation Nuclei Number
Concentration
Department Atmospheric Sciences
Degree Doctor of Philosophy
In presenting this dissertation in partial fulfillment of the requirements for a
doctoral degree from the University of North Dakota, I agree that the library of this
University shall make it freely available for inspection. I further agree that permission
for extensive copying for scholarly purposes may be granted by the professor who
supervised my dissertation work or, in his absence, by the chairperson of the department
or the dean of the Graduate School. It is understood that any copying or publication or
other use of this thesis or part thereof for financial gain shall not be allowed without my
written permission. It is also understood that due recognition shall be given to me and to
the University of North Dakota in any scholarly use which may be made of any material
in my thesis.
Signature ____________________________
Timothy Logan
Date _______5/27/2014_____________
v
TABLE OF CONTENTS
LIST OF FIGURES ........................................................................................................ ix
LIST OF TABLES .......................................................................................................... xiii
ACKNOWLEDGEMENTS ............................................................................................ xiv
ABSTRACT .................................................................................................................... xv
CHAPTER
I. INTRODUCTION .................................................................................. 1
Aerosol Properties and Transport ............................................... 1
Aerosol Indirect Effect ................................................................ 5
Purpose and Significance of this Dissertation ............................ 5
II. DATASETS AND INSTRUMENTATION ........................................... 7
Datasets ....................................................................................... 7
Particle Size Distribution ................................................ 7
Aerosol Optical Depth and Angström Exponent ............ 11
Absorption Aerosol Optical Depth and Absorption
Angström Exponent ........................................................ 12
Single Scattering Albedo and Single Scattering
Co-albedo........................................................................... 13
Hybrid Single Particle Lagrangian Integrated Trajectory
Model………………………… ....................................... 14
Instrumentation ........................................................................... 14
Aerosol Robotic Network ............................................... 14

vi
Aircraft Instruments ........................................................ 16
Differential absorption LIDAR ........................... 17
Nephelometer ...................................................... 18
Particle soot absorption photometer .................... 19
Atmospheric Radiation Measurement Mobile Facility ... 19
CALIPSO Satellite Observations ..................................... 21
MODIS Satellite Observations ........................................ 22
Dissertation Study Regions ......................................................... 24
III. THEORETICAL DATABASE COMPARISON STUDY……………… 26
Theoretical Mineral Dust Model ................................................. 27
Methodology ................................................................................ 29
Meteorological Conditions .......................................................... 29
Mineral Dust Properties Inferred from the Particle Volume Size
Distribution, AOD, AAOD, AEAOD, and AAEAOD Parameters ... 32
Comparisons of o(λ) Between Theoretical Calculations and
AERONET Retrievals .................................................................. 38
Aerosol Radiative Effect ............................................................. 43
IV. METHODOLOGY ................................................................................. 47
Aerosol Classification at Four Selected Single Mode Aerosol
Dominated Sites ........................................................................... 47
Aerosol Classification Method Involving AEAOD and
oabs .................................................................................. 51
Aerosol Transport ........................................................................ 53
V. RESULTS AND DISCUSSIONS ............................................................. 56
SQ1: What Are the Seasonal and Regional Variations of Aerosol
Physico-chemical Properties at Four Selected Asian Sites? ........ 56

vii
Annual and Seasonal Aerosol Size Distributions ............ 56
Seasonal Variation of Aerosol Optical Depth .................. 59
Seasonal Variation of Absorption Aerosol Optical
Depth ................................................................................ 60
Seasonal Variation of Angström Exponent...................... 61
Seasonal Variation of Absorption Angström Exponent... 62
Spectral Dependences of AOD, AAOD, and oabs .......... 64
Aerosol Classification Method Involving AEAOD and
oabs .................................................................................. 67
SQ2: How Do These Aerosol Properties Change During
Transpacific and Intra-continental Long Range Transport? ........ 70
Asian Aerosol Transport .................................................. 71
Biomass Burning Aerosol Transport over the Northern
Great Plains ...................................................................... 81
Biomass smoke plume transport .......................... 82
Biomass smoke plume optical properties ............ 85
Biomass smoke plume physico-chemical
properties.............................................................. 86
Biomass smoke plume radiative properties ......... 91
SQ3: What Are the Impacts of Aerosol Properties on Marine
Boundary Layer Cloud Condensation Nuclei Number
Concentration? ............................................................................. 94
Seasonal Aerosol Properties over the Azores ...... 94
Aerosol Properties of Six Selected Cases and
their Impacts on MBL NCCN ................................. 98
VI. CONCLUSIONS .................................................................................... 113
The First Scientific Question ...................................................... 113
viii
The Second Scientific Question .................................................. 114
The Third Scientific Question ..................................................... 115
Future Areas of Research ............................................................. 117
APPENDICES ..................................................................................................... 121
REFERENCES .................................................................................................... 131
ix
LIST OF FIGURES
Figure Page
1. Global map of simulated aerosol transport from source to sink regions over
land and ocean... .................................................................................................... 3
2. The three aerosols modes: nucleation, accumulation, and coarse and
corresponding number (dN/dlnR), surface area (dA/dlnR), volume (dV/dlnR)
lognormal size distributions. ................................................................................. 8
3. Particle volume size distribution of two pollution regions (NASA Goddard
and Mexico City), a mineral dust region (Solar Village), and a biomass
burning region (Alta Floresta)… ......................................................................... 11
4. Global network of AERONET observation stations. .......................................... 15
5. NASA DC-8 flight tracks during the 2006 INTEX-B field campaign from the
Logan et al. (2010) study. .................................................................................... 17
6. The AMF-Azores and Graciosa AERONET sites used during the Clouds,
Aerosol, and Precipitation in the Marine Boundary Layer (CAP-MBL)
campaign are located on Graciosa Island. ........................................................... 20
7. Example of a biomass burning smoke plume captured over the Atmospheric
Radiation Measurement-Southern Great Plains (ARM-SGP) facility as
observed by CALIPSO. ....................................................................................... 22
8. Moderate Resolution Imaging Spectroradiometer (MODIS) Terra image of the
biomass smoke plume from Figure 7 that spanned the Gulf of Mexico and was
observed by the ARM-SGP facility (red star). .................................................... 24
9. Combination of AERONET sites (stars) and study regions (boxes) for Asian
aerosol properties and transport (white and red), North American aerosol
properties and transport (blue), and aerosol impacts on marine CCN. ............... 25
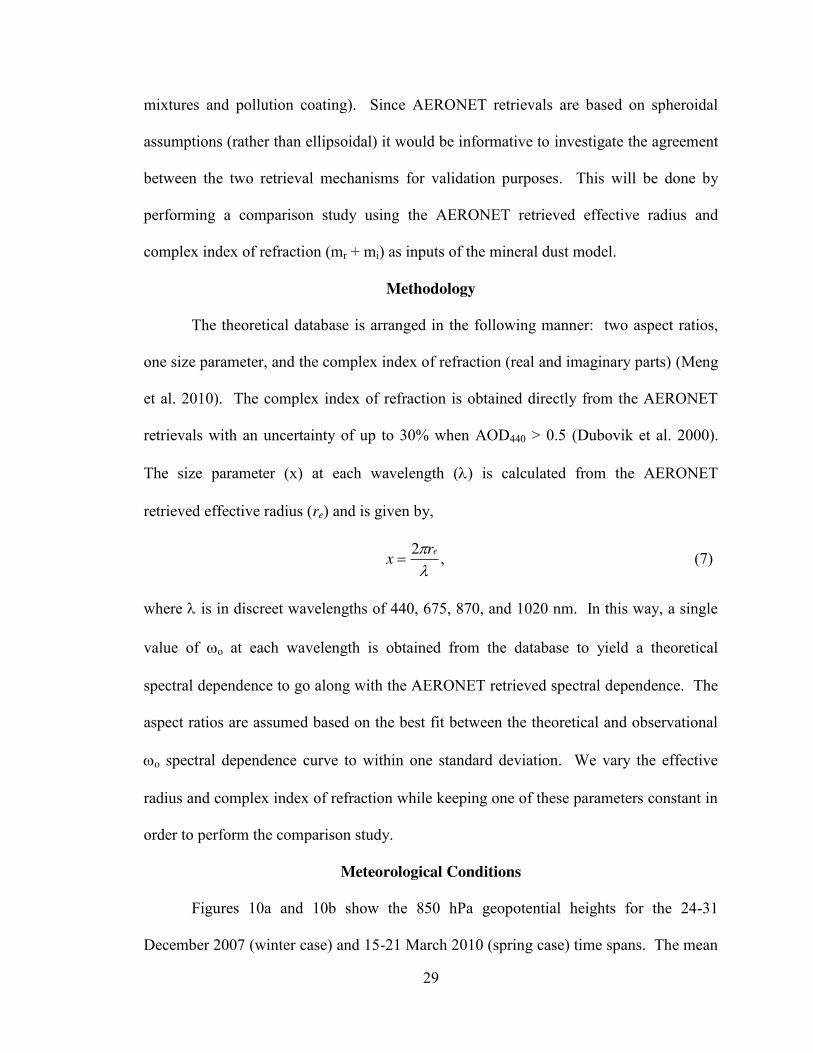
10. (a) 850 hPa geopotential heights showing the low pressure (purple) and high
pressure systems (orange) and the inferred wind patterns as a result of their
positions for the winter and (b) spring cases. ...................................................... 31
11. Particle volume size distributions of the (a) winter and (b) spring cases. ........... 33
12. Spectral dependence of AOD for the (a) winter and (b) spring cases. ................ 34
13. Same as Fig. 12 but for AAOD. .......................................................................... 35

x
14. Comparison between the observed (solid) and theoretically calculated
(dashed) o for the winter (red circle) and spring (blue box) cases at (a)
SACOL, (b) Xianghe, and (c) Taihu. .................................................................. 41
15. Same as Fig. 14 but in this case the effective radius is held constant while the
index of refraction varies. .................................................................................... 42
16. AERONET retrieved (a) AOD and (b) AAOD spectral dependences for single
mode dominated sites from the Chung et al. (2012) study. ................................. 47
17. Log-log relationship of the mean extinction aerosol optical depth (AOD)
spectral dependence for all aerosol cases at each single mode aerosol site. ....... 49
18. Classification of four AERONET sites representing weakly absorbing (NASA
Goddard) and strongly absorbing (Mexico City) pollution, mineral dust (Solar
Village) and biomass burning (Alta Floresta) aerosol types. .............................. 52
19. Aerosol volume size distributions over the four selected AERONET sites. ....... 57
20. Monthly means of the aerosol optical depth (AOD) parameter at the 440 nm
wavelength. .......................................................................................................... 60
21. Same as Fig. 20 but for absorption aerosol optical depth (AAOD). ................... 61
22. Same as Fig. 20 but for the Angström exponent with a spectral range of
440-870 nm. ......................................................................................................... 62
23. Same as Fig. 20 but for the absorption Angström exponent. .............................. 63
24. (a) Log-log relationship of the mean extinction aerosol optical depth spectral
dependence for all aerosols cases at each AERONET site: 2001-2010
(Xianghe), 2005-2010 (Taihu), 2006-2011 (SACOL), and 2003-2009
(Mukdahan). ........................................................................................................ 65
25. AEAOD and oabs classification of the aerosol physico-chemical properties over
the four selected AERONET sites. ...................................................................... 67
26. Transpacific transport of Asian aerosol plume (10 April 2006) intercepted by
DC-8 aircraft over the eastern remote Pacific Ocean on 17 April 2006. ............ 72
27. Averaged MODIS AOD values with 0.5o x 0.5
o grid box during INTEX-B IOP
the period 17 April-15 May 2006 on (a) Aqua and (b) Terra, and (c) their
overall transpacific transport zonal trend. ........................................................... 73

xi
28. Aerosol scattering ratios observed by Differential Absorption LIDAR (DIAL)
onboard the DC-8 aircraft during the INTEX-B field campaign over the
remote Pacific Ocean. .......................................................................................... 75
29. (a,b) Case I and (c,d) Case II. .............................................................................. 77
30. The NOAA HYSPLIT backward trajectories of dust plumes intercepted by
DC-8 aircraft (denoted by black circles) over the remote Pacific Ocean for (a)
Case I (2100 UTC 17 April 2006), (b) Case II (0300 UTC 24 April 2006), (c)
Case III (0200 UTC 29 April 2006), and
(d) Case IV (0400 UTC 29 April 2006). ............................................................. 80
31. Aerosol loading of smoke plumes as evidenced by the periodic increase and
decrease of the hourly aerosol optical depth (AOD) observed by the newly
installed Grand Forks AERONET site (47.91oN, 97.32
oW). .............................. 83
32. HYSPLIT backward trajectories of the six cases (with the same color code as
Fig. 30). ............................................................................................................... 84
33. Navy Aerosol Analysis and Prediction System (NAAPS) model output
(http://www.nrlmry.navy.mil/aerosol/) showing the locations of the wildfire
source regions (dark red regions) for Cases (a) III, (b) V, and (c) VI while (d),
(e), and (f) show the smoke plumes for the respective cases over Grand Forks
(black circle). ....................................................................................................... 85
34. Daily mean AERONET retrieved (a) particle volume size distributions and the
spectral dependences of (b) AOD, (c) AAOD, and (d) oabs for the six selected
cases. .................................................................................................................... 86
35. Monthly mean and standard deviation of Graciosa AERONET retrieved (a)
AOD and (b) AE and (c) AMF-Azores mean wind speeds during CAP-MBL. .. 95
36. AERONET retrieved yearly and seasonal mean aerosol (a) volume and (b)
number size distributions. .................................................................................... 97
37. AERONET retrieved (a) volume and (b) number size distributions as well as
the (c) spectral dependences for the five selected cases. ..................................... 99
38. Cases I, II, IV, and V AOS measured aerosol properties as classified by the
Logan et al. (2013a) method: AEneph > 0.75 (< 0.75) for fine (coarse) mode,
and ωoabs < 0.07 (> 0.07) for weak (strong) absorption. .................................... 100
39. HYSPLIT backward trajectories at 1.5-km level (solid lines) for the five
selected cases. .................................................................................................... 102
xii
40. (a-c) Scattering coefficient (sp) and fine mode fraction (FMF), (d-f)
absorption coefficient (ap), and (g-i) CCN from hourly averaged
AMF-Azores AOS observations........................................................................ 105
41. Correlation plots (r-values) between CCN number concentration (NCCN) and
sp450.. ................................................................................................................ 110
42. The log-log AIE relationships of the cloud base retrieved re and surface
measured sp for the (a) 10 July 2009 dust case, (b) 9 May 2010 volcanic ash
case, and (c) 13 May 2010 pollution case during the CAP-MBL campaign
conducted over the Azores. ............................................................................... 119
A1. Number size distributions for the (a) individual cases using the AERONET
bin radius R instead of the effective radius of the aerosol particle (re)
as well as the (b) yearly and seasonal means.....................................................124
B1. Scatterplots of (a) total cation vs. total anion and (b) calcium vs. carbonate
(cation-anion difference)……………………………………………………....125
B2. Scatterplots of (a) anthropogenic (pollution) cations vs. anions and (b)
sea salt ions (Na+ vs. Cl
-)………………………...………................................128
B3. Aerosol classification method using Ca2+
concentration observations for
(a) Case I, (b) Case II, and (c) Cases III and IV................................................129

xiii
LIST OF TABLES
Table Page
1. Summary of the AERONET retrieved aerosol optical properties for the winter
and spring cases. .................................................................................................. 36
2. Summary of the theoretical model parameters used in this study. ...................... 37
3. Summary of the AERONET calculated BOA and TOA aerosol radiative effect
(ARE) values. ....................................................................................................... 44
4. Summary of statistical data from the four AERONET sites.. .............................. 70
5. A summary of the physical and optical properties of the four selected Asian
dust events intercepted by the DC-8 aircraft. ....................................................... 79
6. A summary of the mean AOD, AE, and AAE values for the six cases. .............. 90
7. Hourly retrievals of aerosol radiative forcing (ARF) and aerosol radiative
forcing efficiencies (ARFeff) at the surface for the six selected cases. ................ 93
8. Summary of mean AOD440, Angström exponent (AE), and fine mode
fraction (FMF) values for the five selected cases at the AMF-Azores site.........112

xiv
ACKNOWLEDGEMENTS
Thank you to my beloved grandmother and my family for shaping my mind
through the years. Thank you to all my friends at Morris School District in New Jersey
who believed in me and helped me to realize that learning should always be lifelong,
meaningful, and challenging. Thank you to my advising committee of Dr. Baike Xi, Dr.
Xiquan Dong, Dr. Jianglong Zhang, Prof. Mike Poellot, Dr. Zhanqing Li, and Dr.
Michael Mann for their guidance, expertise, and support. Thank you to UND At. Sci. and
the Newman Center for all your help during the good and bad times. You never let me
forget who I am and what I am capable of accomplishing.
This dissertation was partially supported by the North Dakota Space Grant
Consortium, National Aeronautic and Space Administration (NASA), National Science
Foundation (NSF), and the Department of Energy (DOE). All AERONET data was
provided by the website located at http://aeronet.gsfc.nasa.gov/ and I am grateful for all
PI’s in North America, Asia, and Africa. The HYSPLIT transport model was provided
by the NOAA Air Resources Laboratory (ARL) and can be found at the READY website
(http://ready.arl.noaa.gov/). Additional data was provided by the DOE Atmospheric
Radiation Measurement (ARM) program located at www.archive.arm.gov. I also wish
to thank all other scientists and friends in the United States, China, and other countries
abroad for their help. It was an honor to work and collaborate with them during the past
seven years. Their advice and input has been greatly appreciated and I look forward to
future collaboration.

xv
ABSTRACT
Aerosols are among the most complex yet widely studied components of the
atmosphere not only due to the seasonal variability of their physical and chemical
properties but also their effects on climate change. The three main aerosol types that are
known to affect the physics and chemistry of the atmosphere are: mineral dust,
anthropogenic pollution, and biomass burning aerosols. In order to understand how these
aerosols affect the atmosphere, this dissertation addresses the following three scientific
questions through a combination of surface and satellite observations:
SQ1: What are the seasonal and regional variations of aerosol physico-chemical
properties at four selected Asian sites?
SQ2: How do these aerosol properties change during transpacific and intra-
continental long range transport?
SQ3: What are the impacts of aerosol properties on marine boundary layer cloud
condensation nuclei number concentration?
This dissertation uses an innovative approach to classify aerosol properties by
region and season to address SQ1. This is useful because this method provides an
additional dimension when investigating the physico-chemical properties of aerosols by
linking a regional and seasonal dependence to both the aerosol direct and indirect effects.
This method involves isolating the aerosol physico-chemical properties into four separate
regions using AERONET retrieved Angström exponent (AEAOD) and single scattering co-
albedo (oabs) to denote aerosol size and absorptive properties. The aerosols events are

xvi
then clustered by season. The method is first applied to four AERONET sites
representing single mode aerosol dominant regions: weakly absorbing pollution (NASA
Goddard), strongly absorbing pollution (Mexico City), mineral dust (Solar Village), and
biomass burning smoke (Alta Floresta). The method is then applied to four Asian sites
that represent complicated aerosol components.
There are strong regional and seasonal influences of the four aerosol types over
the selected four Asian sites. A strongly absorbing mineral dust influence is seen at the
Xianghe, Taihu, and SACOL sites during the spring months (MAM) as given by coarse
mode dominance. There is a shift towards weakly absorbing pollution (sulfate) and
biomass (OC) aerosol dominance in the summer (JJA) and autumn (SON) months as
given by a strong fine mode influence. A winter season (DJF) shift toward strongly fine
mode, absorbing particles (BC and OC) is observed at Xianghe and Taihu. At
Mukdahan, a strong fine mode influence is evident year round with weakly and strongly
absorbing biomass particles dominant in the autumn and winter months, respectively,
while particles exhibit variable absorption during the spring season.
To address SQ2, four cases are selected in Asia to investigate how the optical
properties of Asian aerosol plumes change during transport across the remote Pacific
Ocean. In addition, six strong smoke events are selected to investigate how the physical
and chemical properties of biomass smoke aerosols change during transport in North
America. From four selected Asian cases, it was shown by DC-8 aircraft in situ
measurements that the Asian plumes contained varying amounts of mineral dust and
pollution aerosols during transport. In addition, backward trajectory analysis identified
two main dust source regions (Gobi and Taklamakan deserts) and urban/industrial

xvii
pollution regions in central and eastern China. During the anomalously active wildfire
season of 2012 in North America, strong smoke events were observed over the Northern
Great Plains region by the Grand Forks, North Dakota, AERONET site and selected as
cases. The spectral dependences of absorption aerosol optical depth (AAOD) and oabs
illustrated the varying absorption of the smoke plumes due to carbonaceous particle
influences. The AAOD parameter was found to be primarily influenced by aerosol
particle size while oabs was more sensitive to the carbonaceous content. The aerosols
likely contain strongly absorbing carbonaceous particles generated from the flaming
combustion mode. The cases represented complex mixtures of the flaming and
smoldering combustion phases.
Lastly, SQ3 is addressed by using a multi-platform dataset from the Clouds,
Aerosol, and Precipitation in the Marine Boundary Layer (CAP-MBL) Graciosa, Azores,
2009-2010 field campaign. The seasonal aerosol particle volume and number size
distributions, AOD, and AEAOD during the CAP-MBL campaign have shown that a low
overall mean AOD440 of 0.12 denoted a clean environment over this region that typically
contains MBL sea salt. In terms of aerosol volume, a bimodal signal was prominent
where the coarse mode influence (r ≥ 1 μm) dominated that of the fine mode (r < 1 μm)
throughout the year. However, there are considerable continental fine mode aerosols
advected to the Azores region during summer months, including Saharan mineral dust,
volcanic ash, biomass smoke, and pollution from North American as identified by
HYSPLIT backward trajectories. These aerosol types have been shown to have impacts
on MBL cloud condensation nuclei (CCN) that are likely different from coarse mode
marine aerosols (e.g., sea salt) (Rémillard et al. 2014; Wood et al. 2014). The alternating

xviii
presence of dominant clean air masses with periodic episodes of polluted air masses will
provide a substantial variety in aerosol properties during the summer. This will provide a
great opportunity to investigate the interactions between aerosol and cloud properties in
terms of the aerosol indirect effect (AIE).

1
CHAPTER I
INTRODUCTION
Aerosols have an impact on global/regional climate change through their direct
radiative effects by changing the optical properties of the Earth’s atmosphere specifically
through the scattering and absorption of both solar and thermal infrared radiation (Tanré
et al. 2001). As a result, aerosols ultimately act as negative radiative forcing agents by
reducing the amount of direct downwelling solar radiation to the surface creating a
cooling effect (Ramanathan et al. 2001; Li et al. 2007a, b; Bergstrom et al. 2007). In
addition, aerosols indirectly affect the climate by altering cloud microphysical properties
such as cloud albedo, lifetime and precipitation (Li et al. 2007a, b; IPCC 2007;
Ramanathan et al. 2001). What is not well known is the effects different types of
aerosols (e.g., mineral dust, pollution, biomass burning) may have on cloud formation
processes. Hence, studying the transport of aerosols plays a vital role in the
understanding of regional and global climate change.
Aerosol Properties and Transport
Over the past few decades, numerous field campaigns have been carried out to
investigate the impact of aerosol transport on downwind regions. Major studies include
the Pacific Exploratory Mission (PEM) (Bachmeier et al. 1996), East Asian Studies of
Tropospheric Aerosols: An International Regional Experiment (EAST-AIRE) (Li et al.
2007a, b), Transport and Chemical Evolution-Pacific (TRACE-P) in 2001 (Huebert et al.

2
2003; Jacob et al. 2003), Intercontinental Chemical Transport Experiment-Phase B
(INTEX-B) (Singh et al. 2006), Fire Lab at Missoula Experiment (FLAME) (Mack et al.
2010), and the Clouds, Aerosol, and Precipitation in the Marine Boundary Layer (CAP-
MBL) (Rémillard et al. 2012; Wood et al., 2014; Dong et al. 2014) field campaigns.
The PEM, TRACE-P, and ACE-Asia field campaigns investigated the impacts of
Asian dust transport from source regions in the Gobi and Taklamakan Deserts to regions
several hundreds to thousands of kilometers downwind. These field campaigns made use
of ground-based and satellite retrievals and in situ aircraft measurements in the vicinity of
the Asian mainland (ACE-Asia) as well as the remote Pacific Ocean (PEM and TRACE-
P). As a result, many studies on the effects of Asian dust and pollution on the
atmosphere have been and continue to be published. The more recent INTEX-B field
campaign added aerosol chemical measurements to the wealth of aerosol physical data
gathered by the other Asian campaigns. Chemical species such as calcium, sulfate, and
organic carbon compounds could now be used to track the behavior of Asian dust,
pollution, and biomass burning aerosols during transport, respectively.
Urban/industrial pollution, biomass burning smoke, and mineral dust particles
originating from various source regions around the globe (e.g., Asia, Africa, Europe, and
the Americas) have been studied over recent decades and continue to be of great
importance when investigating their impacts on the climate and human health. The
ongoing urbanization/industrialization in Asia, recent Saharan dust episodes in Africa,
and pollution and biomass smoke events originating in the Americas and Europe have
greatly added to the wide variety of aerosols observed in the atmosphere (Figure 1). This
in turn has increased the level of uncertainty when evaluating global climate change
3
(Hansen and Sato 2001; Bergstrom et al. 2007; Eck et al. 2010; Logan et al. 2013a, c;
Logan et al. 2014).
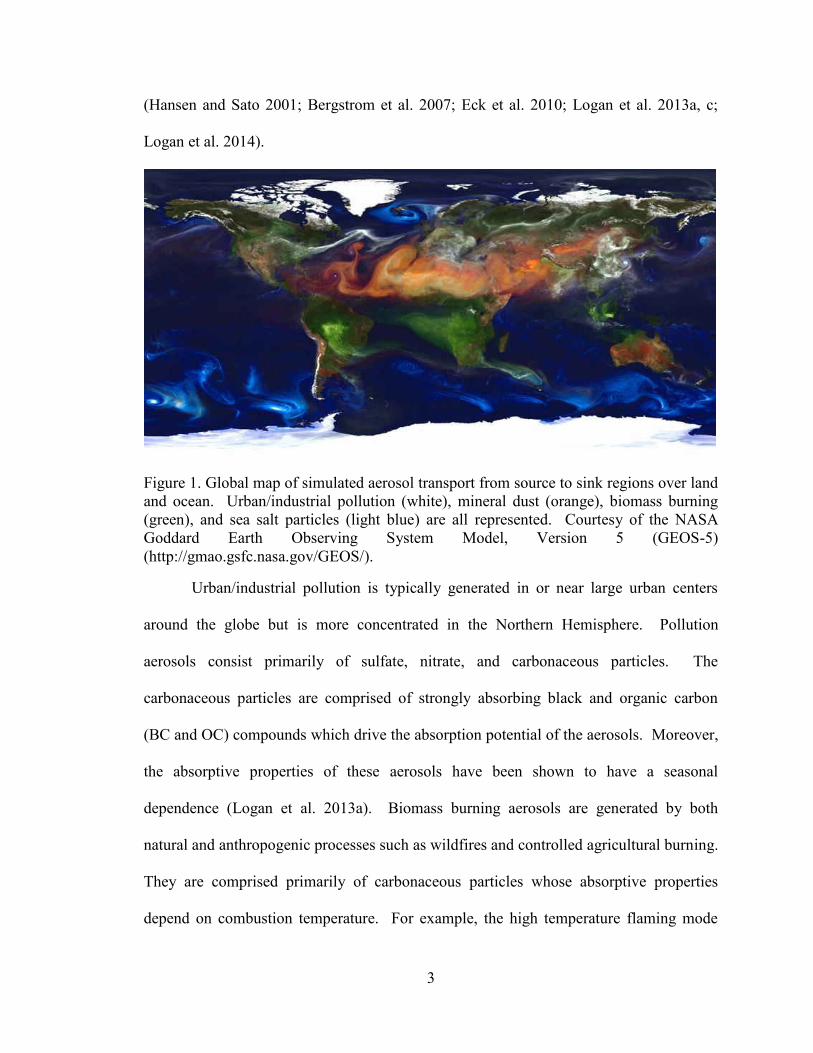
Figure 1. Global map of simulated aerosol transport from source to sink regions over land
and ocean. Urban/industrial pollution (white), mineral dust (orange), biomass burning
(green), and sea salt particles (light blue) are all represented. Courtesy of the NASA
Goddard Earth Observing System Model, Version 5 (GEOS-5)
(http://gmao.gsfc.nasa.gov/GEOS/).
Urban/industrial pollution is typically generated in or near large urban centers
around the globe but is more concentrated in the Northern Hemisphere. Pollution
aerosols consist primarily of sulfate, nitrate, and carbonaceous particles. The
carbonaceous particles are comprised of strongly absorbing black and organic carbon
(BC and OC) compounds which drive the absorption potential of the aerosols. Moreover,
the absorptive properties of these aerosols have been shown to have a seasonal
dependence (Logan et al. 2013a). Biomass burning aerosols are generated by both
natural and anthropogenic processes such as wildfires and controlled agricultural burning.
They are comprised primarily of carbonaceous particles whose absorptive properties
depend on combustion temperature. For example, the high temperature flaming mode

4
tends to generate more strongly absorbing BC while the low temperature smoldering
mode generates both weakly and strongly absorbing OC (Reid and Hobbs 1998; Reid et
al. 1998; Lewis et al. 2008; Mack et al. 2010; Jacobson 2012).
Mineral dust aerosols strongly contribute to the aerosol direct effect and represent
the largest uncertainty in radiative forcing (IPCC 2001, 2007). The largest mineral dust
source regions in the world are found within the Asian and African continents. Strong
Asian dust episodes are more probable and intense during the spring months (Li et al.
2007b; Huang et al. 2008a; Yang et al. 2008; Logan et al. 2010; Logan et al. 2013a, b)
but can occur during any season. Under specific meteorological conditions (e.g., wind
speeds greater than 5 m s-1
associated with a low-pressure system and a dry spring
season), mineral dust and soil can be lofted into the free atmosphere and can be
transported from Asia to North America via the Pacific Ocean (Murayama et al. 2001;
Husar et al. 2001; Tsunematsu et al. 2005; Logan et al. 2010). In addition, the mineral
dust can mix with regional urban/industrial pollution and biomass smoke along the
transport pathway which creates more difficulty when investigating their impacts on
global climate.
Similarly, Saharan dust is often transported across great distances due to favorable
meteorological conditions (Logan et al. 2014). Strong high pressure systems situated in
the eastern remote Atlantic Ocean during the late spring and summer seasons can
transport Saharan dust, previously lofted into the atmosphere by continental low pressure
systems, from Africa to sink regions in the Americas and even Europe. In addition, late
summer and autumn cyclones (e.g., tropical waves, hurricanes, and extratropical systems)
can also transport Saharan dust to these same sink regions (Logan et al. 2014). How the

5
properties of mineral dust particles evolve and are then able to impact locations far
distant from their origin is still under investigation.
Aerosol Indirect Effect
Aerosols are known to influence atmospheric radiative transfer through the
aerosol indirect effect (AIE) by changing cloud and precipitation processes. Many
studies have made the attempt to investigate how the AIE will manifest itself by using a
combination of observations and model simulations (Feingold et al. 2006; Rosenfeld et
al. 2008; Li et al. 2011; Rémillard et al. 2012; Dong et al. 2014; Wood et al. 2014). In
most cases, the CCN concentration (NCCN), liquid water path (LWP), cloud droplet
effective radius (re), cloud-droplet number concentration (NC), and AOD parameters are
examined (Feingold et al. 2001; Feingold et al. 2003; Kim et al. 2003; Feingold et al.
2006; Tao et al. 2012). Assuming a fixed amount of precipitable water vapor in the
atmosphere, an increase in aerosol loading should lead to an increase in NCCN and NC
while decreasing re due to competition for available water vapor (Feingold et al. 2003;
Tao et al. 2012). However, not all aerosols cause an increase in NCCN and can thus have
conflicting results when investigating their role in the AIE (Logan et al. 2014). Hence,
there is a great need for more studies that take into account the nature of specific aerosol
types and their impacts on cloud forming processes (Wood et al. 2014).
Purpose and Significance of This Dissertation
Though the concept of aerosol classification is not new (e.g., Jeong et al. 2005;
Russell et al. 2010; Chung et al. 2012), this study uses an innovative approach to classify
aerosol properties by region and season. This is useful because this method provides an
additional dimension when investigating the physico-chemical properties of aerosols by

6
linking a regional and seasonal dependence to both the aerosol direct and indirect effects.
Three scientific questions have been addressed in this dissertation:
SQ1: What are the seasonal and regional variations of aerosol physico-chemical
properties at four selected Asian sites?
SQ2: How do these aerosol properties change during transpacific and intra-
continental long range transport?
SQ3: What are the impacts of aerosol properties on marine boundary layer cloud
condensation nuclei number concentration?
A multi-platform data analysis approach consisting of ground-based Aerosol
Robotic Network (AERONET) retrievals in addition to other surface, sub-orbital, and
satellite measurements as well as model output is used. Re-analysis data will be used to
illustrate the meteorological conditions that are responsible for aerosol transport. Surface
aerosol and CCN measurements from an intensive operating period (IOP) field campaign
conducted over the eastern remote Atlantic Ocean will provide information on aerosol
type and MBL NCCN.

7
CHAPTER II
DATASETS AND INSTRUMENTATION
Datasets
Particle Size Distribution
Atmospheric aerosol particles can be characterized by size (Schuster et al. 2006).
The size ranges fall into three general categories: Aitken (or nucleation) mode,
accumulation mode, and coarse mode. Note that in this study, the nucleation and
accumulation mode categories represent the fine mode. The fine mode denotes particles
of radius ≤ 1 m while the coarse mode denotes particles have a radius > 1 m (Figure
2).

8
Figure 2. The three aerosols modes: nucleation, accumulation, and coarse and
corresponding number (dN/dlnR), surface area (dA/dlnR), volume (dV/dlnR) lognormal
size distributions. Note that fine mode particles dominate the number and surface area
size distributions while coarse mode particles dominate the volume size distribution.
Figure courtesy of Niall Robinson.
Urban/industrial pollution and biomass smoke particles are typically fine mode in
size due to their manner of generation (e.g., flaming or smoldering combustion). In
contrast, mineral dust particles are typically observed in the coarse mode as they are
formed through the physical weathering of larger soil and rock particles. Mineral dust
can also be found in the fine mode as a result of chemical reactions between the calcium
and silicate compounds in the dust and acid compounds in the atmosphere such as sulfate
and nitrate (McNaughton et al. 2009; Leaitch et al. 2009).

9
The size distributions presented in Figure 2 assume a lognormal relationship
between number, area, volume and the particle size (log x-axis). This is the primary
assumption used in much of the aerosol community since it more accurately describes
particle size distributions of typical aerosols found in the atmosphere (Schuster et al.
2006). The particle number size distribution (dN/dlnR) is useful in determining which
mode dominates in terms of aerosol number concentration for a given range of particle
radii. This is useful when determining the effects of aerosols on cloud forming processes
such as growth from aerosol to cloud condensation nuclei to cloud droplet. Different
types of aerosols have been known to facilitate these processes more than others. For
example, hygroscopic (soluble) aerosols can readily activate as CCN while hydrophobic
(insoluble) aerosols make poor CCN. The surface area size distribution (dA/dlnR) is
more related to aerosol chemical properties. The accumulation mode dominates the size
distribution since more surface area is exposed to be reacted upon (e.g., gas-to-particle
and acid-base reactions) in this size range while there is a smaller peak in the coarse
mode. Stochastically, the Aitken mode is too small for significant atmospheric chemical
reactions to occur.
Many studies investigating aerosol optical properties use the particle volume size
distribution (dV/dlnR) rather than dN/dlnR because the radiative effects of atmospheric
aerosols are more closely related to their volume rather than number (Schuster et al.
2006). Note that there is a difference between in situ (e.g., aircraft and ground-based)
and column-integrated (e.g., AERONET and satellite) measurements of particle size
distribution. In situ measurements of particle size distribution typically have number per
units of sampling volume (e.g., # cm-3
) while column integrated measurements have

10
number per units of cross-sectional area (e.g., # m-2
). Though these measurements are
comparable, this dissertation makes the assumption that there is sufficient mixing of air
between the surface and free troposphere in the atmospheric column being measured.
Figure 3 is generated from a multi-year data set of AERONET retrievals from
four selected single mode dominated aerosol sites used in this dissertation. It illustrates
how dV/dlnR can be used as a general fingerprint of fine and coarse mode particle
dominance for any given aerosol region (Dubovik et al. 2002; Eck et al. 2005; Logan et
al. 2013a). NASA Goddard and Mexico City are located within large urban/industrial
centers and thus have large fine mode influences. Solar Village is located in the vicinity
of the Arabian Desert and thus has strong influences from coarse mode mineral dust.
Alta Floresta is located within the Amazonian region and is susceptible to strong
influences of fine mode biomass smoke particles. Bimodal distributions tend to suggest
more than one type of aerosol and the total volume of the coarse and fine modes will
indicate the size dominance in that region (Dubovik et al. 2002). However, this does not
give much information on aerosol composition since pollution and biomass particles can
yield similar size distributions.

11
Figure 3. Particle volume size distribution of two pollution regions (NASA Goddard and
Mexico City), a mineral dust region (Solar Village), and a biomass burning region (Alta
Floresta). Note the fine mode dominance at NASA Goddard, Mexico City, and Alta
Floresta while Solar Village is dominated by coarse mode particles.
Aerosol Optical Depth and Angström Exponent
Aerosol optical depth (AOD) is defined as the amount of vertically integrated
light extinction through a column of atmosphere and is also the sum of the scattering and
absorption optical depths (SAOD and AAOD, respectively) (Eck et al. 1999). It is used
as the primary parameter to quantify the magnitude of aerosol loading the atmosphere
(Holben et al. 1998; Eck et al. 1999; Li et al. 2007a, b). The Angström exponent (AE) is
a good indicator of particle size and is given by the following equation,
,
log
log
2
1
2
1
AOD
AOD
AE (1)

12
where the negative log-log-slope relationship between AOD and is synonymous with
the spectral dependence due to particle size (Eck et al. 1999; Schuster et al. 2006). The
wavelengths (1 and 2) used in this study are 440 nm and 870 nm, respectively. AE440-
870 can range from negative values to much greater than 1 (Eck et al. 1999; Higurashi and
Nakajima 2002; Gobbi et al. 2007). Though there are numerous studies that use an array
of AE440-870 values to partition aerosols according to size, this dissertation adopts AE440-
870 < 0.75 to denote coarse mode particles while AE440-870 > 0.75 denotes fine mode
particles (Reid et al. 1999; Eck et al. 2005; Gobbi et al. 2007; Logan et al. 2013a).
Absorption Aerosol Optical Depth and Absorption Angström Exponent
The absorption Angström exponent (AAE) parameter is calculated starting with
spectral absorption aerosol optical depth (AAOD), given by
,)1( AODAAOD o (2)
where o is the single scattering albedo and ranges between 440 and 870 nm. The
same equation for AE (Eq. 1 and same range) is used to calculate AAE
,
log
log
2
1
2
1
AAOD
AAOD
AAE (3)
where AAE is the negative log-log-slope relationship between AAOD and which can
be used to relate absorption spectral dependence to particle composition (Bergstrom et al.
2004; Bergstrom et al. 2007; Russell et al. 2010).
A range of AAE440-870 values has been previously determined which corresponds
to various aerosol types. For example, submicron BC particles typically have AAE440-870
close to unity (Bergstrom et al. 2007; Gyawali et al. 2009; Russell et al. 2010). Urban

13
pollution and biomass particles typically have AAE440-870 values that range from ~ 1 to 2
or greater depending on the relative amounts of BC, OC, and sulfate, while mineral dust
particles can be 1.5 or higher depending on chemical composition (e.g., iron oxide
content) (Schuster et al. 2005; Xin et al. 2007; Lack and Cappa 2010; Russell et al. 2010;
Giles et al. 2011). It should be noted that the overlap in AAE values can raise concerns
for regions dominated by a mixture of aerosol types.
Single Scattering Albedo and Co-albedo
The single scattering albedo (o) parameter is defined as the ratio of particle
scattering to particle extinction (e.g., SAOD/AOD). This parameter ranges between 0
(pure absorption) to 1 (pure scattering). In the atmosphere, o values are generally
observed to be between 0.7 and 0.99 with a strong dependence on the internal
composition of the aerosols. The o parameter is important in the aerosol community
since small changes in the magnitude of o can lead to large changes in radiative forcing
in the atmosphere. Aerosols have long been known to cause a cooling effect at the
surface, but some aerosol types (e.g., mineral dust and BC) can warm the layer in which
they reside in addition to causing a cooling effect at the surface. Many studies have
shown that a change in o from 0.95 to 0.9 can change the sign of atmospheric radiative
forcing from negative to positive (Takemura et al. 2002). Hence, it is very important to
investigate aerosol radiative properties especially during transport from their source to
sink regions.
The single scattering co-albedo (oabs) (ratio of AAOD to AOD or 1-o) explains
the loss of photons due to the absorption of particles. This parameter can be useful in
identifying particle composition, especially carbonaceous particles (Corrigan et al. 2006).

14
This dissertation will use oabs to focus on aerosol absorption rather than scattering in
order to (a) reduce ambiguities in aerosol composition and (b) reveal a correlation
between absorption and aerosol composition (e.g., Corrigan et al. 2006; Logan et al.
2013a).
Hybrid Single Particle Lagrangian Integrated Trajectory Model
The Hybrid Single Particle Lagrangian Integrated Trajectory Model (HYSPLIT)
computes the advection of a single pollutant particle by assuming a dispersion rate
(Draxler and Hess, 1997; Draxler and Hess 1998; Draxler 1999; Draxler and Rolph 2012;
Rolph 2012). Model inputs include: meteorological re-analysis data, trajectory mode
(forward or backward), location of particles (latitude/longitude), model time span, time of
model initiation (UTC time), and particle height (AGL in meters). Robock (1988), Qiu
and Sun (1994), Logan et al. (2013c), and Logan et al. (2014) pointed out that aerosol
particles can be transported at altitudes from just above the boundary layer (2 km) to the
upper troposphere (7 km). This dissertation will use backward trajectories that
temporally range from 84-240 hours to denote the probable source regions and transit
times of various aerosol plumes. For example, Asian and African dust and pollution
events can take up to 240 hours (10 days) to reach North America while smoke aerosols
from biomass burning events can take 24-84 hours (1-3 days) or longer to disperse. The
trajectory accuracy has been shown to be highly dependent on meteorological conditions
and are therefore validated using satellite imagery (e.g., MODIS and CALIPSO) to
ensure the spatial and temporal location of aerosol events during transport.
Instrumentation
Aerosol Robotic Network
15
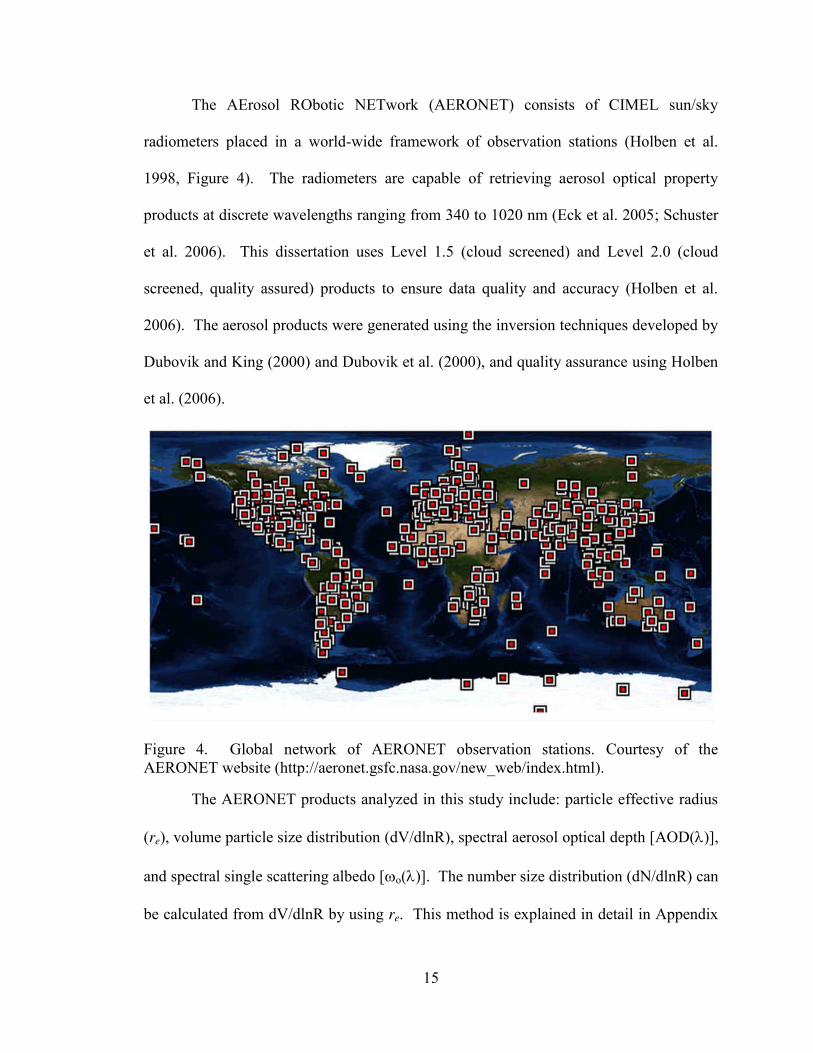
The AErosol RObotic NETwork (AERONET) consists of CIMEL sun/sky
radiometers placed in a world-wide framework of observation stations (Holben et al.
1998, Figure 4). The radiometers are capable of retrieving aerosol optical property
products at discrete wavelengths ranging from 340 to 1020 nm (Eck et al. 2005; Schuster
et al. 2006). This dissertation uses Level 1.5 (cloud screened) and Level 2.0 (cloud
screened, quality assured) products to ensure data quality and accuracy (Holben et al.
2006). The aerosol products were generated using the inversion techniques developed by
Dubovik and King (2000) and Dubovik et al. (2000), and quality assurance using Holben
et al. (2006).
Figure 4. Global network of AERONET observation stations. Courtesy of the
AERONET website (http://aeronet.gsfc.nasa.gov/new_web/index.html).
The AERONET products analyzed in this study include: particle effective radius
(re), volume particle size distribution (dV/dlnR), spectral aerosol optical depth [AOD()],
and spectral single scattering albedo [o()]. The number size distribution (dN/dlnR) can
be calculated from dV/dlnR by using re. This method is explained in detail in Appendix

16
A. Note that similar wavelength ranges between 440 and 1020 nm are used for the
AERONET aerosol retrievals.
The uncertainties of AOD and o are approximately ±0.01 and ±0.03,
respectively, for AOD440 larger than 0.4 (Holben et al. 1998; Eck et al. 1999; Dubovik et
al. 2002). Filtering the retrievals based on these criteria will certainly lead to data loss.
This dissertation chooses AERONET sites with at least five years of high quality, Level
2.0 data that are near or downwind of strong aerosol source regions. For example, clean
regions will typically have few strong aerosol events such that approximately 20% of the
retrievals can be used (see Table 4). In contrast, regions that are dominated by pollution
and biomass burning will typically have AOD values greater than 0.4 throughout the year
and thus there are more retrievals. Over marine regions, aerosol events are denoted by
AOD values greater than twice the overall mean AOD to ensure the aerosol event was
caused by long range transport rather than a local event. Level 1.5 data can also be used
though the criteria involves restricting retrievals to periods when the solar zenith angle
(SZA) greater than 50o in addition to the AOD criteria. Again this will certainly lead to
issues of data loss. Though filtering by AOD will likely upwardly bias results, the
conclusions of this dissertation are not greatly affected by using these criteria.
Aircraft Instruments
The NASA DC-8 aircraft platform measured aerosol properties remotely and in-
situ during ten flights (Figure 5) with a total of 85 hours over the central Pacific Ocean
between Hawaii and Alaska during the 2006 INTEX-B field campaign (Logan et al.
2010). The instruments onboard the DC-8 aircraft used in this study included the

17
Differential Absorption Lidar (DIAL), nephelometer, and particle soot absorption
photometer (PSAP).
Figure 5. NASA DC-8 flight tracks during the 2006 INTEX-B field campaign from the
Logan et al. (2010) study.
Differential absorption LIDAR. The differential absorption LIDAR (DIAL)
platform, developed by the NASA Langley Research Center, remotely retrieved column
integrated aerosol backscattering in both visible (λ=588 nm) and near infrared (λ=1064
nm) wavelengths (Browell et al. 1998). The vertical resolution of the DIAL
measurement system was 30 m, a horizontal resolution of 2.3 km and a 10 s temporal
resolution along the DC-8 flight track. The equation to calculate the aerosol scattering
ratio, )(zR at a given wavelength () is given by
,)(
)()()(
2
21
z
zzzR
(4)
18
where β1(z) and β2(z) are the backscattering coefficients by aerosols and air molecules at
altitude z, respectively. Typical scattering ratios Rλ(z) are close to 1 for regions free of
aerosol, and greater than 1 for the dust plumes. Note that larger sized cloud particles
usually have a high scattering ratio (~ 50) at both wavelengths because the backscattering
coefficient is proportional to sixth power of particle size (~ r6/λ4
).
Nephelometer. Aerosol integrated light scattering coefficients (sp) at three
wavelengths in the visible spectrum (450, 550, and 700 nm) were measured in situ by the
TSI Model 3563 nephelometer onboard the DC-8 aircraft. For fine mode aerosols, sp
decreases with wavelength from 450 to 700 nm (sp450 > sp700), but for coarse mode
aerosols the aerosol scattering coefficients are nearly independent of wavelength.
Therefore, for fine mode aerosols, the slope of this relationship can be approximated by
the nephelometer derived Angström exponent (AEneph). The equation for calculating
AEneph is given by
AEneph = ─ [log(sp1/sp2) / log(1/2)], (5)
where sp is used as a proxy for in situ AOD at two given wavelengths 1 and 2. AOD
is proportional to the aerosol scattering ratio β, therefore, the ratio of sp and sp is
proportional to the ratio of β and β. The same criteria for AE (derived in the previous
section) will be used for AEneph.
Correction factors designed by Anderson and Ogren (1998) were applied to the
nephelometer data prior to use in this study. First, the measurements were corrected by
calibrating the instrument with gas particles since they undergo Rayleigh scattering and
do not show the near-forward-scattering biases as do particles close to or greater than 1
m (Anderson and Ogren 1998). Second, the nephelometer measurements were
19
corrected to 0º - 180º from its original detection angles of 7º - 170º. The temporal
resolution of sampling is 1 minute but the data are averaged at one hour intervals in order
to limit instrument noise (Jefferson 2011).
Particle soot absorption photometer. The Radiance Research (Model PSAP)
particle soot absorption photometer (PSAP) is a filter-based instrument that can measure
the in situ aerosol absorption coefficient (ap) at 1 minute intervals in real time (Bond et
al. 1999; Anderson et al. 1999; Bond et al. 2005; Virkkula et al. 2005; Virkkula 2010).
The PSAP utilizes slightly different wavelengths (470, 528, and 660 nm) than the
nephelometer. The ap retrievals are calibrated and quality assured as reported in the
Bond et al. (1999), Anderson et al. (1999), and Virkkula et al. (2010) studies. The hourly
averaged nephelometer and PSAP measurements of sp and ap at 450 nm and 470 nm,
respectively (e.g., Corrigan et al. 2006) are used to calculate the single scattering co-
albedo parameter, oabs, by the following equation
oabs=ap/(sp+ap). (6)
Atmospheric Radiation Measurement Mobile Facility
The Atmospheric Radiation Measurement (ARM) mobile facility in the Azores
(AMF-Azores) was operational for a 19-month period during the Clouds, Aerosol, and
Precipitation in the Marine Boundary Layer (CAP-MBL) campaign (Rémillard et al.
2012; Dong et al. 2014; Wood et al. 2014). The Azores is a collection of islands located
in the eastern remote Atlantic Ocean where marine boundary layer (MBL) clouds (e.g.,
shallow cumulus, stratocumulus, and stratus) are present throughout the year due to semi-
permanent weather patterns (Rémillard et al. 2012; Dong et al. 2014; Wood et al. 2014).
This region is also influenced by mid-latitude, tropical, and extratropical cyclones. As a

20
result, aerosols from North and Central America, Africa, and the surrounding ocean
observed passing over this area can provide a great opportunity to investigate the AIE on
MBL clouds (Figure 6) (Osborne and Haywood 2005; Fiahlo et al. 2005; Owen et al.
2006; Val Martin et al. 2006; Rémillard et al. 2012; Wood et al. 2014).
Figure 6. The AMF-Azores and Graciosa AERONET sites used during the Clouds,
Aerosol, and Precipitation in the Marine Boundary Layer (CAP-MBL) campaign are
located on Graciosa Island. The Azores is typically dominated by clean air masses but
with periodic episodes of polluted air masses from North America, Europe, and the
Saharan desert. Large image is provided by NASA World Wind software
(http://worldwind.arc.nasa.gov/index.html) and the smaller inset image is provided by
NASA Worldview EOSDIS (https://earthdata.nasa.gov/labs/worldview/).
The AMF-Azores site continuously sampled cloud, precipitation, and aerosol properties
during this period. This site has an AERONET facility (Graciosa site: 39.1oN, 28.03
oW)
in addition to a TSI-3563 nephelometer, Radiance Model PSAP, and an optical particle
counter that measures cloud condensation nuclei.
Aerosols that are advected over the Azores have varying abilities to activate as
CCN. This study uses in situ measurements from a single-column Data Management

21
Team (DMT) Model 1 counter at seven supersaturations (Jefferson 2011). The NCCN for
this study was calculated using hourly-averaged measurements from an optical particle
counter at 0.2% supersaturation (Jefferson 2010; Wood et al. 2014). Note that since NCCN
increases with increasing supersaturation (e.g., Hudson and Noble 2013; Wood et al.
2014), NCCN at 0.2% supersaturation is used in this dissertation in a similar manner to the
Dong et al. (2014) and Logan et al. (2014) studies.
CALIPSO Satellite Observations
The Cloud-Aerosol Lidar and Infrared Pathfinder Satellite Observations
(CALIPSO) platform became operational in June 2006 as part of the NASA A-Train
constellation of satellites (Winker et al. 2007). This satellite, which orbits at an altitude
of 705 km in a polar orbit, carries several sensors designed to retrieve cloud and aerosol
properties. One of the sensors, the Cloud-Aerosol Lidar with Orthogonal Polarization
(CALIOP), is a nadir-pointing dual-wavelength polarization-sensitive lidar that operates
at 532 and 1064 nm to provide vertical profiles of aerosols and clouds (Winker et al.
2007).
CALIPSO is used in a similar manner as the DIAL in identifying the altitudes of
various aerosol layers. In addition, products from the CALIPSO Vertical Feature Mask
(VFM; Version 3) are used to provide vertical profiles of 532 nm total attenuated
backscatter, 1064 nm attenuated backscatter, and depolarization ratio. The cloud and
aerosol mask provided by the VFM, which identifies clear air, cloud type, and aerosol
type (Liu 2005), offers a horizontal resolution of 333 m, with a vertical resolution of 30
m below 8.2 km and 60 m above (Winker et al. 2007). Fine grid spacing and high
sensitivity allow CALIOP to detect aerosol layers and optically thin clouds. However,

22
the lidar signals are attenuated by optically thick clouds (Kato et al. 2010), which affects
retrievals of cloud and aerosol layers beneath the level of attenuation (Figure 7).
Figure 7. Example of a biomass burning smoke plume captured over the Atmospheric
Radiation Measurement-Southern Great Plains (ARM-SGP) facility as observed by
CALIPSO. Curtain plots of (a) 532 nm backscatter, (b) depolarization ratio, and (c)
vertical feature mask (VFM) of a biomass burning smoke plume (black pixels) spanning
the Gulf of Mexico to the ARM-SGP facility. Signal attenuation can be seen in the cloud
layers (red or grey) around 10 km while aerosol layers (yellow) do not attenuate. Smoke
is often misidentified as polluted dust in the VFM due to similarities in absorptive
properties between the aerosol types (Kim et al. 2013).
MODIS Satellite Observations

23
The Moderate Resolution Imaging Spectrometer (MODIS) platform is onboard
the Terra and Aqua satellites and their products are used in this dissertation to investigate
the spatial and temporal coverage of aerosol events. For example, Figure 8 shows a
MODIS-Terra image of the biomass smoke plume observed by CALIPSO in Figure 7.
MODIS-Terra crosses the Equator from north to south in the morning (1030 UTC) while
MODIS-Aqua crosses the Equator from south to north in the afternoon (1330 UTC) and
is part of the A-Train constellation of satellites which includes CALIPSO. Both satellite
platforms can yield full global coverage within two days. The satellite datasets used in
this study are the Terra Edition2B and Aqua Edition1B Clouds and the Earth’s Radiant
Energy System (CERES) Single Scanner Footprint (SSF) products and include the
“Rev1” calibration adjustment to the CERES shortwave (SW) record to account for
optics contamination during the first few years on orbit (Matthews et al. 2005). The
CERES instruments on the Terra and Aqua satellites measure radiances that are
converted to broadband fluxes using Angular Distribution Models (ADMs) sampled and
optimized for each satellite orbit. Estimated uncertainties in the solar-reflected (SWtoa↑)
single field-of-view instantaneous radiative fluxes at TOA are 13 W m-2
(Chambers et al.
2002; Loeb et al. 2003). The SSF combines the CERES broadband flux measurements at
a 20 km resolution with coincident, sub-sampled 1 km MODIS cloud and aerosol
retrievals (Wielicki et al. 1996; Ignatov et al. 2005). These datasets include the MODIS-
retrieved visible (550 nm) AOD (MOD04 on Terra; MYD04 on Aqua) and CERES-
derived TOA albedo. The MOD04 product uses sophisticated cloud screening and aerosol
retrieval algorithms developed by the MODIS cloud and aerosol groups with

24
uncertainties of 0.03 ± 0.05 AOD over ocean and 0.05 ± 0.15 AOD over land (Tanré et
al. 1997; Ackerman et al. 1998; Martins et al. 2002; Remer et al. 2005).
Figure 8. Moderate Resolution Imaging Spectroradiometer (MODIS) Terra image of the
biomass smoke plume from Fig. 7 that spanned the Gulf of Mexico and was observed by
the ARM-SGP facility (red star).
Dissertation Study Regions
The locations of the selected AERONET sites used in this dissertation are shown
in Figure 9. Four sites (red rectangles) representing single aerosol mode regions include:
NASA Goddard (38.99ºN, 76.84ºW), Mexico City (19.34ºN, 99.18ºW), Alta Floresta
(9.87ºS, 56.10ºW), and Solar Village (24.91ºN, 46.40ºE). The sites representing complex
aerosol source regions in Asia include: Xianghe (39.75ºN, 116.96ºE), Taihu (31.4ºN,
120.21ºE), and SACOL (35.95ºN, 104.14ºE) in China, and Mukdahan, Thailand
(16.61ºN, 104.68ºE). Xianghe is located in a mixture region that is influenced by

25
pollution, biomass burning and mineral dust particles (Eck et al. 2005; Eck et al. 2010;
Logan et al. 2010).
Figure 9. Combination of AERONET sites (stars) and study regions (boxes) for Asian
aerosol properties and transport (white and red), North American aerosol properties and
transport (blue), and aerosol impacts on marine CCN.
Taihu is located in a region heavily influenced by airflow from large urban
centers (e.g., Shanghai and Hangzhou) and industry in each cardinal direction and to a
lesser extent, the influences of the Gobi and Taklamakan Deserts (Xin et al. 2007).
SACOL, the Semi-Arid Climate and Environment Observatory of Lanzhou University, is
situated in central China (Gansu province) within the reaches of the Loess Plateau
(downwind of Gobi and Taklamakan Deserts) (Xin et al. 2007; Huang et al. 2008b). The
site is just southeast of Lanzhou City, a large metropolitan and industrial center (~3.5
million inhabitants). Mukdahan is located in extreme eastern Thailand near the Laotian
border where wildfires as well as fires from crop and vegetation burning are prominent
during the dry season (September-May) (Gautam et al. 2012).

26
CHAPTER III
THEORETICAL DATABASE COMPARISON STUDY
Asian dust events typically occur during the spring season but have been known
to occur at any time of the year (Tsunematsu et al. 2005; Li et al. 2007a,b; Logan et al.
2010). Strong low pressure systems that create dry convection facilitate favorable
conditions for surface winds to loft loose desert sand and soil into the mid-troposphere (~
5 km or 500 hPa level) where it can be transported for thousands of kilometers (Uematsu
et al. 1983; Jordan et al. 2003; Li et al. 2007b; Logan et al. 2010; Ling et al. 2011).
Continuing urbanization and industrialization in Asia causes concern since anthropogenic
carbonaceous particles such as black carbon (BC), organic carbon (OC), and biomass
burning aerosols along with sulfates and nitrates have been known to mix and condense
onto mineral dust, thus altering the optical properties of the particles (Yao et al. 2002;
Jordan et al. 2003; Sun et al. 2005; Logan et al. 2013a). Due to the variety of scattering
and absorbing aerosols generated as a result of these secondary reactions, the radiative
balance of the atmosphere is altered by the aforementioned first aerosol effect while the
second aerosol effect deals with influences on cloud physical properties (e.g. lifetime,
brightness, droplet size distribution, and precipitation) (Li et al. 2007a; Rosenfeld et al.
2008; Li et al. 2011). Aerosol effects can also be locally detrimental as they create
increased health risks especially for susceptible populations (Pope 2004).
Two Asian dust events during the winter (24-31 December 2007) and spring (15-
21 March 2010) seasons provide a unique opportunity to compare the seasonal and

27
regional dependences of mineral dust absorptive properties. Both dust events passed over
the same regions in northern, west-central, and eastern China before they exited the
mainland, subsequently affecting the remote Pacific Ocean before dissipating (MODIS
visible images not shown). However, the aerosol types in these regions have shown a
diverse seasonal dependence (Sun et al. 2005; Wang et al. 2010; Logan et al. 2013a). For
example, northern China usually has strongly absorbing aerosols in the winter due to BC
and OC particle emissions from industrial and urban emissions (e.g. residential heating)
while the spring season is dominated by emissions from the Gobi desert upwind of the
area (Eck et al. 2005; Xin et al. 2007).
This study uses the parameters of volume size distribution (dV/dlnR), aerosol
optical depth (AOD), absorption aerosol optical depth (AAOD), their respective spectral
dependences: Angström exponent (AEAOD) and absorption Angström exponent
(AAEAOD), and the spectral single scattering albedo, [o()]. The dV/dlnR parameter
illustrates the relative contributions of fine and coarse mode aerosols. The AOD, AAOD,
AEAOD, and AAEAOD parameters will illustrate the seasonal differences of the absorptive
properties of the mineral dust that may be mixed with anthropogenic carbonaceous
particles. Lastly, the single scattering properties from three selected ground-based Asian
AERONET sites (SACOL, Xianghe, and Taihu) are compared to theoretically calculated
ones from a mineral dust model.
Theoretical Mineral Dust Model
Mineral dust particles are typically non-spherical in nature. In fact, their optical
properties require special consideration since AERONET retrievals are primarily based
on assumptions that atmospheric aerosols are homogeneous spherical particles

28
(Ackerman and Toon 1981; Dubovik et al. 2000; Meng et al. 2010). As pointed out by
Dubovik et al. (2000), though there are shortcomings to using these assumptions in
AERONET retrievals, it is still possible to gain useful information from the almucantar
readings (Dubovik et al. 2000; Dubovik et al. 2006). This study employs the use of a
mineral dust model that is comprised of a spectral database calculated from mathematical
and geometric theory (Meng et al. 2010; Yi et al. 2011). The model contains theoretical
calculations of the single scattering parameters of mineral dust aerosols by assuming a
tri-axial ellipsoidal geometric shape which offers many advantages over calculations
based on a combination of spherical (Mie Theory) and spheroidal particle shape
assumptions (Meng et al. 2010; Yi et al. 2011).
The Meng et al. (2010) model uses a combination of Lorenz-Mie theory, the T-
matrix method, discrete dipole approximation (DDA), and an improved geometric optics
method (IGOM) to illustrate the optical properties of mineral dust-like aerosols. The
results are compiled into a database that requires the knowledge of the particle aspect
ratio (ratio of the semi-major to semi-minor axis assuming ellipsoidal geometry), size
parameter (based on retrieved effective radius), and complex index of refraction. A more
detailed discussion of the database as well as the methodology can be found in (Meng et
al. (2010). The database contains information about aerosol extinction efficiency (Qext),
extinction (ext), scattering (sp) and absorption (ap) coefficients, and spectral single
scattering albedo [o()].
We will consider the AERONET retrievals as truth and compare these retrievals
with the theoretical calculations from the mineral dust model because the model will have
inherent shortcomings when dealing with aerosol mixtures (e.g., external/internal
29
mixtures and pollution coating). Since AERONET retrievals are based on spheroidal
assumptions (rather than ellipsoidal) it would be informative to investigate the agreement
between the two retrieval mechanisms for validation purposes. This will be done by
performing a comparison study using the AERONET retrieved effective radius and
complex index of refraction (mr + mi) as inputs of the mineral dust model.
Methodology
The theoretical database is arranged in the following manner: two aspect ratios,
one size parameter, and the complex index of refraction (real and imaginary parts) (Meng
et al. 2010). The complex index of refraction is obtained directly from the AERONET
retrievals with an uncertainty of up to 30% when AOD440 > 0.5 (Dubovik et al. 2000).
The size parameter (x) at each wavelength () is calculated from the AERONET
retrieved effective radius (re) and is given by,
,2
er
x (7)
where is in discreet wavelengths of 440, 675, 870, and 1020 nm. In this way, a single
value of o at each wavelength is obtained from the database to yield a theoretical
spectral dependence to go along with the AERONET retrieved spectral dependence. The
aspect ratios are assumed based on the best fit between the theoretical and observational
o spectral dependence curve to within one standard deviation. We vary the effective
radius and complex index of refraction while keeping one of these parameters constant in
order to perform the comparison study.
Meteorological Conditions
Figures 10a and 10b show the 850 hPa geopotential heights for the 24-31
December 2007 (winter case) and 15-21 March 2010 (spring case) time spans. The mean

30
synoptic patterns of both cases have similar trough (darker purple) locations over
Northeastern China. However, the ridge (red and orange) locations differ by ten degrees
of latitude with the winter case ridge position (43ºN) being at a higher latitude than the
spring case (33ºN). The position of the ridge in relation to the trough is also different
between the two cases suggesting different wind flow patterns (Sun et al. 2001; Sun et al.
2005). For example, there is more of a northwesterly flow over Xianghe than at Taihu
and SACOL in the winter case but a west-northwesterly flow pattern is evident in the
spring case at all three sites. From backward trajectory analysis (not shown) both storms
had origins in the Loess Plateau (Western Gobi Desert) region but the wind patterns
suggest that the dust from the eastern Gobi Desert may have impacted Xianghe more than
SACOL and Taihu for the winter case. In contrast, the spring case wind pattern and
subsequent track of the low pressure system advected dust from the Loess Plateau to all
sites. The synoptic patterns for both cases illustrate how the absorptive properties of the
mineral dust aerosols can change depending on the season which is discussed in the
following section.
31
Figure 10. (a) 850 hPa geopotential heights showing the low pressure (purple) and high
pressure systems (orange) and the inferred wind patterns as a result of their positions for

32
the winter and (b) spring cases. Image provided by the NOAA/ESRL Physical Sciences
Division, Boulder Colorado from their Web site at http://www.esrl.noaa.gov/psd/.
Mineral Dust Properties Inferred From the Particle Volume Size Distribution,
AOD, AAOD, AEAOD, and AAEAOD Parameters
Figures 11a and 11b show the volume size distributions of the winter and spring
cases, respectively. Since the amount of aerosol loading (AOD) exceeds 0.4 in all
instances, the errors in dV/dlnR retrievals are small (< 10%) (Dubovik et al. 2000;
Dubovik et al. 2002). For the winter case, SACOL and Xianghe have similar bimodal
distributions dominated by the coarse mode with weak fine mode contributions. There is
a small fine mode contribution (re-fine ~ 0.085 m) at SACOL indicating pollution from
the nearby city of Lanzhou (Xin et al. 2007). There is a smaller, yet discernible fine
mode contribution at Xianghe (re-fine ~ 0.15) which indicates anthropogenic influences
from Beijing and surrounding areas (Eck et al. 2005). The coarse mode magnitude at
Taihu is nearly half compared to the other sites but the fine mode contribution (re-fine ~
0.45) is likely due to industrial influences in the vicinity as well as urban influences from
Shanghai (Yao et al. 2002). The spring case exhibits a strong mineral dust signature at all
three sites as there is a more pronounced unimodal coarse mode contribution. The lack of
a discernible fine mode peak suggests that mineral dust dominates the size distribution in
this case though pollution particles may still be present in the atmosphere.

33
Figure 11. Particle volume size distributions of the (a) winter and (b) spring cases.
The spectral dependences of AOD for the winter and spring cases are shown in
Figure 12. SACOL has the spectral dependence of all three sites for both the winter and
spring cases indicating coarse mode particles (AEAOD of 0.29 and 0.11, respectively).
This is due to a close proximity to various mineral dust source regions (Taklamakan and
Gobi Desert and the Loess Plateau) (Ling et al. 2011; Wang et al. 2010). However, the
spectral dependence for the winter case is stronger suggesting a noticeable more of a fine

34
mode influence than in the spring case. At Xianghe, the stronger spectral dependence
and higher AEAOD values (0.42-0.48) suggest more of a fine mode influence for both
cases than at SACOL. Taihu has the strongest spectral dependence in the winter case with
AEAOD of 0.62 indicating a mixture of coarse and fine modes due to an abundance of
pollution particles resulting from stagnant winter season air patterns that allow for
increased aerosol loading (AOD440 ~ 1.3) (Yang et al. 2009). In the spring, there is much
less spectral dependence at Taihu suggesting coarse mode particles dominate the aerosol
extinctive properties similar to the SACOL case. It is interesting to note that the AEAOD
value of 0.15 at Taihu illustrates the overwhelmingly large magnitude of dust particles in
the spring as compared with the winter case. Since all sites have AEAOD values less than
0.62, it can be concluded that coarse mode particles dominated the aerosol size properties
along with some influences from the fine mode (e.g., pollution).
Figure 12. Spectral dependence of AOD for the (a) winter and (b) spring cases. The
normalized AOD values at each wavelength are ratios to the AOD440 value in order to
compare the spectral dependences across the three sites.
Figure 13 shows the spectral dependence of AAOD. The spectral dependence is
slightly stronger for the winter case than for the spring case. The winter AAEAOD value of
1.8 represents a typical value for dust due to the strong absorption in the visible and weak

35
absorption in the near IR wavelength (Yang et al. 2009), while the spring AAEAOD value
of 1.6 indicates a mineral dust influence with possible carbonaceous influences (Xin et al.
2007; Yang et al. 2009). For the winter cases, Taihu has a weaker spectral dependence
than Xianghe and nearly identical to SACOL. The lower AAEAOD of 1.3 indicates a
strong BC influence given by a weaker spectral dependence across the visible and near
IR. It should be noted that OC tends to strengthen the absorption in the visible leading to
an even higher AAEAOD value. For the spring case, Taihu has the strongest spectral
dependence in both the visible and near IR indicating a robust mineral dust influence
(AAEAOD ~ 2.5) (Bergstrom et al. 2007). The spring case at SACOL is more indicative
of mineral dust influences with AAEAOD of 1.7. Table 1 summarizes the AERONET
retrieved parameters used in this study. The following section will discuss how well the
theoretically calculated o(λ) at different wavelengths agree with AERONET retrievals at
the three sites for the selected two cases.
Figure 13. Same as Fig. 12 but for AAOD.

36
Table 1. Summary of the AERONET retrieved aerosol optical properties for the winter
and spring cases.
AERONET Site AOD440 AEAOD AAEAOD mr mi reff
SACOL (winter) 0.6 0.29 1.3 1.46 0.003 0.77
SACOL (spring) 0.8 0.11 1.7 1.57 0.004 0.97
Xianghe (winter) 0.6 0.48 1.8 1.60 0.005 1.07
Xianghe (spring) 0.5 0.42 1.6 1.60 0.004 1.25
Taihu (winter) 1.3 0.62 1.3 1.53 0.022 0.59
Taihu (spring) 1.4 0.15 2.5 1.53 0.004 0.80

37
Table 2. Summary of the theoretical model parameters used in this study.
Aspect
Ratio mr mi
reff
(m)
SACOL (Winter Case) 1.5:1.8
1.50 0.005 0.7
1.50 0.005 0.8
1.50 0.005 0.9
1.50 0.005 1.0
SACOL (Spring Case) 1.5:1.8
1.60 0.005 0.7
1.60 0.005 0.8
1.60 0.005 0.9
1.60 0.005 1.0
SACOL (Winter Case) 1.5:1.8
1.40 0.001 0.8
1.40 0.005 0.8
1.40 0.010 0.8
1.50 0.001 0.8
1.50 0.005 0.8
1.50 0.010 0.8
1.60 0.001 0.8
1.60 0.005 0.8
1.60 0.010 0.8
SACOL (Spring Case) 1.5:1.8
1.40 0.001 1.0
1.40 0.005 1.0
1.40 0.010 1.0
1.50 0.001 1.0
1.50 0.005 1.0
1.50 0.010 1.0
1.60 0.001 1.0
1.60 0.005 1.0
1.60 0.010 1.0

38
Table 2. cont.
Xianghe (Both Cases) 1.8:2.1
1.60
1.60
1.60
1.60
0.005
0.005
0.005
0.005
1.0
1.1
1.2
1.3
Xianghe (Both Cases) 1.8:2.1
1.60 0.001 1.0
1.60 0.005 1.0
1.60 0.010 1.0
Taihu (Winter Case) 1.5:1.8
1.50 0.020 0.5
1.50 0.020 0.6
1.50 0.020 0.7
1.50 0.020 0.8
1.50 0.020 0.9
Taihu (Spring Case) 1.2:1.5
1.50 0.005 0.5
1.50 0.005 0.6
1.50 0.005 0.7
1.50 0.005 0.8
1.50 0.005 0.9
Taihu (Winter Case) 1.5:1.8
1.50 0.010 0.6
1.50 0.020 0.6
1.50 0.050 0.6
Taihu (Spring Case) 1.2:1.5
1.50 0.001 0.8
1.50 0.005 0.8
1.50 0.010 0.8
Comparisons of o(λ) Between Theoretical Calculations and AERONET Retrievals
Figures 14 and 15 present the comparisons of o(λ) values at wavelengths of 440-
1020 nm retrieved from three AERONET sites to those calculated by the mineral dust
model for the winter and spring cases. The size parameter in Eq. (7) is calculated from
the AERONET retrieved effective radius for each wavelength. Each size parameter
corresponds to a set of o() values that are input into a matrix contained in the
theoretical database. It should be noted that the database itself contains nearly 3200 files
that are categorized by aspect ratio (1:1-3:3) and complex index of refraction (1.1-2.1 +

39
0.005-0.5). In order to demonstrate the spectral dependences of o to the index of
refraction and aerosol particle size, the index of refraction is held constant while the
effective radius varies in Figure 14 and vice versa in Figure 15. Although the model
results are summarized in Table 2, we focus on the following key discussion points at the
SACOL, Xianghe and Taihu sites.
At the SACOL site, the model calculated o(λ) agrees well with AERONET
retrievals in the visible but overestimates in the longer wavelengths for the winter case
(red) (Figure 14a). The spring case has slightly better agreement in the longer
wavelengths (675 and 870 nm) but poor agreement otherwise. A possible explanation is
due to the fact that two different real indices of refraction (mr of 1.46 and 1.57 for winter
and spring, respectively) are used which decreases the sensitivity of the modeled results
because the optical properties of aerosol mixtures are poorly taken into account using
these criteria. The Xianghe site has nearly the same indices of refraction for both the
winter and spring cases with only one theoretical calculation (Figure 14b) where the
model calculation and observation agree to within one standard deviation suggesting
more sensitivity of a variable effective radius. This is likely due the aerosols having
similar optical properties during both dust events (i.e., similar source regions and
carbonaceous influences).
At Taihu, there is seldom any agreement between theory and observation for the
winter case suggesting that using a fixed mi cannot account for the enhanced absorption
from the large amount of carbonaceous aerosols present in this region (Figure 14c). In
contrast, the spring case shows good agreement especially in the near IR due to the strong
mineral dust influence that dominates the aerosol absorptive properties during this
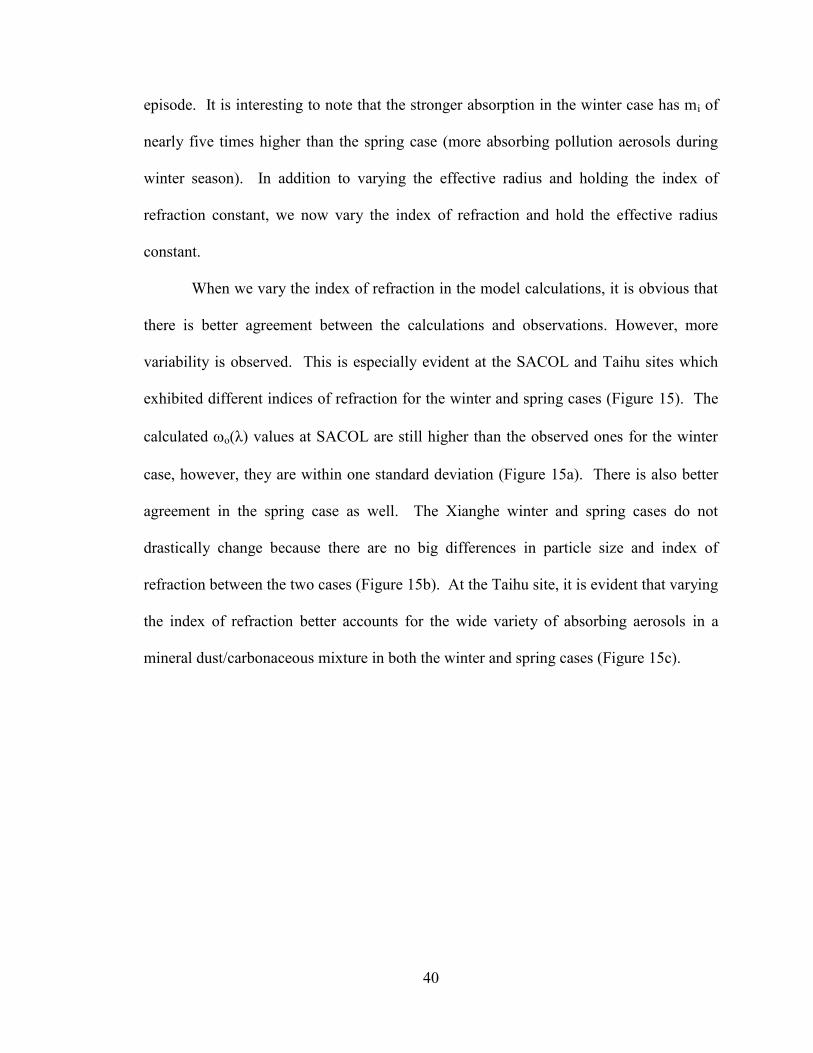
40
episode. It is interesting to note that the stronger absorption in the winter case has mi of
nearly five times higher than the spring case (more absorbing pollution aerosols during
winter season). In addition to varying the effective radius and holding the index of
refraction constant, we now vary the index of refraction and hold the effective radius
constant.
When we vary the index of refraction in the model calculations, it is obvious that
there is better agreement between the calculations and observations. However, more
variability is observed. This is especially evident at the SACOL and Taihu sites which
exhibited different indices of refraction for the winter and spring cases (Figure 15). The
calculated o(λ) values at SACOL are still higher than the observed ones for the winter
case, however, they are within one standard deviation (Figure 15a). There is also better
agreement in the spring case as well. The Xianghe winter and spring cases do not
drastically change because there are no big differences in particle size and index of
refraction between the two cases (Figure 15b). At the Taihu site, it is evident that varying
the index of refraction better accounts for the wide variety of absorbing aerosols in a
mineral dust/carbonaceous mixture in both the winter and spring cases (Figure 15c).

41
Figure 14. Comparison between the observed (solid) and theoretically calculated (dashed)
o for the winter (red circle) and spring (blue box) cases at (a) SACOL, (b) Xianghe, and
(c) Taihu. The measured complex index of refraction and the effective radii were used as
inputs of the model calculation where the complex index of refraction is held constant
while the effective radius varies. The vertical lines represent error bars of ±1.

42
Figure 15. Same as Fig. 14 but in this case the effective radius is held constant while the
index of refraction varies.

43
Aerosol Radiative Effect
To quantitatively estimate the impact of the dust events on the surface and Top-
Of-Atmosphere (TOA) radiation budgets, we use the method developed by Dubovik et al.
(2006) to calculate shortwave (SW) aerosol radiative effects (ARE). It is defined as the
difference between the net bottom and top of the atmosphere (BOA and TOA) fluxes
when dust aerosols are present, (FBOA and F
TOA), and the nearby clean-sky daily SW
fluxes (F0BOA and F0
TOA), and is given by
AREBOA = FBOA – F0
BOA (8a)
and
ARETOA = FTOA – F0
TOA, (8b)
respectively. This is a simulated product that uses a combination of sky radiance
measurements and radiative transfer theory (Dubovik et al. 2000; Holben et al. 2006).
The criteria for selecting the clean days are: (a) AOD440 ≤ 0.3 and (b) clean sky
occurrence before and after the dust events. It should be noted here that clean sky
conditions will typically have AOD440 values less than 0.05. However, there were no
values that were less than 0.2 during the study period.
We note that there is a sharp increase in ARE during the dust events with
AREBOA > ARETOA, which suggests a stronger aerosol cooling effect at the surface
than at the TOA. The strongest ARE is observed at the Taihu site where the ARE
values exceed -155 ± 52 W m-2
for the BOA and -60 ± 15 W m-2
for the TOA spring
case. This is due to dust mixing with carbonaceous aerosols (local pollution) leading to
an overall enhanced absorption (Ge et al. 2010). This is consistent with the Qiu et al.

44
(2013), Ge et al. (2010), and García et al. (2012) studies that used Shouxian ARM Mobile
Facility (AMF), Zhangye AMF, and AERONET data, respectively.
Table 3. Summary of the AERONET calculated BOA and TOA aerosol radiative effect
(ARE) values.
AERONET Site
BOA ARE Values (W m-2
)
aClear Sky (before) Dust Event Clear Sky (after)
SACOL (winter) -52.9 -101.1 -60.6
SACOL (spring) -48.5 -136.7 -52.5
Xianghe (winter) -64.2 -106.4 -39.8
Xianghe (spring) -40.7 -83.0 -42.1
Taihu (winter) -45.5 -177.3 -60.0
Taihu (spring) -66.9 -155.3 -40.8
AERONET Site
TOA ARE Values (W m-2
)
Clear Sky (before) Dust Event Clear Sky (after)
SACOL (winter) -17.0 -40.9 -13.1
SACOL (spring) -4.5 -40.9 -8.5
Xianghe (winter) -15.3 -46.0 -8.6
Xianghe (spring) -17.1 -29.7 -9.1
Taihu (winter) -19.0 -21.0 -17.2
Taihu (spring) -27.3 -60.4 -26.5
a The clear-sky values were taken just before and after the dust event where AOD440 < 0.3
and the ARE values for both clear-sky and dust events are calculated against the modeled
fluxes without aerosol using Eq. 8. Note that the Taihu site has the highest mean clear-
sky ARE due to persistent haze from numerous nearby urban and industrial influences
(i.e. very few “clear day” instances).

45
The optical properties of mineral dust from two dust events are analyzed and
compared to theoretical calculations in this section. For the winter case, the aerosol
properties at SACOL, Xianghe, and Taihu are shown to be a mixture of carbonaceous
particles (from local sources) and mineral dust as demonstrated by their AEAOD values of
0.29, 0.48, and 0.62, respectively. In contrast, for the spring case their aerosol properties
are primarily mineral dust dominant with AEAOD of 0.11, 0.42, and 0.15, respectively.
Carbonaceous particles are shown to influence the absorptive properties of the mineral
dust in the winter case especially at SACOL and Taihu but less at Xianghe where the
AAEAOD values are 1.3, 1.3, and 1.8, respectively. During the spring, higher AAEAOD
values of 1.7 (SACOL) and 2.5 (Taihu) suggest that mineral dust dominates the
absorptive properties of the aerosols. The lower AAEAOD value of 1.6 at Xianghe
indicates dust with some carbonaceous influences similar to SACOL and Taihu in the
winter case.
A theoretical model based on geometric and mathematical calculations is used to
compare with the AERONET retrieved aerosol parameters. The AERONET inversion
algorithms employ a spheroidal particle shape assumption while the model assumes a tri-
axial ellipsoidal shape. Though particle shape as well as size is important, the particle
absorptive behavior should also be taken into account especially when mixtures of
particle types are present. The winter cases at SACOL and Taihu show poor agreement
between theory and observation when the effective radius is varied while holding the
index of refraction constant. This is due to the wide variety of mineral dust and
carbonaceous aerosols particles in the mixture that likely have different indices of

46
refraction. Xianghe has similar indices of refraction for both winter and spring cases
leading to good agreement between model and observation results.
The spring cases exhibited better agreement than the winter cases because mineral
dust was more dominant during the spring season at all three sites. Better agreement
between theory and observation at all three sites is observed when the index of refraction
is varied while holding the effective radius constant. This suggests the model is more
sensitive to the particle absorptive properties rather than the size, especially when dealing
with retrieving aerosol properties of mineral dust and carbonaceous particle mixtures. In
light of these results it should be mentioned that when the index of refraction is held
constant while the effective radius varies, there is less variability in the model than when
the opposite is done. When aerosols have both similar size and composition (e.g. the
Xianghe site) the model and observation results have sufficient agreement such that both
scenarios can be used.
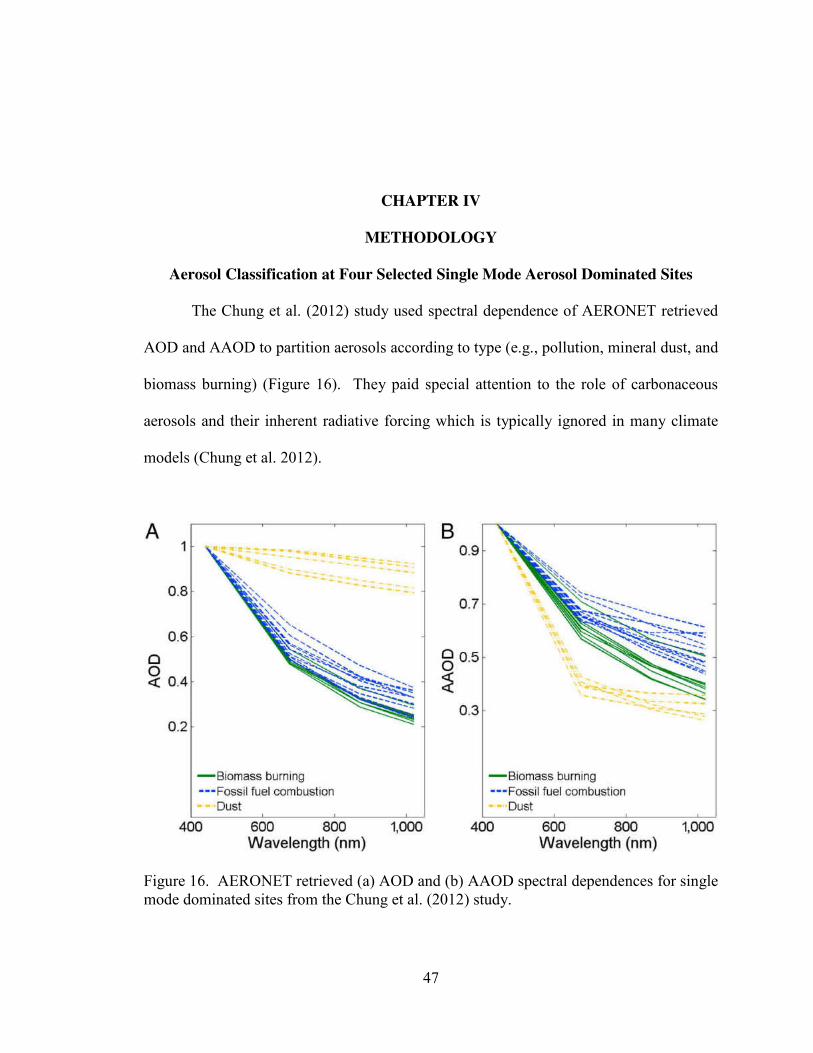
47
CHAPTER IV
METHODOLOGY
Aerosol Classification at Four Selected Single Mode Aerosol Dominated Sites
The Chung et al. (2012) study used spectral dependence of AERONET retrieved
AOD and AAOD to partition aerosols according to type (e.g., pollution, mineral dust, and
biomass burning) (Figure 16). They paid special attention to the role of carbonaceous
aerosols and their inherent radiative forcing which is typically ignored in many climate
models (Chung et al. 2012).
Figure 16. AERONET retrieved (a) AOD and (b) AAOD spectral dependences for single
mode dominated sites from the Chung et al. (2012) study.
48
Asian aerosols are typically comprised of complex mixtures of these particles, therefore
making it extremely difficult to study their behavior. Thus, it is necessary to investigate
aerosol properties in regions dominated by single mode aerosol types since this will aid in
serving as a baseline for analyzing the aerosol properties in Asia. The AERONET
retrieved spectral dependences of AOD, AAOD, and oabs (Figure 17) from four sites
investigated in the Logan et al. (2013a) study reflect aerosol source regions dominated by
weakly absorbing pollution [Mexico City (19.34ºN, 99.18ºW)], strongly absorbing
mineral dust [Solar Village (24.91ºN, 46.40ºE)], and biomass burning particles [Alta
Floresta (9.87ºS, 56.10ºW)].

49
Figure 17. Log-log relationship of the mean extinction aerosol optical depth (AOD)
spectral dependence for all aerosol cases at each single mode aerosol site. The AOD
values are given as ratios to AOD440 after Chung et al. (2012) to show the degree of
spectral dependence from the visible to near IR wavelengths. (b) Same as (a) but for
absorption aerosol optical depth (AAOD). (c) Spectral dependence of the single
scattering co-albedo (oabs) with error bars denoting ±1.
As illustrated in Figure 17a, Solar Village has the weakest AOD spectral dependence of
all four sites indicating coarse mode particles. Alta Floresta has the strongest spectral
dependence which suggests fine mode particle dominance. NASA Goddard and Mexico
City have spectral dependences between the other two sites but exhibit strong fine mode
dominance.
In terms of absorption (Figure 17b), the four sites have spectral AAOD
dependences similar to what is presented in Figure 16b with NASA Goddard and Mexico
City having the weakest AAOD dependence and Solar Village having the strongest

50
dependence. Carbonaceous pollution and mineral dust aerosols tend to strongly absorb in
the UV and visible (440-675 nm) and weakly absorb in the near IR (> 675 nm). Note that
Mexico City has a stronger spectral dependence than NASA Goddard. This is likely
attributed to a higher fraction of strongly absorbing carbonaceous particles from the
larger urban/industrial influences in and around central Mexico than the eastern United
States. Alta Floresta has an intermediate AAOD spectral dependence which is likely
indicative of carbonaceous particles consisting of BC and OC mixtures (Reid et al. 1999;
Andreae and Gelencsér 2006; Lack and Cappa 2010).
Figure 17c offers an alternative perspective of the aerosol absorptive properties at
the four sites. We propose that the spectral dependence of the single scattering co-albedo
(oabs) can be used to better separate the different aerosol types by comparing the relative
amount of absorption in the visible to the absorption in the near IR. The oabs parameter
demonstrates the absorptive nature due to the internal composition of the particles rather
than particle loading since it is basically a ratio of AAOD to AOD. At NASA Goddard,
Mexico City, and Alta Floresta, oabs increases with increasing wavelength due to
carbonaceous influences. Mexico City has the strongest spectral oabs dependence likely
due to a higher amount of BC and strongly absorbing OC influences. The spectral
dependence at Alta Floresta indicates biomass particles that have similar BC and OC
influences. NASA Goddard shows a weaker spectral dependence due to more sulfate and
weakly absorbing OC content. However, there are BC influences that led to an increase
of absorption with wavelength. In contrast to the other sites, Solar Village has a strong
decrease in absorption in the visible that levels off in the near IR. The iron oxide content
of the mineral dust is largely responsible for this decrease in the visible and the size of

51
the dust particles (more scattering) is responsible for the continued decrease in the near
IR.
The absorptive characteristics of the aerosols at each site become less ambiguous
with oabs as opposed to AAOD in that more information about aerosols can be inferred
by the oabs spectral dependence. Therefore, it should follow that oabs can be used to
infer the internal (or physico-chemical) nature since each aerosol region exhibits a unique
spectral dependence reflecting either a pure aerosol type or a combination of aerosol
types in the case of mixtures. Hence, this parameter along with the Angström exponent
(AEAOD) can provide useful information for analyzing the seasonal and regional
variability of aerosol types.
Aerosol Classification Method Involving AEAOD and oabs
As demonstrated in the previous section, the spectral dependence of oabs
provides more information than AAOD regarding the physico-chemical properties of the
aerosol types discussed in this study in addition to the AEAOD parameter representing
particle size. Thus, these two parameters are combined to illustrate an innovative
classification method that is first tested at the single mode aerosol sites which will aid in
serving as a baseline for analyzing the aerosol properties. The method will then be
applied over more complex aerosol source regions in Asia, North America, and the
remote Atlantic Ocean (Chapter V).
Figure 18 presents the results of classification method on the four single mode
aerosol dominated AERONET sites. A frequency analysis using all aerosol cases from
the sites was performed and it was determined that a oabs440 value of 0.07 denotes the
demarcation line between strongly and weakly absorbing aerosols (results not shown).

52
For the two pollution sites, the aerosol particles are dominated by fine mode (AEAOD >
0.75). Therefore we define Region I as having weakly absorbing particle dominance
(most of oabs values < 0.07) and Region II as having strongly absorbing particle
dominance (most of oabs440 values > 0.07). Note that Mexico City has large oabs
variability with the majority of the aerosol cases located at Region II. Region III
represents coarse mode, strongly absorbing mineral dust aerosol cases (AEAOD < 0.75).
Region IV represents coarse mode, weakly absorbing aerosols that are primarily observed
at the Solar Village site (desert).
Figure 18. Classification of four AERONET sites representing weakly absorbing (NASA
Goddard) and strongly absorbing (Mexico City) pollution, mineral dust (Solar Village)
and biomass burning (Alta Floresta) aerosol types. The time period for each site is 1993-
2011 (NASA Goddard), 1999-2009 (Mexico City), 1999-2010 (Solar Village) and 1993-
2010 (Mexico City). A threshold of AEAOD=0.75 is used to define the fine (> 0.75) and
coarse (< 0.75) mode aerosols, while weakly (ωoabs440 < 0.07) and strongly (ωoabs440 >
53
0.07) absorbing aerosols are set at ωoabs440 = 0.07. Solar Village is near Riyadh, Saudi
Arabia, which is dominated primarily by mineral dust aerosols but can be occasionally
influenced by urban aerosols. It should be noted that winter, spring, and summer cases
are presented at the Alta Floresta site (southern hemisphere).
Aerosol Transport
Aerosols such as pollution, mineral dust, and biomass smoke can affect
downwind regions that are several hundreds to thousands of kilometers from their source
regions. These impacts include decreases in incoming solar radiation, alterations in cloud
properties, and human health concerns. Ongoing urban/industrialization in Asia, mineral
dust storms, and biomass burning processes all strongly contribute to these effects. Thus,
there continues to be a strong need to investigate how the properties of aerosols evolve
and impact distant locations during transport.
The National Aeronautics and Space Administration (NASA) led a field
experiment known as the Intercontinental Chemical Transport Experiment – Phase B
(INTEX-B)1 during the spring of 2006 over the eastern Pacific Ocean (Singh et al. 2006).
The major goals of INTEX-B were to (a) quantify the transpacific transport and evolution
of Asian dust and (b) assess its implications for regional climate using aircraft in situ
measurements. The Logan et al. (2010) study investigated the optical properties of the
Asian dust plumes during transport over the remote Pacific where the DC-8 aircraft
conducted intensive investigations of the plumes using DIAL and nephelometer
observations. Terra/Aqua satellite measurements were also used to outline the
transpacific transport process during the spring season (March-May) of 2006. Based on
1 INTEX-B, the second phase of the main field experiment called INTEX-North America
(INTEX-NA), was a two-part field experiment with the first half of INTEX-B conducted
over Mexico, but for this paper, INTEX-B here only refers to the second half of the
campaign over the eastern Pacific Ocean.

54
available data, three scientific issues concerning Asian dust were examined: (1) aerosol
properties along with surface and Top-Of-Atmosphere (TOA) radiation budgets, (2)
aerosol properties as functions of both their points of origin and destination, and (3) the
major transport pathway based on the satellite (Terra/Aqua) measured AOD.
The Logan et al. (2013c) study investigated biomass smoke transport from
wildfire source regions in the western United States to the Northern Great Plains using
AERONET retrieved aerosol data, CALIPSO satellite products, and particle trajectory
model data. Similar to quantifying Asian aerosol properties during transport in the
INTEX-B study (Logan et al. 2010), biomass smoke aerosols also vary during transport
in terms of their radiative and chemical properties. The carbonaceous content (BC and
OC) of biomass smoke aerosols depend on their mode of generation. The high
temperature, flaming combustion mode generates smoke particles that are strongly
absorbing due to their high BC content. However, the low temperature smoldering
combustion mode generates particles that are weakly absorbing with less BC and more
OC compounds. During transport, the carbonaceous compounds undergo chemical
processes (e.g., photolysis and oxidation) that weaken the absorption of biomass smoke.
Hence, it is evident that these particles can greatly influence the aerosol direct effect
since strongly absorbing biomass smoke can warm the atmospheric layer in which they
reside. In contrast, weakly absorbing biomass smoke can reflect more solar radiation
back to space.
The long range transport of aerosols can also impact cloud formation processes
downwind of the aerosol source regions. The Logan et al. (2014) study investigated
aerosol influences on marine boundary layer (MBL) CCN. Using multiplatform aerosol

55
and CCN data from the 2009-2010 Clouds, Aerosols, and Precipitation in the Marine
Boundary Layer (CAP-MBL) field campaign conducted over Graciosa Island, Azores,
several aerosol types and their probable source regions are identified by the aerosol
classification method developed in this dissertation. As a result, the effects of the aerosol
types on NCCN can be quantified.

56
CHAPTER V
RESULTS AND DISCUSSIONS
SQ1: What Are the Seasonal and Regional Variations of Aerosol Physico-chemical
Properties at Four Selected Asian Locations?
This dissertation employs the AERONET retrieved particle volume size
distribution along with four aerosol parameters: AOD440, AAOD440, AEAOD, and
AAEAOD in order to infer the regional and seasonal variation of aerosol types at four
selected sites in Asia. First, the annual and seasonal size distributions along with the
monthly means of the aerosol parameters are analyzed and discussed. The annual and
seasonal means as well as their standard deviations are summarized in Table 4. These
two subsections will lay a foundation for the feasibility of using the AEAOD and oabs
parameters in the aerosol classification method in the final subsection.
Annual and Seasonal Aerosol Size Distributions
Figure 19 shows the annual and seasonal averaged particle volume size
distributions from the four selected AERONET sites. As illustrated in Figure 19a both
the Xianghe and Taihu sites show a bimodal distribution with a fine mode peak at 0.16
m and coarse mode peak near 3 m. Note that Xianghe has a larger coarse than fine
mode volume while the opposite is true for Taihu. The SACOL site is bimodal with a
large coarse mode peak at 2.1 m. Mukdahan is a near mirror image of SACOL having a
large fine mode peak at 0.2 m.

57
Though Figure 19a shows the annual mean variations of
aerosol size distribution, the seasonal variations of particle volume size distribution
illustrates any possible periodic dependence of aerosol generation.
Figure 19. Aerosol volume size distributions over the four selected AERONET sites. (a)
Annual and (b-e) seasonal means (standard deviation) of aerosol optical depth (AOD) and
Angström exponent (AEAOD). Note that there is no summer observation data at
Mukdahan due to few retrievals (< 3) during that season (wet monsoon).

58
Figures 19b-e suggest that the Xianghe, Taihu and SACOL sites had coarse mode
dominance during the spring season likely due to mineral dust influences from both the
Gobi and Taklamakan Deserts (Eck et al. 2005; Huang et al. 2008a, b; Eck et al. 2010).
During the summer season, there is a change in aerosol size dominance from coarse to
fine mode. The wet monsoon begins during the early summer season which in turn
enables southerly winds to transport pollution and biomass aerosols as well as moisture
from the lower latitudes of southern and eastern Asia northward (Eck et al. 2005; Gautam
et al. 2012). The increased humidity creates an abundance of suspended water droplets
capable of facilitating gas to particle processes which can lead to a larger concentration of
fine mode aerosols (Yao et al. 2002; Eck et al. 2005; Li et al. 2007a; Pathak et al. 2009;
Jin et al. 2011). SACOL also has a slightly larger fine mode during the summer season
than during the spring, which is likely due to local pollution and biomass burning aerosol
generation (Xin et al. 2007; Huang et al. 2008b). Mukdahan appears to be influenced by
biomass burning activity throughout the dry season from numerous wildfires and ongoing
agricultural activities (Gautam et al. 2012). It should be noted that due to wet monsoon
activity the Taihu and Mukdahan sites have only limited observations of aerosols,
especially during the summer months (Eck et al. 2005; Gautam et al. 2012).
During the autumn months (SON), there is a smaller fine mode volume
contribution than the summer season at the Xianghe, Taihu and SACOL sites. This likely
reflects decreased humidity as well as diminished aerosol loading (as given by lower
AOD440) (Eck et al. 2005). At Taihu, the fine mode volume contribution is the highest of
all four sites due to influences from local urban/industrial pollution (Shanghai) and
biomass burning aerosols (Xin et al. 2007; Eck et al. 2010; Kondo et al. 2011). At the

59
Mukdahan site, the fine mode reff shifts from 0.16 to 0.25 m due to crop burning and
other agricultural processes during this season (Gautam et al. 2012).
The winter months (DJF) show equal coarse and fine mode aerosol contributions
at Taihu while at the Xianghe site, the coarse and fine modes are similar in magnitude as
in the autumn months. Late winter dust activity (mineral dust and loose soil from bare
farmlands) may also be responsible for the increased coarse mode influence at both
Xianghe and SACOL (Huang et al. 2008b). Though the volume size distribution is useful
in discerning aerosol influences according to size, the other aerosol parameters discussed
in the following section will further illustrate aerosol influences according to type and
composition.
Seasonal Variation of Aerosol Optical Depth
In Figure 20a, Xianghe and Taihu both have summer maxima and late
autumn/winter minima in AOD440 with more variability at Xianghe indicating more
aerosol sources (Xin et al. 2007; Yang et al. 2008; Yang et al. 2009; Pan et al. 2010).
The increased variability seen at Taihu in the summer/early autumn is due to biomass
aerosol intrusions (Xin et al. 2007). SACOL has maxima in April and June where the
spring maximum can be attributed to strong dust activity beginning in early spring lasting
through May, while the summer maximum (and maximum variability) corresponds to
industrial influences from Lanzhou and biomass burning aerosols from neighboring
regions (Xin et al. 2007; Huang et al. 2008b). At Mukdahan, biomass burning activity is
at a maximum during March with a second maximum in the autumn months after the
rainy season (Gautam et al. 2012).

60
Figure 20. Monthly means of the aerosol optical depth (AOD) parameter at the 440 nm
wavelength. Note that the missing monthly means at Taihu and Mukdahan are due to
limited observations of aerosols during prolonged wet periods (summer season). The
error bars represent ±1.
Seasonal Variation of Absorption Aerosol Optical Depth
From Figure 21, Xianghe had both the largest AAOD440 variability (0.045-0.14)
and maximum AAOD440 value (0.14). The summer minima and winter maxima at
Xianghe and Taihu indicate that the different particles over these two sites were weakly
absorbing during the summer months and strongly absorbing during the winter months.
SACOL has near constant AAOD440 values with a first maximum in the spring and a
lesser second maximum in the autumn suggesting mineral dust episodes. Mukdahan had
higher AAOD440 values during the pre-monsoon months that shifted to lower values after
the rainy season.
Month

61
Figure 21. Same as Fig. 20 but for absorption aerosol optical depth (AAOD).
Seasonal Variation of Angström Exponent
Figure 22 illustrates the seasonal variation in AEAOD where Xianghe, Taihu, and
SACOL had spring minima due to coarse mode, mineral dust particle influence with a
more prolonged dust influence period at SACOL. The increase in AEAOD during the
summer months is due to fine mode pollution and moisture influences at Xianghe and
Taihu while at SACOL ambient mineral dust mixes with local pollution from Lanzhou
City. This is given by the increase in the volume fine mode while with volume coarse
mode remains dominant (Figure 19c) thereby keeping the mean AEAOD lower than the
other sites (Clarke et al. 2004; Zheng et al. 2005; Xin et al. 2007). The monthly mean
AEAOD values at Mukdahan are higher than those at the other three sites due to biomass
burning particles being the dominant aerosol type (Gautam et al. 2012).
Month
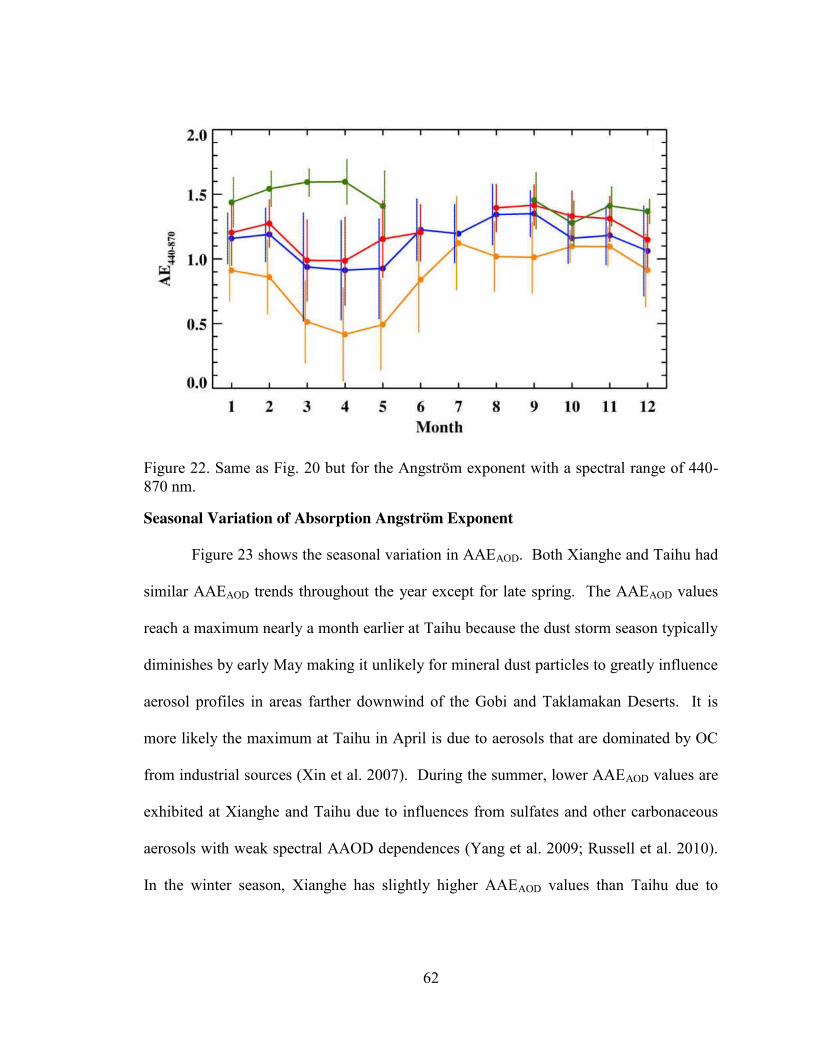
62
Figure 22. Same as Fig. 20 but for the Angström exponent with a spectral range of 440-
870 nm.
Seasonal Variation of Absorption Angström Exponent
Figure 23 shows the seasonal variation in AAEAOD. Both Xianghe and Taihu had
similar AAEAOD trends throughout the year except for late spring. The AAEAOD values
reach a maximum nearly a month earlier at Taihu because the dust storm season typically
diminishes by early May making it unlikely for mineral dust particles to greatly influence
aerosol profiles in areas farther downwind of the Gobi and Taklamakan Deserts. It is
more likely the maximum at Taihu in April is due to aerosols that are dominated by OC
from industrial sources (Xin et al. 2007). During the summer, lower AAEAOD values are
exhibited at Xianghe and Taihu due to influences from sulfates and other carbonaceous
aerosols with weak spectral AAOD dependences (Yang et al. 2009; Russell et al. 2010).
In the winter season, Xianghe has slightly higher AAEAOD values than Taihu due to

63
carbonaceous aerosols generated from a combination of residential coal burning and
industry (Zheng et al. 2005; Yang et al. 2009).
Figure 23. Same as Fig. 20 but for the absorption Angström exponent.
At SACOL, the monthly mean AAEAOD values typically reflect local urban and
industrial pollution from Lanzhou City but increase significantly from the winter to the
spring, and reach a maximum in April-May due to the strong dust activity in this region
of Asia (Xin et al. 2007; Huang et al. 2008a, b; Yang et al. 2009). At Mukdahan, the
monthly mean AAEAOD values are lower than those from the other three sites, suggesting
that the biomass particles exhibit a weaker spectral dependence due to carbonaceous
aerosols with more BC content than the other sites (Yang et al. 2009; Gautam et al.
2012).
The volume size distribution and the other parameters are useful in identifying
regional and seasonal aerosol influences and characteristics. The AEAODand ωoabs
parameters are explored as a means of further supporting our results by using aerosol

64
cases from regions dominated by pollution (absorbing and scattering dominant), mineral
dust, and biomass particles. The four Asian sites are then shown as approximate
combinations of the selected regions.
Spectral Dependences of AOD, AAOD, and oabs
The spectral dependence of AERONET retrieved AOD and AAOD is used to
partition aerosol types according to composition (e.g., mineral dust and carbonaceous
aerosols) at four selected Asian sites: SACOL (mineral dust region), Xianghe (mixed
dust and urban/industrial aerosol region), Taihu (urban/industrial pollution region), and
Mukdahan (biomass burning smoke region). Special attention is paid to the role of
carbonaceous aerosols (BC and OC) prevalent in the pollution and biomass smoke
aerosols with a strong emphasis on their absorptive properties and inherent radiative
forcing which is typically ignored in many climate models (Chung et al. 2012). In
Figures 24a and 24b, the AOD and AAOD values at all wavelengths are normalized to
their 440 nm values in order to illustrate the relative mean extinctive and absorptive
properties of all aerosol retrievals (Chung et al. 2012; Logan et al. 2013a). As illustrated
in Figure 24a, SACOL has the weakest AOD spectral dependence of all four sites
indicating coarse mode particles. Mukdahan has the strongest spectral dependence which
suggests fine mode particle dominance. Xianghe and Taihu have an AOD spectral
dependence between the other two sites due influences from both coarse and fine mode
particles with Xianghe having more of a coarse mode influence (closer proximity to
desert regions) while Taihu has more a fine mode influence (more sources of
urban/industrial aerosols).

65
Figure 24. (a) Log-log relationship of the mean extinction aerosol optical depth spectral
dependence for all aerosols cases at each AERONET site: 2001-2010 (Xianghe), 2005-
2010 (Taihu), 2006-2011 (SACOL), and 2003-2009 (Mukdahan). The AOD values are
given as ratios to AOD440 after the Chung et al. (2012) study to show the degree of
spectral dependence from the visible to near IR. (b) Same as (a) but for absorption
aerosol optical depth. (c) Spectral dependence of the single scattering co-albedo (oabs)
with error bars denoting ±1.
In terms of absorption (Figure 24b), Mukdahan has a near linear AAOD spectral
dependence which is likely indicative of biomass burning aerosols generated from
different combustion phases with BC dominating the overall absorption (Reid et al. 1999;
Andreae and Gelencsér 2006; Lack and Cappa 2010). Xianghe and Taihu have a stronger
AAOD spectral dependence in the visible that weakens in the near IR suggesting OC
dominant carbonaceous aerosols. SACOL has a similar spectral dependence in the
visible which becomes negligible in the near IR primarily indicating mineral dust
particles with varying amounts of iron oxides (Koven and Fung 2006; Chung et al. 2012).

66
Figure 24c shows that the carbonaceous biomass particles at Mukdahan tend to
have a nearly linear increase in absorption with wavelength which is indicative of more
influence of BC though there are likely OC influences as well (Bergstrom et al. 2007;
Gautam et al. 2012). In contrast, the SACOL site has strong absorption in the visible but
becomes weak in the near IR because dust particles are typically in the coarse mode and
tend to scatter in the near IR region (Bergstrom et al. 2007). The Xianghe and Taihu sites
nearly mirror one another with strong absorption in the visible but an increase in
absorption with wavelength in the near IR again indicating the influences of absorbing
carbonaceous particles, similar to Mukdahan.

67
Figure 25. AEAOD and oabs classification of the aerosol physico-chemical properties over
the four selected AERONET sites. The data are color-coded according to season to show
correlations between aerosol composition/type and time of year.
Aerosol Classification Method Involving AEAOD and oabs
A probability distribution analysis of oabs is used to illustrate the frequency of
occurrence and seasonality of strongly absorbing (oabs > 0.07) and weakly absorbing
(oabs < 0.07) aerosol cases. Figures 25a and 25b detail three seasonal groups of aerosols
at Xianghe and Taihu. There is a noticeable seasonal dependence at Xianghe with nearly
55% of the fine mode, weakly absorbing cases occurring during the summer (Region I)
and 90% of all fine mode strongly absorbing cases occurring in the autumn and winter
seasons (Region II). The coarse mode, strongly absorbing aerosols are observed during
the spring season primarily in Region III. Similarly at Taihu, 48% of the fine mode,

68
weakly absorbing cases in Region I occur during the early autumn while 75% of the fine
mode, strongly absorbing cases occur during the late autumn and winter (Region II).
Nearly 22% of the spring season aerosols are coarse mode, strongly absorbing.
At SACOL, all four regions contain aerosol cases with the majority of the spring
season cases located in Regions III and IV (similar to the Solar Village site). The
majority of the winter and autumn season aerosols are in Region II while the summer
cases are in Region I. The mean AEAOD and oabs440 values are lower in comparison to
Xianghe and Taihu. This is due to the fact that SACOL is located within a dust region
with fewer cities and outside aerosol influences, while Xianghe and Taihu are surrounded
by many large cities and industry (Eck et al. 2005; Xin et al. 2007; Bi et al. 2009; Yang et
al. 2009). This is also evident in Figures 26 and 27 where both the AEAOD and AAEAOD
values for this site were lower than those at Xianghe and Taihu.
Comparing the Region I and II results at Mukdahan with Xianghe and Taihu, note
that biomass burning aerosols present higher overall AEAOD values (Figure 22). The
variability in oabs440 is likely due to a wide variety of OC and BC particles generated by
different smoldering or flaming combustion modes (Reid et al. 1999; Clarke et al. 2004;
Zheng et al. 2005; Yang et al. 2009; Gautam et al. 2012). There is also a noticeable
seasonal dependence where 90% of the winter cases are located at Region II while the
most of autumn cases (88%) are generally in Region I. The spring season has the largest
variability in oabs440 presumably due to aerosol influences from both controlled
agricultural burning and natural wildfires from nearby forests (Gautam et al. 2012).
The large variability in AEAOD and oabs440 classified in this method can be
challenging. A great deal of overlap is evident which is likely attributed to inter-seasonal
69
shifts in aerosol type due to episodic changes in fuel type and meteorological patterns
(Clarke et al. 2004; Eck et al. 2005). The overlap can also be attributed to
inhomogeneous aerosol layers passing over the AERONET sites that add to the
variability. At other AERONET sites affected by multiple aerosol sources (e.g., North
America and the Azores), a priori knowledge of the regional and seasonal climatology
will aid in using this method.

70
Table 4. Summary of statistical data from the four AERONET sites. Yearly means of reff
are calculated from the seasonal mean values due to an uneven distribution of seasonal
data.
Xianghe Taihu SACOL Mukdahan
For o;
AOD440>
0.4
For o;
AOD440>
0.4
For o;
AOD440>
0.4
For o;
AOD440>
0.4
mean () Na mean () N mean () N mean () N
Year
AOD440 1.10 (0.60) 688 0.93 (0.43) 435 0.63 (0.28) 292 0.80 (0.31) 394
AAOD440 0.10 (0.05) 0.09 (0.04) 0.05 (0.03) 0.07 (0.03)
AEAOD 1.12 (0.32) 1.19 (0.28) 0.78 (0.38) 1.51 (0.18)
AAEAOD 1.53 (0.39) 1.49 (0.37) 1.32 (0.49) 1.14 (0.29)
reff (fine mode) 0.17 0.17 0.16 0.18
reff (coarse mode) 2.26 2.19 2.05 2.51
Spring
AOD440 1.02 (0.55) 198 0.88 (0.36) 162 0.69 (0.34) 108 0.87 (0.33) 191
AAOD440 0.10 (0.05) 0.08 (0.04) 0.06 (0.03) 0.07 (0.03)
AEAOD 0.93 (0.40) 1.05 (0.33) 0.47 (0.34) 1.58 (0.15)
AAEAOD 1.67 (0.45) 1.58 (0.38) 1.52 (0.56) 1.24 (0.26)
reff (fine mode) 0.15 (0.03) 0.15 (0.03) 0.13 (0.04) 0.16 (0.02)
reff (coarse mode) 2.15 (0.28) 1.92 (0.25) 1.82 (0.23) 2.47 (0.42)
Summer
AOD440 1.28 (0.73) 147 1.32 (0.61) 36 0.68 (0.39) 36 bn/a n/a
AAOD440 0.06 (0.04) 0.08 (0.04) 0.04 (0.02) n/a
AEAOD 1.24 (0.24) 1.27 (0.23) 1.01 (0.33) n/a
AAEAOD 1.39 (0.38) 1.37 (0.57) 1.30 (0.48) n/a
reff (fine mode) 0.20 (0.05) 0.21 (0.04) 0.19 (0.05) n/a
reff (coarse mode) 2.43 (0.26) 2.49 (0.34) 2.01 (0.44) n/a
Autumn
AOD440 1.04 (0.57) 180 0.91 (0.46) 126 0.53 (0.12) 48 0.70 (0.27) 63 AAOD440 0.10 (0.04) 0.07 (0.04) 0.04 (0.01) 0.04 (0.02)
AEAOD 1.22 (0.23) 1.34 (0.18) 1.09 (0.15) 1.36 (0.18)
AAEAOD 1.41 (0.28) 1.41 (0.34) 1.18 (0.48) 0.97 (0.39)
reff (fine mode) 0.17 (0.04) 0.18 (0.03) 0.19 (0.03) 0.21 (0.02)
reff (coarse mode) 2.30 (0.22) 2.33 (0.27) 2.24 (0.35) 2.58 (0.37)
Winter
AOD440 1.09 (0.54) 163 0.88 (0.38) 111 0.60 (0.17) 100 0.73 (0.27) 140
AAOD440 0.12 (0.05) 0.10 (0.04) 0.05 (0.02) 0.07 (0.03)
AEAOD 1.14 (0.26) 1.21 (0.22) 0.89 (0.27) 1.47 (0.16)
AAEAOD 1.62 (0.36) 1.47 (0.26) 1.19 (0.32) 1.09 (0.22)
reff (fine mode) 0.17 (0.04) 0.18 (0.04) 0.18 (0.04) 0.17 (0.02)
reff (coarse mode) 2.18 (0.24) 2.31 (0.24) 2.23 (0.34) 2.51 (0.43)
a Number of AERONET observations.
b Only one data point for this season.
SQ2: How Do These Aerosol Properties Change During Transpacific and Intra-
continental Long Range Transport?
This question is answered based upon the studies of Asian dust/pollution transport
across the Pacific ocean during the INTEX-B campaign (Logan et al. 2010) and biomass
burning transport over the North America during the summer of 2012 (Logan et al.

71
2013c). These studies show how aerosol physical and chemical properties change over
distances ranging from several hundreds to thousands of kilometers.
Asian Aerosol Transport
As shown in Figures 26 and 27, aerosol loading is greatest closest to the source
region and declines in magnitude during transport to the sink region. Figure 27 shows the
averaged AOD values retrieved from MODIS observations on Terra and Aqua from 7
April 2006 to 15 May 2006. The major pathways of aerosol plumes as observed from
both Terra and Aqua are quite consistent, but the absolute values are slightly different
over the land regions.

72
Figure 26. Transpacific transport of Asian aerosol plume (10 April 2006) intercepted by
DC-8 aircraft over the eastern remote Pacific Ocean on 17 April 2006. Courtesy of
Obrecht (2008) M. S. Thesis.

73
Figure 27. Averaged MODIS AOD values with 0.5o x 0.5
o grid box during INTEX-B
IOP the period 17 April-15 May 2006 on (a) Aqua and (b) Terra, and (c) their overall
transpacific transport zonal trend.
As illustrated in Figure 27a and 27b, there are two dust plumes: the pollution
plume (bottom arrow) and the dust plume (top arrow) originated from two different
source regions. Note that there is a large gap in both Terra and Aqua (white, no retrievals
from MODIS) over Mongolia, which may represent very high AOD which cannot be
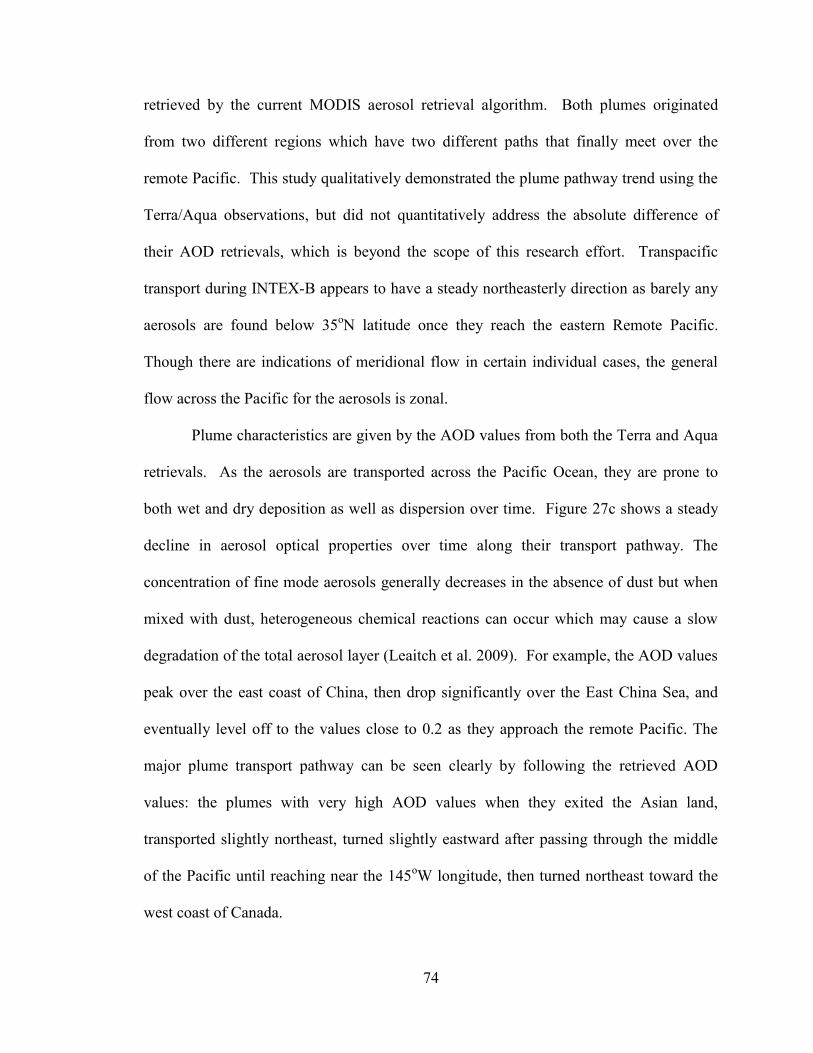
74
retrieved by the current MODIS aerosol retrieval algorithm. Both plumes originated
from two different regions which have two different paths that finally meet over the
remote Pacific. This study qualitatively demonstrated the plume pathway trend using the
Terra/Aqua observations, but did not quantitatively address the absolute difference of
their AOD retrievals, which is beyond the scope of this research effort. Transpacific
transport during INTEX-B appears to have a steady northeasterly direction as barely any
aerosols are found below 35oN latitude once they reach the eastern Remote Pacific.
Though there are indications of meridional flow in certain individual cases, the general
flow across the Pacific for the aerosols is zonal.
Plume characteristics are given by the AOD values from both the Terra and Aqua
retrievals. As the aerosols are transported across the Pacific Ocean, they are prone to
both wet and dry deposition as well as dispersion over time. Figure 27c shows a steady
decline in aerosol optical properties over time along their transport pathway. The
concentration of fine mode aerosols generally decreases in the absence of dust but when
mixed with dust, heterogeneous chemical reactions can occur which may cause a slow
degradation of the total aerosol layer (Leaitch et al. 2009). For example, the AOD values
peak over the east coast of China, then drop significantly over the East China Sea, and
eventually level off to the values close to 0.2 as they approach the remote Pacific. The
major plume transport pathway can be seen clearly by following the retrieved AOD
values: the plumes with very high AOD values when they exited the Asian land,
transported slightly northeast, turned slightly eastward after passing through the middle
of the Pacific until reaching near the 145oW longitude, then turned northeast toward the
west coast of Canada.
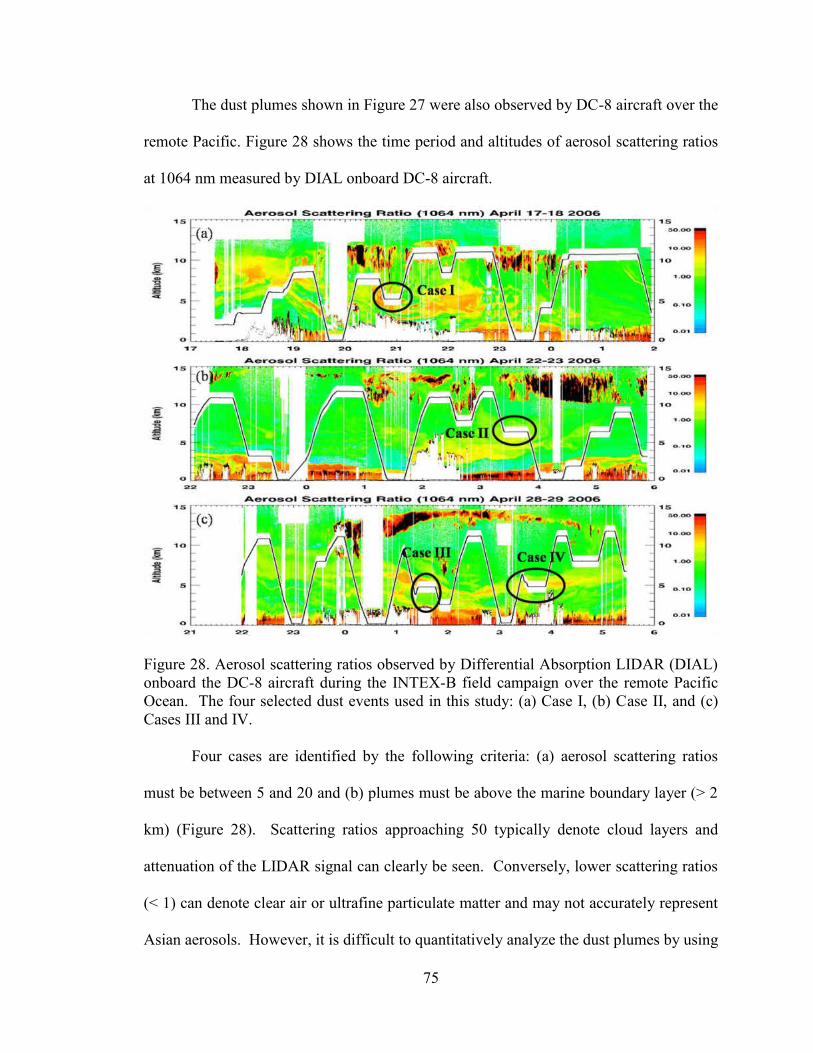
75
The dust plumes shown in Figure 27 were also observed by DC-8 aircraft over the
remote Pacific. Figure 28 shows the time period and altitudes of aerosol scattering ratios
at 1064 nm measured by DIAL onboard DC-8 aircraft.
Figure 28. Aerosol scattering ratios observed by Differential Absorption LIDAR (DIAL)
onboard the DC-8 aircraft during the INTEX-B field campaign over the remote Pacific
Ocean. The four selected dust events used in this study: (a) Case I, (b) Case II, and (c)
Cases III and IV.
Four cases are identified by the following criteria: (a) aerosol scattering ratios
must be between 5 and 20 and (b) plumes must be above the marine boundary layer (> 2
km) (Figure 28). Scattering ratios approaching 50 typically denote cloud layers and
attenuation of the LIDAR signal can clearly be seen. Conversely, lower scattering ratios
(< 1) can denote clear air or ultrafine particulate matter and may not accurately represent
Asian aerosols. However, it is difficult to quantitatively analyze the dust plumes by using

76
the DIAL measurements only, especially for discerning the fine and coarse mode aerosols
in the dust plumes. Therefore, it is necessary to use the nephelometer data to do further
analysis.
The scattering coefficient (sp), Angström exponent (AEneph), and spectral
curvature () parameters are used as proxies for aerosol loading, size, and mode
dominance, respectively. Gobbi et al. (2007) proposed a method involving both and
AEneph to track mixtures of pollution with dust. Spectral curvature is defined as the
change in AEneph over a spectral range of 450-700 nm and is useful in separating fine
mode aerosols ( < 0) from mixtures of fine and coarse modes ( ~ 0). It is given by
the equation
= AEneph450-500 – AEneph500-700. (9)
Gobbi et al. (2007) demonstrated that can be very close to zero under the conditions
of low concentrations of fine mode aerosols. Under conditions of high concentrations of
fine mode aerosols, can be much less than zero. During periods of high humidity,
particles can undergo hygroscopic growth which may artificially inflate values to near
zero though the fine mode will generally dominate the overall physical properties of the
aerosol plume more than the coarse mode. A summary of the AEneph and parameters
are included in Table 5.
For the 17 April 2006 dust event (Case I), the spectral data show a weak spectral
dependence of sp values at three different wavelengths (450, 550, and 700 nm) (Figure
29a) until a peak at 2100 UTC appears where the spectral dependence increases suddenly.
Immediately after the peak, the dependence becomes negligible. Figure 29b shows that
the mean (and standard deviation) AEneph is 0.46 ± 0.63, suggests that an abundance of

77
coarse mode particles existed in the plume. Though the mean is strongly negative (-
0.49) the large standard deviation (1.61) suggests a large variability in aerosol size likely
due to the presence of fine mode aerosols. Note that there is a noticeable cluster of data
points very close to -0.2 on the axis.
Figure 29. (a,b) Case I and (c,d) Case II. The scattering coefficients (sp) are measured
by the DC-8 nephelometer at three wavelengths (450, 550, and 700 nm). The Angström
exponent (AEneph) and spectral curvature () are derived from sp.
The 24 April 2006 dust event (Case II, Figure 29c) shows a strong sp spectral
dependence. The sp at the shorter wavelengths (450 and 550 nm) are consistently larger
than those at the longest wavelength (700 nm) because the backward scattering
coefficients decrease with increasing the wavelength with the presence of fine mode
aerosols in the plume. The mean AEneph (Figure 29d) is 1.53 ± 0.23 and the values lie
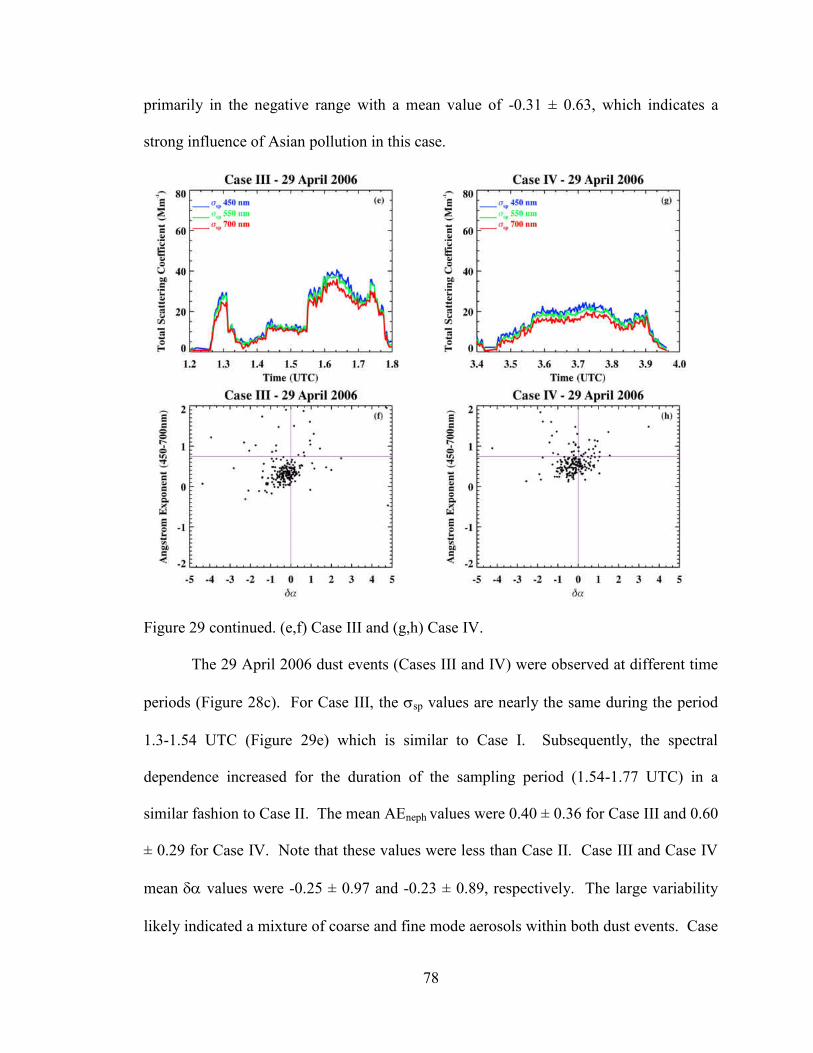
78
primarily in the negative range with a mean value of -0.31 ± 0.63, which indicates a
strong influence of Asian pollution in this case.
Figure 29 continued. (e,f) Case III and (g,h) Case IV.
The 29 April 2006 dust events (Cases III and IV) were observed at different time
periods (Figure 28c). For Case III, the sp values are nearly the same during the period
1.3-1.54 UTC (Figure 29e) which is similar to Case I. Subsequently, the spectral
dependence increased for the duration of the sampling period (1.54-1.77 UTC) in a
similar fashion to Case II. The mean AEneph values were 0.40 ± 0.36 for Case III and 0.60
± 0.29 for Case IV. Note that these values were less than Case II. Case III and Case IV
mean values were -0.25 ± 0.97 and -0.23 ± 0.89, respectively. The large variability
likely indicated a mixture of coarse and fine mode aerosols within both dust events. Case

79
IV had a strong spectral dependence throughout the time interval though not as strong in
magnitude as Case II (Figure 29g). Case IV had a larger AEneph mean value as compared
to Case III (Figure 29h) which suggests a stronger fine mode aerosol influence but again,
not as much as Case II.
Table 5. A summary of the physical and optical properties of the four selected Asian dust
events intercepted by the DC-8 aircraft. Nephelometer measurements provided AEneph
and while the plume remarks summarize the probable aerosol plume characteristics.
The standard deviations are included to show the variability of particle size.
Case Mean () AEneph Mean () Aerosol plume remarks
I 0.46 (0.63) -0.49 (1.61) strong dust plume
II 1.53 (0.23) -0.31 (0.63) strong pollution plume
III 0.40 (0.36) -0.25 (0.97) mixture of strong dust and pollution
IV 0.60 (0.29) -0.23 (0.89) mixture of strong dust and pollution
To further track these four cases back to their origin regions, the HYSPLIT
backward trajectory model was used at three different altitudes: 3 km, 5 km, and 7 km
(Draxler et al. 2003). According to Qiu and Sun (1994), aerosol particles can be
transported eastward from China to the Pacific Ocean in the 2 to 7 km height range, and
this is the reason to choose these three altitudes in this study. Figure 22 shows the back-
trajectory analysis of the selected four cases (using the 5 km (blue) trajectory line as a
proxy for plume altitude). Key points describing the similarities and differences from the
model output include: (a) for Cases I and III, the dust plumes originated from the Gobi
desert, and (b) for Cases II and IV, the dust plumes originated from the Taklamakan
desert. The transport time of dust plumes for the four cases are around 7.5, 8, 5, and 7
days, respectively, to reach the remote Pacific regions where the dust plumes were
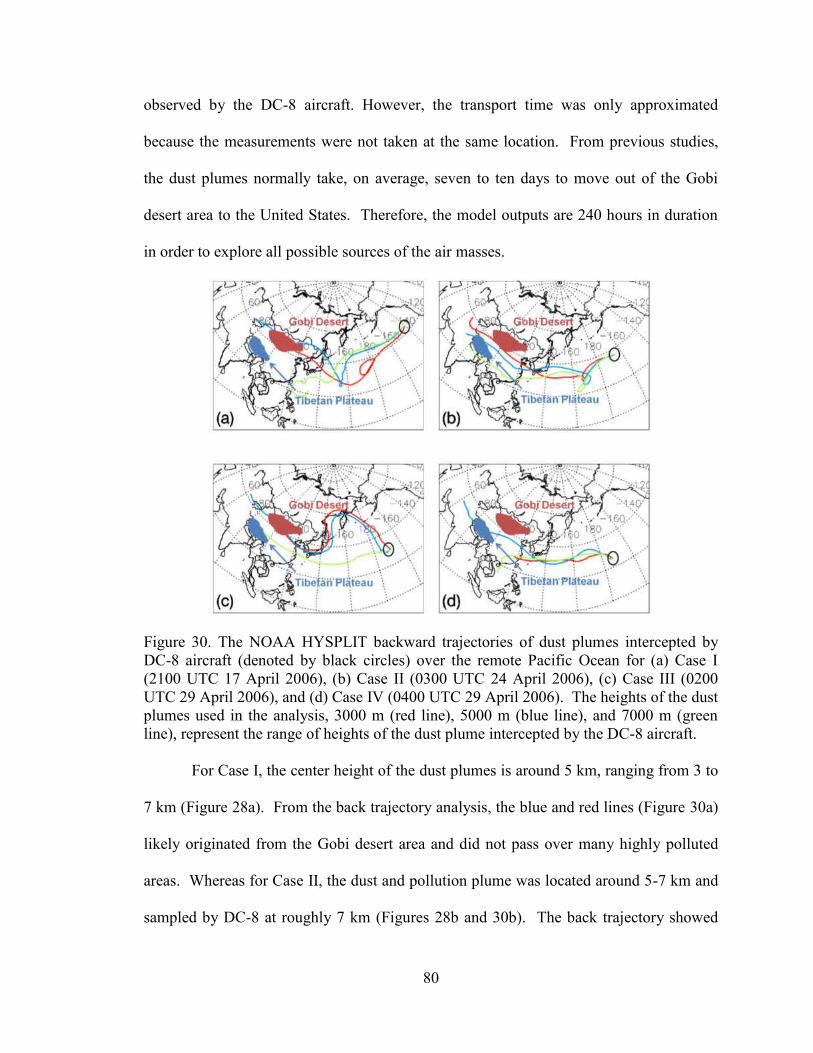
80
observed by the DC-8 aircraft. However, the transport time was only approximated
because the measurements were not taken at the same location. From previous studies,
the dust plumes normally take, on average, seven to ten days to move out of the Gobi
desert area to the United States. Therefore, the model outputs are 240 hours in duration
in order to explore all possible sources of the air masses.
Figure 30. The NOAA HYSPLIT backward trajectories of dust plumes intercepted by
DC-8 aircraft (denoted by black circles) over the remote Pacific Ocean for (a) Case I
(2100 UTC 17 April 2006), (b) Case II (0300 UTC 24 April 2006), (c) Case III (0200
UTC 29 April 2006), and (d) Case IV (0400 UTC 29 April 2006). The heights of the dust
plumes used in the analysis, 3000 m (red line), 5000 m (blue line), and 7000 m (green
line), represent the range of heights of the dust plume intercepted by the DC-8 aircraft.
For Case I, the center height of the dust plumes is around 5 km, ranging from 3 to
7 km (Figure 28a). From the back trajectory analysis, the blue and red lines (Figure 30a)
likely originated from the Gobi desert area and did not pass over many highly polluted
areas. Whereas for Case II, the dust and pollution plume was located around 5-7 km and
sampled by DC-8 at roughly 7 km (Figures 28b and 30b). The back trajectory showed

81
that the green and blue lines likely originated from the Taklamakan desert and passed
through several highly polluted areas. Therefore, the outputs of the back trajectory model
did support the findings from DC-8 measurements in Cases I (coarse mode) and II (fine
mode).
For Cases III and IV, the green and blue lines likely originated from central
China, and the data suggested a possible scenario of air masses containing dust plumes
that were lifted above the boundary layer and passed through many urban areas (Figures
30c and 30d). Trajectories that cross paths over either the Gobi or Taklamakan Deserts
are also scrutinized in order to see how pollution and dust can co-mingle at various points
during their transpacific transport. By using sp, AEneph, , and HYSPLIT trajectory
analysis, the Logan et al. (2010) study was able to conclude that Asian aerosol plumes
were dominated by dust, pollution, and complex mixtures during transport. An additional
study investigates biomass burning aerosol properties during transport using ground-
based AERONET retrievals in North America.
Biomass Burning Aerosol Transport over the Northern Great Plains
Dry conditions during an exceptionally mild winter and warm spring led to an
outbreak of wildfires in many areas of North America including the intermountain west
and Pacific states in the United States. Over 5 million acres nationwide had been burned
in the first nine months of 2012 (http://www.nifc.gov/fireInfo/nfn.htm). As a result of the
fires, numerous smoke plumes were observed several hundreds to thousands of
kilometers away from their combustion sources and also affected the air quality in the
areas along the transport route (EPA, www.airnow.gov). In late June, biomass smoke
plumes were observed in the northern Great Plains region by the newly installed Grand

82
Forks Aerosol Robotic Network (AERONET) site. Before the installation of this site
(October 2011), there were few active ground-based observation stations between the
intermountain west and the eastern United States.
Biomass smoke plume transport. Figure 31 shows a time series of hourly
AERONET retrieved AOD440 over the Grand Forks AERONET site (47.91ºN, 97.32ºW)
during the warm season of 2012. Each peak in AOD440 is followed by a sharp decrease
which denotes the passage of a cold front (shift in wind direction from southerly to
westerly) or low pressure system that removed much of the smoke from the area (i.e.,
clouds or precipitation). This pattern repeated itself throughout the summer and early
autumn until the fires were eventually extinguished. This study selects six instances
where AOD440 is greater than 0.4 to represent a strong biomass burning event. In
addition, AAOD and oabs values are usually retrieved under this condition (AOD440 >
0.4).

83
Figure 31. Aerosol loading of smoke plumes as evidenced by the periodic increase and
decrease of the hourly aerosol optical depth (AOD) observed by the newly installed
Grand Forks AERONET site (47.91oN, 97.32
oW). Each case is color coded and this
convention is used in the subsequent figures.
To identify the source regions of the six selected cases in Figure 31, the
HYSPLIT backward trajectory model was used to track the origins of the smoke plumes
(Figure 32). The locations of major fires along their trajectory routes were also displayed.
In general, the backward trajectories revealed source regions in three parts of the United
States: the intermountain west states (Colorado and Wyoming), northern Rockies
(Montana and Idaho), and the Pacific states (Washington, Oregon, and California). Note
that fires located outside of the trajectory path generated smoke plumes which were
eventually advected in the general direction of the Grand Forks AERONET site.

84
Figure 32. HYSPLIT backward trajectories of the six cases (with the same color code as
Fig. 30). The “X” characters represent a 24 hour time segment of the backward trajectory that was initialized at the time of maximum aerosol loading (AOD440 maximum). The
locations of the wildfires (Roman numerals color coded by case) are identified by
MODIS Aqua/Terra satellite fire products (http://earthdata.nasa.gov/data/near-real-time-
data/data/hazards-and-disasters/fires).
Based on archived meteorological observations and model data, high pressure
ridges were determined as the primary processes responsible for transporting the smoke
plumes (www.esrl.noaa.gov/psd/data/composites/day/). The trajectories are marked every
24 hours in order to show the temporal movement of the smoke plumes from the source
regions to Grand Forks. Cases II, III, and V had the fastest transport times (≤ 1 day).
Case VI had a transport time of nearly 36 hours while Cases I and IV had the slowest
transport times that approached 3 days. Note that any smoke plumes within the periphery
of the ridge traveled faster than those smoke plumes that were closer to the center of the
high pressure.

85
Figure 33 is generated by the Navy Aerosol Analysis and Prediction System
(NAAPS) model. Figures 33a, b, and c show the locations of the wildfire source regions
for Cases III, V, and VI while Figures 33d, e, and f show evidence of the smoke plumes
over Grand Forks. Note that northern and eastern transport from the source regions is
evident in these case examples. Case III exhibited vastly different optical properties from
the other cases and will be further discussed in the next section.
Figure 33. Navy Aerosol Analysis and Prediction System (NAAPS) model output
(http://www.nrlmry.navy.mil/aerosol/) showing the locations of the wildfire source
regions (dark red regions) for Cases (a) III, (b) V, and (c) VI while (d), (e), and (f) show
the smoke plumes for the respective cases over Grand Forks (black circle). A transport
pathway can clearly be seen from the hotspots to Grand Forks with decreasing smoke
concentration.
Biomass smoke plume optical properties. Figure 34a shows the daily mean
particle volume size distribution (dV/dlnR) for the six cases. The fine mode dominated
the dV/dlnR for all cases. Case II had the strongest fine mode influence while Case VI
had the strongest coarse mode influence. It is likely that the smoke aerosols had

86
undergone some degree of coagulation and/or hygroscopic growth during transport since
all cases exhibited a bimodal distribution. In Figure 34b, the AOD spectral variations fit
the general range of biomass burning aerosols (Chung et al. 2012; Logan et al. 2013a).
For example, Case V had the strongest AOD spectral dependence and therefore the
highest AE value (1.98) while Cases I and VI had the weakest dependence with lower
values of 1.54 and 1.55, respectively.
Figure 34. Daily mean AERONET retrieved (a) particle volume size distributions and the
spectral dependences of (b) AOD, (c) AAOD, and (d) oabs for the six selected cases.
Biomass smoke plume physico-chemical properties. Figures 34c and 34d show
the daily mean spectral dependences of AAOD and oabs. All cases had a normalized
AAOD dependence of 0.4-0.5 which is typical for biomass burning aerosols (Chung et al.
2012; Logan et al. 2013a). Similar to Figure 34b, Case VI had the weakest AAOD

87
spectral dependence while Case V had the strongest. Case VI was previously identified
as having a strong coarse mode influence. The larger particles tended to scatter more than
they absorb (especially at the longer wavelengths), thus the weaker AAOD spectral
dependence. Cases I and III had relatively weak spectral dependences that could also be
attributed to their strong coarse mode contributions. Conversely, Cases II, IV, and V had
the stronger AAOD spectral dependences since the fine mode particles in turn exhibited
more absorption at the longer wavelengths due to their smaller size.
Black carbon (BC) is responsible for much of the absorption across all
wavelengths (visible to near IR) in the smoke particles and mixtures of BC and organic
carbon (OC) can be inferred by the spectral dependence in oabs. Figure 34d shows that
Case V had the lowest overall oabs values, suggesting that though the fine mode particles
have a large degree of extrinsic absorption, the mixture of carbonaceous compounds is
weakly absorbing. However, the slight increase in spectral oabs with wavelength can be
attributed to BC particle influences. Since this plume arrived at Grand Forks within 24
hours, the weak spectral dependence may be a result of smoke plumes that were
generated from the low temperature “smoldering phase” (Reid et al. 1998; Martins et al.
1998b; Saleh et al. 2013). Case II consisted of a smoke plume with the strongest fine
mode influence and had nearly the same oabs values as Case V but with a smaller coarse
mode influences. This suggested that a smaller amount of coagulation and/or hygroscopic
growth may have occurred during transport for Case II.
Case III had the highest spectral oabs values which increase with wavelength
denoting strongly absorbing carbonaceous influences. The plume was generated by a
fresh wildfire which would explain the large amount of absorption from BC particles
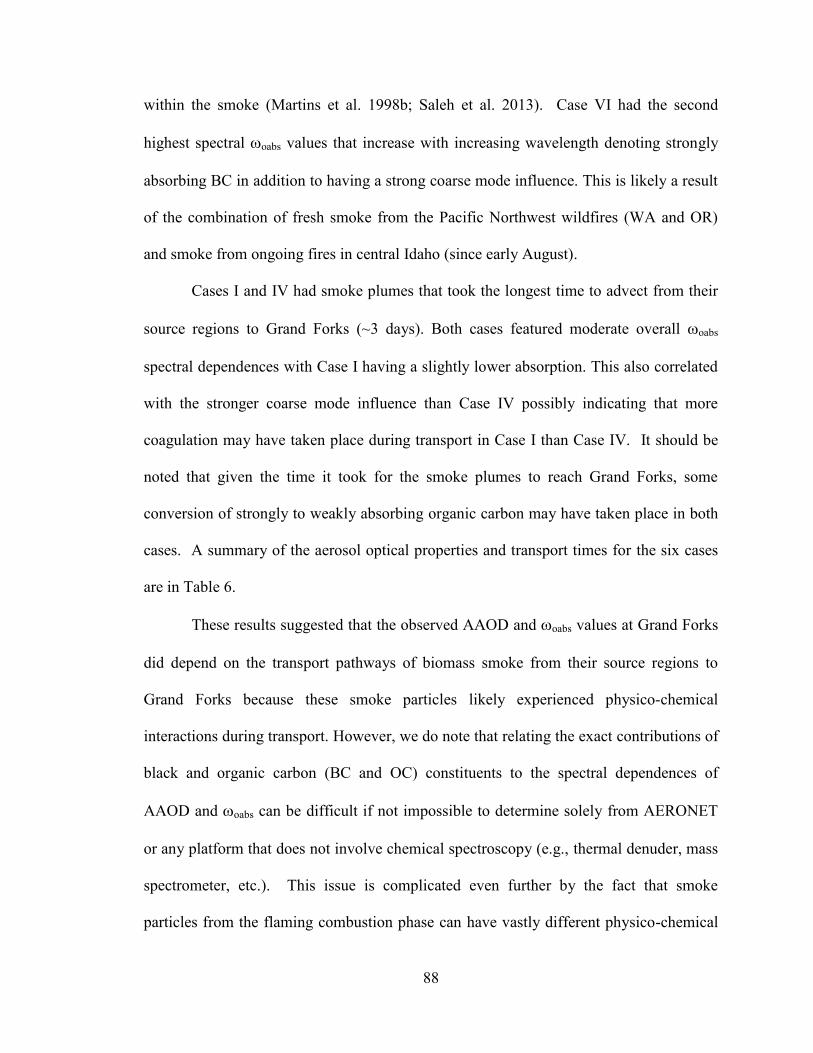
88
within the smoke (Martins et al. 1998b; Saleh et al. 2013). Case VI had the second
highest spectral oabs values that increase with increasing wavelength denoting strongly
absorbing BC in addition to having a strong coarse mode influence. This is likely a result
of the combination of fresh smoke from the Pacific Northwest wildfires (WA and OR)
and smoke from ongoing fires in central Idaho (since early August).
Cases I and IV had smoke plumes that took the longest time to advect from their
source regions to Grand Forks (~3 days). Both cases featured moderate overall oabs
spectral dependences with Case I having a slightly lower absorption. This also correlated
with the stronger coarse mode influence than Case IV possibly indicating that more
coagulation may have taken place during transport in Case I than Case IV. It should be
noted that given the time it took for the smoke plumes to reach Grand Forks, some
conversion of strongly to weakly absorbing organic carbon may have taken place in both
cases. A summary of the aerosol optical properties and transport times for the six cases
are in Table 6.
These results suggested that the observed AAOD and oabs values at Grand Forks
did depend on the transport pathways of biomass smoke from their source regions to
Grand Forks because these smoke particles likely experienced physico-chemical
interactions during transport. However, we do note that relating the exact contributions of
black and organic carbon (BC and OC) constituents to the spectral dependences of
AAOD and oabs can be difficult if not impossible to determine solely from AERONET
or any platform that does not involve chemical spectroscopy (e.g., thermal denuder, mass
spectrometer, etc.). This issue is complicated even further by the fact that smoke
particles from the flaming combustion phase can have vastly different physico-chemical

89
properties than particles from the smoldering phase. However, previous studies have
reported the relative black and organic carbon proportions of smoke plumes from
moments after pyrolysis to hours and days during transport and concluded: (a) absorption
of the smoke particles does decrease over time and (b) the flaming combustion phase
produces more strongly absorbing organic compounds than the smoldering phase
(Martins et al. 1998a, b; Reid et al. 1998; Lewis et al. 2008; Mack et al. 2010; Corr et al.
2012; Saleh et al. 2013).

90
Table 6. A summary of the mean AOD, AE, and AAE values for the six cases. Daily AERONET data is
used except for the maximum AOD440 values. The number of almucantar retrievals is represented by N.
2012 Warm Season
Cases Mean
AOD440
Maximum
AOD440a
Na AE AAE oabs440
b Transport
Time
I 26 June 0.31 0.40 5 1.54 1.16 0.97 ~ 3 days
II 4 July 0.27 0.44 3 1.82 1.15 0.99 < 1 day
III 31 July 0.41 0.64 4 1.81 1.07 0.94 < 1 day
IV 28 August 0.41 0.52 6 1.83 1.13 0.97 ~ 3 days
V 30 August 0.43 0.44 2 1.98 1.14 0.99 < 1 day
VI 15 September 0.48 0.48 1 1.55 0.79 0.95 1.5 days a Retrieved from AERONET hourly data.
b There are 3 or fewer oabs almucantar retrievals for each case.

91
Biomass smoke plume radiative properties. Aerosol Radiative Forcing (ARF) is
related to the amount of shortwave flux absorbed at the surface (SFC) during both clean
and aerosol laden periods and is given by the equation:
ARFSFC = Fa – Fc, (10)
where Fa and Fc represent the difference in broadband shortwave flux (downward and
upward) calculated with and without aerosols, respectively (e.g., García et al. 2012). The
Fc values are typically greater than -10 W m-2
, whereas most of the Fa values denoting
aerosol laden conditions are much less than -10 W m-2
. The strongly negative ARF
values generally associate with high AOD440 values.
Table 7 lists the Fa values for the six selected cases, the Fc values prior to and
after the passage of the observed smoke haze events, and their corresponding ARF
values. Cases III, IV, and VI had ARF values of -44.3, -42.8, and -39.3 W m-2
,
respectively. These were the most negative values throughout the entire warm season for
all smoke events (AOD440 > 0.2) as observed by the Grand Forks AERONET facility.
Note that these three cases also had the highest spectral oabs dependence of the six cases.
This suggests a correlation between the absorptive capacities of these aerosols in that the
carbonaceous compounds strongly absorb incoming shortwave radiation which can lead
to more of a cooling effect at the surface.
The sensitivity of ARF to AOD or aerosol radiative forcing efficiency (ARFeff) is
an important parameter in discerning the radiative impacts of specific aerosol types on
the atmosphere (Ge et al. 2010; García et al. 2012; Logan et al. 2013b). It is the ratio
ARF to AOD and can be calculated at levels representing either the bottom or top of the
atmosphere (Dubovik et al. 2006; García et al. 2012). The ARFeff parameter does not

92
take into account aerosol loading such that the absorptive properties of aerosols become
more evident (García et al. 2012). This study uses surface ARFeff to quantify the large
magnitude of ARF between the smoke plume height and at the surface (Li et al. 2007;
García et al. 2012).
Table 7 summarizes the ARFeff values for each case. All cases showed a general
increase in ARFeff as the smoke plumes passed over the AERONET site. Case III had the
largest ARFeff value of -117.6 W m-2
AOD-1
, indicating that the Case III aerosols had a
pronounced warming effect aloft. Again, the spectral oabs dependence supported this
claim since Case III aerosols had a stronger spectral dependence than all other cases
suggesting that these aerosols were likely a result of the high temperature flaming
combustion phase. The other cases did not have the same relationship between ARFeff
and oabs which suggested complex mixtures of carbonaceous aerosols generated by both
flaming/smoldering combustion phases.

93
Table 7. Hourly retrievals of aerosol radiative forcing (ARF) and aerosol radiative forcing efficiencies
(ARFeff) at the surface for the six selected cases. Clean Day represents mean Fc values corresponding
to AOD440 values less than 0.2 prior to and after the smoke event cases. Smoke Event values correspond
to maximum AOD440 values. Note that Cases IV and V represent a prolonged smoke event with different
radiative properties.
Case Clean Day
Fc (W m-2
)
Smoke Event
Fa (W m-2
)
ARF
Fa - Fc
ARFeff
(W m-2
AOD-1
)
Event
Duration
I 26 June -8.4 -38.2 -29.8 -140.3 6 days
II 4 July -8.5 -37.7 -29.2 -128.9 2 daysa
III 31 July -7.0 -51.0 -44.3 -117.6 6 days
IV 28 August -6.7 -49.5 -42.8 -140.7 9 days
V 30 August -6.7 -39.8 -33.1 -135.1
VI 15 September -6.9 -46.2 -39.3 -135.7 7 days a Persistent light haze was observed for nearly two weeks from late June to mid-July.

94
SQ3: What Are the Impacts of Aerosol Properties On Marine Boundary Layer
Cloud Condensation Nuclei Number Concentration?
Seasonal Aerosol Properties over the Azores
Figures 35a, b, and c show the seasonal mean aerosol loading (AOD) and size
(AEAOD) retrieved from AERONET in addition to surface (10 m) wind speed from AOS
measurements. Mean AOD values during the winter were close to the yearly mean as
there were few outside aerosol sources. However, the low AEAOD values (< 0.75) further
demonstrated that coarse mode aerosols were dominant during this season due to the
prevalence of low pressure systems over the Azores (Dong et al. 2014). In addition, the
winter months had the highest mean surface wind speed (6.7 m s-1
) which resulted in a
large amount of sea salt aerosol generation (Yoon et al. 2007). During the spring, strong
surface wind speeds (5.5 m s-1
) continuously generated sea salt while continental fine
mode aerosols began to assert their influences as illustrated in Figure 35b where AEAOD
values increased from 0.55 in March to 0.95 in May. The large standard deviations in
both AOD and AEAOD also suggested a large variability in aerosol loading, size, and
composition primarily due to weather patterns of varying intensity and track (Yoon et al.
2007; Yu et al. 2009).

95
Figure 35. Monthly mean and standard deviation of Graciosa AERONET retrieved (a)
AOD, (b) AE, and (c) AMF-Azores mean wind speeds during CAP-MBL. For (a) and
(b), only the months with statistical significance (> 10 hours of retrievals) are shown the
monthly mean ± 1.
Note that the maximum AEAOD and diminished surface wind speed in June
indicated that the fine mode continental aerosols contributed significantly to AOD. From
July to September, nearly constant, lower values of AOD (~ 0.12), moderate AEAOD (~
0.7), and minimum surface wind speed (~ 4 m s-1
) indicated a mixture of continental
aerosols and sea salt with the lowest coarse mode influence to AOD occurring during this
period. This was likely due to favorable weather patterns such as the Azores High
(summer season) and mid-latitude cyclones that advected various continental aerosols
over this region (Owen et al. 2006; Yu et al. 2009; Wood et al. 2014). With decreasing
AEAOD and increasing surface wind speed during the autumn months, the contribution of
sea salt to AOD likely became more dominant from October to December.

96
Figure 36 shows the mean (standard deviation) yearly and seasonal aerosol
particle volume (dV/dlnR) and number (dN/dlnR) size distributions, AOD, and AEAOD
during the CAP-MBL campaign. A low overall mean AOD440 of 0.12 denoted a clean
environment over this region. The eastern Atlantic Ocean is typically dominated by
coarse mode MBL sea salt, though influences from mineral dust aerosols cannot be ruled
out due to episodic intrusions of western African aerosols. In terms of aerosol volume, a
bimodal signal was prominent where the coarse mode influence (r ≥ 1 m) dominated
that of the fine mode (r < 1 m) throughout the year. In the case of the yearly number
size distribution, the fine mode was nearly the same magnitude as the coarse mode due to
continental aerosol influences during the spring and summer seasons. The coarse mode
aerosols (e.g., sea salt) dominated the volume and number size distributions during the
winter and spring months. However, weather patterns begin to advect continental
aerosols during the spring months over the Azores region as evidenced by the larger fine
mode number concentration.

97
Figure 36. AERONET retrieved yearly and seasonal mean aerosol (a) volume and (b)
number size distributions. The mean (standard deviation) aerosol optical depth (AOD)
and Angström exponent (AEAOD) are also included.

98
Note that the summer season had the lowest coarse mode volume influence as
well as the highest fine mode number contribution primarily due to a combination of the
low surface winds and an influx of pollution aerosols from the Americas (Yoon et al.
2007). The fine mode (coarse mode) contribution decreased (increased) during the
autumn months as supported by the decreasing trend in AEAOD (Figure 35b). This is
likely a result of maritime cyclones that create stronger winds at the surface thereby
generating more sea salt over the Azores (Yoon et al. 2007; Wood et al. 2014).
Aerosol Properties of the Six Selected Cases and their Impacts on MBL NCCN
In addition to the yearly and seasonal means, six aerosol events have been
selected from the warm season months (May-September) to investigate continental
aerosol properties during transport as well as their influences on MBL NCCN. The cases
consist of mineral dust, pollution, biomass smoke, and volcanic ash particles that have
aerosol loading at least greater than twice the overall mean AOD over the region (AOD440
≥ 0.25). Figure 37 shows the volume and number size distributions as well as the AOD
spectral dependences of the five selected cases (Cases I-V) plus an additional case (23
June 2010). Note that the 23 June 2010 case had no AOS observations and therefore only
the AERONET retrievals for this event will be discussed in comparison with the other
cases.
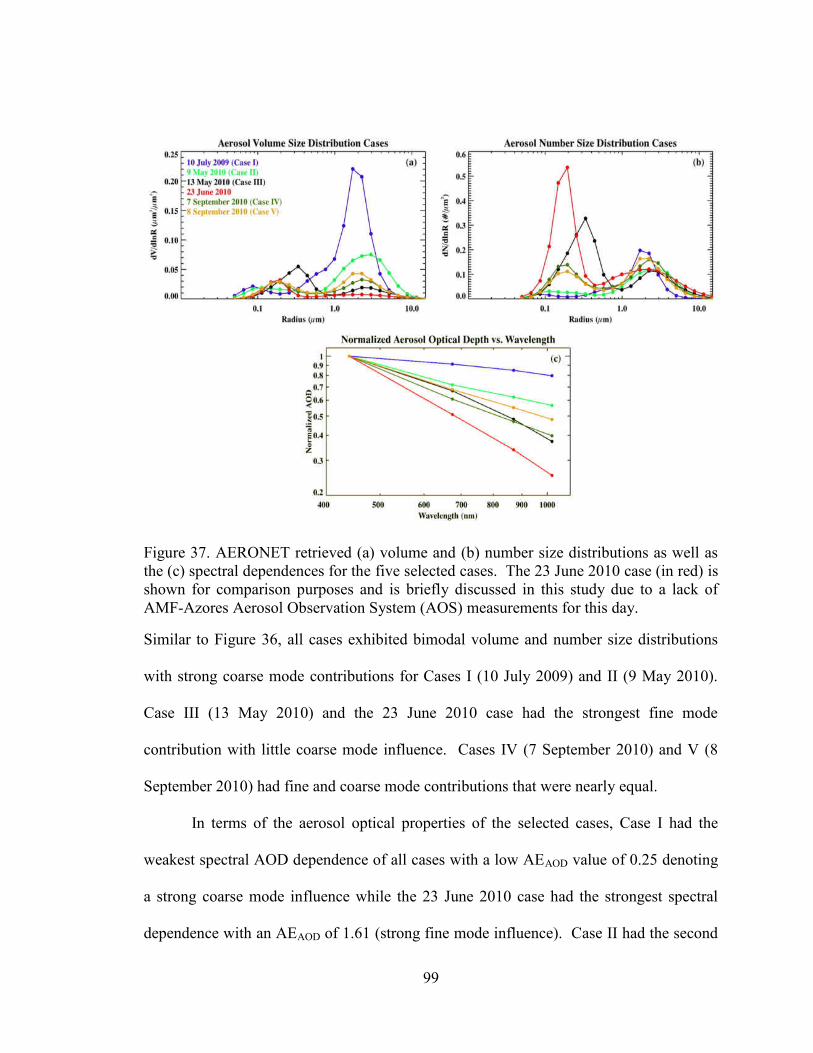
99
Figure 37. AERONET retrieved (a) volume and (b) number size distributions as well as
the (c) spectral dependences for the five selected cases. The 23 June 2010 case (in red) is
shown for comparison purposes and is briefly discussed in this study due to a lack of
AMF-Azores Aerosol Observation System (AOS) measurements for this day.
Similar to Figure 36, all cases exhibited bimodal volume and number size distributions
with strong coarse mode contributions for Cases I (10 July 2009) and II (9 May 2010).
Case III (13 May 2010) and the 23 June 2010 case had the strongest fine mode
contribution with little coarse mode influence. Cases IV (7 September 2010) and V (8
September 2010) had fine and coarse mode contributions that were nearly equal.
In terms of the aerosol optical properties of the selected cases, Case I had the
weakest spectral AOD dependence of all cases with a low AEAOD value of 0.25 denoting
a strong coarse mode influence while the 23 June 2010 case had the strongest spectral
dependence with an AEAOD of 1.61 (strong fine mode influence). Case II had the second

100
lowest AEAOD value of 0.71 followed by Case V with an AEAOD of 0.89 indicating
moderate coarse mode aerosol influences. In contrast, Cases III and IV had higher
AEAOD values of 1.08 and 1.13, respectively, indicating fine mode influences. However,
without further information of their absorptive properties, it is difficult to classify the
aerosols solely based on their size.
Figure 38. Cases I, II, IV, and V AOS measured aerosol properties as classified by the
Logan et al. (2013a) method: AEneph > 0.75 (< 0.75) for fine (coarse) mode, and ωoabs <
0.07 (> 0.07) for weak (strong) absorption. The colors denote sea salt (blue), mineral
dust (green), volcanic ash (red), pollution (gold), and unclassified (black) aerosols. No
absorption data exists for Case III (13 May 2010).
Figure 38 shows the aerosol properties from four of the five selected cases
classified by the Logan et al. (2013a) method where AEneph > 0.75 (< 0.75) was used to
denote fine (coarse) mode aerosols while ωoabs < 0.07 (> 0.07) denoted weak (strong)

101
absorption. Note that Case III had no PSAP ap absorption measurements and therefore
no oabs values. The aerosol types are color sorted according to nephelometer
measurements of sp as the aerosol plumes pass through the Azores region. In other
words, the sharp increase of sp from much lower baseline values denotes an aerosol
intrusion episode. Figure 39 shows probable plume source regions using HYSPLIT
backtrajectory model output (Draxler and Rolph 2012; Rolph 2012). An altitude of 1.5
km was chosen for the trajectories as this was the typical cloud-top height of the MBL
clouds over the Azores (Rémillard et al. 2012; Dong et al. 2014). Here, aerosols aloft can
either interact with MBL clouds directly or be transported to the surface by turbulence or
subsidence where they can affect NCCN.

102
Figure 39. HYSPLIT backward trajectories at 1.5-km level (solid lines) for the five
selected cases. (a) Purple line – Saharan mineral dust transported by a strong Azores
High pressure system, (b) light green line – volcanic ash from a recent Eyjafjallajökull
eruption (6 May 2010); black line – biomass smoke from Central and North America
along with urban/industrial pollution were advected to the Azores, and (c)
urban/industrial pollution and smoke from North America the eastern United States as
well as Saharan dust courtesy of Hurricane Earl (storm track outlined with dashed line)
were all advected to the Azores (dark green and gold lines).
For Case I, both sea salt and mineral dust were identified with the mineral dust
being coarser and more absorbing than the sea salt (Figure 38a). A high pressure system
(Azores High) was likely responsible for transporting Saharan dust around its periphery
to the Azores region (NOAA NCEP/NCAR re-analysis: Kalnay et al. 1996; Owen et al.
2006; Dong et al. 2014). The dust particles remained in the supermicron coarse mode
likely due to a lack of wet scavenging by clouds along the transport route. Though it was
possible that some North American aerosols (e.g., pollution) may have been present
103
within this plume, the trajectory did not pass very close to the mainland of the United
States (Figure 39a).
Figure 38b points out a cluster of weakly absorbing, coarse mode aerosols similar
to sea salt. However, these aerosols had stronger sp and ap spectral dependences
compared to sea salt (Figure 40). The trajectory for this case in Figure 39b showed a path
from North America through Iceland to the Azores. During the spring of 2010, volcanic
activity was occurring in Iceland including confirmed eruptions of Eyjafjallajökull during
4-7 May 2010 (Seifert et al. 2011; Bingemer et al. 2012). In addition, re-analysis data
(not shown) suggested that meteorological patterns during this period favored the
southward transport of volcanic ash over Western Europe and the eastern remote Atlantic
Ocean. Therefore, the particles were identified as volcanic aerosols which can mimic
pollution (due to their sulfate content) and mineral dust aerosols (due to their coarse
mode size) (Langmann 2013). The black colored aerosols were coarse mode, absorbing
type and thus a likely mixture of aged volcanic ash and pollution. For Case III (Figure
39b), no eruptions were occurring within 48 hours prior to 13 May 2010 and winds were
not favorable for any ash transport to the Azores. However, mixtures of biomass burning
smoke from ongoing fires in Mexico and Central America and urban pollution from the
eastern United States were transported to this area.
Figure 38c shows an interesting example of how mineral dust, pollution, and
biomass burning aerosols can mix during transport. Saharan dust is rarely transported
directly from Africa to the Azores. A tropical wave formed off the West African coast
and developed into Hurricane Earl on 3 September 2010 (Figure 39c). Though the
hurricane did not make landfall in North America, it did entrain a mixture of urban

104
pollution and possible biomass burning smoke exiting off the North American mainland.
Pollution plumes were visible in Moderate Resolution Imaging Spectroradiometer
(MODIS) satellite imagery (not shown) along with reports of fires in the southeast and
central plains from the NOAA Hazard Mapping System (HMS) Fire and Smoke Product
(http://www.ospo.noaa.gov/Products/land/hms.html). As the hurricane transitioned to an
extratropical cyclone, it advected the aerosol mixture to the Azores over a two day event.
Note how the mineral dust here is less coarse than in Case I due to cloud-processing and
wet scavenging along the transport route. Hence, it is apparent that an a priori knowledge
of aerosol type and transport is extremely important especially when modeling aerosol
effects on cloud properties.
The AMF-Azores AOS was the primary platform to observe aerosol properties
during the CAP-MBL campaign. A primary advantage for including retrievals from this
platform is that the nephelometer and PSAP instruments can provide more continuous in
situ measurements especially when there are no AERONET retrievals. This study
assumes sufficient turbulence and subsidence within the boundary layer (e.g., updrafts
and downdrafts) will mix aerosols down to the surface such that they can be observed by
the AOS and AERONET platforms in real time.
Figure 40 shows the aerosol and CCN measurements for the five selected cases.
The scattering and absorption coefficients (sp and ap) are used as proxies for aerosol
loading, size, and composition and are plotted at three wavelengths on the primary y-axis.
The nephelometer-measured fine mode fraction (FMF) is the ratio of the scattering
coefficient at 550 nm for 1 m, fine mode size particles (sp550fine) to total (fine and
coarse) mode particles at the same wavelength (sp550total) and is plotted on the secondary
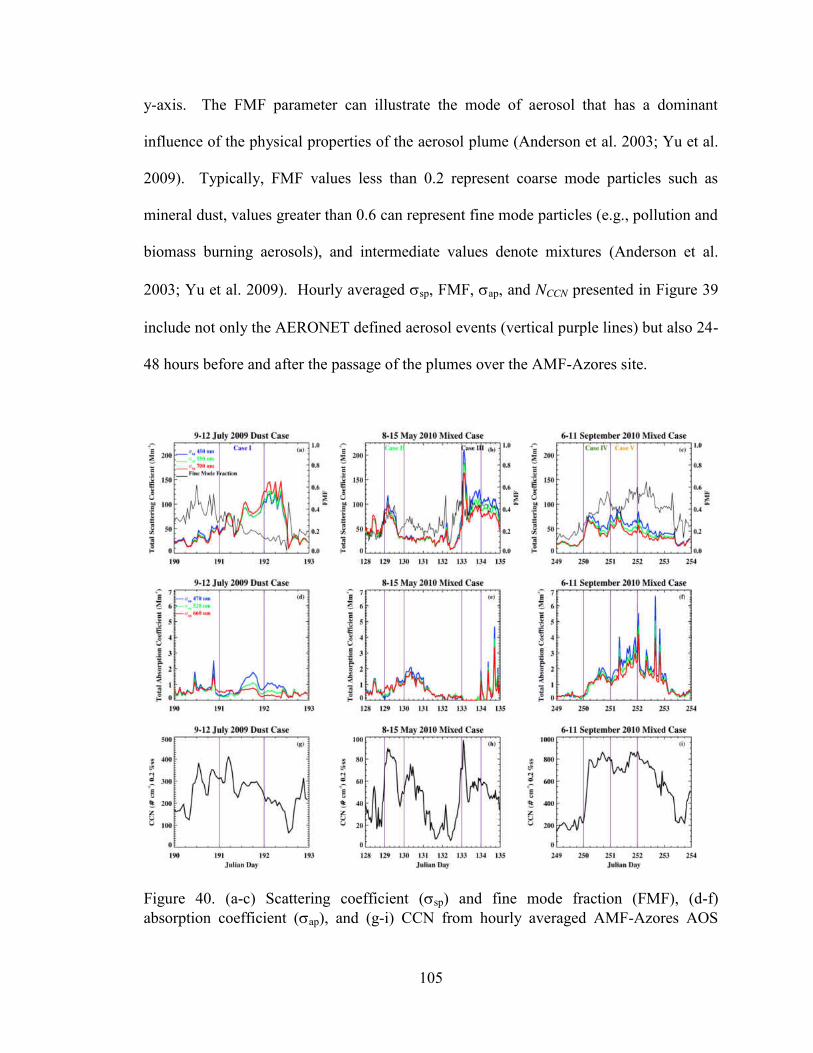
105
y-axis. The FMF parameter can illustrate the mode of aerosol that has a dominant
influence of the physical properties of the aerosol plume (Anderson et al. 2003; Yu et al.
2009). Typically, FMF values less than 0.2 represent coarse mode particles such as
mineral dust, values greater than 0.6 can represent fine mode particles (e.g., pollution and
biomass burning aerosols), and intermediate values denote mixtures (Anderson et al.
2003; Yu et al. 2009). Hourly averaged sp, FMF, ap, and NCCN presented in Figure 39
include not only the AERONET defined aerosol events (vertical purple lines) but also 24-
48 hours before and after the passage of the plumes over the AMF-Azores site.
Figure 40. (a-c) Scattering coefficient (sp) and fine mode fraction (FMF), (d-f)
absorption coefficient (ap), and (g-i) CCN from hourly averaged AMF-Azores AOS

106
observations. The AOS captured more of the aerosol events while the AERONET was
only operational at certain time intervals for each case (vertical purple lines).
For Case I, the FMF values, ranging from 0.3 to 0.4 from 0000 UTC on 10 July to
local noon, mainly indicated coarse mode aerosols. After local noon, there was a sharp
rise in sp with a corresponding decrease in FMF (< 0.2) until local noon of the next day
(11 July). The reversed spectral dependence of sp with a corresponding daily mean
AEneph value of -0.11 also suggested the presence of supermicron, coarse mode aerosols
(Logan et al. 2010). Particles that are exceptionally large (>> 1 m) will scatter more in
the longer wavelengths (red and near IR) as opposed to submicron particles that scatter
more in the shorter wavelengths (UV and blue). Mineral dust tends to absorb greatly at
the visible parts of the E-M spectrum (strong ap spectral dependence) which contrasts
with the less absorbing sea salt particles (weak ap spectral dependence) whose presence
was observed earlier in the day (Schuster et al. 2006; Chung et al. 2012; Logan et al.
2013a). There was also a strong correlation (r=0.83) between the sea salt aerosols and
NCCN (Figure 41a). Sea salt aerosols can strongly activate as CCN due to their chemical
content and hygroscopic nature. These aerosols are high in sodium chloride and sulfate
concentration as a result of oceanic minerals and organisms, respectively.
The variation of NCCN values was nearly the same as that of FMF during the three
day period such that the NCCN values fluctuated before local noon on 10 July, and then
monotonically decreased until local noon of 11 July. In this case, there was a negative
correlation (-0.5) with sp which suggested an inverse relationship between the mineral
dust particles (Figure 41b). This is likely due to factors such as insolubility of the dust
particles and the size of the particles themselves (Karydis et al. 2011). These factors can
lead to a general decrease in NCCN since insoluble particles will weakly activate as CCN

107
while large size particles can adsorb more water vapor thereby raising the amount of
supersaturation needed for activation (Karydis et al. 2011; Tao et al. 2012).
The late spring season cases, Cases II and III, had different types of aerosols and
physical characteristics as shown in Figures 40b, e, and h. Case II showed a slight sp
spectral dependence with mean AEneph of 0.26 and FMF of 0.3 which indicated coarse
mode influences similar to Case I but having no reversal of spectral dependence. The
magnitude of sp increased to nearly 110 Mm-1
during the aerosol event then decreased
after 1800 UTC to near background levels (≤ 30 Mm-1). Figure 41c shows a strong
correlation between sp and NCCN throughout the day (r=0.95). The FMF rose to 0.43
then declined below 0.20 indicating a mixture of aerosols with a strong coarse mode
contribution. Case III shared some physical characteristics of Case II (mixed aerosols)
with large sp values (~ 200 Mm-1
) indicating more aerosol loading. However, it was
influenced more by fine mode aerosols as evidenced by stronger sp spectral dependence
and greater FMF values (> 0.4). The strong correlation between sp and NCCN (r=0.77)
indicated a strong ability for these aerosols to activate as CCN (Figure 41d).
The aerosols in Cases II and III were identified as volcanic ash and pollution
particles, respectively. During volcanic eruptions, sulfur dioxide (SO2) can be emitted
into the atmosphere and converted to aqueous sulfate (SO42-
). The sulfate can either form
secondary fine mode particles or condense onto and coat the coarse mode volcanic ash
particles. In either case, both particle types will become strongly hygroscopic. Similarly,
SO2 is a main pollutant emitted in urban/industrial regions. This pollutant can be
converted into sulfate and mix with carbonaceous compounds from fossil fuel
combustion during transport to form fine mode hygroscopic pollution aerosols (Maxwell-

108
Meier et al. 2004). Therefore, it is likely that the presence of these aerosols can enhance
NCCN.
Cases IV and V showed similar spectral sp dependences with daily mean AEneph
values of 0.64 and 0.86, respectively which suggested a possible mixture of mineral dust
and pollution (Figures 40c, f, and i). The mean FMF for both cases were similar in
magnitude with daily mean values of 0.4 and 0.45, respectively. For Case IV, the sp and
FMF parameters were well correlated until 0900 UTC when the aerosol loading
decreased while the FMF continued to increase until 0000 UTC on 8 September 2010.
This pattern repeats for Case V which may suggest a diurnal dependence and will make
an interesting case for future study (Smirnov et al. 2002). The overall ap values
increased until 9 September 2010 while the spectral dependence remained moderate
throughout the aerosol event suggesting an ongoing presence of mineral dust and
pollution aerosols.
The relationship between sp, FMF, and NCCN was more complex for Cases IV
and V. Though the spectral sp dependence was moderate throughout the aerosol event,
the dependence weakened during the times of diminished FMF (≤ 0.4) on both 7 and 8
September 2010. The mean AEneph values during the morning (0000-1200 UTC) were
0.36 and 0.69 while the mean FMF values were 0.33 and 0.4 for Cases IV and V,
respectively. The corresponding NCCN trends for Cases IV and V differed in that there
was little variation in NCCN for Case IV while there was a clear decrease in NCCN for Case
V. In contrast, mean AEneph values increased to 0.95 and 1.03 for Cases IV and V,
respectively, while maximum FMF values increased to 0.56 and 0.58, respectively,
during the latter part of the day. This was followed by an increase in NCCN. Case IV had

109
a correlation of 0.51 between sp and NCCN while Case V had a negative correlation of -
0.28 (Figures 41e-f).
This suggests that the aerosol mixtures in Cases IV and V had differing effects on
NCCN possibly due to different chemical and physical properties. For example, it was
shown that an extra-tropical system transported the dust and pollution over a distance of
several thousand kilometers and a time period of 7-10 days. This is likely why the
mineral dust identified in these cases was found to be less coarse than in Case I. It is also
possible that more pollution was able to mix with and condense onto the mineral dust for
Case IV thereby enhancing the NCCN number concentration (Karydis et al. 2011). In
contrast, Case V likely had mineral dust particles that were less hygroscopic due to less
of an interaction with the pollution particles. A more detailed explanation of how
mineral dust and pollution react with one another is given in Appendix B. However,
more chemical analysis of these aerosol events is needed in future investigations. A
summary of the correlations between sp and NCCN of all selected cases is given in Figure
41.
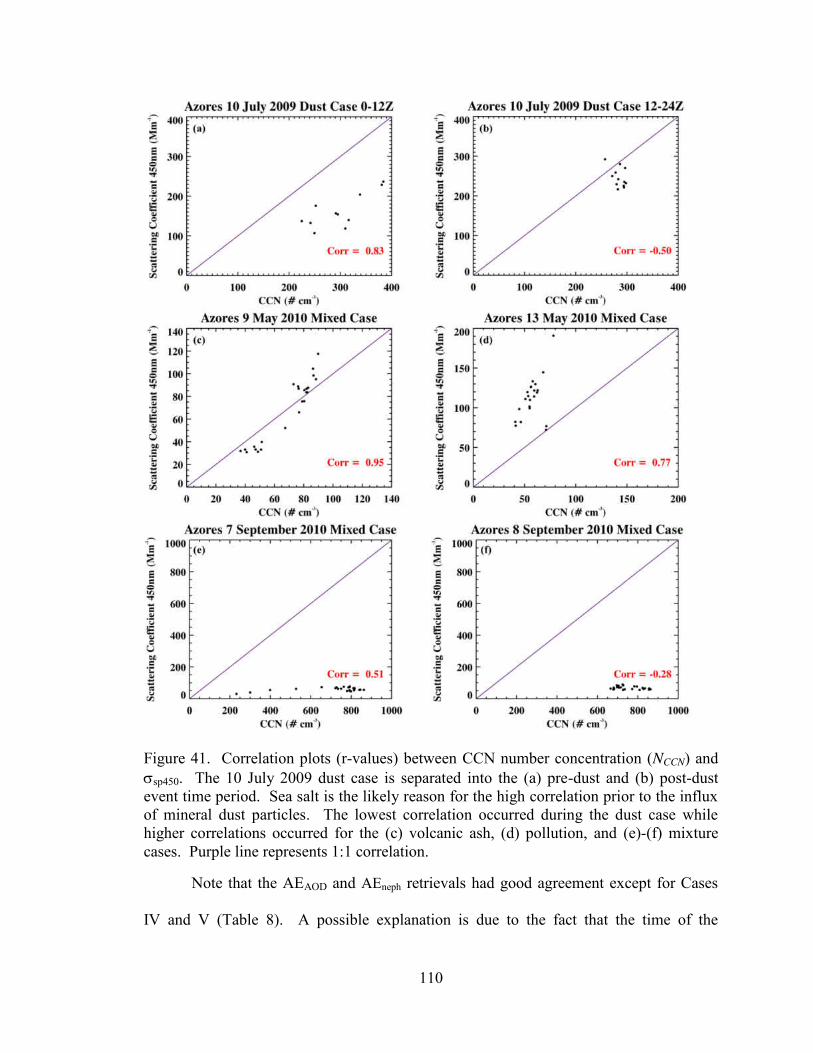
110
Figure 41. Correlation plots (r-values) between CCN number concentration (NCCN) and
sp450. The 10 July 2009 dust case is separated into the (a) pre-dust and (b) post-dust
event time period. Sea salt is the likely reason for the high correlation prior to the influx
of mineral dust particles. The lowest correlation occurred during the dust case while
higher correlations occurred for the (c) volcanic ash, (d) pollution, and (e)-(f) mixture
cases. Purple line represents 1:1 correlation.
Note that the AEAOD and AEneph retrievals had good agreement except for Cases
IV and V (Table 8). A possible explanation is due to the fact that the time of the

111
AERONET retrievals and AOS measurements do not exactly coincide with one another.
In addition, aerosols can have different properties at different altitudes and thus requires
further investigation. Hence, this can lead to both platforms sampling the same aerosol
event at different times while noting that the aerosol properties and composition may
change at any given time. For example, Case I had an AERONET retrieval time of 1800
UTC which coincided with the time when the dust plume was detected over the Azores as
given by FMF values at or below 0.2.
Similarly, Cases II and III had AERONET retrieval times that coincided with the
AOS measurements of the aerosol events. However, Case IV had an AERONET
retrieval during the evening (1900 UTC) when the FMF was greater than 0.4 while Case
V had a morning retrieval (0900 UTC) when the FMF was less than 0.4. Though both
platforms have limitations in representing aerosol events, it is still possible that they can
be used to validate one another as long as a transport mechanism that can bring aerosols
aloft to near the surface is in place. A summary of both the AERONET and AOS
retrievals of AOD, AE, and FMF are provided in Table 8.

112
Table 8. Summary of mean AOD440, Angström exponent (AE), and fine mode fraction (FMF) values for
the five selected cases at the AMF-Azores site.
AERONET AOS Nephelometer
Case AOD440 AEAOD (440-870 nm) AEneph (450-700 nm) FMF (550 nm)
I 0.52 0.25 -0.11 0.24
II 0.38 0.71 0.26 0.30
III 0.39 1.08 0.75 0.42a
IV 0.25 1.13 0.64 0.40
V 0.25 0.89 0.86 0.45 a Note the maximum FMF for this day was 0.65.

113
CHAPTER VI
CONCLUSIONS
The First Scientific Question
A classification method based upon the AEAOD and oabs parameters has been
developed to classify aerosol physico-chemical properties into four separate regions
according to their size, absorptive properties, and season. The method is first applied to
four AERONET sites, NASA Goddard, Mexico City, Solar Village, and Alta Floresta.
These sites represent respective fine mode weakly absorbing (Region I), fine mode
strongly absorbing (Region II), coarse mode strongly absorbing (Region III), and coarse
mode weakly absorbing (Region IV). Note that Region II often contains fine mode
aerosols with variable absorption. The classification method is able to illustrate the
relative contributions and seasonal dependence of aerosol types at the four selected sites
used in this study.
Four Asian AERONET sites have been selected to represent aerosol properties
reflecting biomass burning (Mukdahan), desert-urban (SACOL), pollution (Taihu), and
complex mixed particle type (Xianghe) influences. Both Xianghe and Taihu have three
identifiable seasonal variations of aerosol types reflecting the influences of local
urban/industrial emissions, biomass burning aerosols, mineral dust (Regions I-III). The
fine mode Region I aerosols are weakly absorbing (oabs < 0.07) and are observed mainly
during the summer. The fine mode Region II aerosols are strongly absorbing (oabs >
0.07) and are observed during the late autumn and winter months. During the spring, the
114
mineral dust influence is evident by more instances of coarse mode, strongly absorbing
aerosols in Region III.
SACOL has aerosol cases that occupy all four regions with the majority of the
spring cases in Region III (mineral dust) and the winter/autumn cases in Region II
(urban/industrial pollution). The weakly absorbing aerosols (oabs < 0.07) in Regions I
and IV are likely due to outside aerosol influences that mix with local mineral dust (lower
overall 440-870). The aerosols are less absorbing overall than at Xianghe and Taihu due
to fewer sources of urban and industrial pollution. The aerosol cases at Mukdahan
occupy Regions I and II similar to Xianghe and Taihu but have the highest overall 440-870
values (fine mode) and are shown to have a seasonal dependence in aerosol absorptive
properties with strongly absorbing biomass burning aerosols in the winter and weakly
absorbing biomass aerosols in the autumn.
The Second Scientific Question
Asian aerosol plumes were shown to be in various states of existence suggesting
interactions between various aerosol types during transport. The sp, AEneph and
parameters were able to infer which aerosol mode (coarse or fine) was dominant within
the plumes while HYSPLIT trajectory analysis illustrated the probable aerosol source
regions. The spectral aerosol scattering coefficients (sp) for mineral dust aerosols had
the weakest dependence and low AEneph (< 0.75) while pollution aerosols had the
strongest spectral dependences and highest AEneph values (> 1). Mixtures of mineral dust
and pollution had intermediate spectral dependences and AEneph values. According to
HYSPLIT backward trajectory analysis, we conclude that mineral dust dominated plumes
likely had origins over the Gobi desert and did not pass through highly polluted areas

115
while pollution dominated plumes had trajectories over large urban centers in Asia.
Aerosol plumes containing mixtures had source regions stemming from both desert and
urban areas.
Biomass smoke aerosols were also shown to have variable physical and chemical
properties during transport. The newly operational Grand Forks AERONET site
observed numerous biomass burning smoke plumes from wildfires in the intermountain
western states (Colorado, Utah, Idaho, Wyoming, and Montana) as well as the Pacific
states (Washington, Oregon, and California). The smoke plumes were transported by
persistent meteorological patterns that varied in strength and location throughout the
2012 warm season (26 June – 15 September). Plume transport times ranged from 24
hours to 3 days. The biomass smoke carbonaceous content was highly dependent on
mode of generation. Biomass smoke particles generated from the high temperature
flaming combustion mode had stronger spectral oabs dependences than smoke particles
generated from the low temperature smoldering combustion mode. In addition, particles
generated from the flaming combustion mode had the strongest ARF and ARFeff values,
respectively, suggesting a strong cooling effect at the surface and a warming effect aloft
during transport.
The Third Scientific Question
In addition to the seasonal variations of aerosol properties, five aerosol events
were selected at the AMF-Azores site during the 19-month CAP-MBL campaign to
demonstrate the properties of various aerosol types and their impacts on MBL NCCN
which are the precursors to cloud development and sustainability (e.g., AIE). The
116
selected aerosol events over the Azores were found to contain mixtures of mineral dust,
pollution, and biomass burning particles.
The winter months had the highest surface mean wind speed (6.7 m s-1
) which
attributed to the greatest contribution of sea salt to AOD. The low AEAOD values further
demonstrated that coarse mode aerosols were dominant. During the spring, strong wind
speeds (5.5 m s-1
) and moderate AEAOD values (0.55-0.95) suggested contributions of
coarse and fine mode aerosols (mean AOD440=0.18). Higher AEAOD combined with
decreased surface wind speeds suggested continental fine mode aerosols were the main
contributors to AOD during the warm season months (May-September).
The aerosols in Case I were identified as mineral dust aerosols with origins in the
Saharan desert. These aerosols were generally in the coarse mode, exhibited weak
spectral AOD and sp dependences, and had FMF values of 0.2 or less. However, the ap
spectral dependence was particularly strong in the visible which indicated the presence of
mineral dust as opposed to sea salt aerosols which have much weaker absorption at all
wavelengths. The NCCN values declined with increasing sp and decreasing FMF which
suggests a negative correlation between mineral dust loading and their inability to
activate as CCN. This was likely a result of the large particle size of the dust particles as
the mean AEneph decreased to negative values (-0.11).
Cases II and III exhibited differing FMF, AOD, and sp spectral dependences
which suggested two different aerosol types. The spectral dependence for Case II was
weaker than Case III while the FMF for Case II was less than for Case III which
indicated more of a coarse mode influence. Backward trajectory analysis for Case II
identified a possible source region near Iceland during the time of increased volcanic

117
activity in that area and thus these aerosols were likely coarse mode, volcanic ash
particles. Case III likely consisted of mixtures of urban/industrial pollution and biomass
burning from Central and North America. The trend in NCCN paralleled the sp and FMF
trends in both cases suggesting these aerosols had a strong capability to serve as nuclei
likely due to their respective sulfate content (Garrett and Hobbs 1995; Andreae 2009;
Langmann 2013; Seifert et al. 2011).
Cases IV and V represented an interesting case of aerosol mixtures. Both cases
had similar aerosol properties in terms of spectral dependence and FMF which were in
between those of Case I and Case III. However, Case V had a slightly larger coarse
mode volume contribution and ap spectral dependence than Case IV suggesting a
stronger mineral dust influence. Backward trajectory analysis showed influences of
urban/industrial pollution and biomass smoke from North America along with Saharan
mineral dust likely transported to the Azores by an extratropical cyclone (i.e., remnants of
Hurricane Earl). The relationship between the aerosol types and NCCN were complex in
that when the FMF decreased below 0.4, the NCCN values also decreased. This was more
evident in Case V than Case IV and was similar to Case I where mineral dust aerosols
had negative influences on NCCN.
Future Areas of Research
Many assumptions were made in addressing the physico-chemical nature, method
of transport from source to sink regions, and impacts on cloud condensation nuclei
number concentration of aerosols. In order to validate the assumptions of the chemical
nature of the aerosols inferred in this study, chemical measurements will be incorporated
into future studies concerning the physico-chemical nature of aerosols (e.g., EAST-AIRE

118
field campaign). Appendix B contains a more detailed explanation by using chemical ion
data to explain the alteration of mineral dust by pollution. For example, mineral dust that
is more associated with pollution will have more correlation with anthropogenic cationic
compounds such as potassium and ammonium (Maxwell-Meier et al. 2004).
During aerosol transport, more effort needs to be made when discerning between
local aerosol influences and influences due to long range transport. Satellite observations
generally have good global coverage with spatial resolutions up to 0.25 km x 0.25 km but
have long temporal scales in terms of observations over any given area. For example, the
MODIS-Aqua satellite has two overpasses per day over any given area. In addition,
clouds can be an issue when trying to retrieve aerosol data. In contrast, in situ
measurements have shorter temporal resolutions (e.g., seconds or minutes). However,
ground-based in situ measurements represent point sources and will not have good spatial
coverage while sub-orbital in situ measurements are performed during IOP campaigns
which occur for a short period of time. Therefore, any method to quantify aerosol
behavior would certainly need a combination of these measurement techniques to ensure
locally generated aerosols are not confused with aerosols advected from upwind source
regions (Jeong et al. 2005).
Lastly, aerosol impacts on NCCN can be further investigated by utilizing more
cloud physical properties such as re, liquid water path (LWP), and NC. The main
questions here are: (1) How are aerosols aloft becoming surface CCN? and (2) How are
cloud physical properties being impacted by these aerosol-induced changes in NCCN? The
first question was briefly touched upon by SQ3 in this dissertation. According to the
Feingold et al. (2001), (2003), and (2006) studies, the aerosol indirect effect (AIE) can be

119
predicted by the relationship between the aerosol optical depth (AOD) and cloud droplet
effective radius (re) and is given by the expression,
,ln
ln
AODd
rdAIE
e (11)
Though this relationship is shown as a total derivative, the partial derivatives are used in
order to further explore and predict aerosol-cloud interactions. Figure 42 shows the
relationship between re and sp (proxy for AOD) for the three cases addressed in SQ3.
Figure 42. The log-log AIE relationships of the cloud base retrieved re and surface
measured sp for the (a) 10 July 2009 dust case, (b) 9 May 2010 volcanic ash case, and
(c) 13 May 2010 pollution case during the CAP-MBL campaign conducted over the
Azores. The dust case in (a) is separated into green data points (sea salt) and purple data
points (mineral dust).

120
Figure 42a shows that there is an overall negative relationship between re and sp but it
seems to be more pronounced during the mineral dust time period. In other words, the
mean effective radius is lower for during the time when mineral dust is present (purple
data points) than for the time when sea salt is present (green data points). This supports
the conclusion from SQ3 that mineral dust likely has a negative impact on CCN
activation, but more cases will certainly be needed to draw any further conclusions.
During the volcanic ash and pollution cases (Figures 42b and c), higher re corresponds
with higher aerosol loading (r=0.42). However, in the pollution case, though the overall
correlation is near zero, the highest re values are weakly related with the highest aerosol
loading. It should be noted that Feingold et al. (2006) used Raman LIDAR aerosol
products and pointed out that using sp may not be appropriate due to large variability
and uncertainties in measurements. Thus, more investigation is needed in future studies.
A permanent ARM facility is currently being installed in the Azores (ENA-
Azores) at the former site used in this study. This will give a more detailed seasonal
climatology of both cloud and aerosol properties that will aid in the future study of the
AIE over this region. An additional future study will compare aerosol influences on
cloud properties over the Southern Great Plains (ARM-SGP facility) with the ENA-
Azores facility in order to further investigate the differences of AIE over continental and
marine regions.

APPENDICES

122
APPENDIX A
Calculation of Number Size Distribution
The volume size distribution (dV/dlnR) is a derived quantity from inversion
algorithms that use solar radiance retrievals (Dubovik et al. 2000) rather than direct in
situ, filter-based measurements. This causes some confusion when comparing the units
between these two types of observation platforms. The traditional in situ measurements
of size distributions are in units of some quantity per sampling volume (e.g., # m-3
).
However, AERONET size distribution retrievals are column integrated and typically
have units that denote a quantity per cross-sectional sampling area (e.g., m3 m
-2). In
addition, converting between volume (dV/dlnR) and number (dN/dlnR) distributions
raises serious concerns due to large uncertainties in AERONET retrievals involving low
aerosol loading conditions (AOD < 0.2). This is likely the reason that few studies utilize
the AERONET retrieved number size distribution (dN/dlnR).
The Dubovik et al. (2000) developed a method of calculating the dV/dlnR
parameter by using the general equation,
,lnln
2
1exp
2ln
)(2
,2
1
,
i
in
i i
inn
rrC
rd
rdR
(A1)
where n denotes a moment of size distribution (e.g., 0 for dN/dlnR and 3 for dV/dlnR), i
denotes the fine (i=1) and coarse (i=2) modes, C denotes particle concentration per cross
sectional area (e.g., square length unit) of atmospheric column (# m-2
for CN and m3
m-2
for CV), r denotes the particle radius in microns, rn,i denotes the modal radius (fine
(i=1) or coarse (i=2) modes) in microns, and is the dimensionless standard

123
deviation (Remer et al. 1998). The values for the third moment (n=3) of Eq. (A1) are
given in the AERONET data set in 22 logarithmically spaced bins of particle radii that
range from 0.05 m to 15 m. This covers the particle size spectrum from the
accumulation to the coarse mode. The dN/dlnR parameter can also be derived from the
volume size distribution (dV/dlnR) by the following equation (Dubovik et al. 2006),
,ln3
4
ln
3
Rd
dNr
Rd
dVe (A2)
where re is the AERONET retrieved effective radius of aerosol particle (in microns) in
this study rather than the radius of each individual bin (dR). The dV/dlnR parameter has
units of m3 m
-2 while dN/dlnR has units of # m
-2.
We use re in Eq. (A2) in order to quantify the column integrated contribution of
fine and coarse mode particles to aerosol number rather than the actual number of aerosol
particles. It is well known that fine mode aerosols consisting of smaller sea salt particles,
biogenic aerosols, and transported accumulation mode aerosols can all serve to dominate
aerosol loading due to their larger number concentration. Therefore, if we use the size
bin radius R rather than re, the relative contributions of both fine and coarse modes is
undoubtedly biased towards the fine mode leaving little explanation for any discernible
influences of the coarse mode particles as demonstrated in Figure A1. Figures 2b and 3b
demonstrate that the use of re can clearly represent both the coarse and fine mode
information for the different seasons.

124
Figure A1. Number size distributions for the (a) individual cases using the AERONET
bin radius R instead of the effective radius of the aerosol particle (re) as well as the (b)
yearly and seasonal means. Figures 2b and 3b using re can clearly represent both the
coarse and fine mode information for the different seasons.

125
APPENDIX B
Closure Study
The 2006 INTEX-B field campaign contained a wealth of physical and chemical
data on Asian aerosols. This section will provide a brief closure study that links the goals
of the M. S. thesis and dissertation using the chemical data of INTEX-B and aerosol
classification method of the Logan et al. (2013a) study. Figure B1 shows the chemical
ion data for all the INTEX-B flight tracks. From the plots given by Figures B1a and B1b,
the top panel shows the balance of cations and anions measured by ion chromatography.
This represents the total concentrations of continental and anthropogenic derived
compounds along the flight track over the remote Pacific Ocean.
Figure B1. Scatterplots of (a) total cation vs. total anion and (b) calcium vs. carbonate
(cation-anion difference).
The cations are given by (a) sea salt (oceanic) sources – sodium (Na+) and
magnesium (Mg2+
), (b) mineral dust (continental) sources – calcium (Ca2+
), (c) pollution
and biomass (anthropogenic) sources – potassium (K+) and ammonium (NH4
+). The

126
anions are given by (a) oceanic sources – chloride (Cl-), (b) anthropogenic sources –
nitrate (NO3-) and sulfate (SO4
2-). Their concentrations are compared to the ones taken
from an ACE-Asia investigation (Maxwell-Meier et al. 2004) where the dust events were
closer to the Asian continent. The concentration of Ca2+
in the dust plume was found to
be much lower over the remote Pacific Ocean than in the plume before it exited the Asian
continent. A 1:1 relationship shows a complete balance among the various cation and
anion tracers but the top panel shows trending more towards the cations. This is a similar
trend to the results from the ACE-Asia experiment with much higher Ca2+
concentrations
closer to the Asian continent.
An anion that was not directly measured was the carbonate (CO32-
) in the dust
plume. Acid aqueous phase aerosols (pollution) can react with the mineral dust. Calcium
carbonate (CaCO3) is the most abundant compound present in mineral dust that will
readily react with the pollution. The difference of the cation and anion concentrations
can yield the amount of carbonate to a first order approximation as other anions. For
example, silicate and organic anions should have concentrations much less than that of
carbonate. The bottom panel shows the correlation (r2-value) between Ca
2+ and the CO3
2-
of the entire field campaign. Mg2+
ions are not included in the abscissa in this study
because we did not find a strong general correlation between Mg2+
and Ca2+
over the
remote Pacific Ocean. Therefore it is suggested that the majority of Mg2+
did not have
continental origins. In fact, magnesium was shown to have a stronger correlation with
sodium than calcium throughout the campaign. From Figure B1b, 25 April 2006 was the
only day that showed no correlation between CO32-
and Ca2+
possibly due to a lack of
calcium carbonate generation during transport. The surplus of anions for that particular

127
day may be explained by that particular dust event having more than one source region
(e.g., Taklamakan Desert).
Figure B2a may also further prove the coexistence of dust and pollution. It shows
the correlation between anthropogenic cations (K+ and NH4
+) and anions (NO3
- and
SO42-
) with the trend showing a shift towards the anions. This suggests that the anions
are more associated with mineral cations (e.g., Ca2+
) other than the K+ and NH4
+. The
slopes for each flight are much greater than 1 for 5 out of 9 legs and close to 1 for other
four flights. The cases that show a slope much greater than 1 may be a result of the more
favored mineral dust and pollution reactions. The overall slope for the data in Figure B2a
was 1.25 with an intercept of 2.80 nEq m-3
. This suggested that the nitrate and sulfate
were closely associated with mineral and/or oceanic cations during INTEX-B
experiments. The correlation coefficient between Ca2+
and SO42-
/NO3- is 0.67 and there
is no correlation between Na+ (or Mg
+) and SO4
2-/NO3
-. Therefore, the analysis further
proves that mineral dust particles catalyzed the reaction during the transpacific transport.
In Figure B2b, a strong correlation exists for the sea salt tracer ions except for the 25
April 2006 flight leg. As mentioned previously, a shift away from the 1:1 linear
regression suggests multiple sources, and in this case, an overabundance of chloride
hence another source.

128
Figure B2. Scatterplots of (a) anthropogenic (pollution) cations vs. anions and (b) sea salt
ions (Na+ vs. Cl
-).
Figure B3 shows the four selected INTEX-B aerosol cases used in this
dissertation as classified by Ca2+
concentration (colored circles), AEneph, and oabs. The
Ca2+
observations are denoted as follows: in-plume (red circles), sea level (ovals), and
free troposphere (colored circles). Note that the sea level observations typically have
AEneph less than unity suggesting Ca2+
that are more associated with sea salt (e.g., Na+
and Cl-). Hence, this was the primary reason flight legs near the marine boundary layer
were not studied. The free troposphere Ca2+
observations were also not included due to
stratospheric air intrusions and possible cloud contamination which can likely lead to
biases in the data.

129
Figure B3. Aerosol classification method using Ca2+
concentration observations for (a)
Case I, (b) Case II, and (c) Cases III and IV. Circle color denotes in-plume (red), sea
level (oval), and free troposphere (multi-colored) while circle size denotes relative Ca2+
concentrations.
The 17 April 2006 case was previously identified as a dust case though some
pollution was present. Note that the in-plume Ca2+
observations have AEneph values near
or below 0.75 and are weakly absorbing (oabs < 0.07) likely suggesting that the mineral
dust aerosols in this case did not extensively react with pollution aerosols during
transport. In addition, the Ca2+
concentrations for this case were moderately correlated
(r2=0.42) with SO4
2- ions (pollution) which further supports this claim. The 24 April
2006 case is in stark contrast in that the in-plume Ca2+
observations have AEneph values
greater than 1.5 and have stronger absorption (oabs > 0.08). This likely indicates that the
mineral dust aerosols have reacted with pollution during transport and are more

130
associated with the fine mode. This is further supported by this case having the strongest
correlation of Ca2+
with SO42-
concentrations (r2=0.84). The 29 April 2006 cases consist
of Case III (red circle) and Case IV (red diamond). These cases had the highest Ca2+
,
SO42-
, and NO3- concentrations. Both cases have in-plume Ca
2+ observations with AEneph
near or less than 0.75 and oabs less than 0.07 with the exception of one observation
where oabs approaches 0.1. This is likely due to mineral dust coated with strongly
absorbing carbonaceous compounds in addition to SO42-
pollution as similar to the 24
April 2006 case. The correlations between Ca2+
and SO42-
are between Cases I and II
(r2=0.53).

131
REFERENCES
Ackerman, P. and O. B. Toon (1981), Absorption of visible radiation in atmosphere
containing mixtures of absorbing and nonabsorbing particles, Appl. Opt., 20,
3661–3668.
Ackerman, S., K. Strabala, P. Menzel, R. Frey, C. Moeller, and L. Gumley (1998),
Discriminating clear sky from clouds with MODIS, J. Geophys. Res., 103,
32,139-32,140.
Anderson, T. L., and J. A. Ogren (1998), Determining aerosol radiative properties using
the TSI 3563 Integrating Nephelometer, Aerosol Sci. Technol., 29, 57-69.
Anderson, T. L., D. S. Covert, J. D. Wheeler, J. M. Harris, K. D. Perry, B. E. Trost, D. J.
Jaffe and J. A. Ogren (1999), Aerosol backscatter fraction and single scattering
albedo: Measured values and uncertainties at a coastal station in the Pacific
Northwest, J. Geophys. Res., 104, D21, 26,793-26,807.
Anderson, T. L., S. J. Masonis, D. S. Covert, N. C. Ahlquist, S. G. Howell, A. D. Clarke,
and C. S. McNaughton (2003), Variability of aerosol optical properties derived
from in situ aircraft measurements during ACE-Asia, J. Geophys. Res., 108, D23,
8647, doi:10.1029/2002JD003247.
Andreae, M. O. (2009), Correlation between cloud condensation nuclei concentration and
aerosol optical thickness in remote and polluted regions, Atmos. Chem. Phys., 9,
543–556, www.atmos-chem-phys.net/9/543/2009/.

132
Andreae, M. O. and A. Gelencsér (2006), Black carbon or brown carbon? The nature of
light-absorbing carbonaceous aerosols, Atmos. Chem. Phys., 6, 3131–3148.
Bachmeier, A. S., R. E. Newel, M. C. Shipham, Y. Zhu, D. R. Blake, and E. V. Browell
(1996), PEM-West A: Meteorological overview, J. Geophys. Res., 101, D1, 1655-
1677.
Bergstrom, R. W., P. B. Russell, and P. Hingett (2002), Wavelength Dependence of the
Absorption of Black Carbon Particles: Predictions and Results from the TARFOX
Experiment and Implications for the Aerosol Single Scattering Albedo, J. Atmos.
Sci., 567–577.
Bergstrom, R. W., P. Pilewskie, J. Pommier, M. Rabbette, P. B. Russell, B. Schmid, J.
Redemann, A. Higurashi, T. Nakajima, and P. K. Quinn (2004), Spectral
absorption of solar radiation by aerosols during ACE-Asia, J. Geophys. Res., 109,
D19S15, doi:10.1029/2003JD004467.
Bergstrom, R. W., P. Pilewskie, P. B. Russell, J. Redemann, T. C. Bond, P. K. Quinn,
and B. Sierau (2007), Spectral absorption properties of atmospheric aerosols,
Atmos. Chem. and Phys., 7, 5937–5943.
Bi, J., J. Huang, Q. Fu, X. Wang, J. Shi, W. Zhang, Z. Huang, B. Zhang (2010), Toward
characterization of the aerosol optical properties over Loess Plateau of
Northwestern China, JQSRT, 112, 346–360, doi:10.1016/j.jqsrt.2010.09.006.
Bingemer H., et al. (2012), Atmospheric ice nuclei in the Eyjafjallajökull volcanic ash
plume, Atmos. Chem. Phys., 12, 857–867, www.atmos-chem-
phys.net/12/857/2012/ doi:10.5194/acp-12-857-2012.

133
Bond, T. C., T. L. Anderson, and D. Campbell (1999), Calibration and intercomparison
of filter-based measurements of visible light absorption by aerosols, Aerosol Sci.
Technol., 30, 6, 582-600, doi:10.1080/027868299304435.
Bond, T. C., and R. W. Bergstrom (2005), Light absorption by carbonaceous particles:
An investigative review, Aerosol Sci. Technol., 39, 1-41,
doi:10.1080/02786820500421521.
Browell, E. V., S. Ismail, and W. B. Grant (1998), Differential absorption lidar (DIAL)
measurements from air and space, Appl. Phys. B, 67, 399-410.
Chambers, L.H., B. Lin, and D.F. Young (2002), Examination of new CERES data for
evidence of tropical Iris feedback, J. Clim., 15, 3719-3726.
Chung, C. E., V. Ramanathan, and D. Decremer (2012), Observationally constrained
estimates of carbonaceous aerosol radiative forcing, P. Natl. Acad. Sci. USA, 109,
11,624-11,629.
Clarke, A. D., et al. (2004), Size distributions and mixtures of dust and black carbon
aerosol in Asian outflow: Physiochemistry and optical properties, J. Geophys.
Res., 109, D15S09, doi:10.1029/2003JD004378.
Corr, C. A., et al. (2012), Spectral absorption of biomass burning aerosol determined
from retrieved single scattering albedo during ARCTAS, Atmos. Chem. Phys., 12,
10,505–10,518, www.atmos-chem-phys.net/12/10505/2012/doi:10.5194/acp-12-
10505-2012.
Corrigan, C. E., V. Ramanathan, and J. J. Schauer (2006), Impact of monsoon transitions
on the physical and optical properties of aerosols, J. Geophys. Res., 111, D18208,
doi:10.1029/2005JD006370.

134
Dong, X., B. Xi, A. Kennedy, P. Minnis, and R. Wood (2014), A 19-month record of
marine aerosol-cloud-radiation derived from the DOE ARM AMF deployment at
the Azores: Part I: Cloud fraction and single-layered MBL cloud properties, J.
Clim, doi: 10.1175/JCLI-D-13-00553.1.
Draxler, R.R. and Rolph, G.D. (2003), HYSPLIT (Hybrid Single-Particle Lagrangian
Integrated Trajectory) Model access via NOAA ARL READY Website
(http://www.arl.noaa.gov/ready/hysplit4.html), NOAA Air Resources Laboratory,
Silver Spring, MD.
Draxler, R.R. and G.D. Rolph (2012), HYSPLIT (HYbrid Single-Particle Lagrangian
Integrated Trajectory) Model access via NOAA ARL READY Website
(http://ready.arl.noaa.gov/HYSPLIT.php). NOAA Air Resources Laboratory,
Silver Spring, MD.
Dubovik, O., A. Smirnov, B. N. Holben, T. F. Eck, M.D. King, Y. J. Kaufman, and I.
Slutsker (2000), Accuracy assessments of aerosol optical properties retrieved
from Aerosol Robotic Network (AERONET) Sun and sky radiance
measurements, J. Geophys. Res., 105, D8, 9791-9806.
Dubovik, O., and M. King (2000), A flexible inversion algorithm for retrieval of aerosol
optical properties from Sun and sky radiance measurements, J. Geophys. Res.,
105, D16, 20,673-20,696.
Dubovik, O., B. Holben, T. F. Eck, A. Smirnov, Y. J. Kaufman, M. D. King, D. Tanré,
and I. Slutsker (2002), Variability of absorption and optical properties of key
aerosol types observed in worldwide locations, J. Atmos. Sci., 59, 590-608.

135
Dubovik, O., et al. (2006), Application of spheroid models to account for aerosol particle
nonsphericity in remote sensing of desert dust, J. Geophys. Res., 111, D11208,
doi:10.1029/2005JD006619.
Eck, T. F., B. N. Holben, J. S. Reid, O. Dubovik, A. Smirnov, N. T. O’Neill, I. Slutsker,
and S. Kinne (1999), Wavelength dependence of the optical depth of biomass
burning, urban, and desert dust aerosols, J. Geophys. Res., D24, 31,333-31,349.
Eck, T. F., et al. (2005), Columnar aerosol optical properties at AERONET sites in
central eastern Asia and aerosol transport to the tropical mid-Pacific, J. Geophys.
Res., 110, D06202. doi:10.1029/2004JD005274, 2005.
Eck, T. F., et al. (2010), Climatological aspects of the optical properties of fine/coarse
mode aerosol mixtures, J. Geophys. Res., 115, D19205,
doi:10.1029/2010JD014002, 2010.
Feingold, G., L. A. Remer, J. Ramaprasad, and Y. J. Kaufman (2001), Analysis of smoke
impacts on clouds in Brazilian biomass burning regions: An extension of
Twomey’s approach, J. Geophys. Res., 106, D19, 22,907-22,922.
Feingold, G., W. L. Eberhard, D. E. Veron, and M. Previdi (2003), First measurements of
the Twomey indirect effect using ground-based remote sensors, Geophys. Res.
Lett., 30, 1287-1291.
Feingold, G., R. Furrer, P. Pilewskie, L. A. Remer, Q. Min, and J. Jonsson (2006),
Aerosol indirect effect studies at Southern Great Plains during the May 2003
Intensive Operations Period, J. Geophys. Res., 111, D05S14,
doi:10.1029/2004JD005648.

136
Fiahlo, P., et al. (2005), Absorption coefficients by aerosols in remote areas: A new
approach to decouple dust and black carbon absorption coefficients using seven
wavelength Aethalometer data, J. Aer. Sci., 36(2), 267-282.
García, O. E., et al. (2012), Shortwave radiative forcing and efficiency of key aerosol
types using AERONET data, Atmos. Chem. Phys., 12, 5129–5145, www.atmos-
chem-phys.net/12/5129/2012/doi:10.5194/acp-12-5129-2012.
Garrett, T. J., and P. V. Hobbs (1995), Long-range transport of continental aerosols over
the Atlantic Ocean and their effects on cloud structures, J. Atmos. Sci., 52(16),
2977-2984.
Gautam, R., et al. (2012), Characterization of aerosols over the Indochina peninsula from
satellite-surface observations during biomass burning pre-monsoon season,
Atmos. Environ., http://dx.doi.org/10.1016/j.atmosenv.2012.05.038.
Ge, J. M., et al. (2010), Dust aerosol optical properties retrieval and radiative forcing over
northwestern China during the 2008 China‐U.S. joint field experiment, J.
Geophys. Res., 115, D00K12, doi:10.1029/2009JD013263.
Giles, D. M., B. N. Holben, S. N. Tripathi, T. F. Eck, W. W. Newcomb, I. Slutsker, R. R.
Dickerson, A. M. Thompson, S. Mattoo, S.‐H. Wang, R. P. Singh, A. Sinyuk, and
J. S. Schafer (2010), Aerosol properties over the Indo‐Gangetic Plain: A
mesoscale perspective from the TIGERZ experiment, J. Geophys. Res., 116,
D18203, doi:10.1029/2011JD015809.
Gobbi, G. P., Y. J. Kaufman, I. Koren, and T. F. Eck (2007), Classification of aerosol
properties derived from AERONET direct sun data, Atmos. Chem. Phys., 7, 453-
458.
137
Gyawali, M., et al. (2009), In situ aerosol optics in Reno, NV, USA during and after the
summer 2008 California wildfires and the influence of absorbing and non-
absorbing organic coatings on spectral light absorption, Atmos. Chem. Phys., 9,
8007–8015, www.atmos-chem-phys.net/9/8007/2009/.
Hansen, J. and Sato M (2001), Trends of measured climate forcing agents,
http://pubs.giss.nasa.gov/docs/2001/2001_Hansen_Sato.pdf.
Higurashi, A., and T. Nakajima (2002), Detection of aerosol types over the East China
Sea near Japan from four-channel satellite data, Geophys. Res. Let., 29(17), 1836,
doi:10.1029/2002GL015357.
Holben, B. N., T. F. Eck, I. Slutsker, D. Tanré, J. P. Buis, A. Setzer, E. Vermote, J. A.
Reagan, Y. J. Kaufman, T. Nakajima, F. Lavenu, I. Jankowiak, and A. Smirnov
(1998), AERONET – A federated instrument network and data archive for aerosol
characterization, Rem. Sens. Environ., 66, 1–16.
Holben, B. N., T. F. Eck, I. Slutsker, A. Smirnov, A. Sinyuk, A. J. Schafer, D. Giles, and
O. Dubovik (2006), AERONET’s version 2.0 quality assurance criteria, Remote
Sensing of Atmosphere and Clouds, Proc. SPIE Int. Soc. Opt. Eng., 6408,
64080Q, doi:10.1117/12.706524.
Huang, J. P., et al. (2008a), Long-range transport and vertical structure of Asian dust
from CALIPSO and surface measurements during PACDEX, J. Geophys. Res.,
113, D23212, doi:10.1029/2008JD010620, 2008a.
Huang, J. P., et al. (2008b), An overview of the semi-arid climate and environment
research observatory over the Loess Plateau, Adv. Atmos. Sci., 25(6), 906–921,
doi: 10.1007/s00376-008-0906-7.

138
Hudson, J. G. and S. N. Noble (2013), CCN and vertical velocity influences on droplet
concentrations and supersaturations in clean and polluted stratus clouds, J. Atmos.
Sci., 71(1), 312-331, doi: 10.1175/JAS-D-13-086.1.
Huebert, B. J., T. Bates, P. B. Russell, G. Shi., Y. J. Kim, K. Kawamura, G. Carmichael,
and T. Nakajima (2003), An overview of ACE-Asia: Strategies for quantifying
the relationships between Asian aerosols and their climatic impacts, J. Geophys.
Res., 108, D23, doi:10.1029/2003JD003550.
Husar, R. B., et al. (2001), Asian dust events of April 1998, J. Geophys. Res., 106,
18,317-18,330.
Ignatov, A., P. Minnis, N. Loeb, B. Wielicki, W. Miller, S. Sun-Mack, D. Tanré, L.
Remer, I. Laszlo, and E. Geier (2005), Two MODIS Aerosol Products over Ocean
on the Terra and Aqua CERES SSF Datasets, J. Atmos. Sci., 62, 1008-1031.
Intergovernmental Panel on Climate Change (2001), Climate Change 2001: The
Scientific Basis, Contribution of Working Group I to the Third Assessment
Report of the Intergovernmental Panel on Climate Change, edited by J. T.
Houghton et al., Cambridge Univ. Press, New York, 881 pp.
Intergovernmental Panel on Climate Change (2007), Climate Change 2007: The Physical
Science Basis. Contribution of Working Group I to the Fourth Assessment Report
of the Intergovernmental Panel on Climate Change, edited by Solomon, S., D.
Qin, M. Manning, Z. Chen, M. Marquis, K.B. Avery, M. Tignor and H.L. Miller,
Cambridge Univ. Press, New York, 996 pp.

139
Jacob, D. J., J. H. Crawford, M. M. Kleb, V. S. Connors, R. J. Bendura, J. L. Raper, G.
W. Sachse, J. C. Gille, L. Emmons, and C. L. Heald (2003), Transport and
Chemical Evolution over the Pacific (TRACE-P) aircraft mission: Design,
execution, and first results, J. Geophys. Res., 108, 9000,
doi:10.1029/2002JD003276.
Jefferson, A. (2010), Empirical estimates of CCN from aerosol optical properties at four
remote sites, Atmos. Chem. Phys., 10, www.atmos-chem-phys.net/10/6855/2010/
doi:10.5194/acp-10-6855-2010, 6855-6861.
Jefferson, A. (2011), Aerosol Observing System (AOS) Handbook, ARM-TR-014.
Jeong, M.-J. and Z. Li (2005), Quality, compatibility, and synergy analyses of global
aerosol products derived from the advanced very high resolution radiometer and
Total Ozone Mapping Spectrometer, J. Geophys. Res., 110, D10S08,
doi:10.1029/2004JD004647.
Jin, M. S., W. Kessomkiat, and G. Pereira (2011), Satellite-Observed Urbanization
Characters in Shanghai, China: Aerosols, Urban Heat Island Effect, and Land-
Atmosphere Interactions, Rem. Sens., 3, 83-99, doi:10.3390/rs3010083.
Jordan, C. E., J. E. Dibb, B. E. Anderson, and H. E. Fuelberg (2003), Uptake of nitrate
and sulfate on dust aerosols during TRACE-P, J. Geophys. Res., 108(D21), 8817,
doi:10.1029/2002JD003101.
Kalnay, E., et al. (1996), The NCEP/NCAR re-analysis 40-year project, Bull. Amer.
Meteor. Soc., 77, 437-471.

140
Karydis, V. A., P. Kumar, D. Barahona, I. N. Sokolik, and A. Nenes (2011), On the effect
of dust particles on global cloud condensation nuclei and cloud droplet number, J.
Geophys. Res., 116, D23204, doi:10.1029/2011JD016283.
Kato, S., et al. (2010), Relationships among cloud occurrence frequency, overlap, and
effective thickness derived from CALIPSO and CloudSat merged cloud vertical
profiles, J. Geophys. Res., 115, D00H28, doi:10.1029/2009JD012277.
Kim, B.-G., S. E. Schwartz, M. A. Miller, and Q. Min (2003), Effective radius of cloud
droplets by ground-based remote sensing: Relationship to aerosol. J. Geophys.
Res., 108, D23, 4740-4758, doi:10.1029/2003JD003721.
Kim, M.-H., et al. (2013), Comparison of aerosol optical depth between CALIOP and
MODIS-Aqua for CALIOP aerosol subtypes over the ocean, J. Geophys. Res.,
118, 13,241–13,252, doi:10.1002/2013JD019527.
Kondo, Y., et al. (2011), Emissions of black carbon, organic, and inorganic aerosols from
biomass burning in North America and Asia in 2008, J. Geophys. Res., 116,
D08204, doi:10.1029/2010JD015152.
Koven, C. D. and I. Fung (2006), Inferring dust composition from wavelength-dependent
absorption in Aerosol Robotic Network (AERONET) data, J. Geophys. Res., 111,
D14205, doi:10.1029/2005JD006678.
Lack, D. A., and C. D. Cappa (2010), Impact of brown and clear carbon on light
absorption enhancement, single scatter albedo and absorption wavelength
dependence of black carbon, Atmos. Chem. Phys., 10, 4207–4220.
doi:10.5194/acp-10-4207-2010.

141
Lack, D. A., et al. (2008), Bias in filter-based aerosol light absorption measurements due
to organic aerosol loading: Evidence from ambient measurements, Aer. Sci. Tech.,
42(12), 1033-1041, doi:10.1080/02786820802389277.
Langmann, B. (2013), Volcanic ash versus mineral dust: Atmospheric processing and
environmental and climate impacts, ISRN Atmospheric Sciences, 245076, 1-17,
http://dx.doi.org/10.1155/2013/245076.
Leaitch, W. R., et al. (2009), Evidence for Asian dust effects from aerosol plume
measurements during INTEX-B 2006 near Whistler, BC, Atmos. Chem. Phys., 9,
3523-3546, 2009.
Lewis, K., W. P. Arnott, H. Moosmüller, and C. E. Wold (2008), Strong spectral
variation of biomass smoke light absorption and single scattering albedo observed
with a novel dual-wavelength photoacoustic instrument, J. Geophys. Res., 113,
D16203. doi:10.1029/2007JD009699.
Li, Z., X. Xia, M. Cribb, W. Mi, B. Holben, P. Wang, H. Chen, S.-C. Tsay, T. Eck, F.
Zhao, E. Dutton, and R. Dickerson (2007a), Aerosol optical properties and its
radiative effects in Northern China, J. Geophys. Res., 112, D22S01,
doi:10.1029/2006JD007382.
Li, Z., H. Chen, M. Cribb, R. Dickerson, B. Holben, C. Li, D. Lu, Y. Luo, H. Maring, and
G. Shi (2007b), Preface to special section on East Asian Studies of Tropospheric
Aerosols: An International Regional Experiment (EAST-AIRE), J. Geophys. Res,
112(D22), D22S00, doi:10.1029/2007JD008853.

142
Li, Z., F. Niu, J. Fan, Y. Liu, D. Rosenfeld, and Y. Ding (2011), Long-term impacts of
aerosols on the vertical development of clouds and precipitation, Nat. Geosci., 4,
doi: 10.1038/NGEO1313.
Ling, X.-L., et al. (2011), A case study of a typical dust storm event over the Loess
Plateau of Northwest China, Atmos. Oceanic Sci. Lett., 4, 344–348.
Liu, X., et al. (2005), Global modeling of aerosol dynamics: Model description,
evaluation, and interactions between sulfate and nonsulfate aerosols, J. Geophys.
Res., 110, D18206, doi:10.1029/2004JD005674.
Loeb, N. G., N. Manalo-Smith, S. Kato, W. F. Miller, S. K. Gupta, P. Minnis, and B. A.
Wielicki (2003), Angular distribution models for top-of-atmosphere radiative flux
estimation from CERES instrument on the TRMM satellite, Part I: Methodology,
J. Appl. Meteor., 42, 240-265.
Logan, T., B. Xi, X. Dong, R. Obrecht, Z. Li, and M. Cribb (2010), A study of Asian dust
plumes using satellite, surface, and aircraft measurements during the INTEX-B
field experiment, J. Geophys. Res., 115, D00K25.
Logan, T., B. Xi, X. Dong, Z. Li, and M. Cribb (2013a), Classification and investigation
of Asian aerosol properties, Atmos. Chem. Phys., 13, 2253-2265, www.atmos-
chem-phys.net/13/2253/2013/doi:10.5194/acp-13-2253-2013.
Logan, T., B. Xi, and X. Dong (2013b), A Comparison of the Mineral Dust Absorptive
Properties from Two Asian Dust Events, Atmosphere, 4(1), 1-16;
doi:10.3390/atmos4010001.
143
Logan, T., B. Xi, and X. Dong (2013c), Biomass Burning Aerosol Properties over the
Northern Great Plains during the 2012 Warm Season, Atmos. Chem. Phys.
Discuss., 13, 32,269–32,289, www.atmos-chem-phys-
discuss.net/13/32269/2013/doi:10.5194/acpd-13-32269-2013.
Logan, T., B. Xi, and X. Dong (2014), Aerosol properties and their influences on marine
boundary layer cloud condensation nuclei at the ARM mobile facility over the
Azores, J. Geophys. Res., 119, doi:10.1002/2013JD021288.
Mack, L. A., et al. (2010), Optical closure experiments for biomass smoke aerosols,
Atmos. Chem. Phys., 10, 9017–9026, www.atmos-chem-phys.net/10/9017/2010/
doi:10.5194/acp-10-9017-2010.
Martins, J. V., et al. (1998a), Effects of black carbon content, particle size, and mixing on
light absorption by aerosols from biomass burning in Brazil, J. Geophys. Res.,
103, D4, 32,041-32,050.
Martins, J. V., et al. (1998b), Sphericity and morphology of smoke particles from
biomass burning in Brazil, J. Geophys. Res., 103, D4, 32,051-32,057.
Martins, J., D. Tanré, L. Remer, Y. Kaufman, S. Mattoo, and R. Levy (2002), MODIS
cloud screening for remote sensing of aerosols over oceans using spatial
variability, Geophys. Res. Lett., 29, 8009, doi:10.1029/2001GL013252.
Matthews, G., K. Priestley, P. Spence, D. Cooper and D. Walikainen (2005),
Compensation for spectral darkening of short wave optics occurring on the
Cloud’s and the Earth’s Radiant Energy System, Earth Observing Systems X
(Proc. SPIE), 588212.
144
Maxwell-Meier, K., R. Weber, C. Song, D. Orsini, Y. Ma, G. R. Carmichael, and D. G.
Streets (2004), Inorganic composition of fine particles in mixed mineral dust–
pollution plumes observed from airborne measurements during ACE-Asia, J.
Geophys. Res., 109, D19S07, doi:10.1029/2003JD004464.
McNaughton, C. S., et al. (2009), Observations of heterogeneous reactions between
Asian pollution and mineral dust over the Eastern North Pacific during INTEX-B,
Atmos. Chem. Phys. Discuss., 9, 8469–8539, 2009, http://www.atmos-chem-phys-
discuss.net/9/8469/2009/.
Meng, Z., et al. (2010), Single-scattering properties of tri-axial ellipsoidal mineral dust
aerosols: A database for application to radiative transfer calculations, J. Aer. Sci.,
41, 501–512.
Murayama, T., N. Sugimoto, I. Uno, K. Kinoshita, K. Aoki, N. Hagiwara, Z. Liu, I.
Matsui, T. Sakai, T. Shibata, K. Arao, B.-J. Sohn, J.-G. Won, S.-C. Yoon, T. Li, J.
Zhou, H. Hu, M. Abo, K. Iokibe, R. Koga, and Y. Iwasaka (2001), Ground-based
network observation of Asian dust events of April 1998 in East Asia, J. Geophys.
Res., 106, D16, 18,345-18,359.
Osborne, S. R. and J. M. Haywood (2005), Aircraft observations of the microphysical
and optical properties of major aerosol species, Atmos. Res., 73, 173-201.
Owen, R. C., O. R. Cooper, A. Stohl, and R. E. Honrath (2006), An analysis of the
mechanisms of North American pollutant transport to the central North Atlantic
lower free troposphere, J. Geophys. Res., 111, D23S58,
doi:10.1029/2006JD007062.
145
Pan, L., et al. (2010), Aerosol optical properties based on ground measurements over the
Chinese Yangtze Delta Region, Atmos. Environ., 44, 2587-2596.
Pathak, R. K., W. S. Wu, and T. Wang (2009), Summertime PM2.5 ionic species in four
major cities of China: nitrate formation in an ammonia-deficient atmosphere,
Atmos. Chem. Phys., 9, 1711–1722, www.atmos-chem-phys.net/9/1711/2009/.
Pope, C. A. (2004), Air pollution and health – good news and bad, N. Engl. J. Med.,
351(11), 1132-4.
Qiu, J. H., and J. Sun (1994), Optical remote sensing of the dust storm and the analysis,
Chin. J. Atmos. Sci., 18, 1-10.
Qiu, Y.-J., et al. (2013), Effects of Clouds and Aerosols on Surface Radiation Budget
Inferred from DOE AMF at Shouxian, China, Atmos. Oceanic. Sci. Lett., 6(1), 1-
5.
Qu, W.J., X. Y. Zhang, R. Arimoto, D. Wang, Y. Q. Wang, L. W. Yan, and Y. Li (2008),
Chemical composition of the background aerosol at two sites in southwestern and
northwestern China: potential influences of regional transport, Tellus, 60B, 657-
673.
Ramanathan, V., P. J. Crutzen, J. T. Kiehl, D. Rosenfeld (2001), Aerosols, Climate, and
the Hydrological Cycle, Science, 294, 2119, doi: 10.1126/science.
Reid, J. S. and P. V. Hobbs (1998), Physical and optical properties of young smoke from
individual biomass fires in Brazil, J. Geophys. Res., 103, 32,013-32,030.
Reid, J. S., et al. (1998), Physical, chemical, and optical properties of regional hazes
dominated by smoke in Brazil, J. Geophys. Res., 103, 32,059-32,080.
146
Reid, J. S., et al. (1999), Use of the Angström exponent to estimate the variability of
optical and physical properties of aging smoke particles in Brazil, J. Geophys.
Res., 104, D22. 27,473-27,489.
Remer, L. A., et al. (1998), Biomass burning aerosol size distribution and modeled
optical properties, J. Geophys. Res., 103, D24, 31,879-31,891.
Remer, L., Y. Kaufman, D. Tanré, S. Mattoo, S. Chu, J. Martins, R.-R. Li, C. Ichoku, R.
Levy, R. Kleidman, T. Eck, E. Vermote, and B. Holben (2005), The MODIS
aerosols algorithm, products, and validation, J. Atmos. Sci., 62, 947-973.
Rémillard, J., P. Kollias, E. Luke, and R. Wood (2012), Marine boundary layer cloud
observations in the Azores, J. Climate, 25, doi: 10.1175/JCLI-D-11-00610.1,
7381-7398.
Robock, A. (1998), Enhancement of surface cooling due to forest fire smoke, Science,
242, 911-913.
Rolph, G.D. (2012), Real-time Environmental Applications and Display sYstem
(READY) Website (http://ready.arl.noaa.gov). NOAA Air Resources Laboratory,
Silver Spring, MD.
Rosenfeld, D., U. Lohmann, G. B. Raga, C. D. O’Dowd, M. Kulmala, S. Fuzzi, A.
Reissell, and M. O. Andreae (2008), Flood or drought: How do aerosols affect
precipitation? Science, 321, 1309-1313, doi:10.1126/science.1160606.
Russell, P. B., et al. (2010), Absorption Angström Exponent in AERONET and related
data as an indicator of aerosol composition, Atmos. Chem. and Phys., 10, 1155–
1169, www.atmos-chem-phys.net/10/1155/2010/.
147
Saleh, R., et al. (2013), Absorptivity of brown carbon in fresh and photo-chemically aged
biomass-burning emissions, Atmos. Chem. Phys., 13, 7683–7693, www.atmos-
chem-phys.net/13/7683/2013/doi:10.5194/acp-13-7683-2013.
Schuster, G. L., et al. (2005), Inferring black carbon content and specific absorption from
Aerosol Robotic Network (AERONET) aerosol retrievals, J. Geophys. Res., 110,
D10S17. doi:10.1029/2004JD004548.
Schuster, G. L., O. Dubovik, and B. N. Holben (2006), Angstrom exponent and bimodal
aerosol size distributions, J. Geophys. Res., 111, D07207,
doi:10.1029/2005JD006328.
Seifert, P., et al. (2011), Ice formation in ash‐influenced clouds after the eruption of the
Eyjafjallajökull volcano in April 2010, J. Geophys. Res., 116, D00U04,
doi:10.1029/2011JD015702.
Singh, H. B., W. H. Brune, J. H. Crawford, H. Fuelberg, and D. J. Jacob (2006), The
Intercontinental Chemical Transport Experiment – Phase B (INTEX-B): An
update. [Available online at
http://avdc.gsfc.nasa.gov/Documentation/Validation_Plan/PDF/
INTEXB_WhitePaper.pdf.]
Smirnov, A., B. N. Holben, O. Dubovik, N. T. O’Neill, T. F. Eck, D. L. Westphal, A. K.
Goroch, C. Pietras, and I. Slutsker (2002), Atmospheric aerosol optical properties
in the Persian Gulf, J. Atmos. Sci., 59, 620-634.
Sun, J., M. Zhang, and T. Liu (2001), Spatial and temporal characteristics of dust storms
in China and its surrounding regions, 1960-1999: Relations to source area and
climate, J. Geophys. Res., 106, 10,325-10,333.
148
Sun, Y., et al. (2005), Chemical composition of dust storms in Beijing and implications
for the mixing of mineral aerosol with pollution aerosol on the pathway, J.
Geophys. Res., 110, D24209, doi:10.1029/2005JD006054.
Takemura, T., et al. (2002), Single-Scattering Albedo and Radiative Forcing of Various
Aerosol Species with a Global Three-Dimensional Model, J. Clim., 15(4), 333-
352.
Tanré, D., Y. Kaufman, M. Herman, and S. Matoo (1997), Remote sensing of aerosol
properties over oceans using the MODIS/EOS spectral radiances, J. Geophys.
Res., 102, 16,971-16,988.
Tanré, D., Y. J. Kaufman, B. N. Holben, B. Chatenet, A. Karnieli, F. Lavenu, L. Blarel,
O. Dubovik, L. A. Remer, and A. Smirnov (2001), Climatology of dust aerosol
size distribution and optical properties derived from remotely sensed data in the
solar spectrum, J. Geophys. Res., 106, D16, 18,205-18,217.
Tao, W.-K., J.-P. Chen, Z. Li, C. Wang, and C. Zhang (2012), Impact of aerosols on
convective clouds and precipitation, Rev. Geophys., 50, RG2001,
doi:10.1029/2011RG000369.
Tsunematsu, N., K. Kenji, T. Matsumoto (2005), The Influence of Synoptic-Scale Air
Flow and Local Circulation on the Dust Layer Height in the North of the
Taklimakan Desert, Water, Air, and Soil Pollution, 5, 175-193.
Uematsu, M, R. A. Duce, J. M. Prospero, L. Chen, J. T. Merrill, and R. L. McDonald
(1983), Transport of mineral aerosol from Asia over the North Pacific Ocean, J.
Geophys. Res., 88, C9, 5343-5352.
149
Val Martin, M., R. E. Honrath, R. C. Owen, G. Pfister, P. Fiahlo, and F. Barata (2013),
Significant enhancements of nitrogen oxides, black carbon, and ozone in the
North Atlantic lower free troposphere resulting from North American boreal
wildfires, J. Geophys. Res., 111, D23S60, doi:10.1029/2006JD007530.
Virkkula, A., et al. (2005), Modification, Calibration and a Field Test of an Instrument
for Measuring Light Absorption by Particles, Aerosol Sci. and Tech., 39, 68-83.
Virkkula, A. (2010), Correction of the calibration of the 3-wavelength Particle Soot
Absorption Photometer (PSAP), Aerosol Sci. Tech., 44, 706-712.
Wang, X., et al. (2010), Surface measurements of aerosol properties over northwest
China during ARM China 2008 deployment, J. Geophys. Res., 115, D00K27,
doi:10.1029/2009JD013467.
Wang, Y., et al. (2011), Seasonal variations in aerosol optical properties over China, J.
Geophys. Res., 116, D18209, doi:10.1029/2010JD015376.
Wielicki, B. A., B. R. Barkstrom, E. F. Harrison, R. B. Lee III, G. L. Smith, and J. E.
Cooper (1996), Clouds and the Earth’s Radiant Energy System (CERES): An
Earth Observing System Experiment, Bull. Amer. Meteor. Soc., 77, 853-868.
Winker, D. M., et al. (2007), Initial performance assessment of CALIOP, Geophys. Res.
Lett., 34(19), L19803, doi:10.1029/2007GL030135.
Wood, R., et al. (2014), Clouds, aerosol, and precipitation in the marine boundary layer:
An ARM mobile facility deployment. Accepted by Bull. Amer. Meteor. Soc.
Xin, J., et al. (2007), Aerosol optical depth (AOD) and Ǻngström exponent of aerosols
observed by the Chinese Sun Hazemeter Network from August 2004 to
September 2005, J. Geophys. Res., 112, D05203. doi:10.1029/2006JD007075.

150
Yang, Y. Q., et al. (2008), Sand/dust storm processes in Northeast Asia and associated
large-scale circulations, Atmos. Chem. Phys., 8, 25–33, www.atmos-chem-
phys.net/8/25/2008/.
Yang, M., et al. (2009), Attribution of aerosol light absorption to black carbon, brown
carbon, and dust in China – interpretations of atmospheric measurements during
EAST-AIRE, Atmos. Chem. Phys., 9, 2035–2050, www.atmos-chem-
phys.net/9/2035/2009/.
Yao, X., et al. (2002), The water-soluble ionic composition of PM2.5 in Shanghai and
Beijing, China, Atmos. Environ., 36, 4223–4234.
Yi, B. et al. (2011), Radiative transfer simulation of dust-like aerosols: Uncertainties
from particle shape and refractive index, J. Aer. Sci., 42, 631–644.
Yoon, Y. J., et al. (2007), Seasonal characteristics of the physicochemical properties of
North Atlantic marine atmospheric aerosols, J. Geophys. Res., 112, D04206,
doi:10.1029/2005JD007044.
Yu, H., M. Chin, L. A. Remer, R. G. Kleidman, N. Bellouin, H. Bian, and T. Diehl
(2009), Variability of marine aerosol fine-mode fraction and estimates of
anthropogenic aerosol component over cloud-free oceans from the Moderate
Resolution Imaging Spectroradiometer (MODIS), J. Geophys. Res., 114, D10206,
doi:10.1029/2008JD010648.
Zheng, M., et al. (2005), Seasonal trends in PM2.5 source contributions in Beijing,
China, Atmos. Environ., 39, 3967–3976.